| 3.8.0及以上版本 |
SCADA(Supervisory Control And Data Acquisition)是用于管理自动化过程的复杂软件系统,可实时采集并处理数据。
基于ThingsBoard实现了Swimming Pool SCADA系统模板,用于监测与控制游泳池组件。 本地网络中的传感器数据通过Modbus协议采集并发送至IoT Gateway。Gateway通过MQTT协议与ThingsBoard通信,确保设备持续连接并向SCADA系统传输数据。 ThingsBoard作为SCADA系统核心,将设备数据存储于数据库、进行处理、可视化信息并向设备发送控制命令。
要了解Swimming Pool SCADA系统模板的工作方式,请先安装。
安装解决方案模板
您需要ThingsBoard专业版访问权限。最简单的方式是使用ThingsBoard Cloud。 也可按安装指南自行安装。
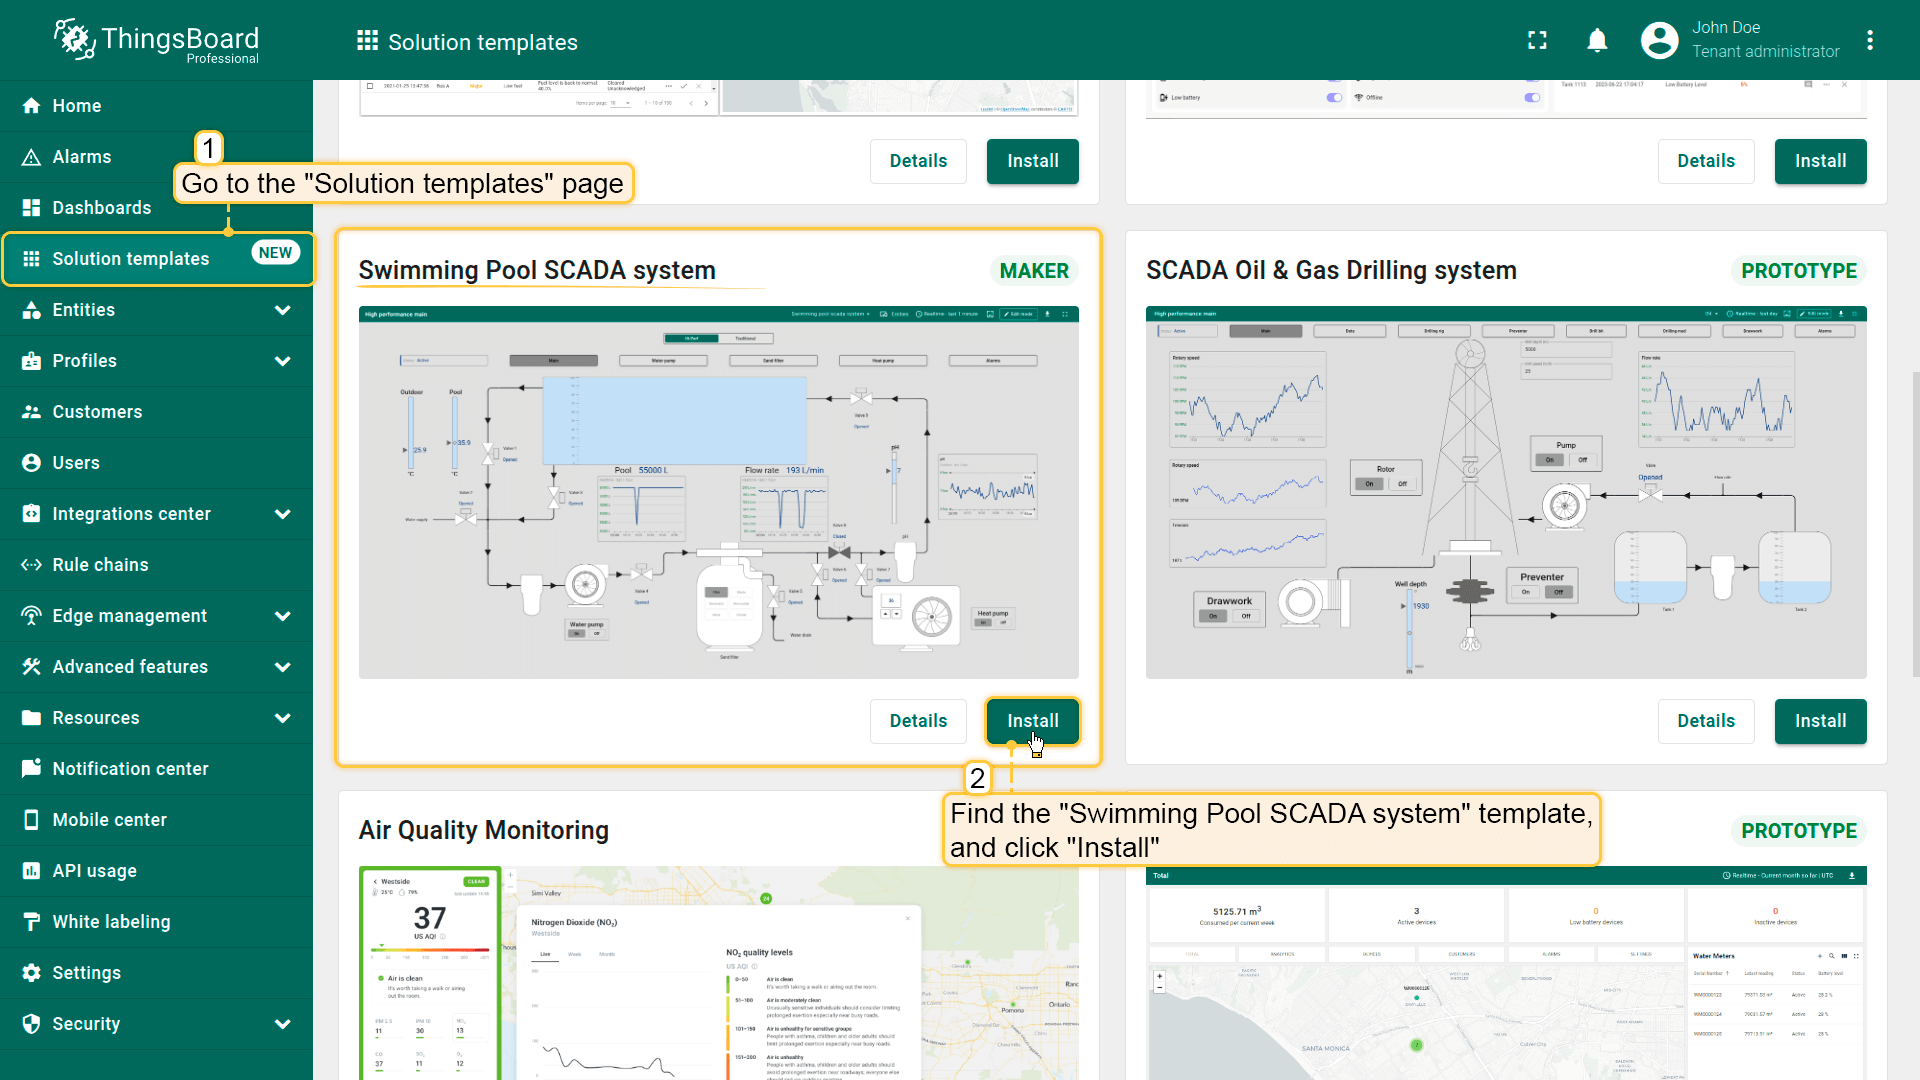
- 进入“Solution templates”页面,找到“Swimming Pool SCADA system”并点击“Install”开始安装。
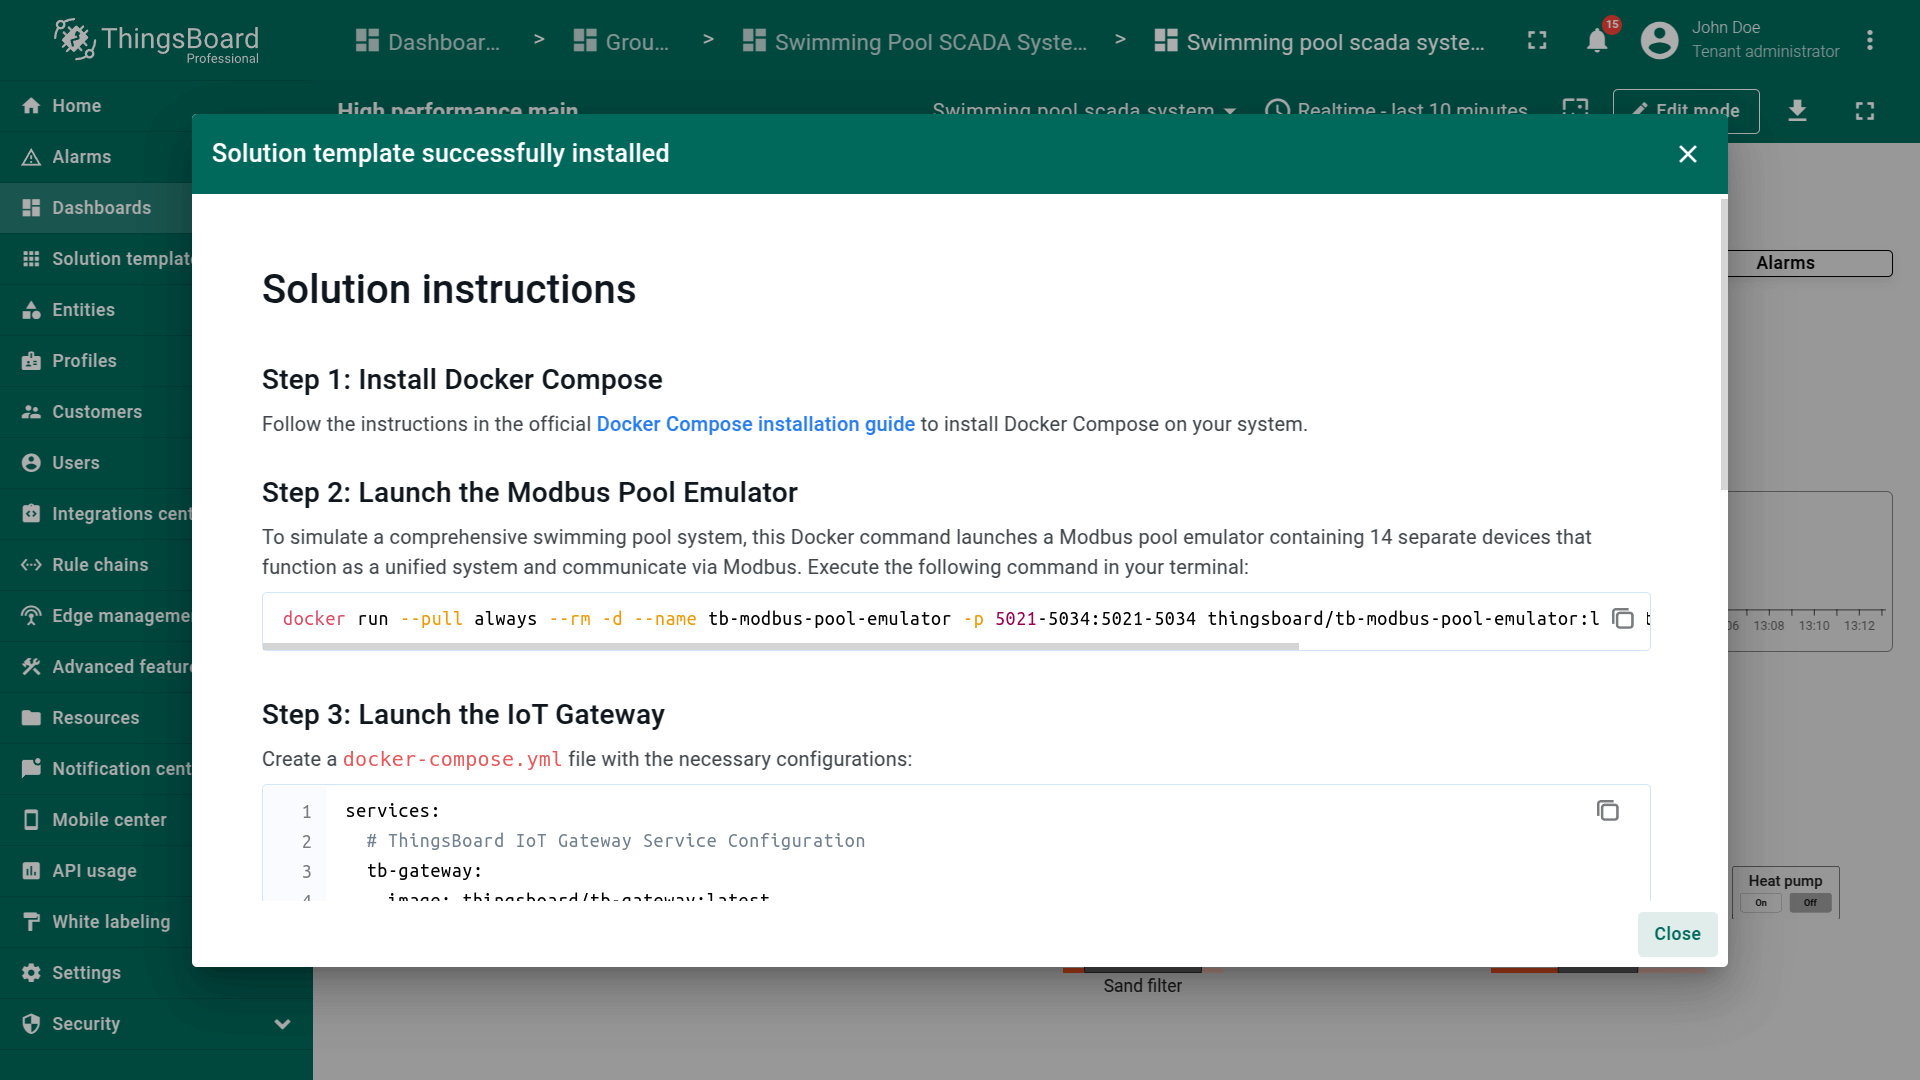
- 将提供该解决方案的配置说明,请按步骤操作。
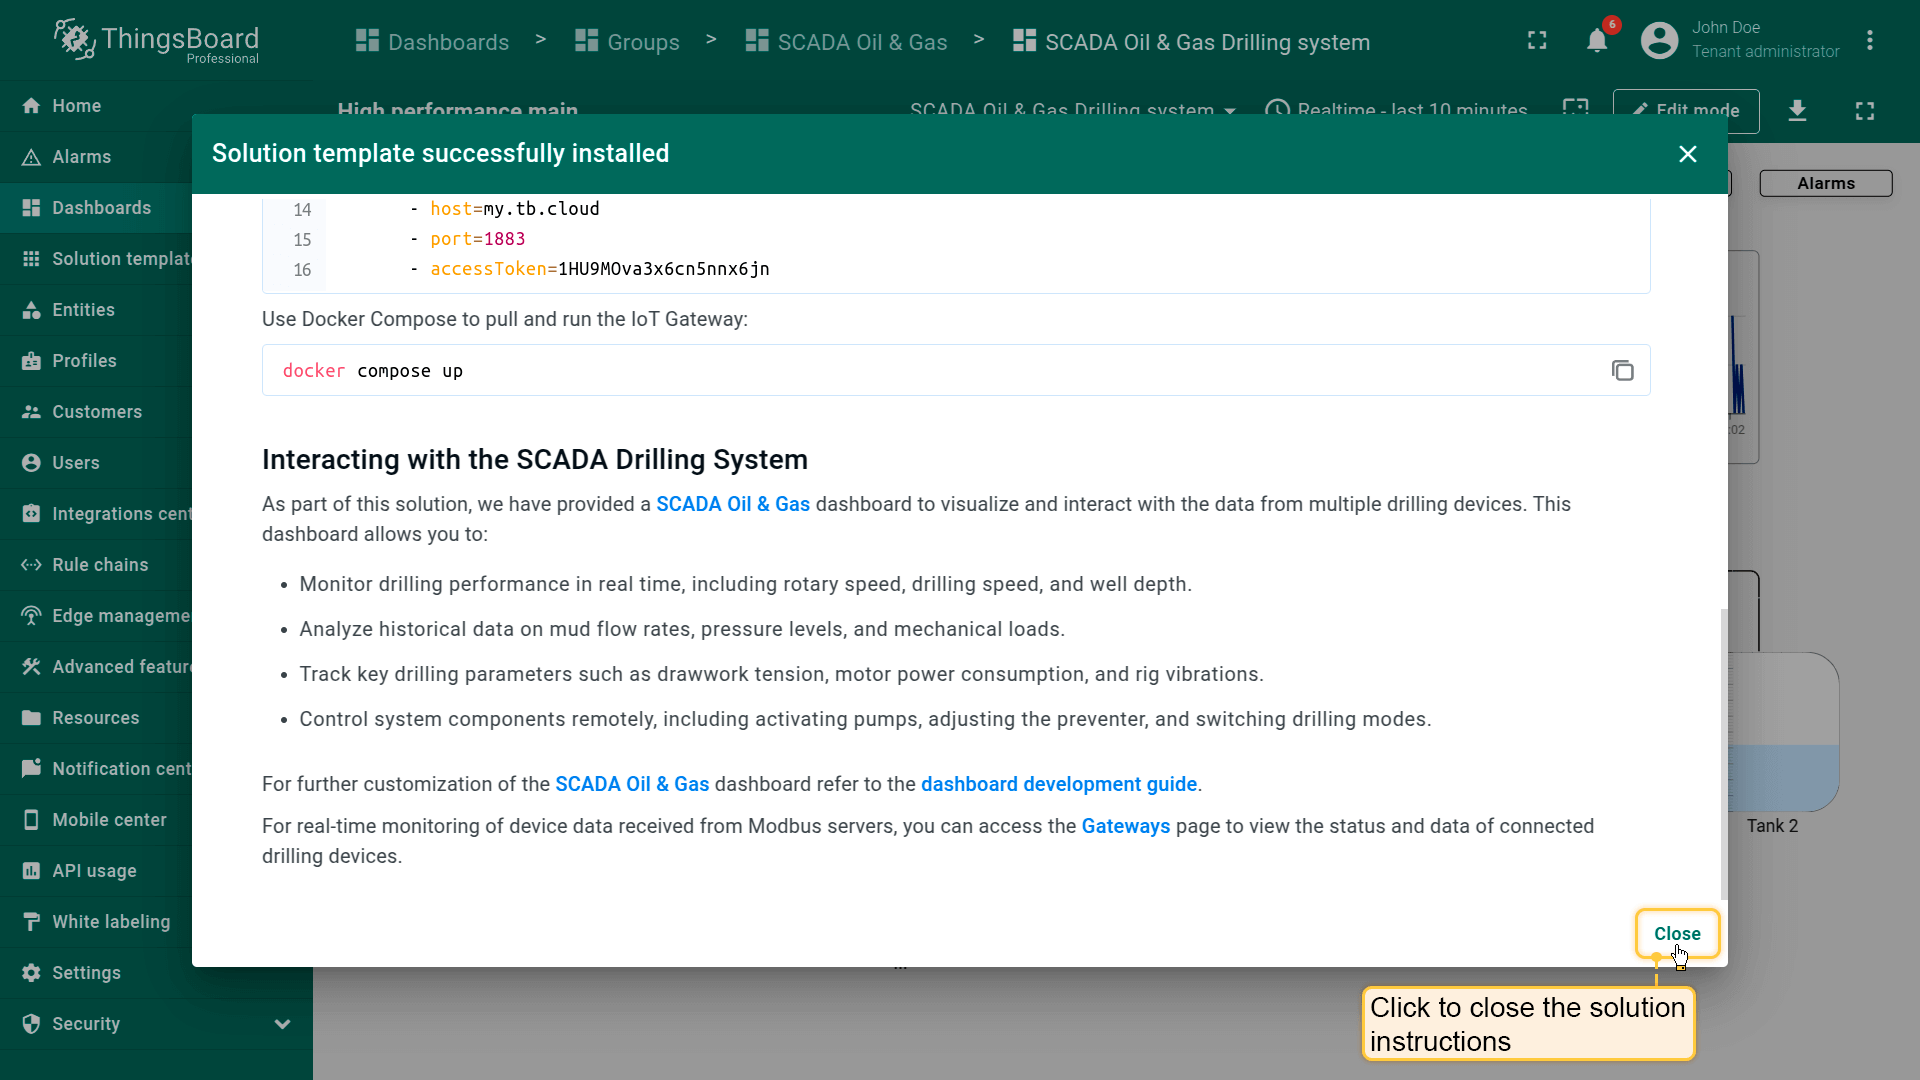
- 完成后点击“Close”完成设置并进入仪表板。
仪表板
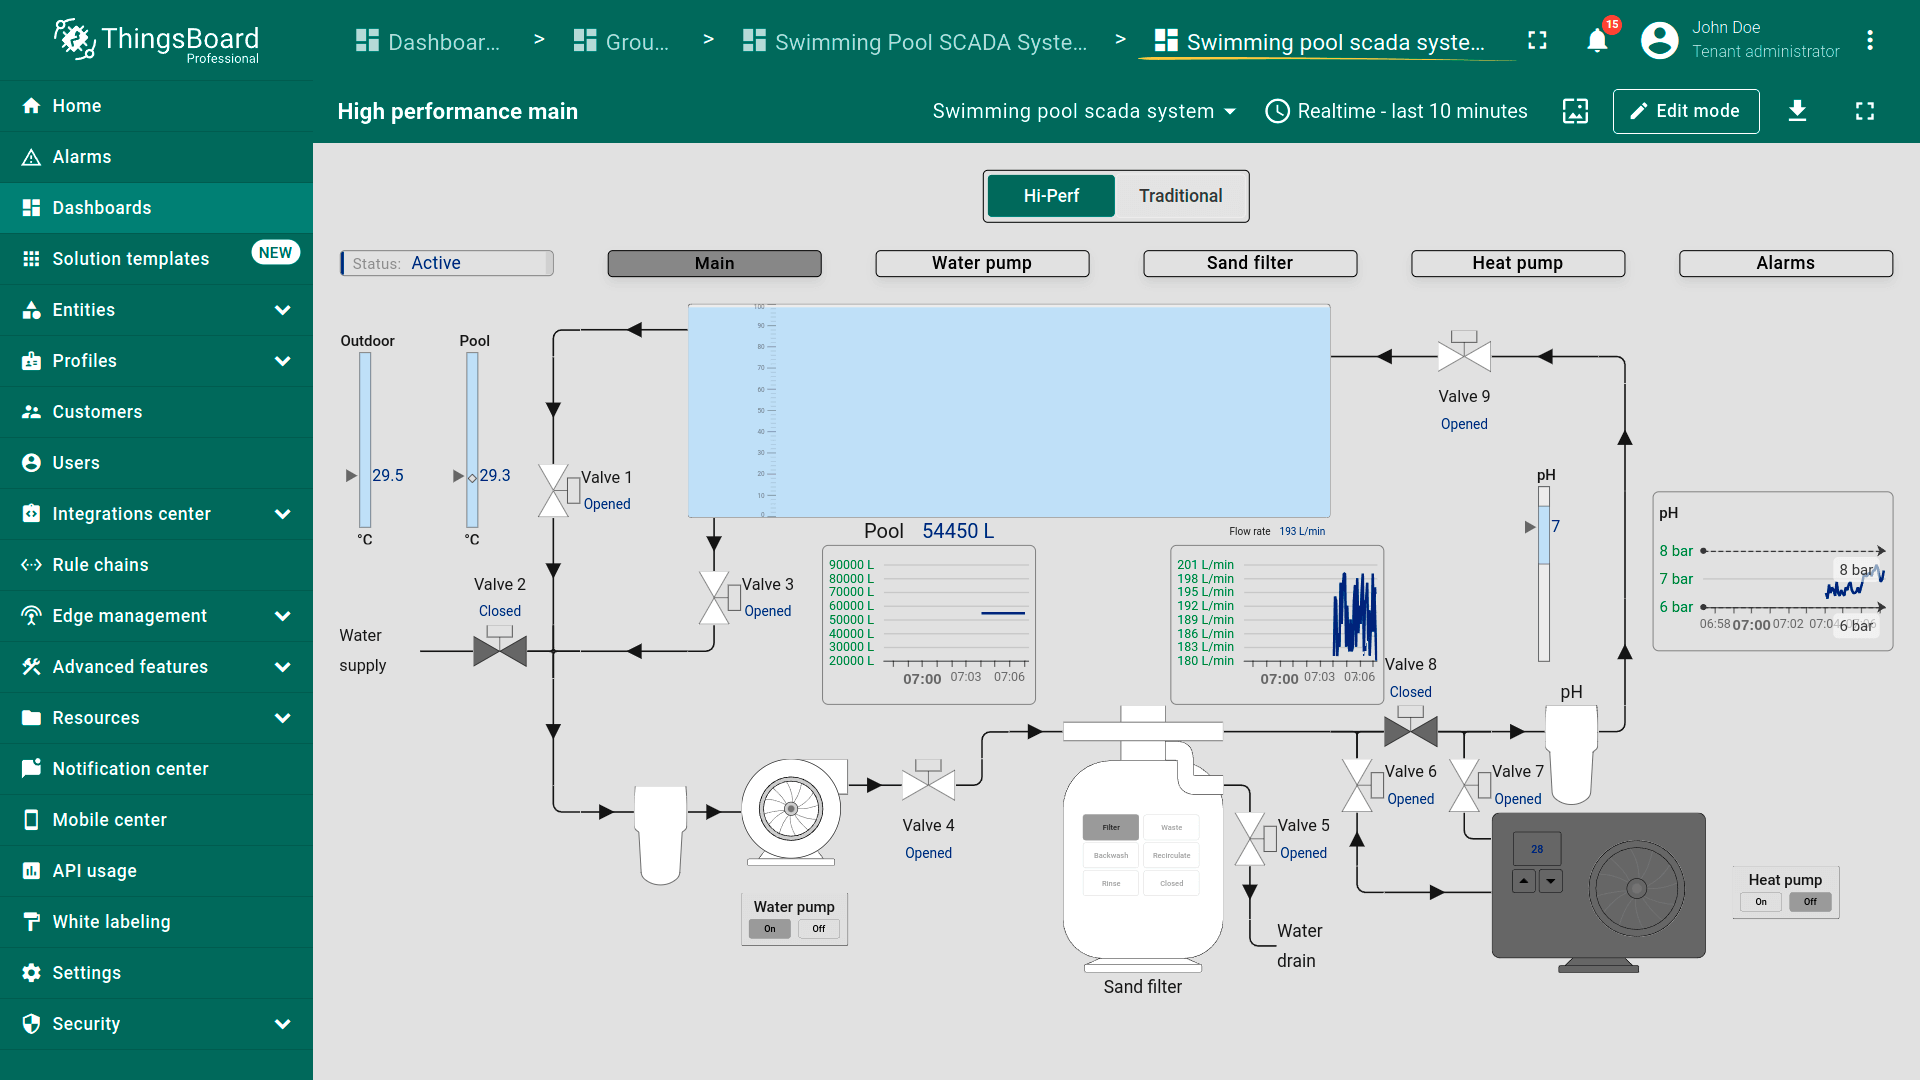
本解决方案开发了全面的Swimming Pool SCADA系统仪表板,用于可视化、交互并控制多设备的实时数据。仪表板设计用于展示水管理、温度控制与设备绩效的关键信息。 支持操作人员从任意设备与各类系统组件交互,进行实时控制与监测。
主要特性:
-
交互式状态:点击单个设备即可访问特定状态的详细指标,简化工作流。
-
多设备访问的灵活布局:无论使用桌面、平板或智能手机,仪表板的自适应设计均可确保对游泳池系统的无缝操作与随时随地访问。
-
水质管理:通过监测水位与pH数据保持泳池最佳状态。系统有助于维持平衡并预防水质问题。
-
温度控制:使用室外温度与泳池温度传感器数据智能控制热泵。系统确保水温按预设目标高效维持。
-
设备监测:监测泵、砂滤器及其他关键设备的绩效。仪表板提供转速、振动、流量、功耗等洞察以监测运营效率。
-
阀门控制:通过控制阀门远程控制系统中不同区段的水流。增加系统灵活性并支持按需快速调节水流。可通过仪表板直接与阀门交互以按需开关。
-
能源管理:跟踪热泵、过滤系统及其他设备的能耗。利用数据优化能效并降低成本。
-
远程系统管理:从任意位置全面控制游泳池系统。远程操作泵、切换模式并管理阀门。
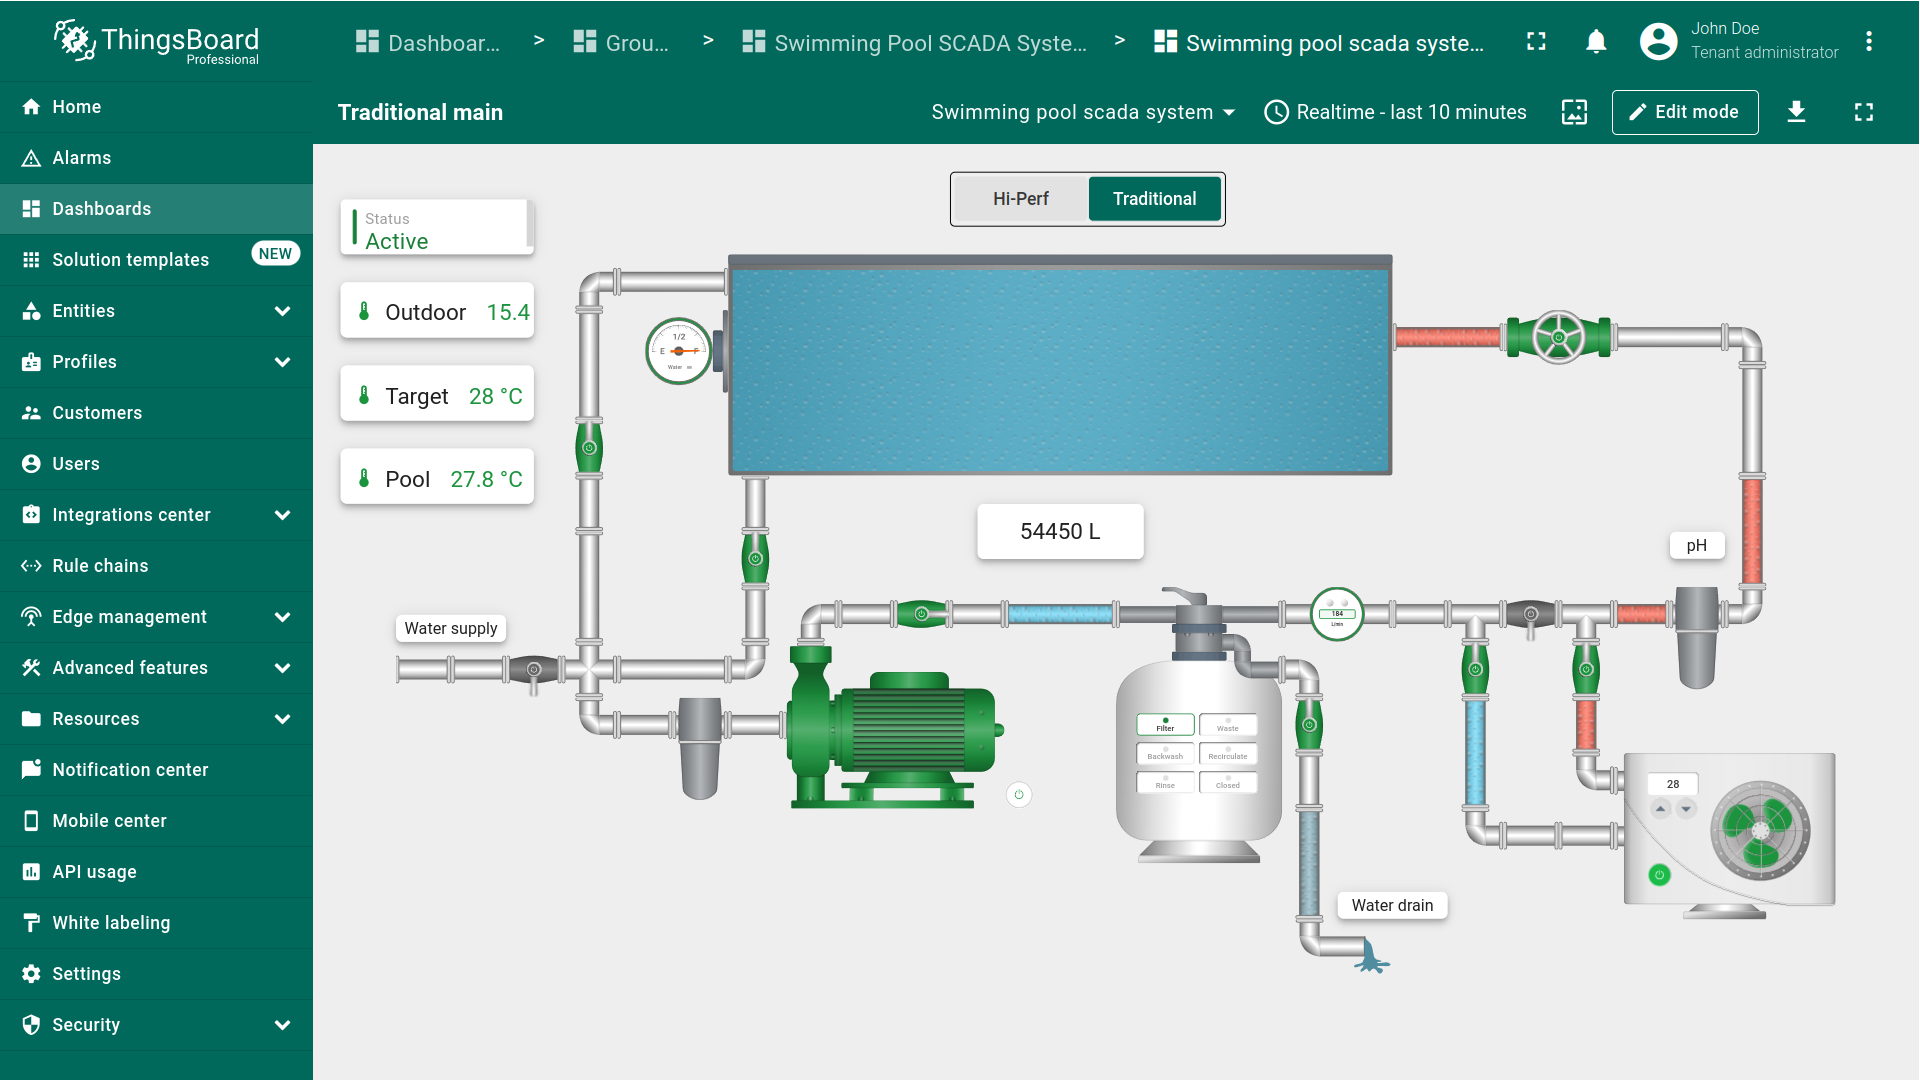
SCADA系统分为两类:
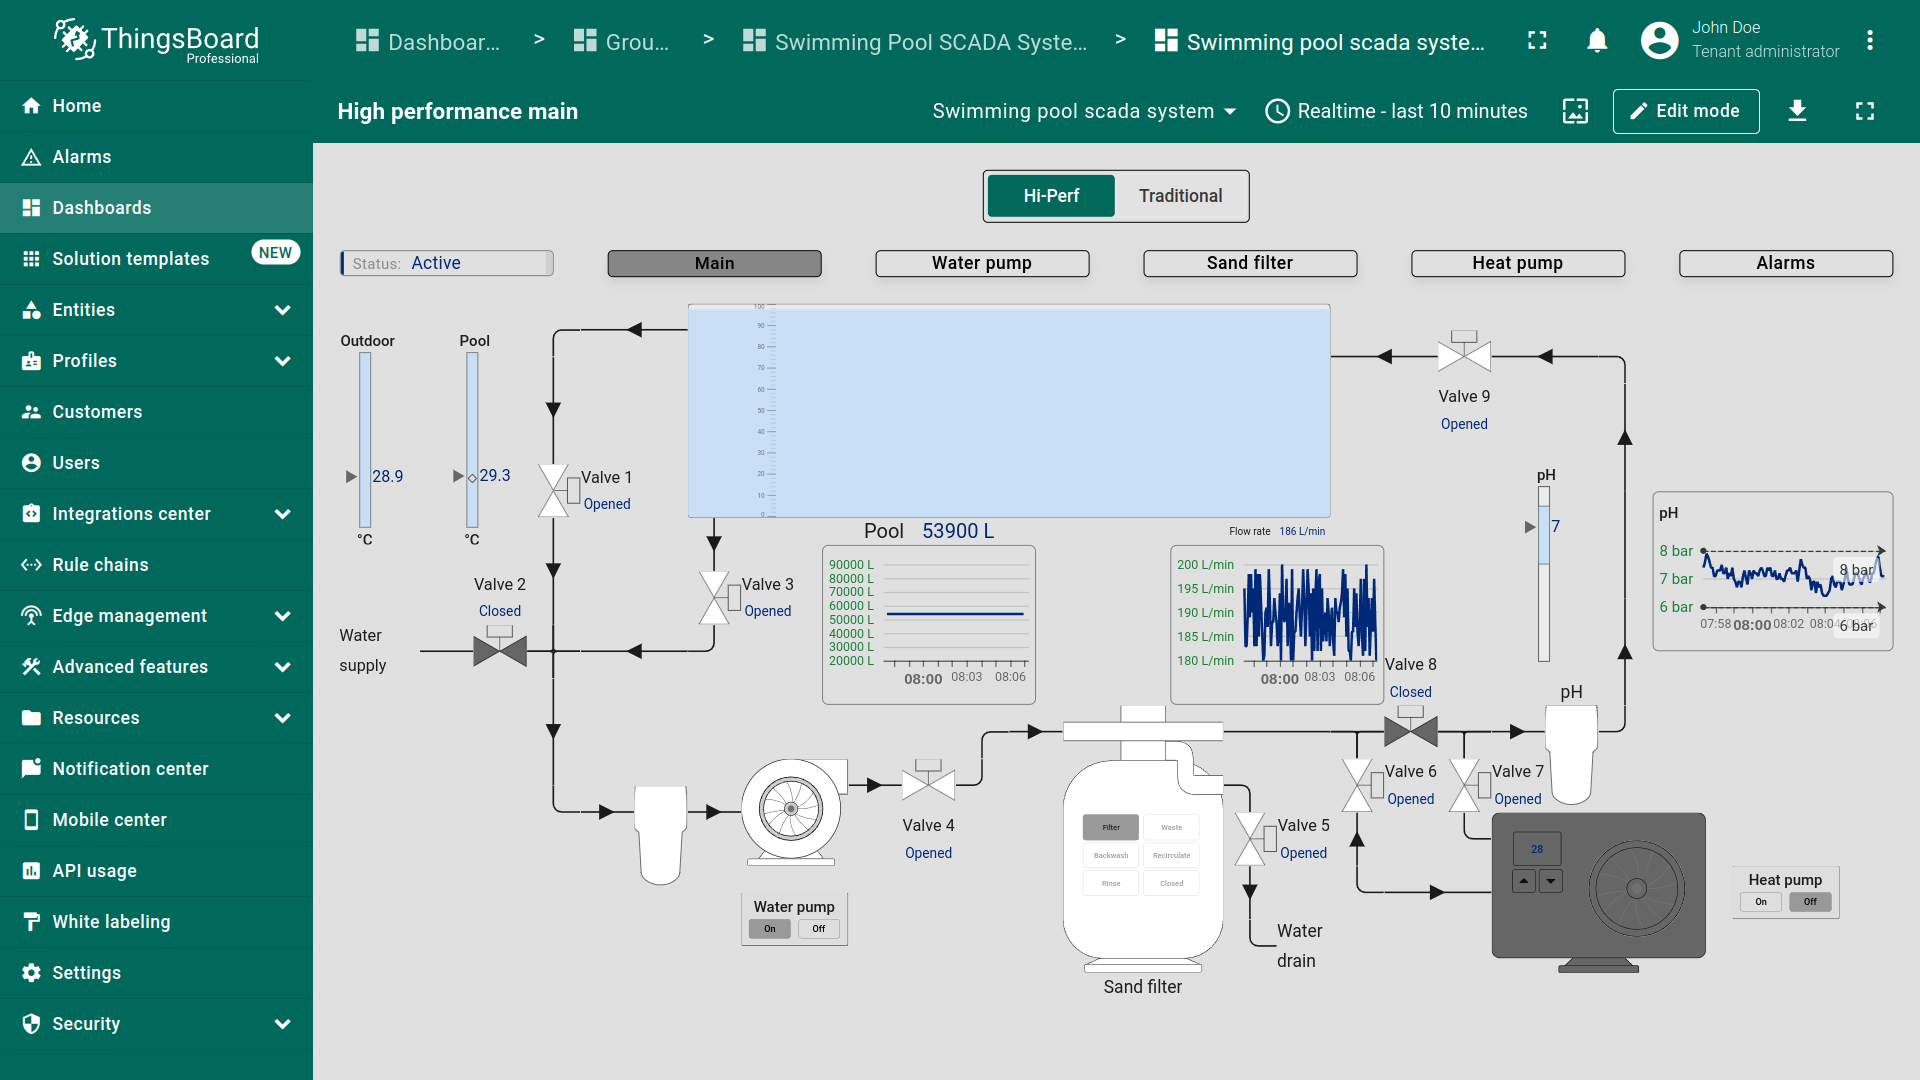
- 高性能SCADA系统,侧重简化界面、更快决策与更高信息感知效率。
- 传统SCADA系统,侧重基本监测与控制。
选择适合您的SCADA系统类型:
点击不同设备可查看各组件的详细指标与控制项。 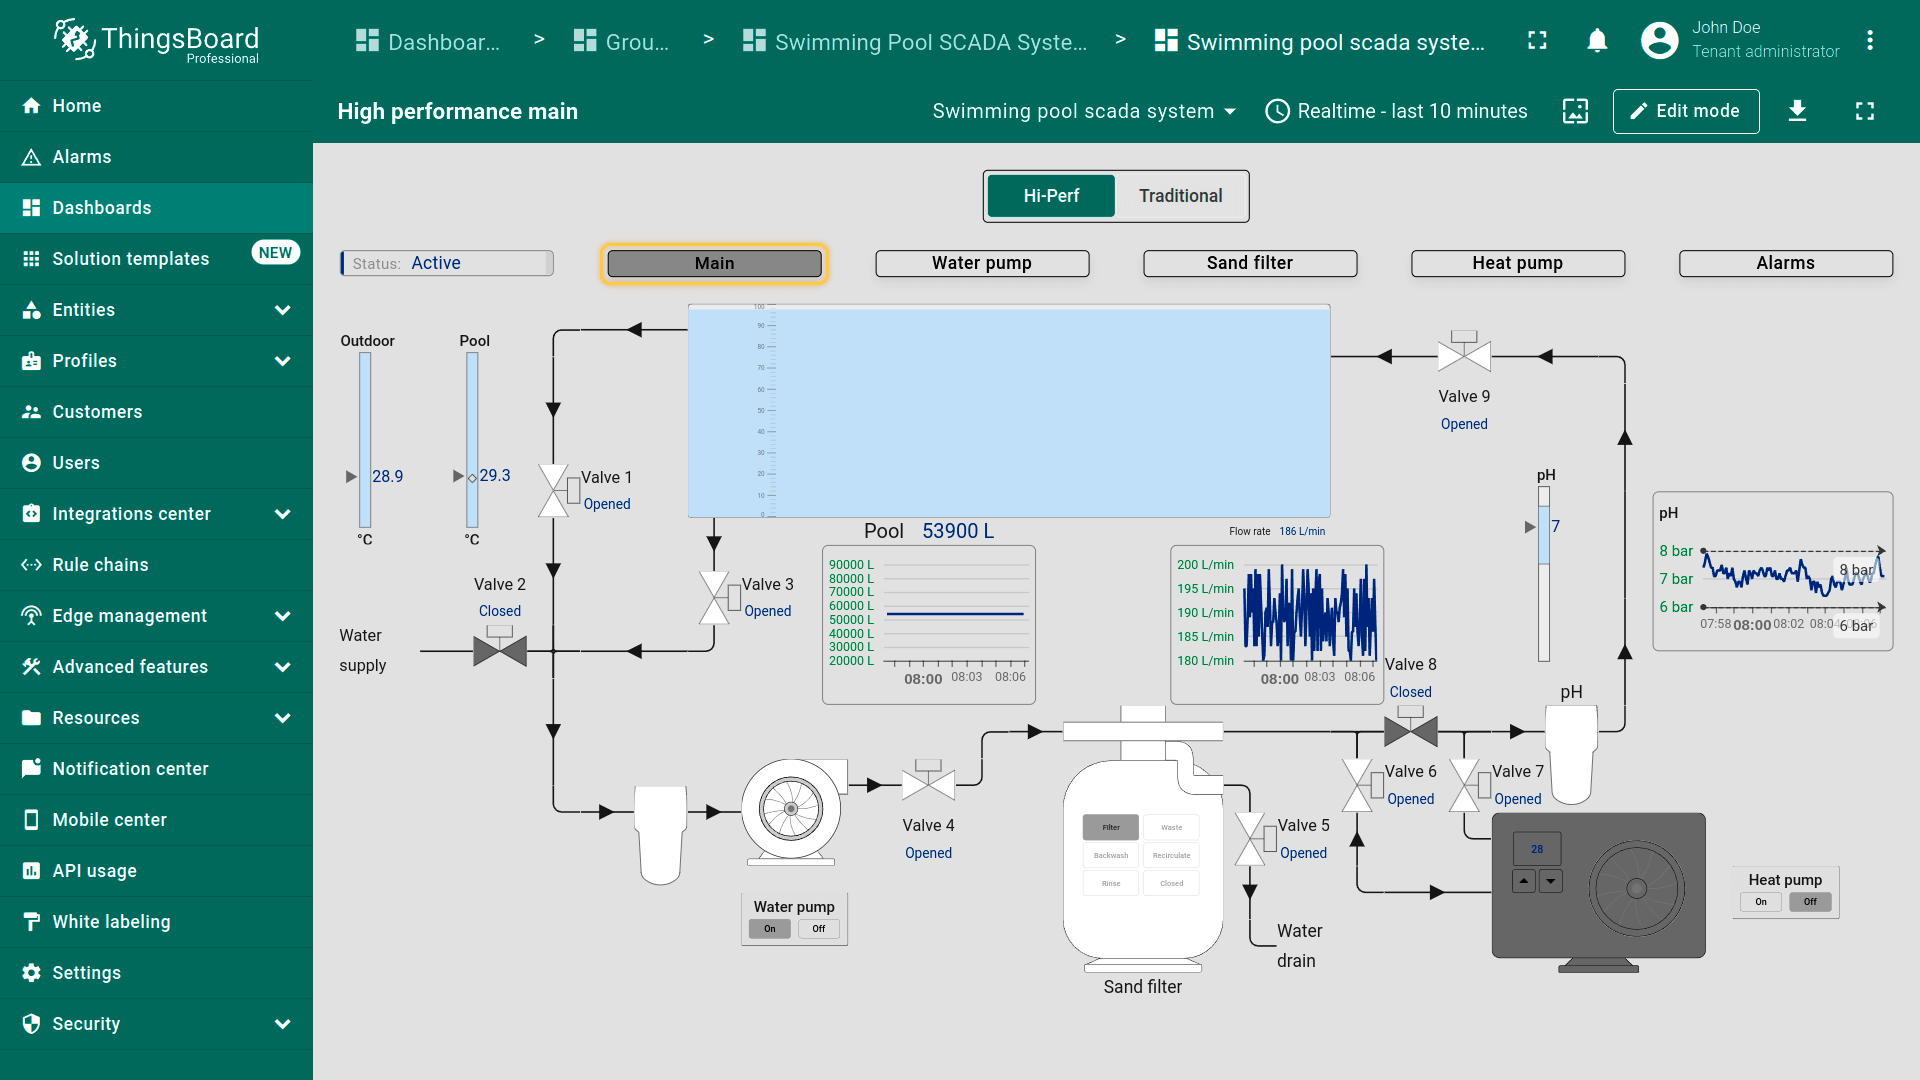 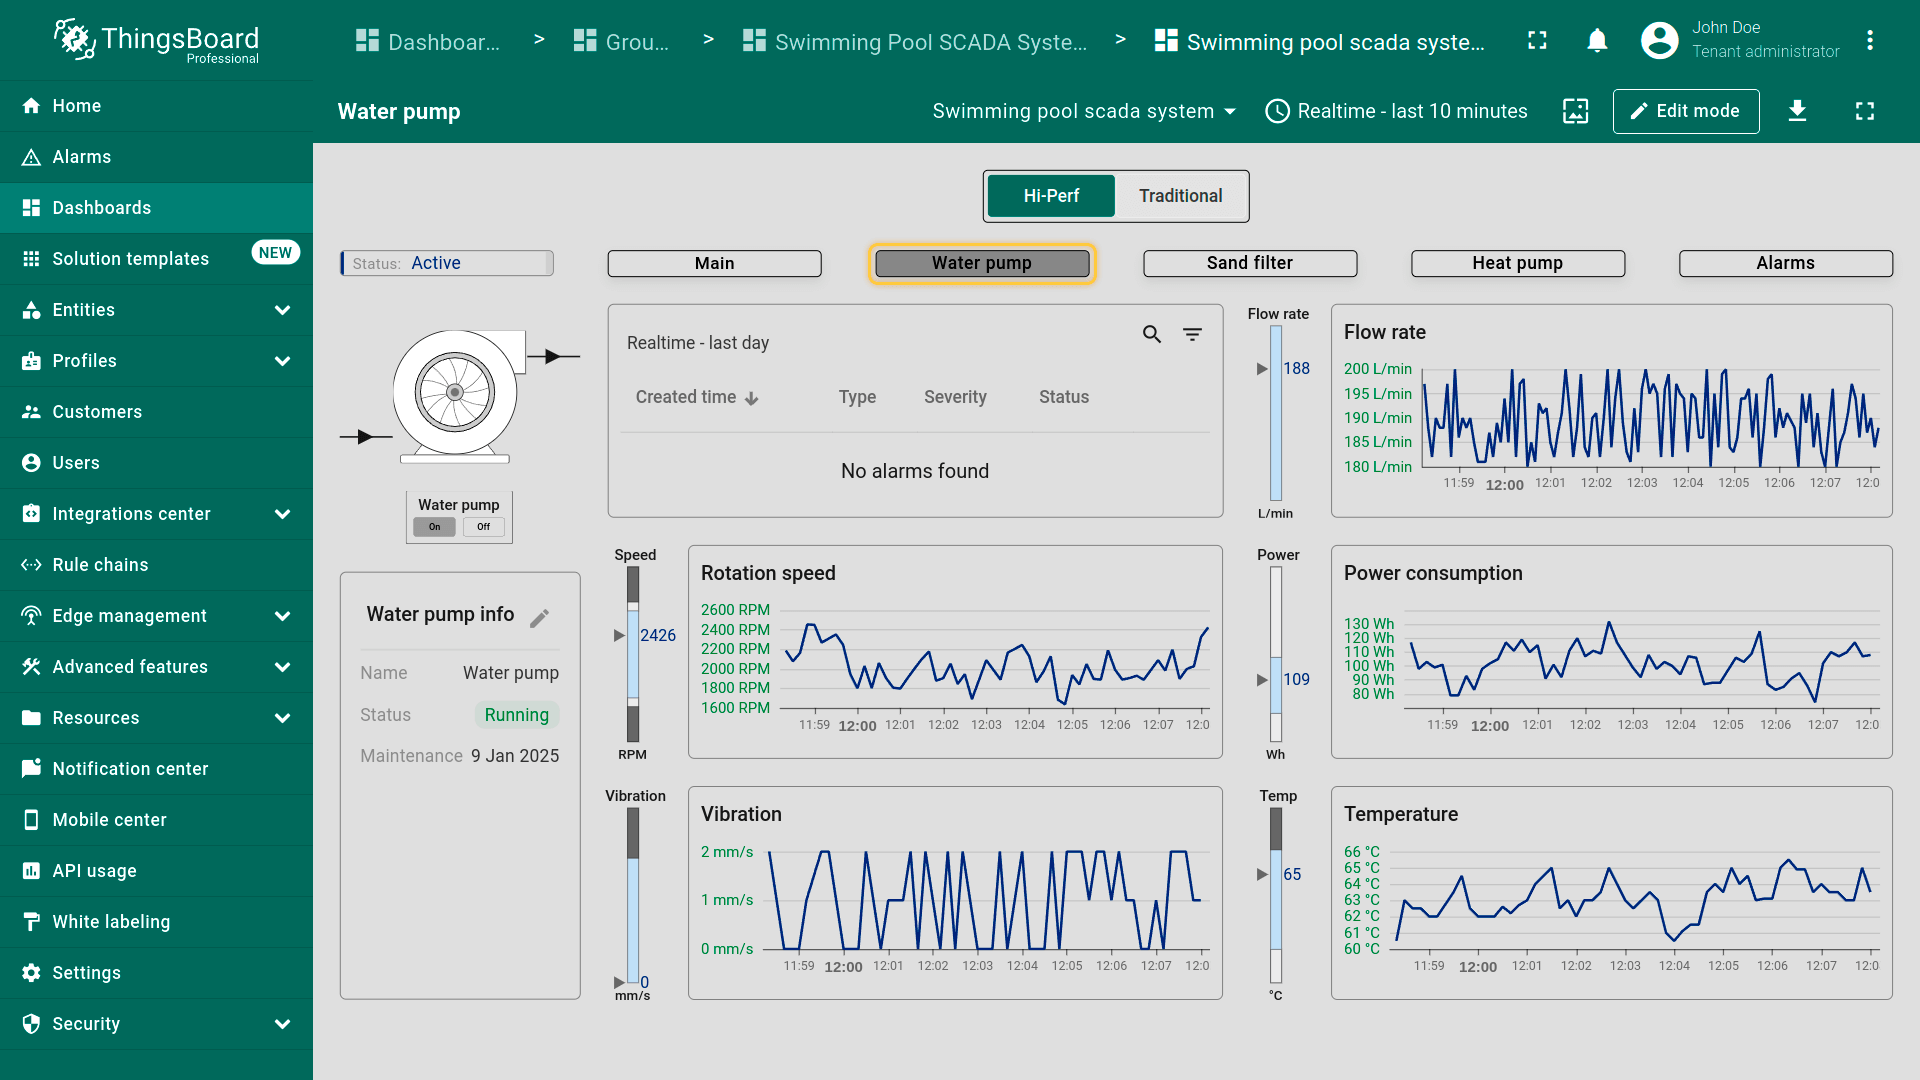 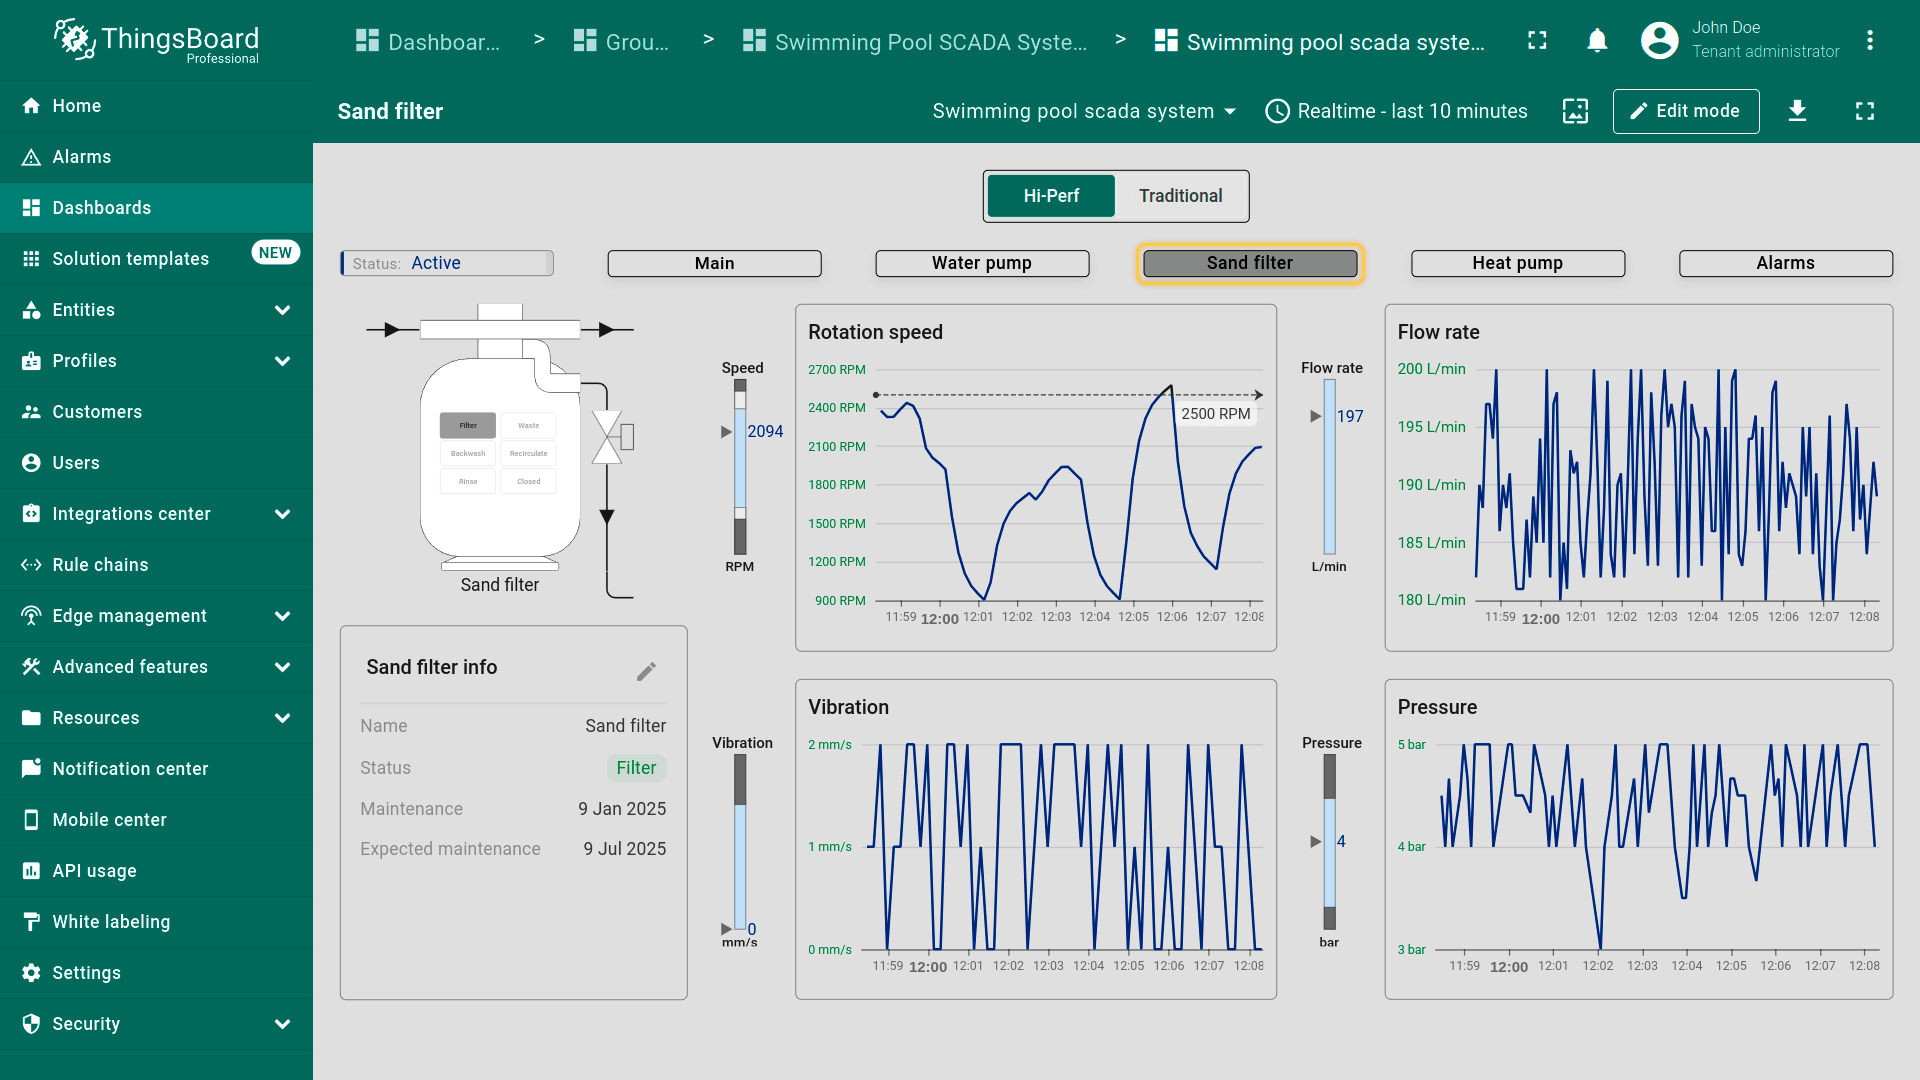  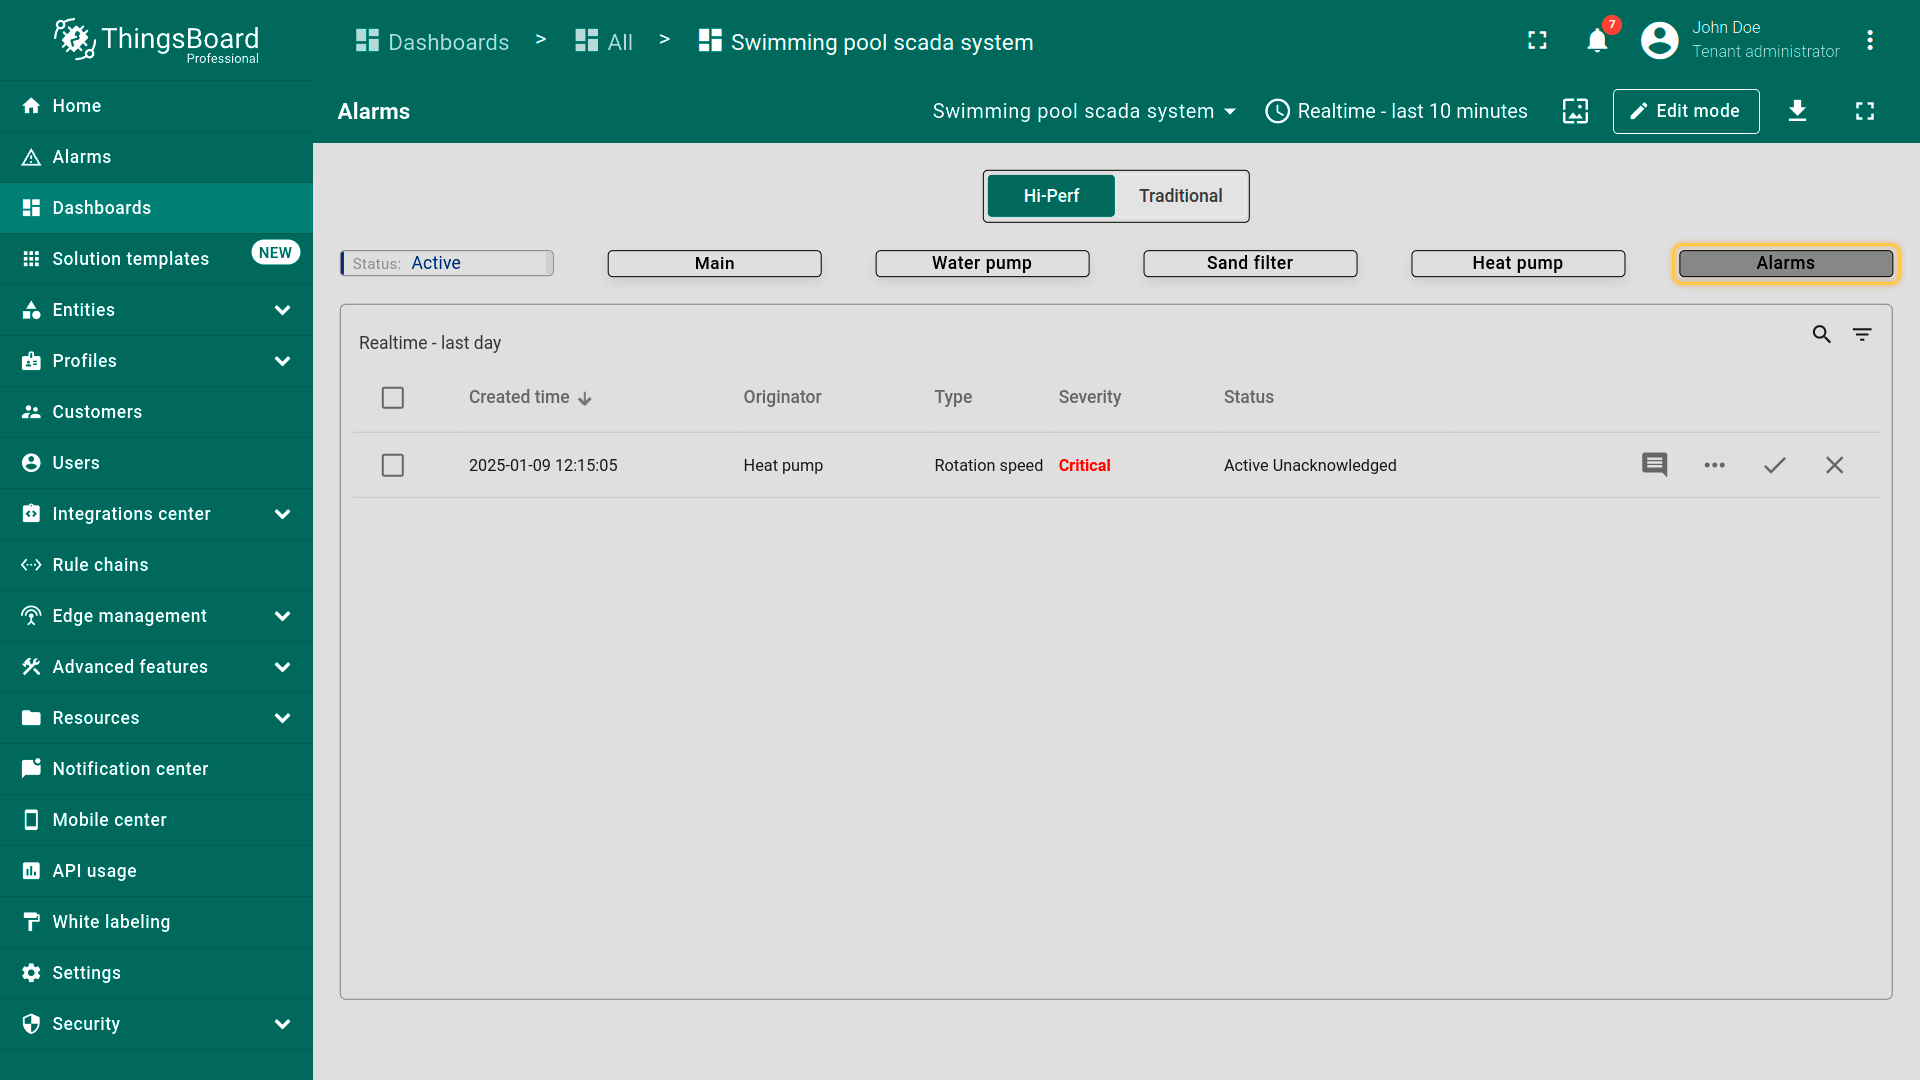 移动端视图展示仪表板的灵活性,支持在平板和智能手机等不同设备上管理和监控泳池SCADA系统。 |
点击不同设备可查看各组件的详细指标与控制项。 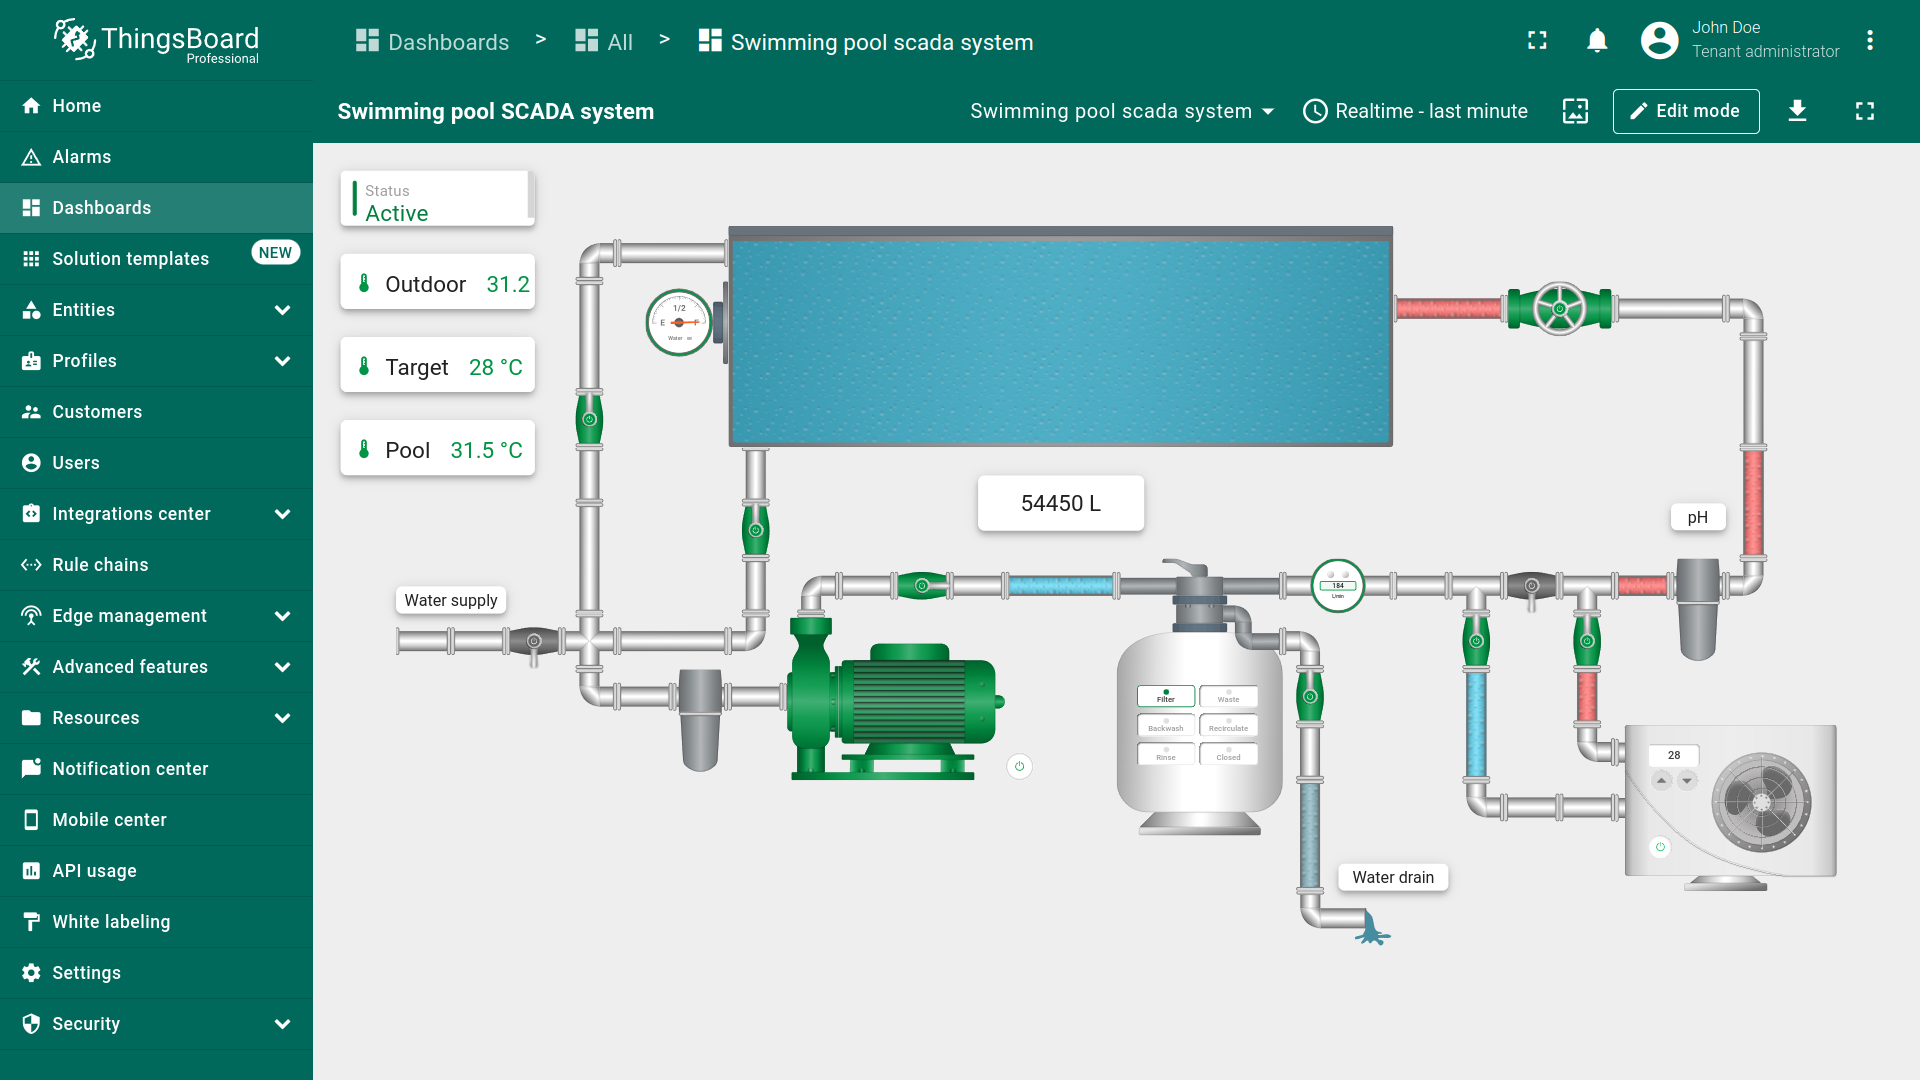 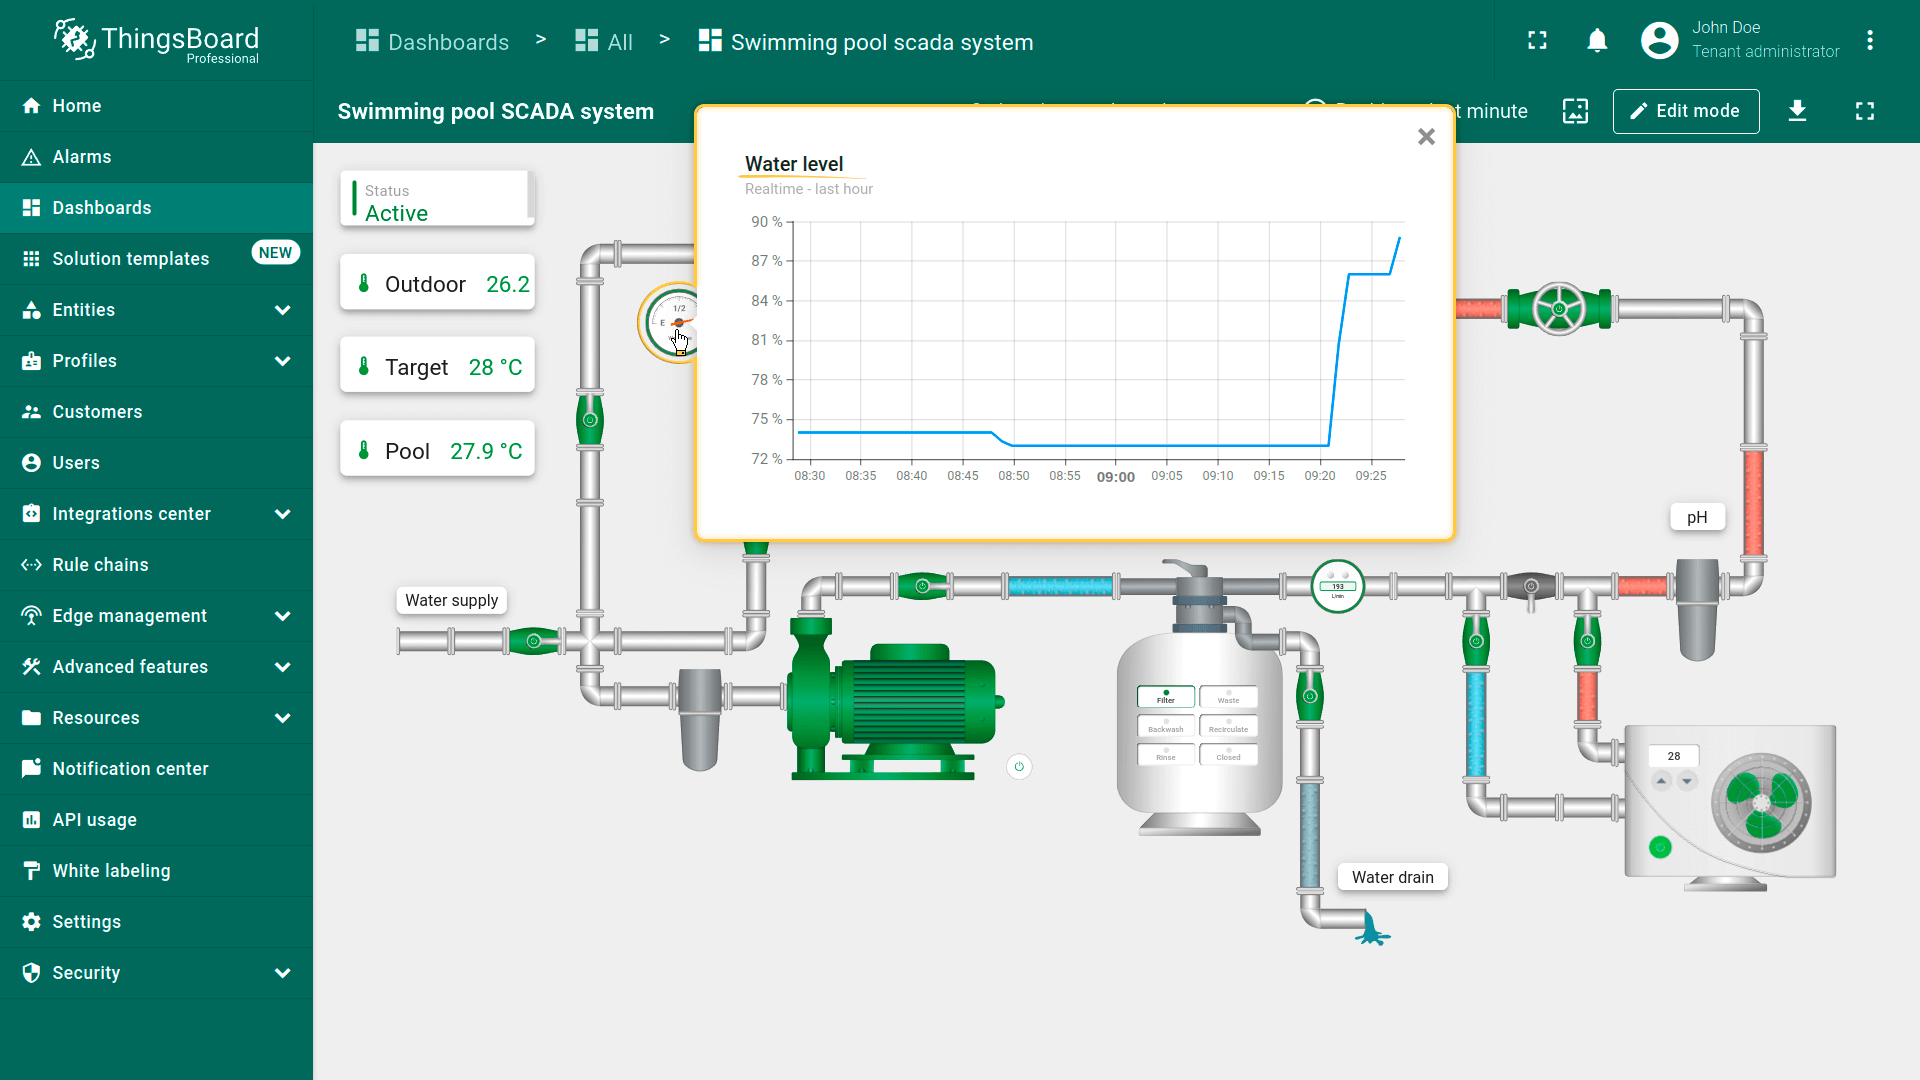 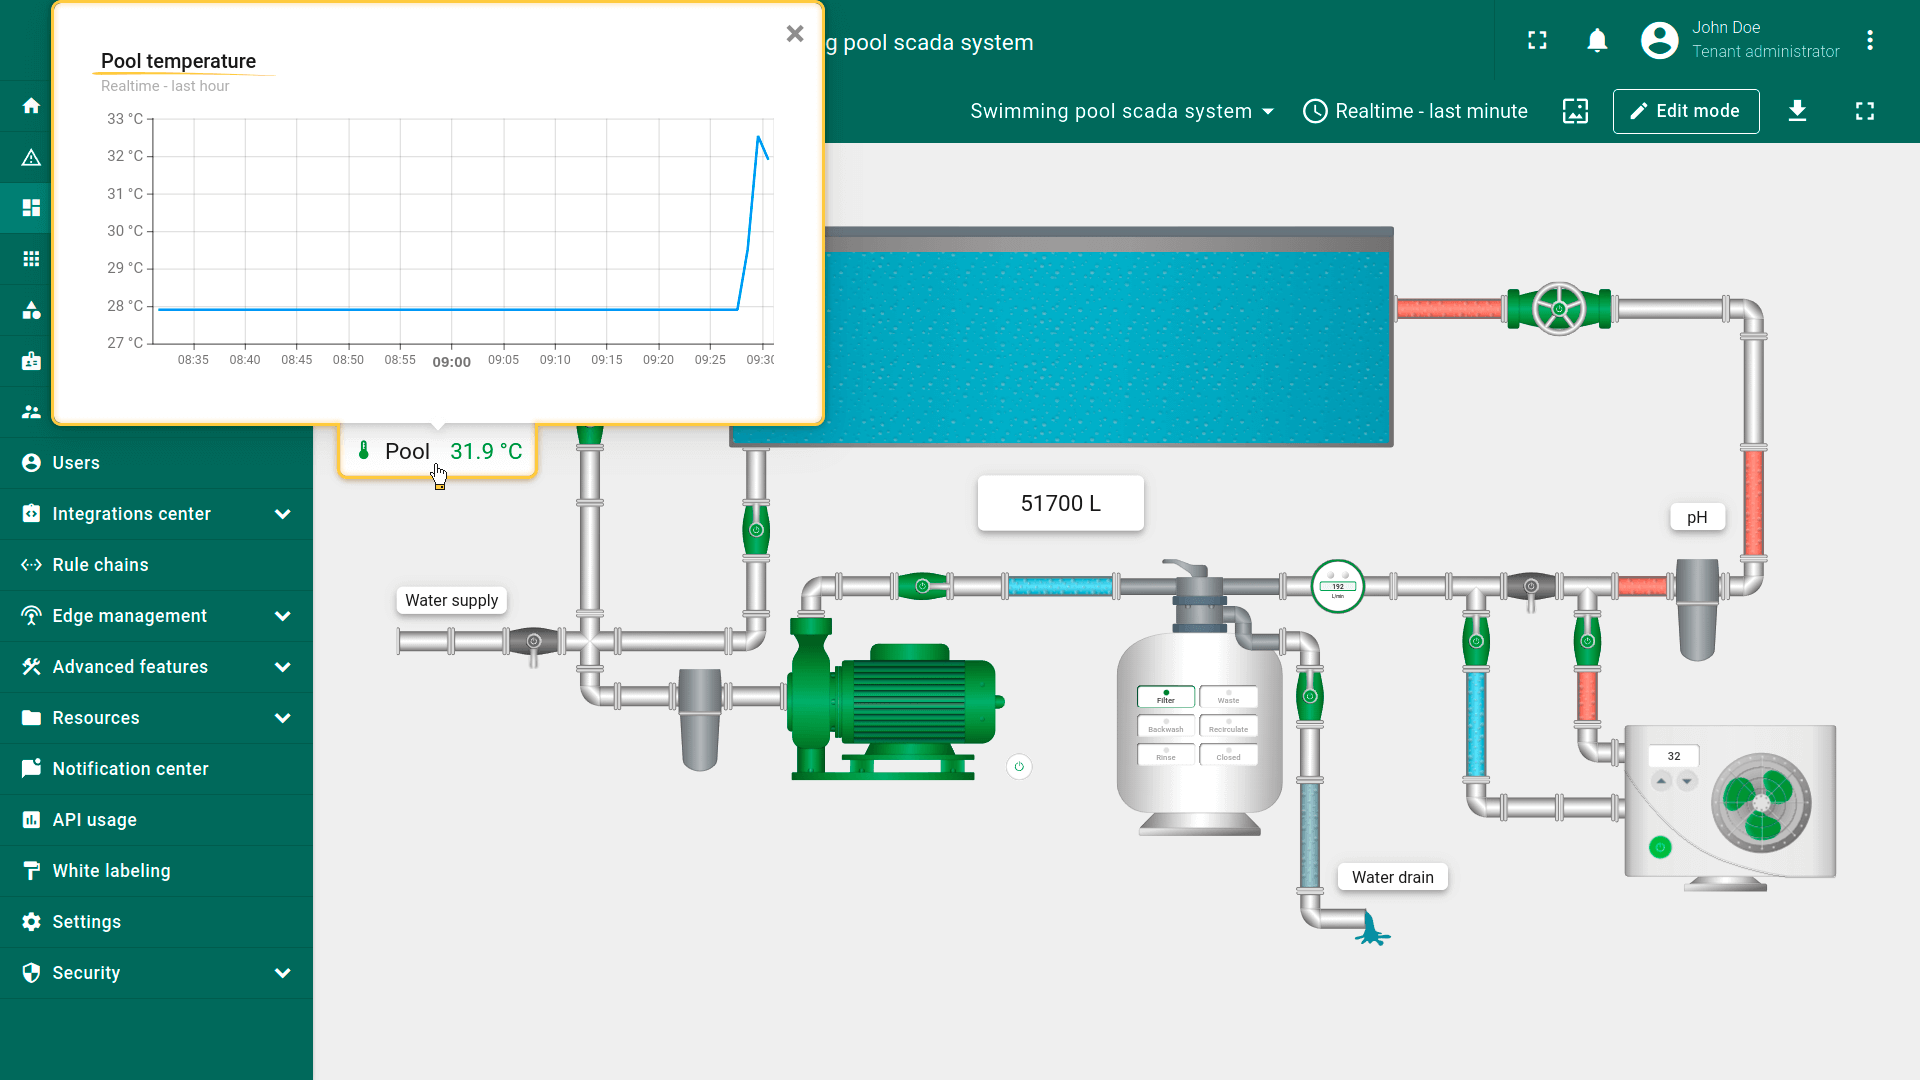 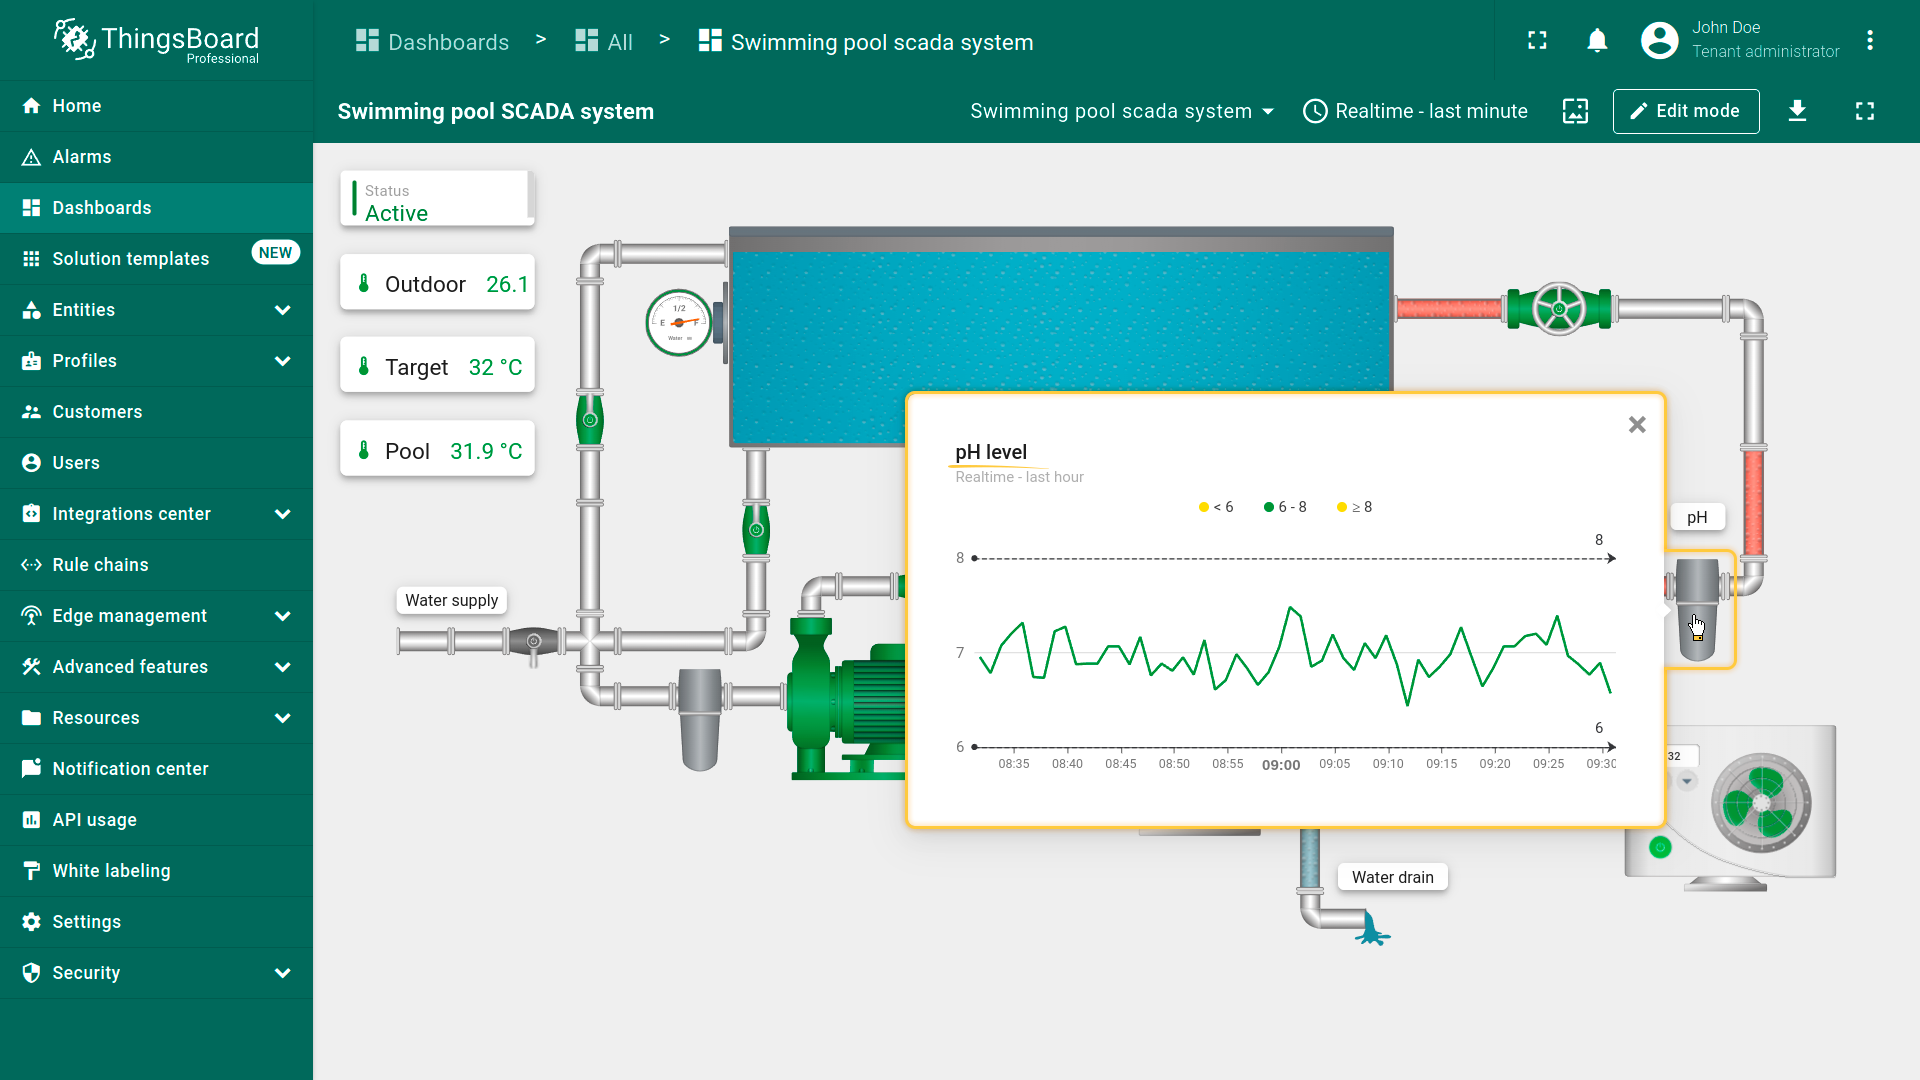 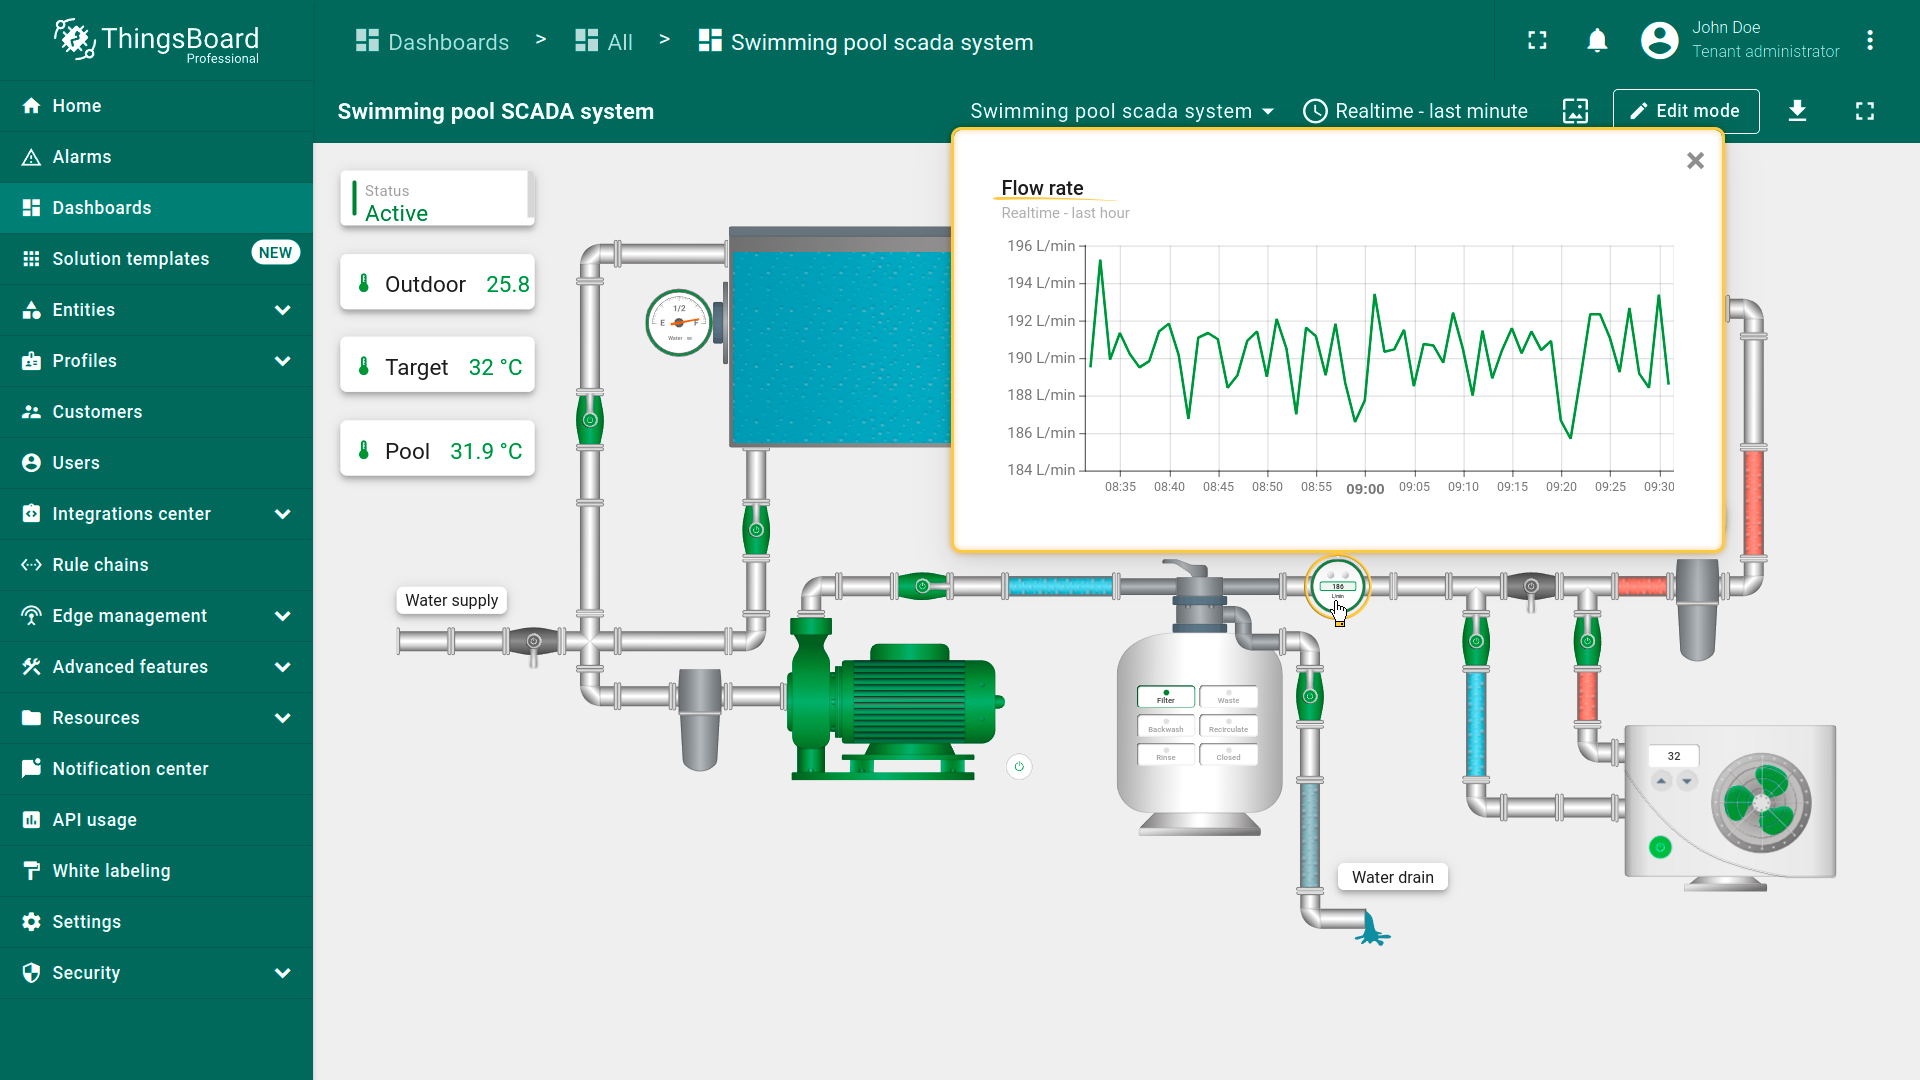 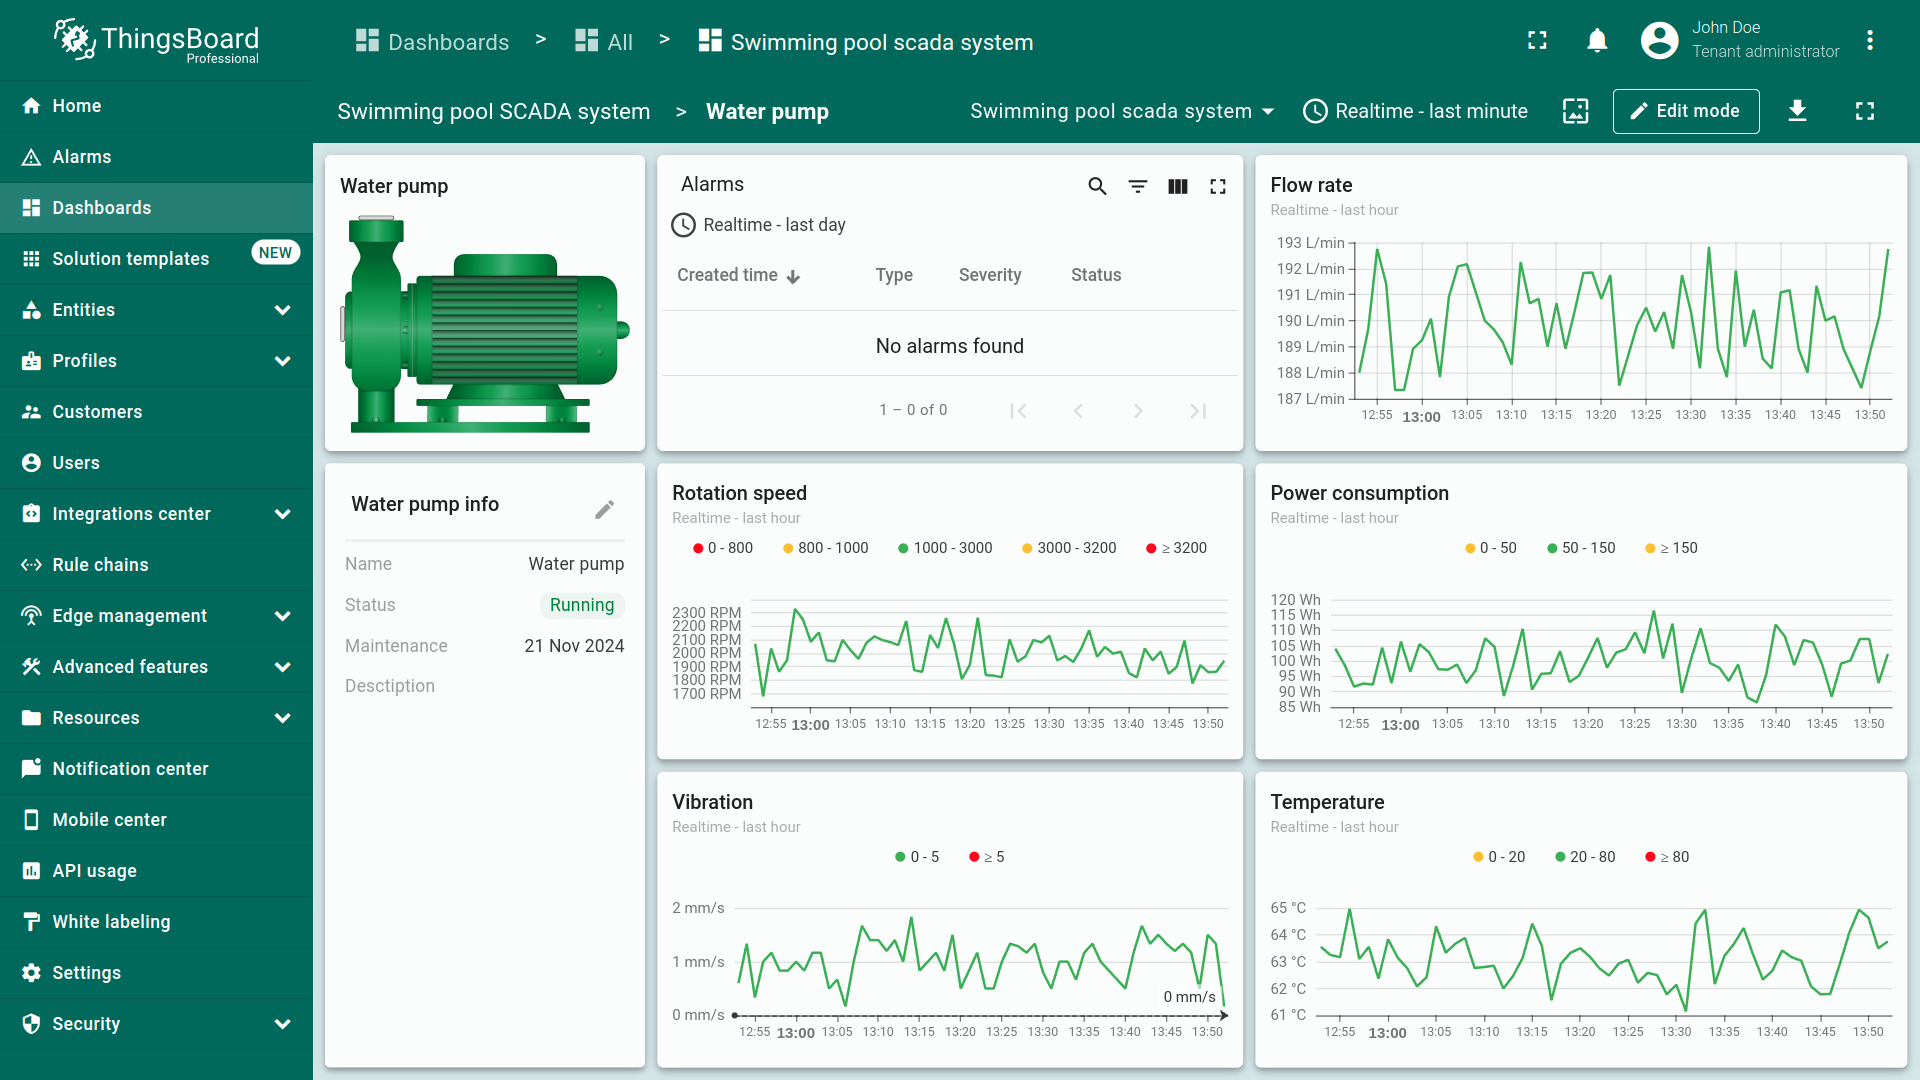 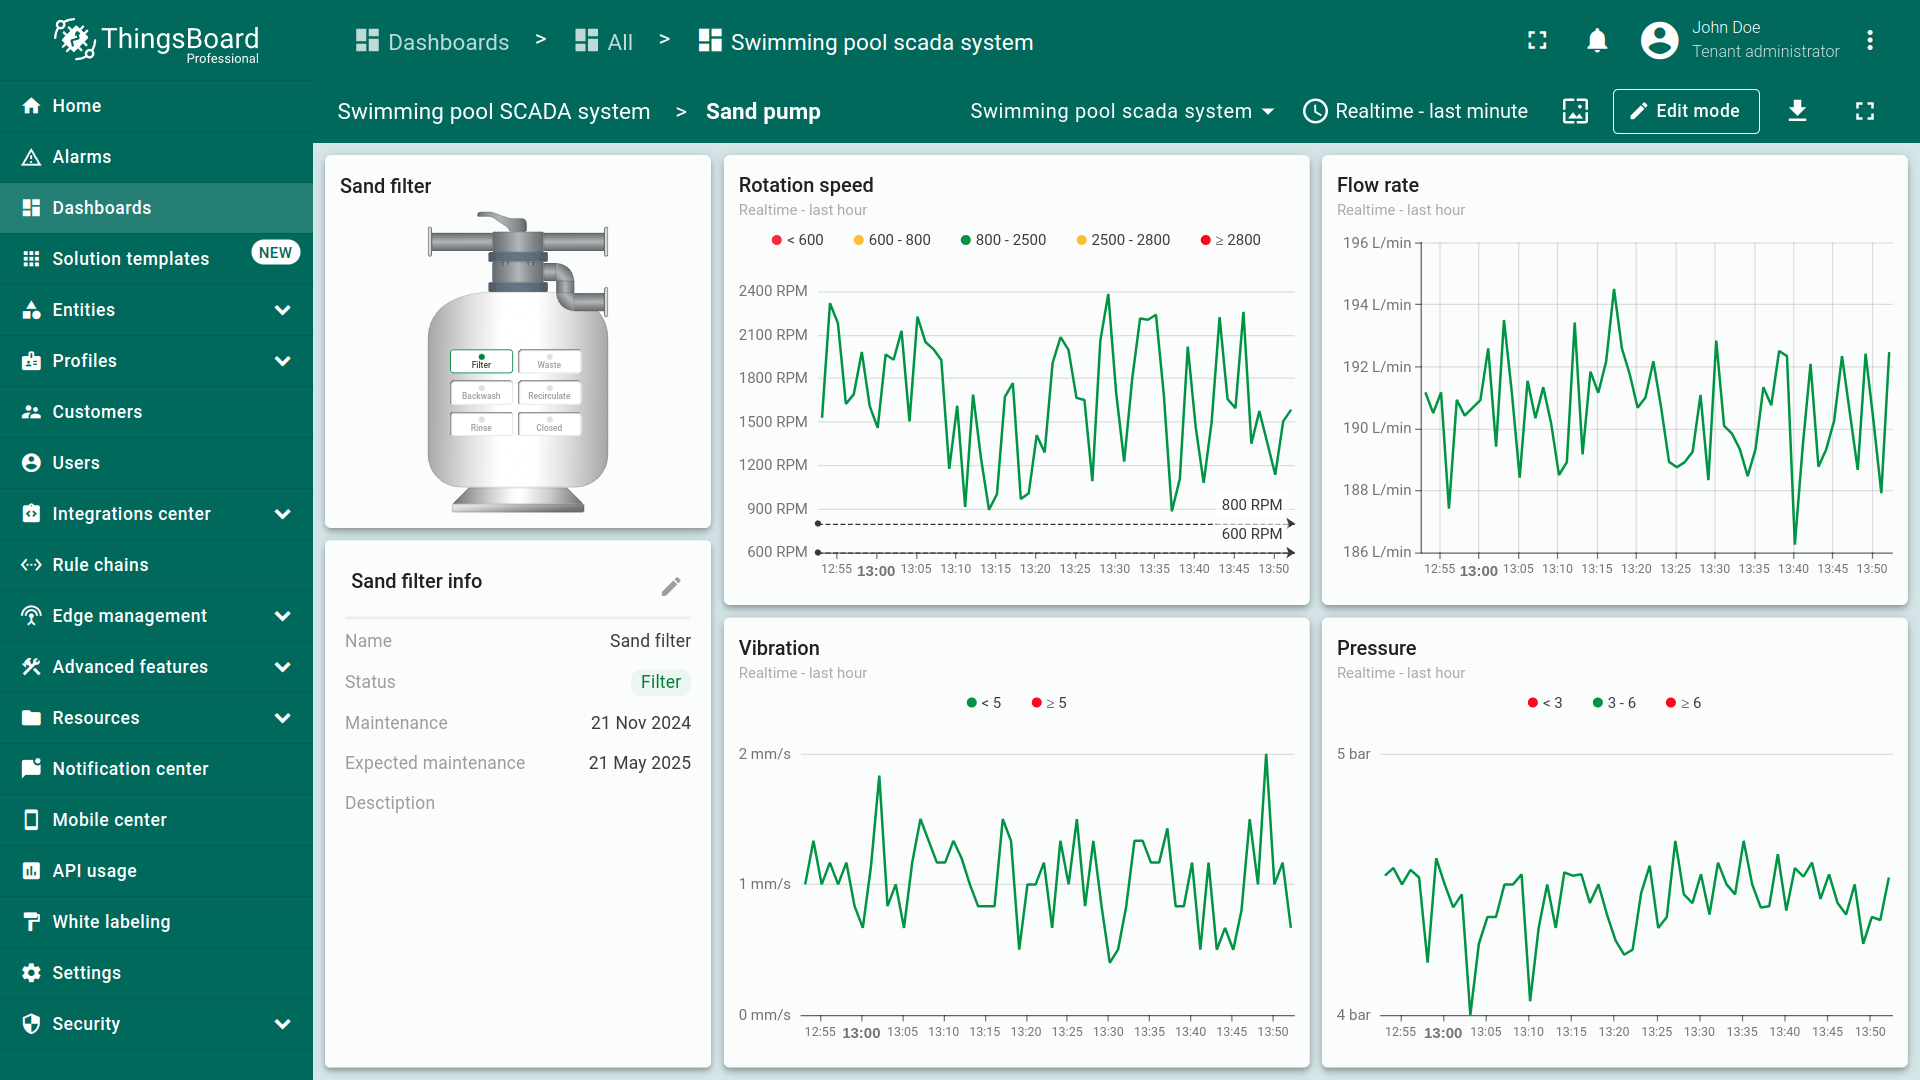 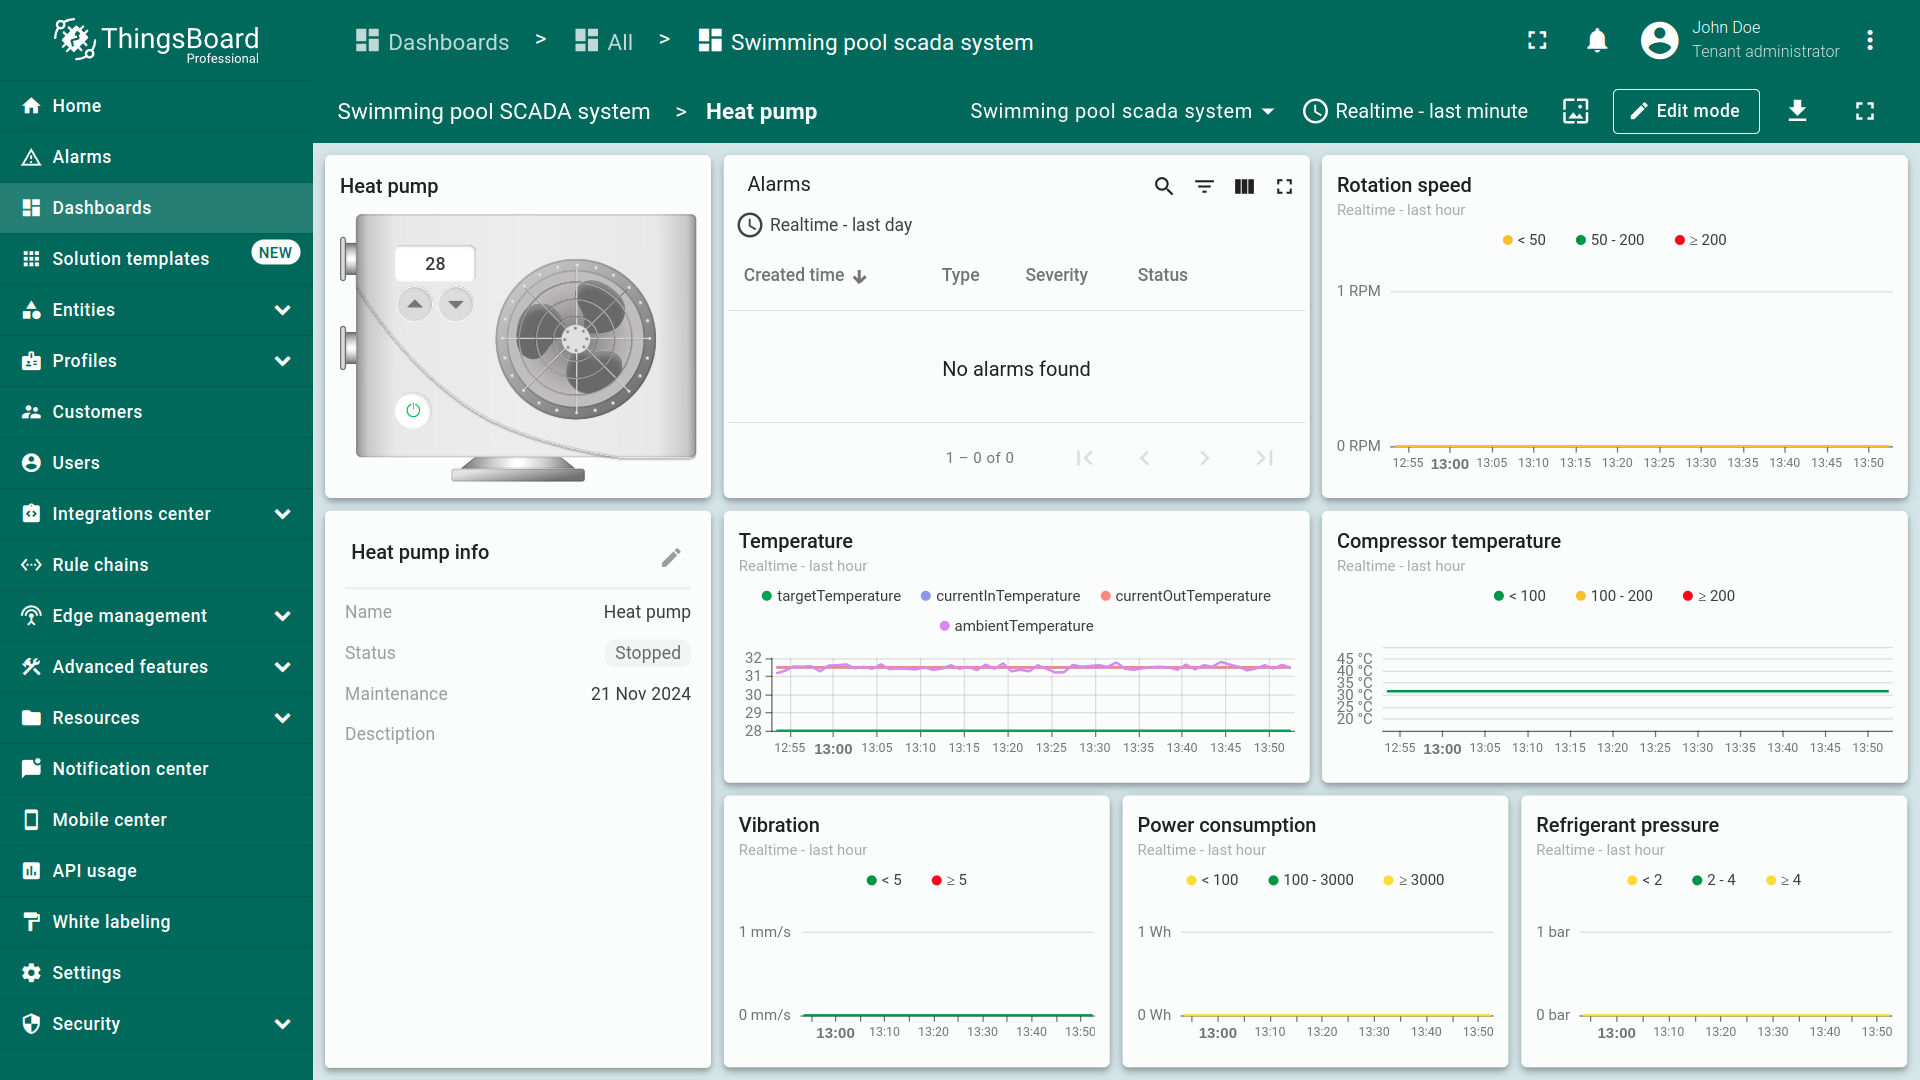 移动端视图展示仪表板的灵活性,支持在平板和智能手机等不同设备上管理和监控泳池SCADA系统。 |
Swimming Pool SCADA系统仪表板的更多自定义请参阅仪表板开发指南。
要从Modbus服务器接收设备数据进行实时监测,可访问ThingsBoard IoT Gateways仪表板查看连接设备的状态与数据。
系统组件
SCADA Swimming Pool系统包含:
- 14台运营设备,用于监测与控制泳池系统各组件;
- 用于从连接设备采集数据并以属性存储的资产,供SCADA系统内各组件后续监测与控制;
- 网关将这些设备的数据传至ThingsBoard,确保SCADA系统内设备连接与数据传输顺畅。
设备
选择SCADA系统类型:
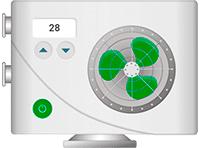
系统包含14台运行设备: 热泵 热泵控制泳池温度,并依据预设温度自动运行。该行为由Swimming Pool Device Rule Chain管理,以实现节能和精确温控。根据温度读数,热泵会自动:
热泵可配置以下选项:
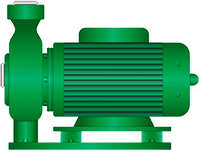
水泵 通过开关水泵管理泳池内水循环。
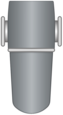
pH滤器 管理过滤与加药流程,使水pH保持在最佳范围。点击pH滤器可在弹窗中打开pH滤器图。
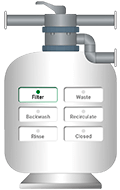
砂滤器 用于从泳池中高效清除杂物。砂滤器支持多种模式:filtration、wasting、backwashing、recirculation、rinsing,均可通过SCADA系统远程控制。
水位计 测量泳池水位,提供维持适宜水位和检测渗漏所需数据。
阀门 精确控制泳池系统各区域之间的水流。点击阀门可开启或关闭。
|
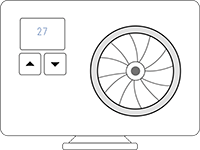


系统包含14台运行设备: 热泵 热泵控制泳池温度,并依据预设温度自动运行。该行为由Swimming Pool Device Rule Chain管理,以实现节能和精确温控。根据温度读数,热泵会自动:
热泵可配置以下选项:
水泵 通过开关水泵管理泳池内水循环。
pH滤器 管理过滤与加药流程,使水pH保持在最佳范围。点击pH滤器可在弹窗中打开pH滤器图。
砂滤器 用于从泳池中高效清除杂物。砂滤器支持多种模式:filtration、wasting、backwashing、recirculation、rinsing,均可通过SCADA系统远程控制。
水位计 测量泳池水位,提供维持适宜水位和检测渗漏所需数据。
阀门 精确控制泳池系统各区域之间的水流。点击阀门可开启或关闭。
|

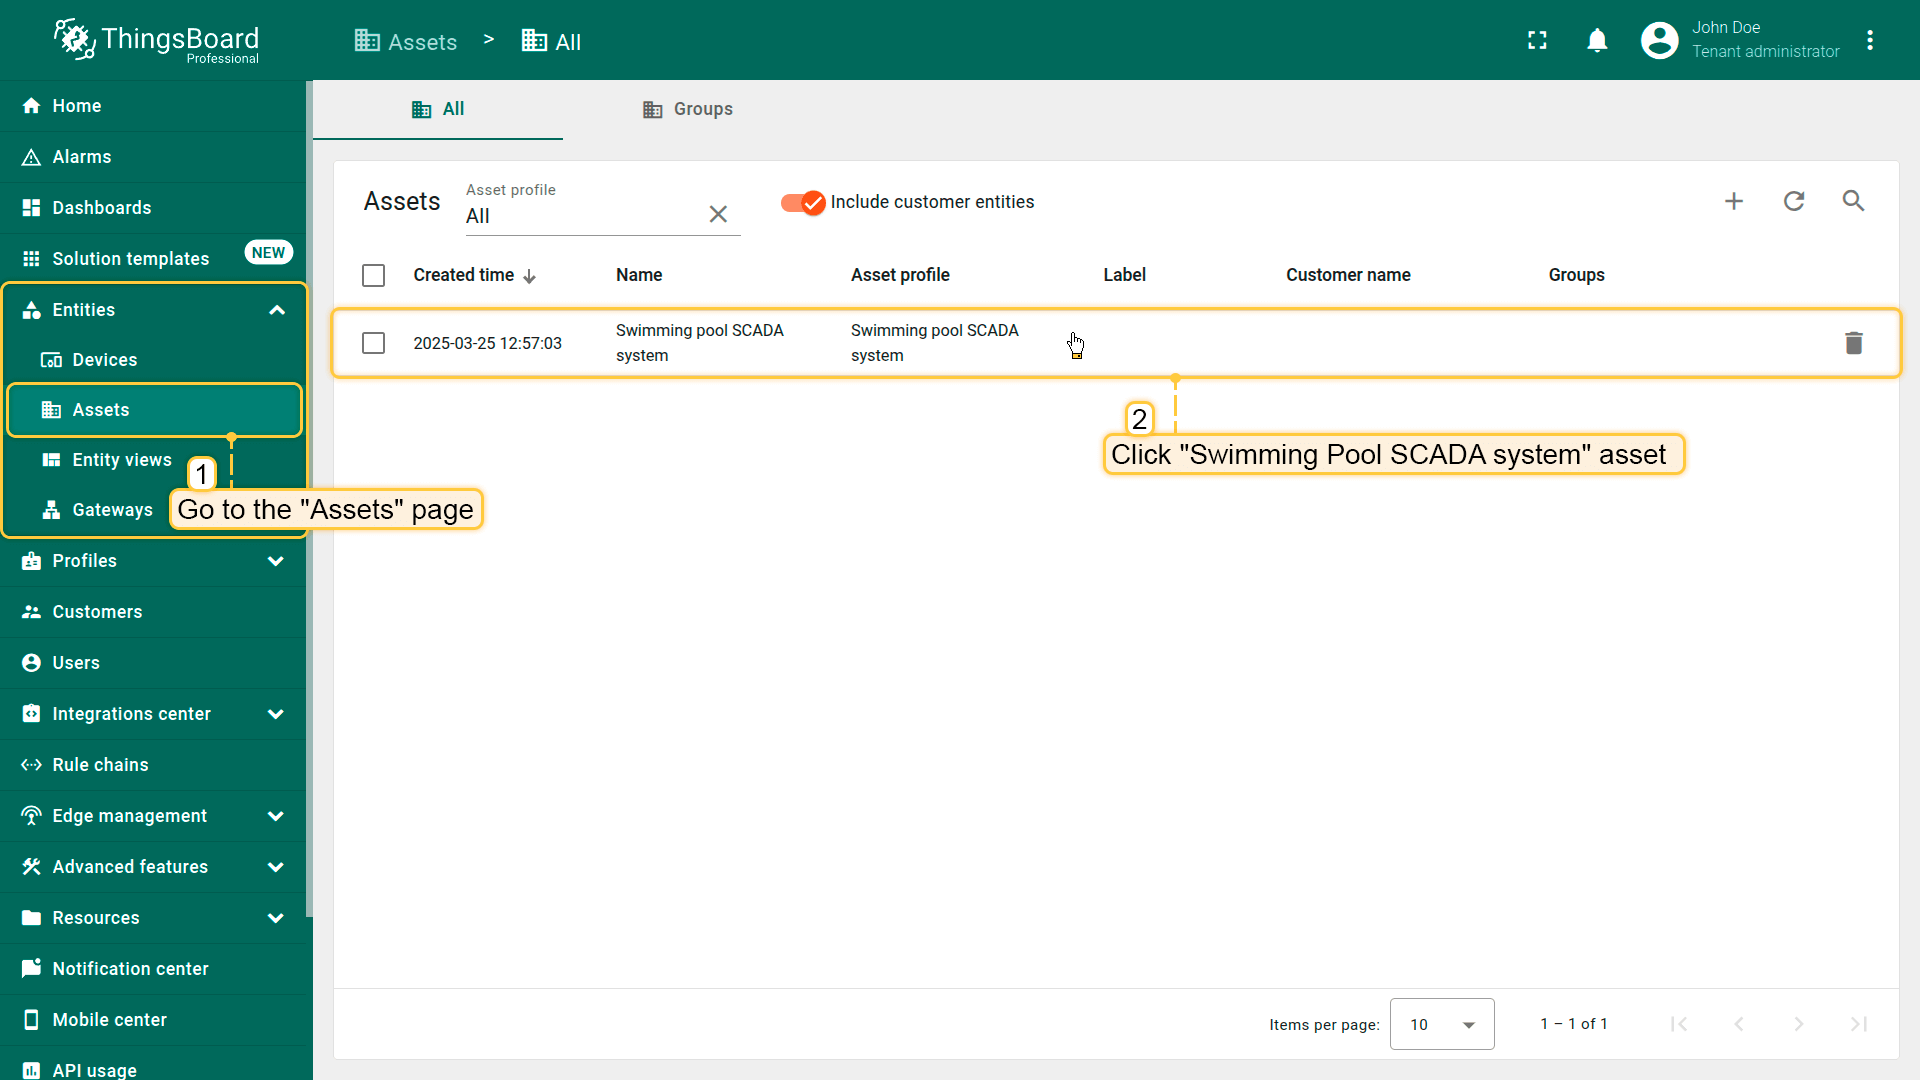
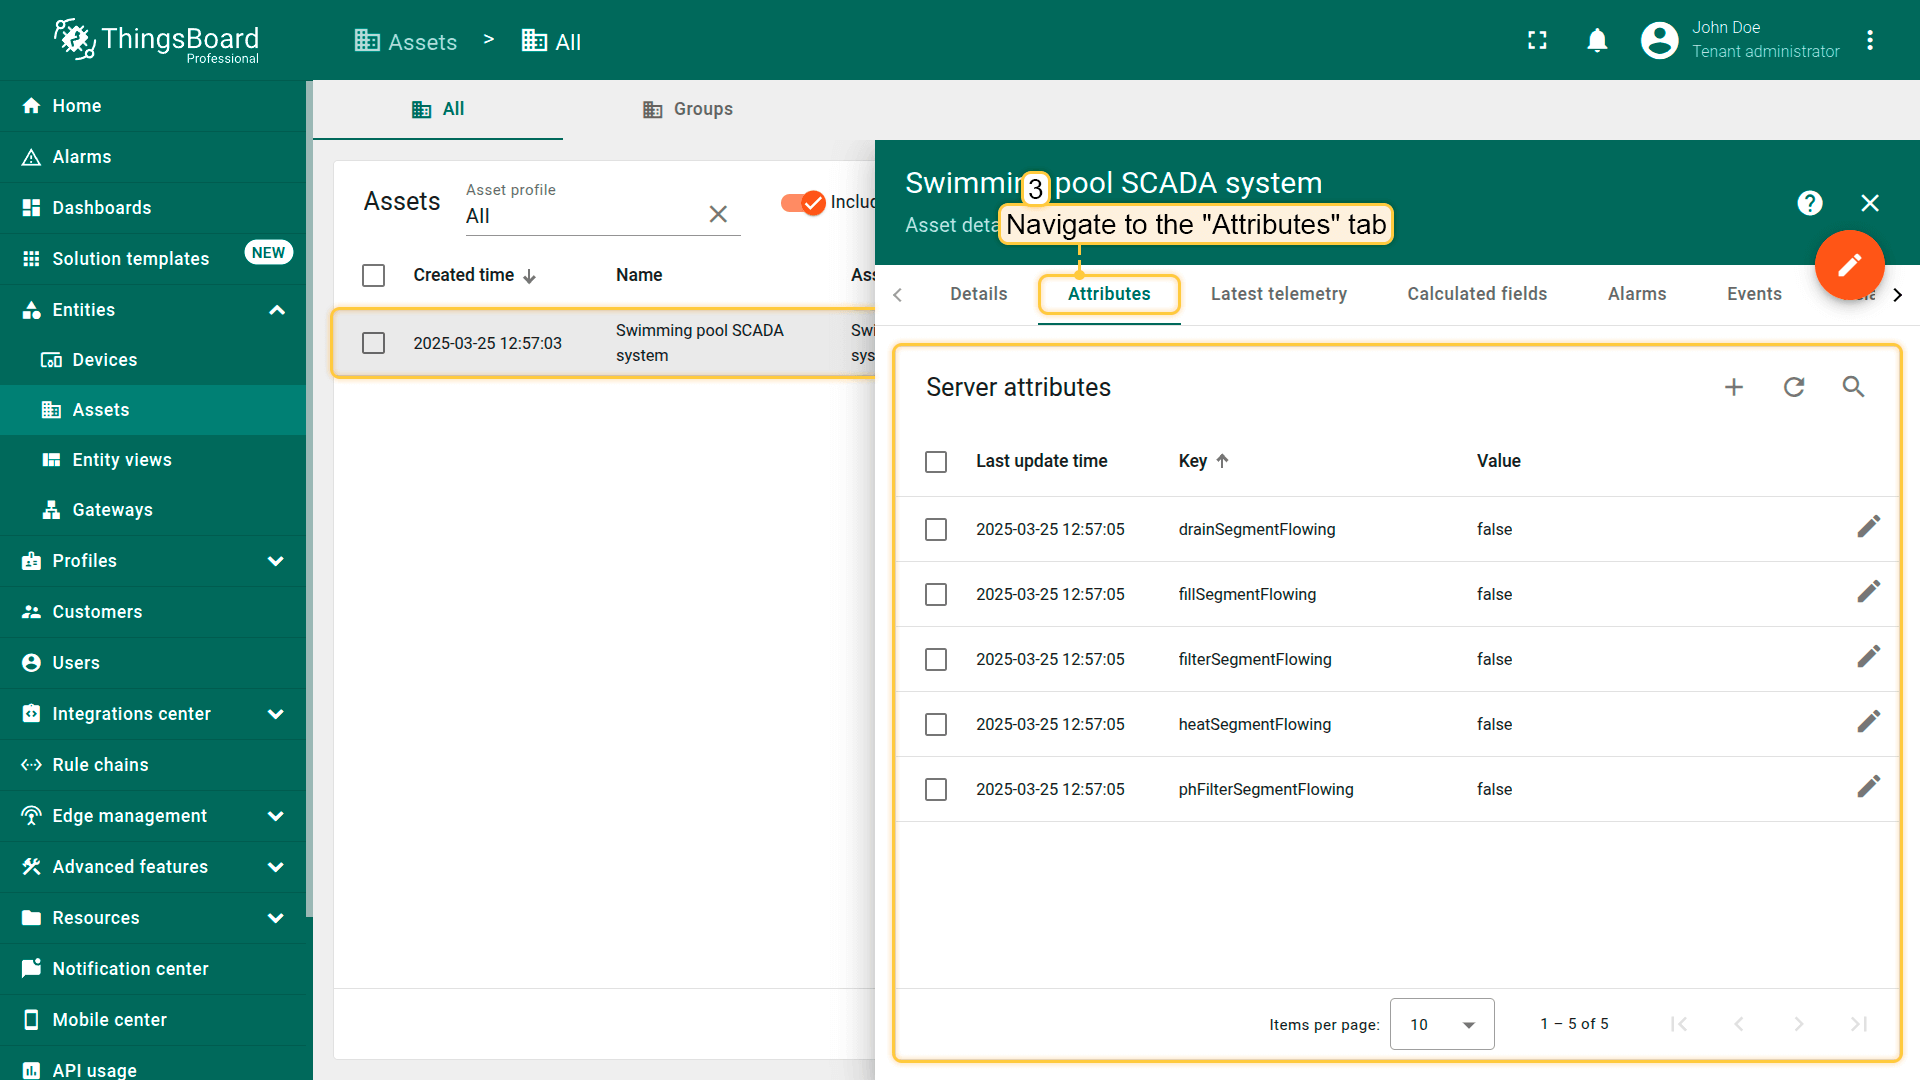
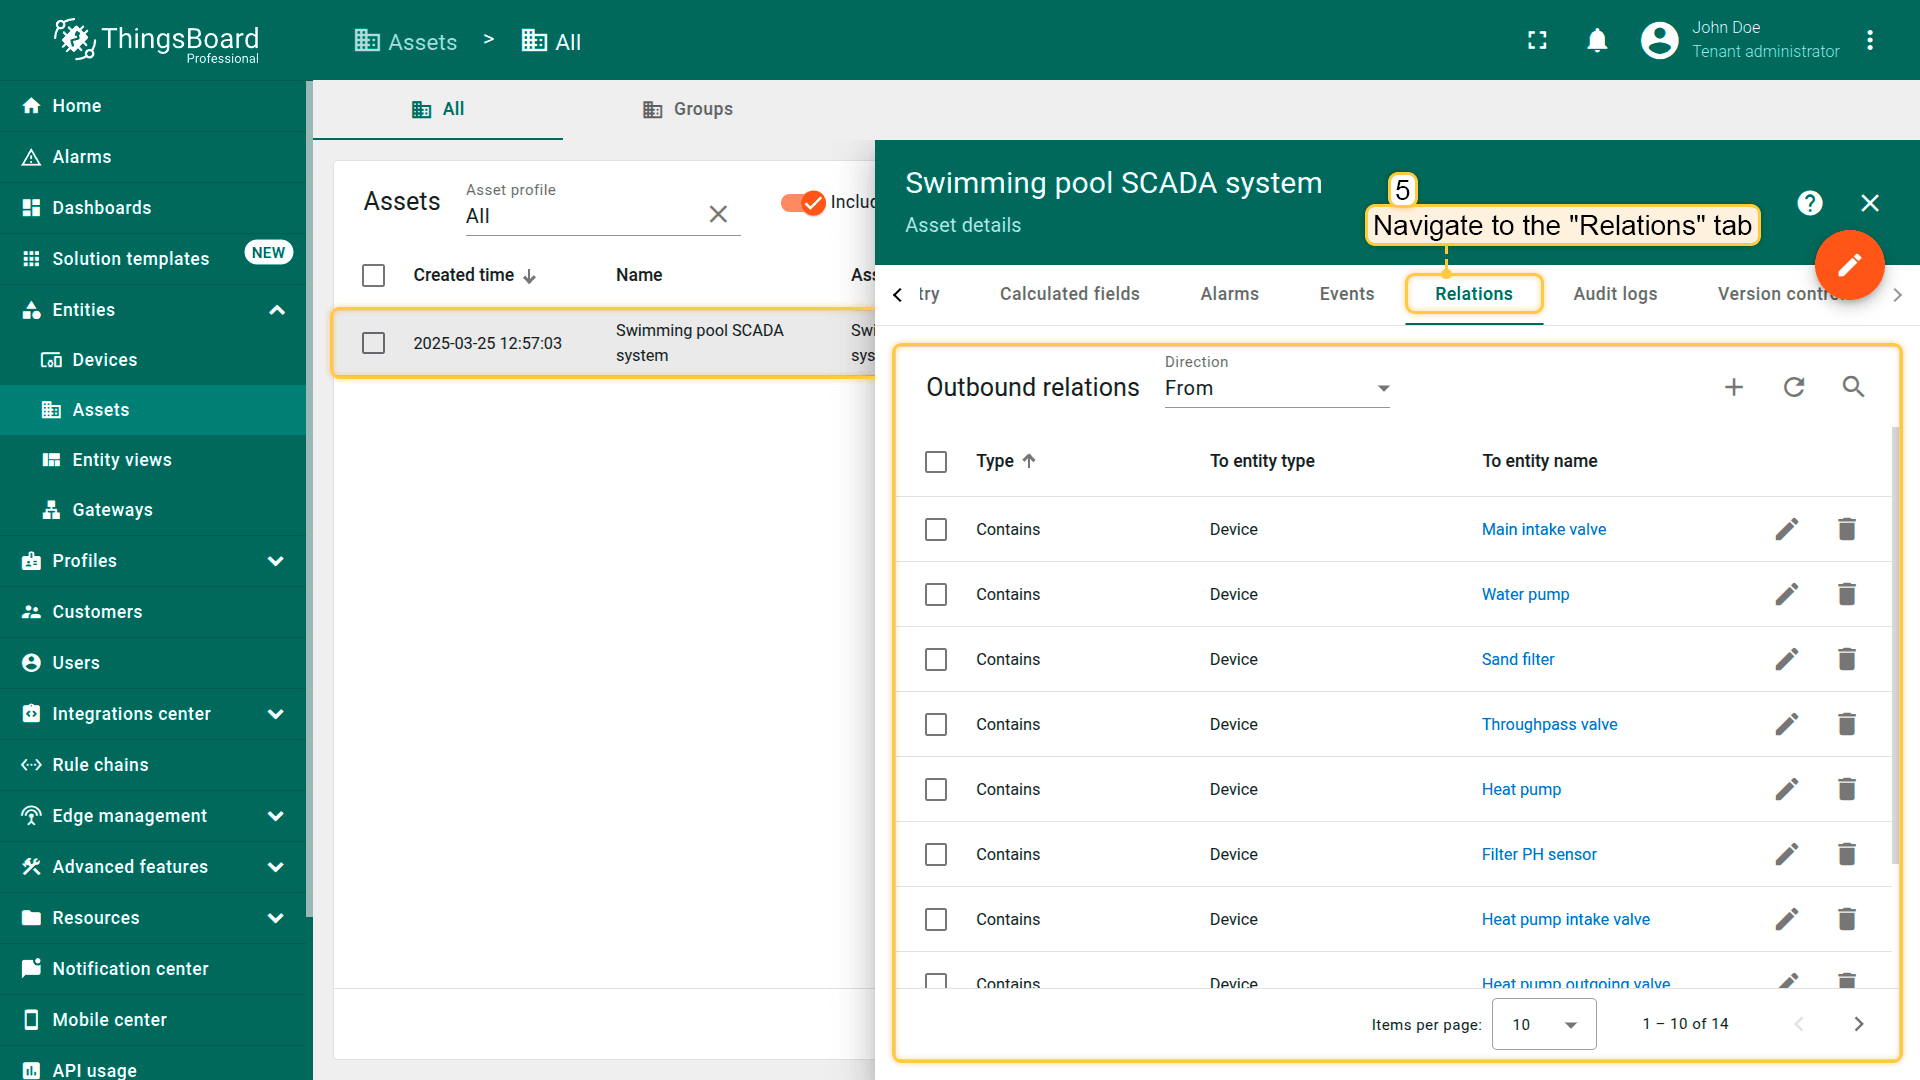
资产
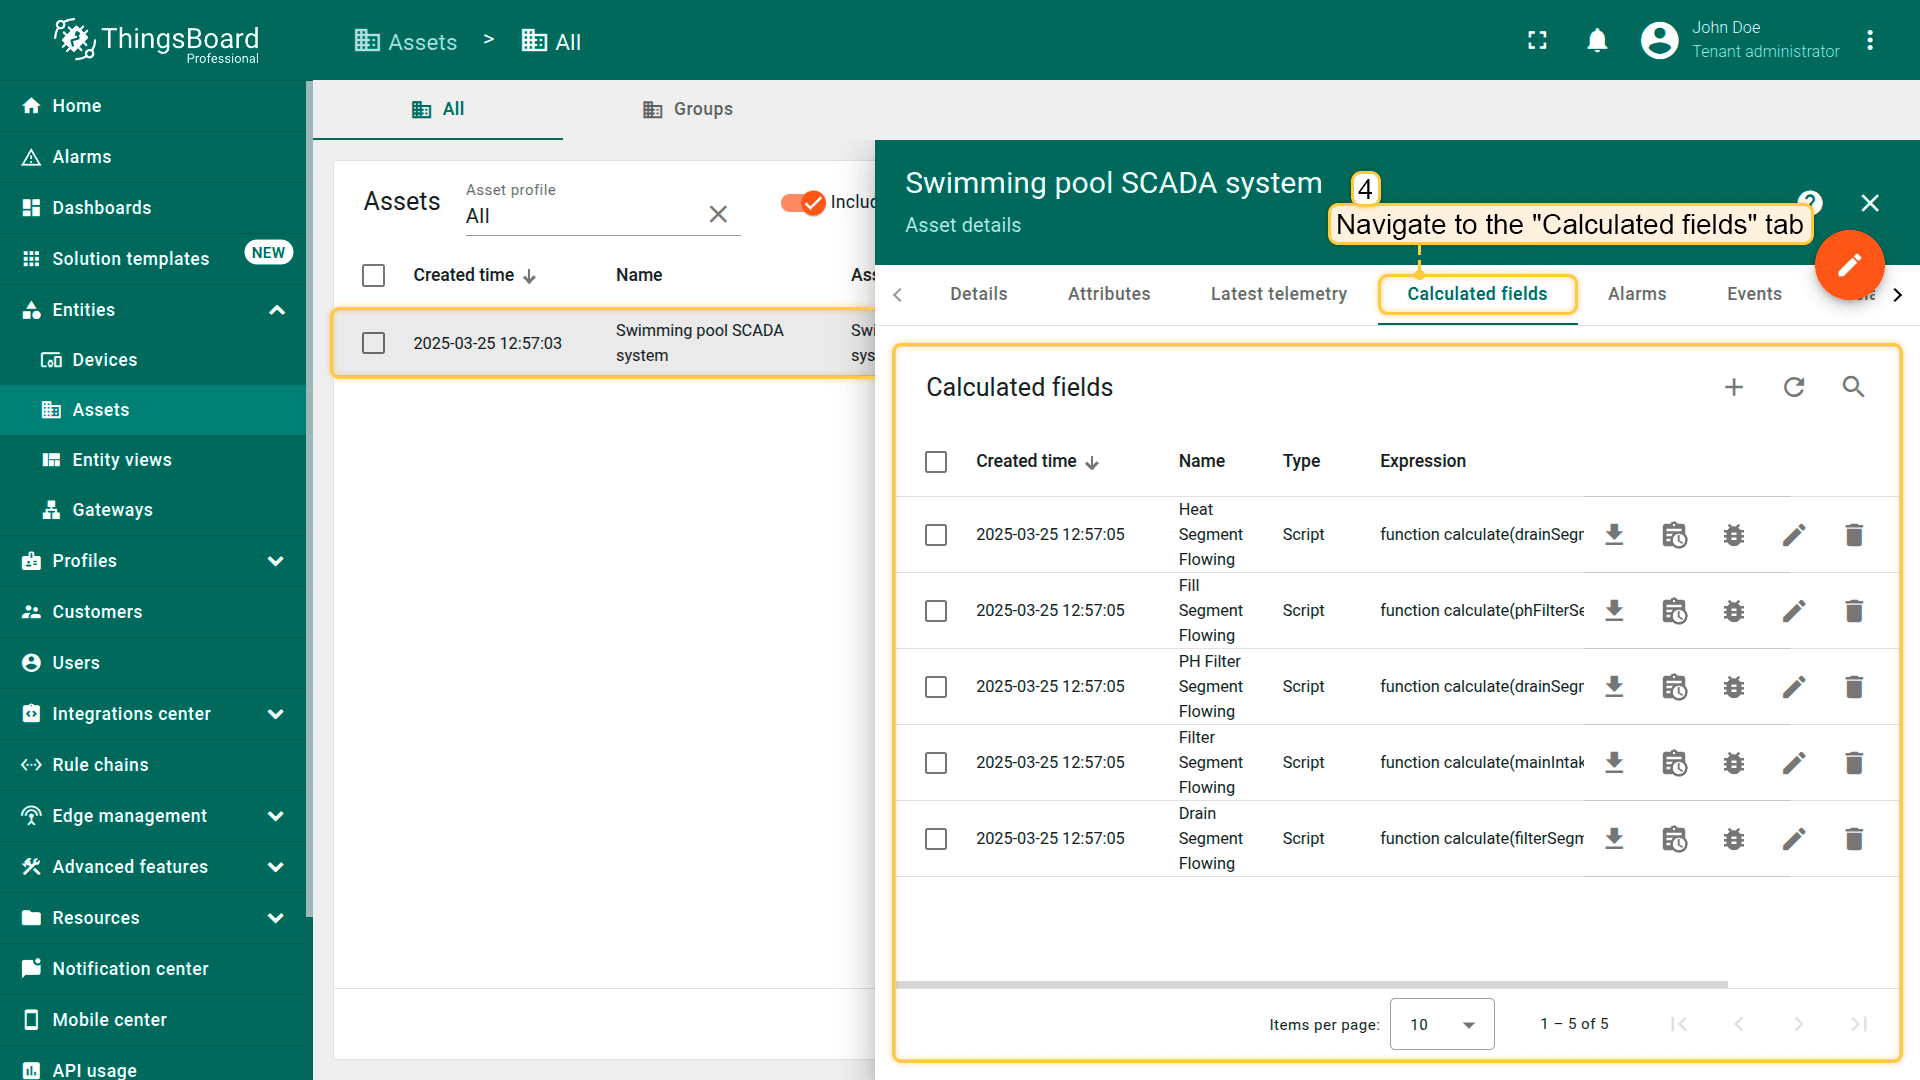
Swimming Pool SCADA系统包含一个名为SCADA Swimming Pool system的资产。该资产作为从所有连接设备采集并处理数据的中心枢纽。 资产采集的数据通过字段计算处理,随后用于监测与控制各系统组件,包括判断各管道是否在流水的计算。 数据在仪表板上可视化,允许用户与设备交互并控制设备,同时实时监测系统绩效。
网关
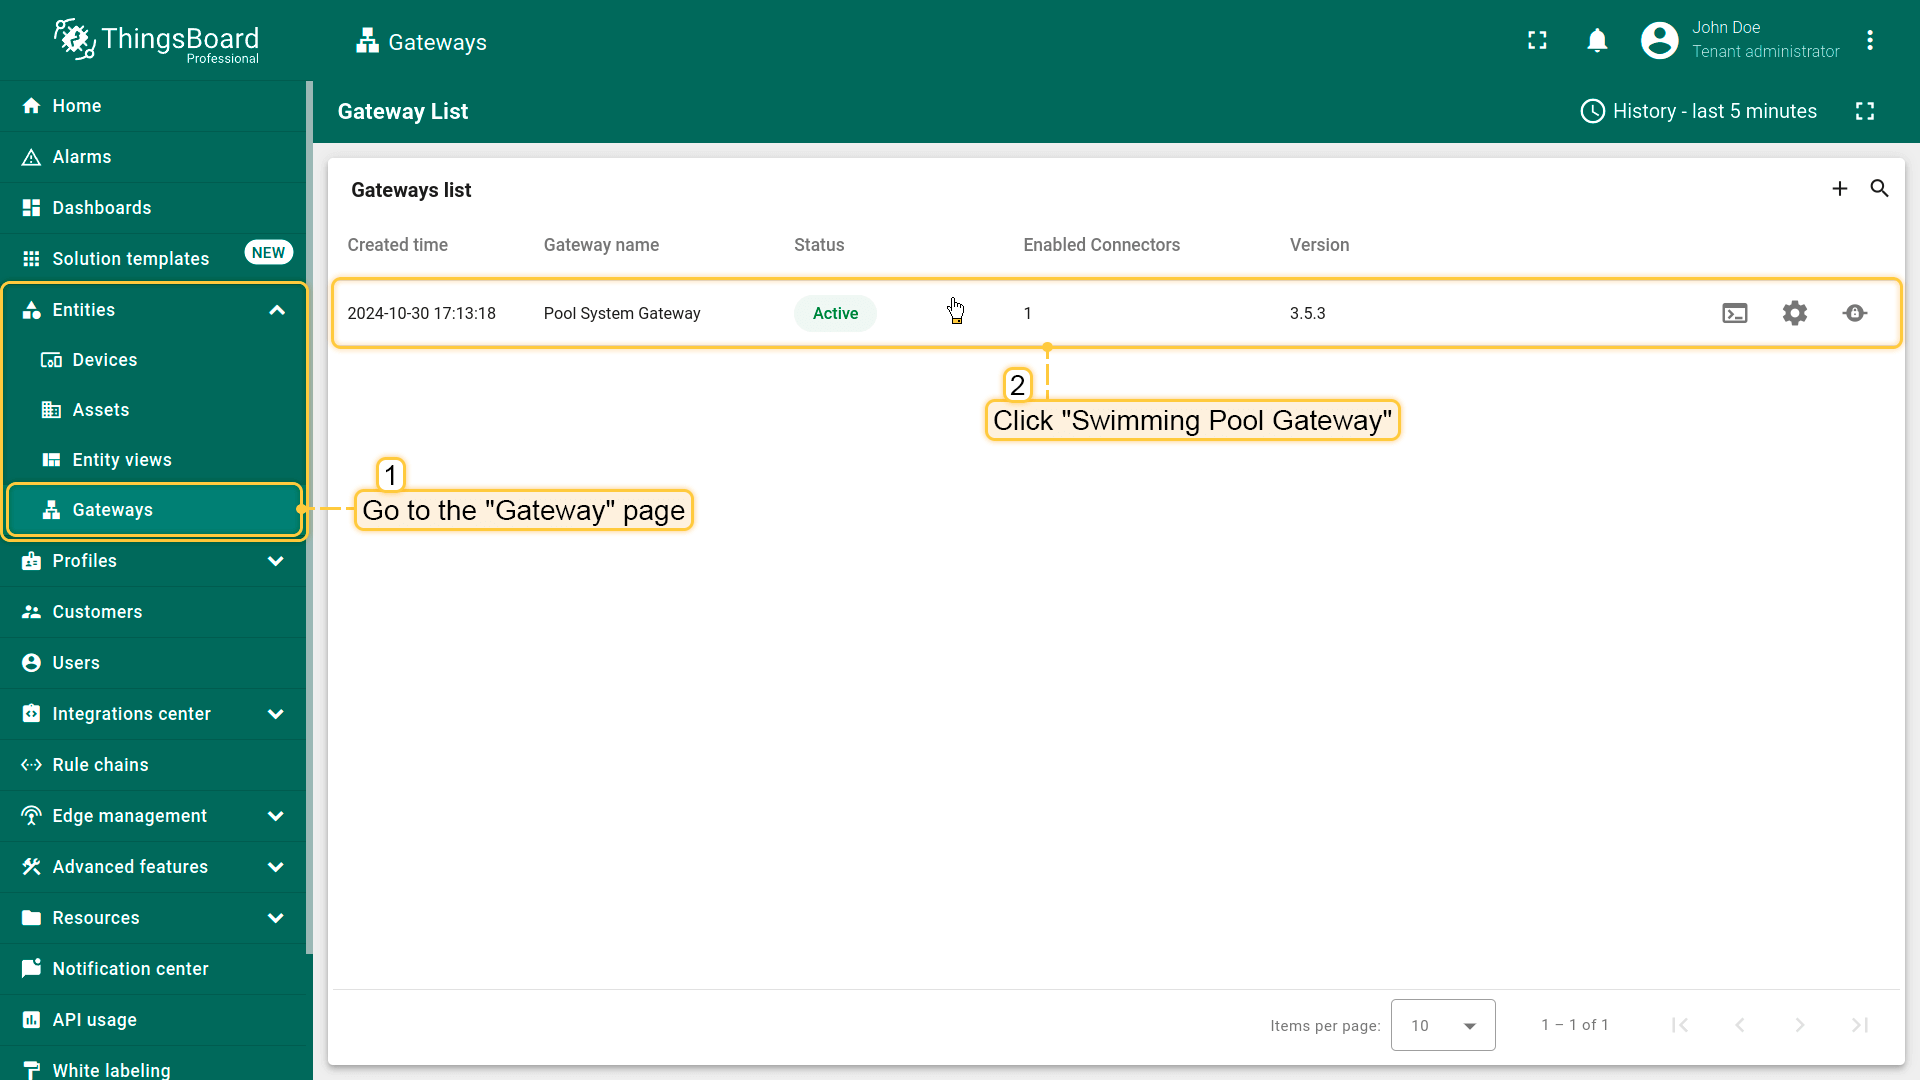
ThingsBoard IoT Gateway将设备集成至ThingsBoard的SCADA系统,确保连接与数据传输顺畅。 “Pool System Gateway”网关配置可在Entities部分的Gateways页面访问。
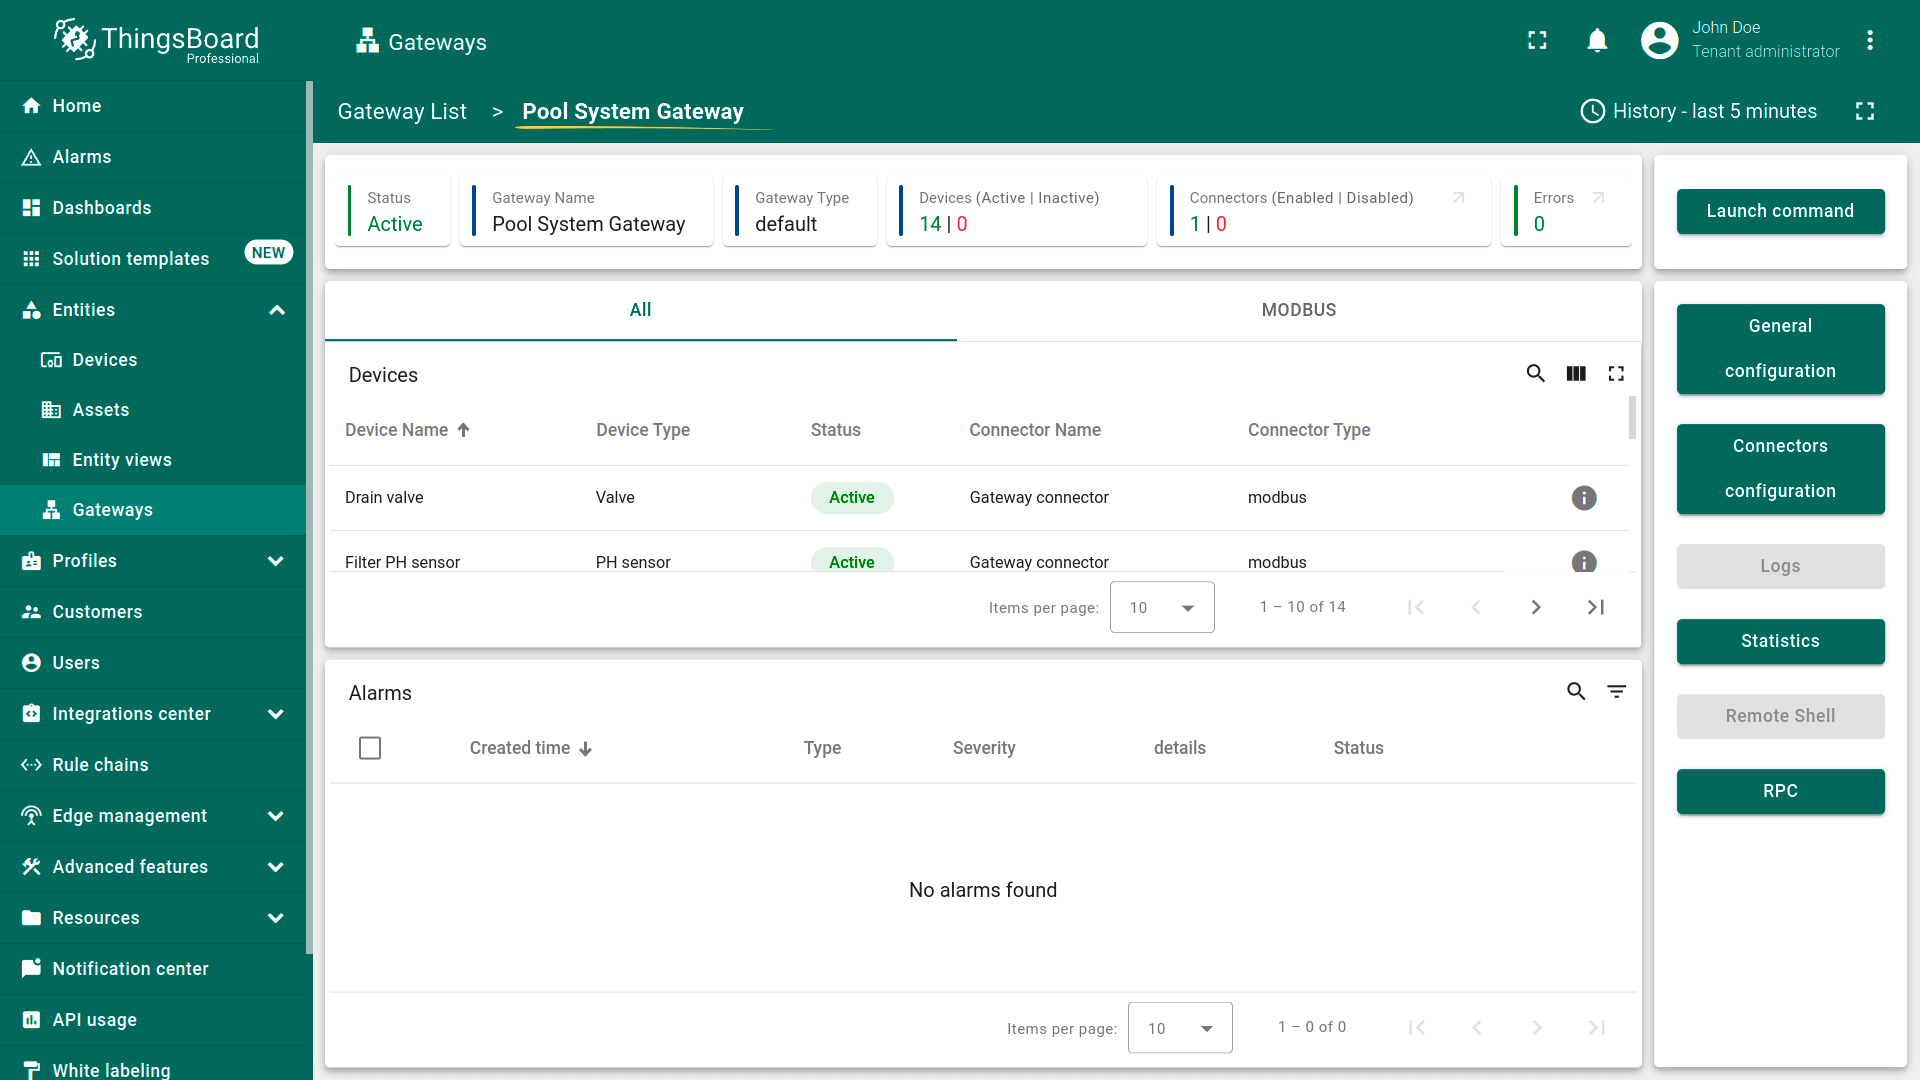
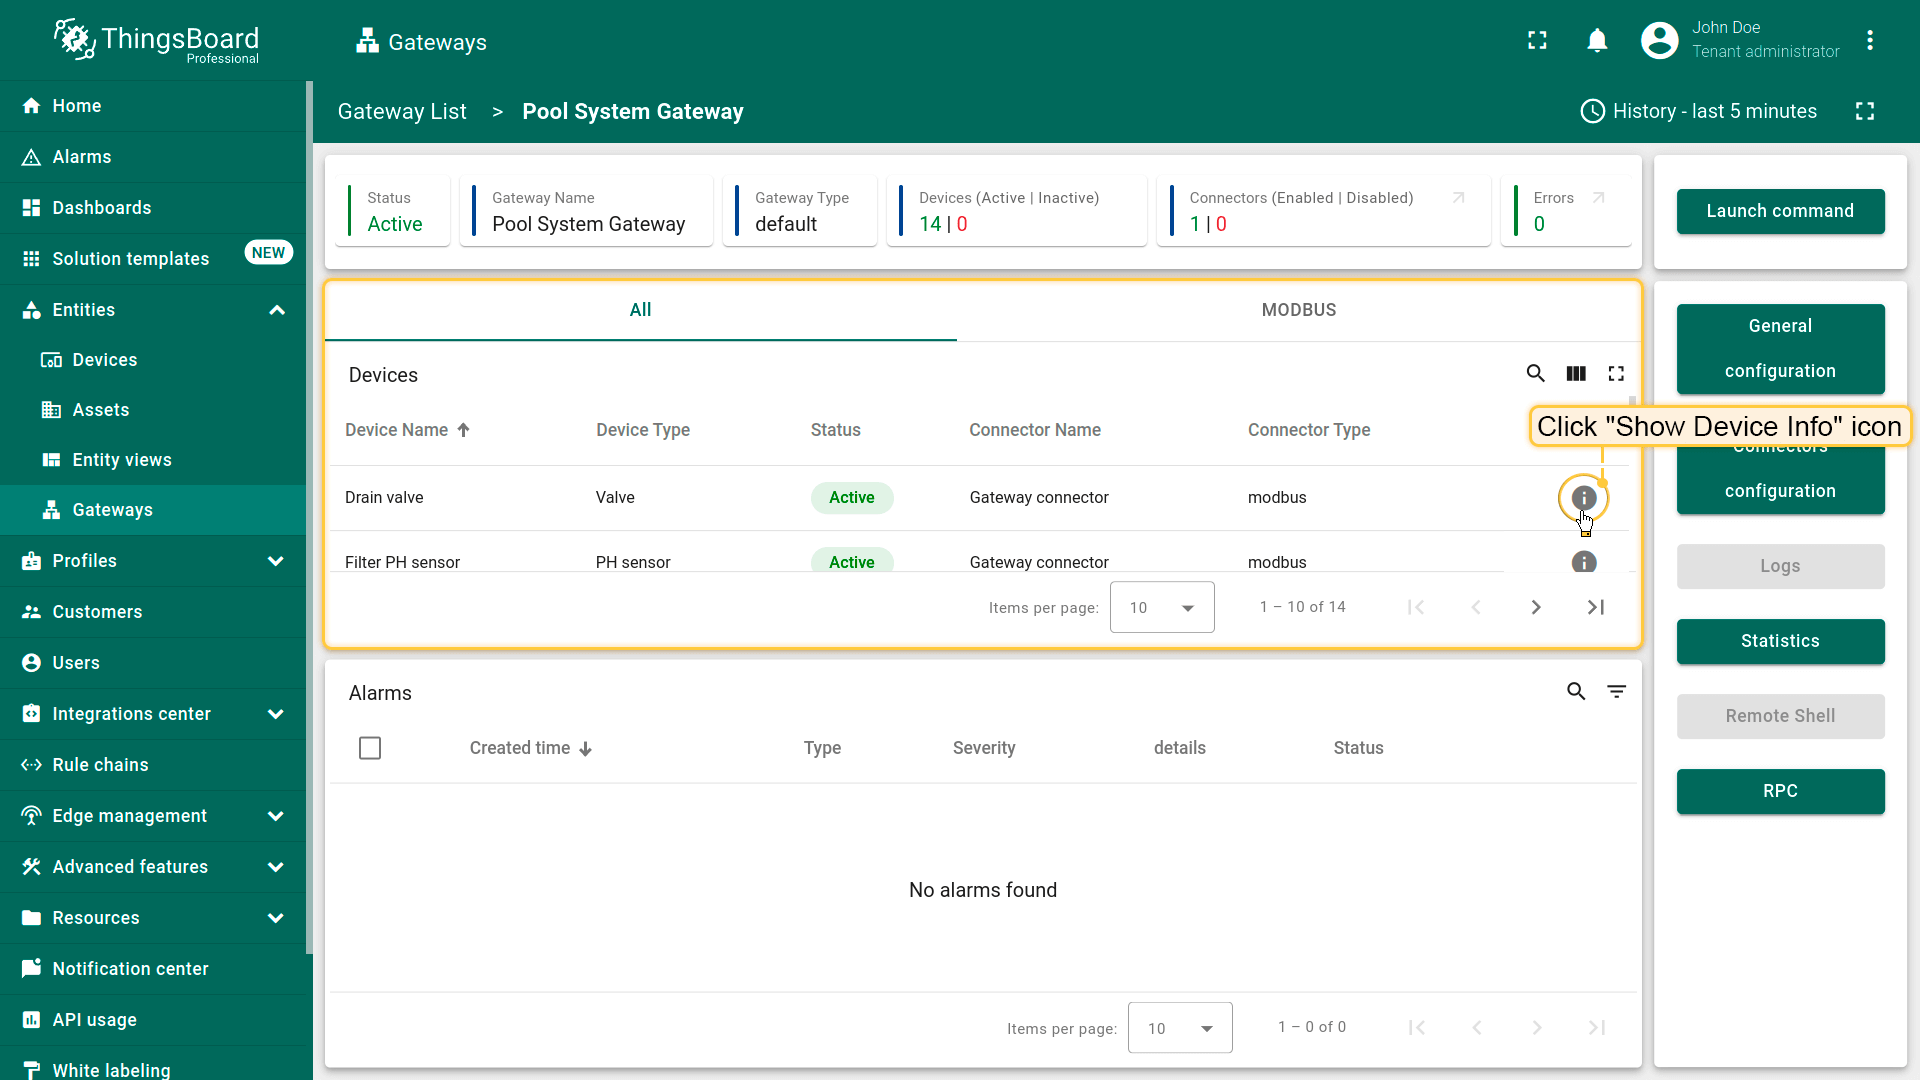
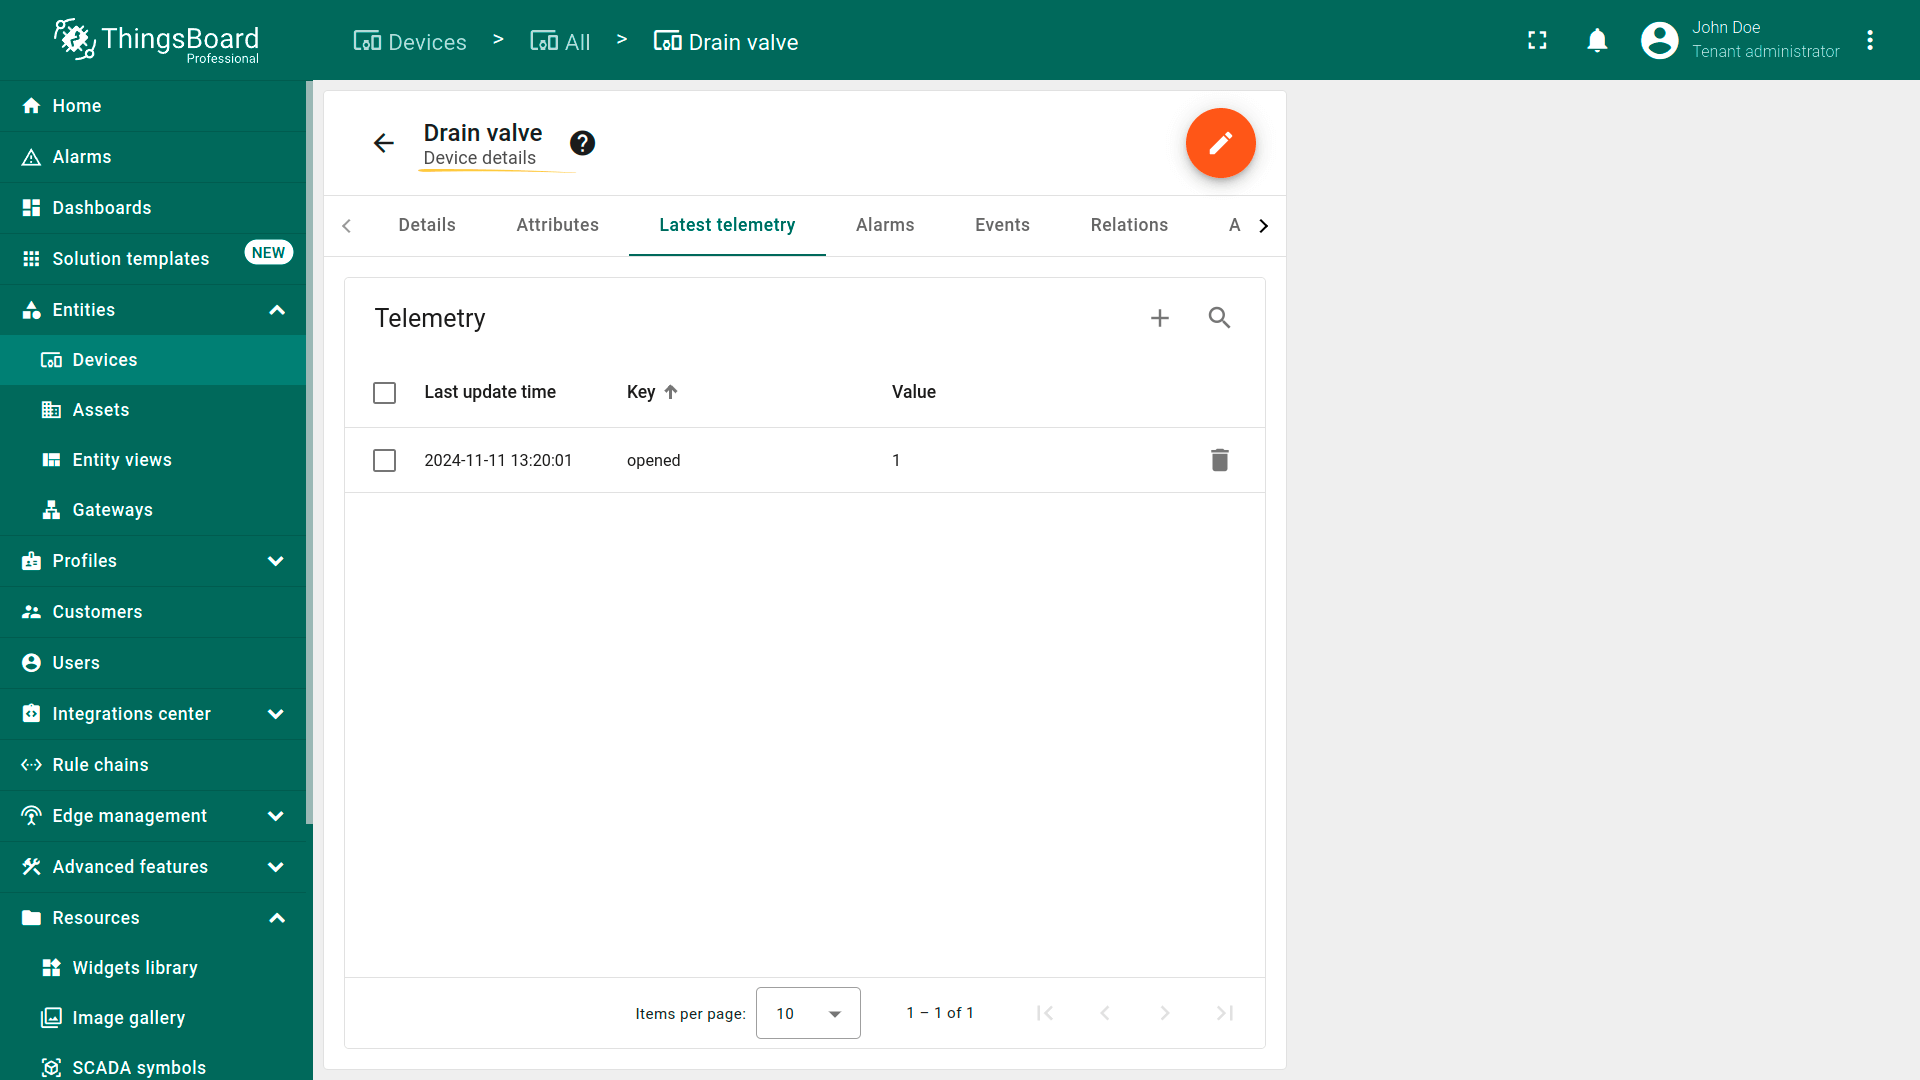
Pool System Gateway显示连接的设备及其状态。点击设备旁的“Show Device Info”图标可查看包含状态与相关指标在内的详细信息。
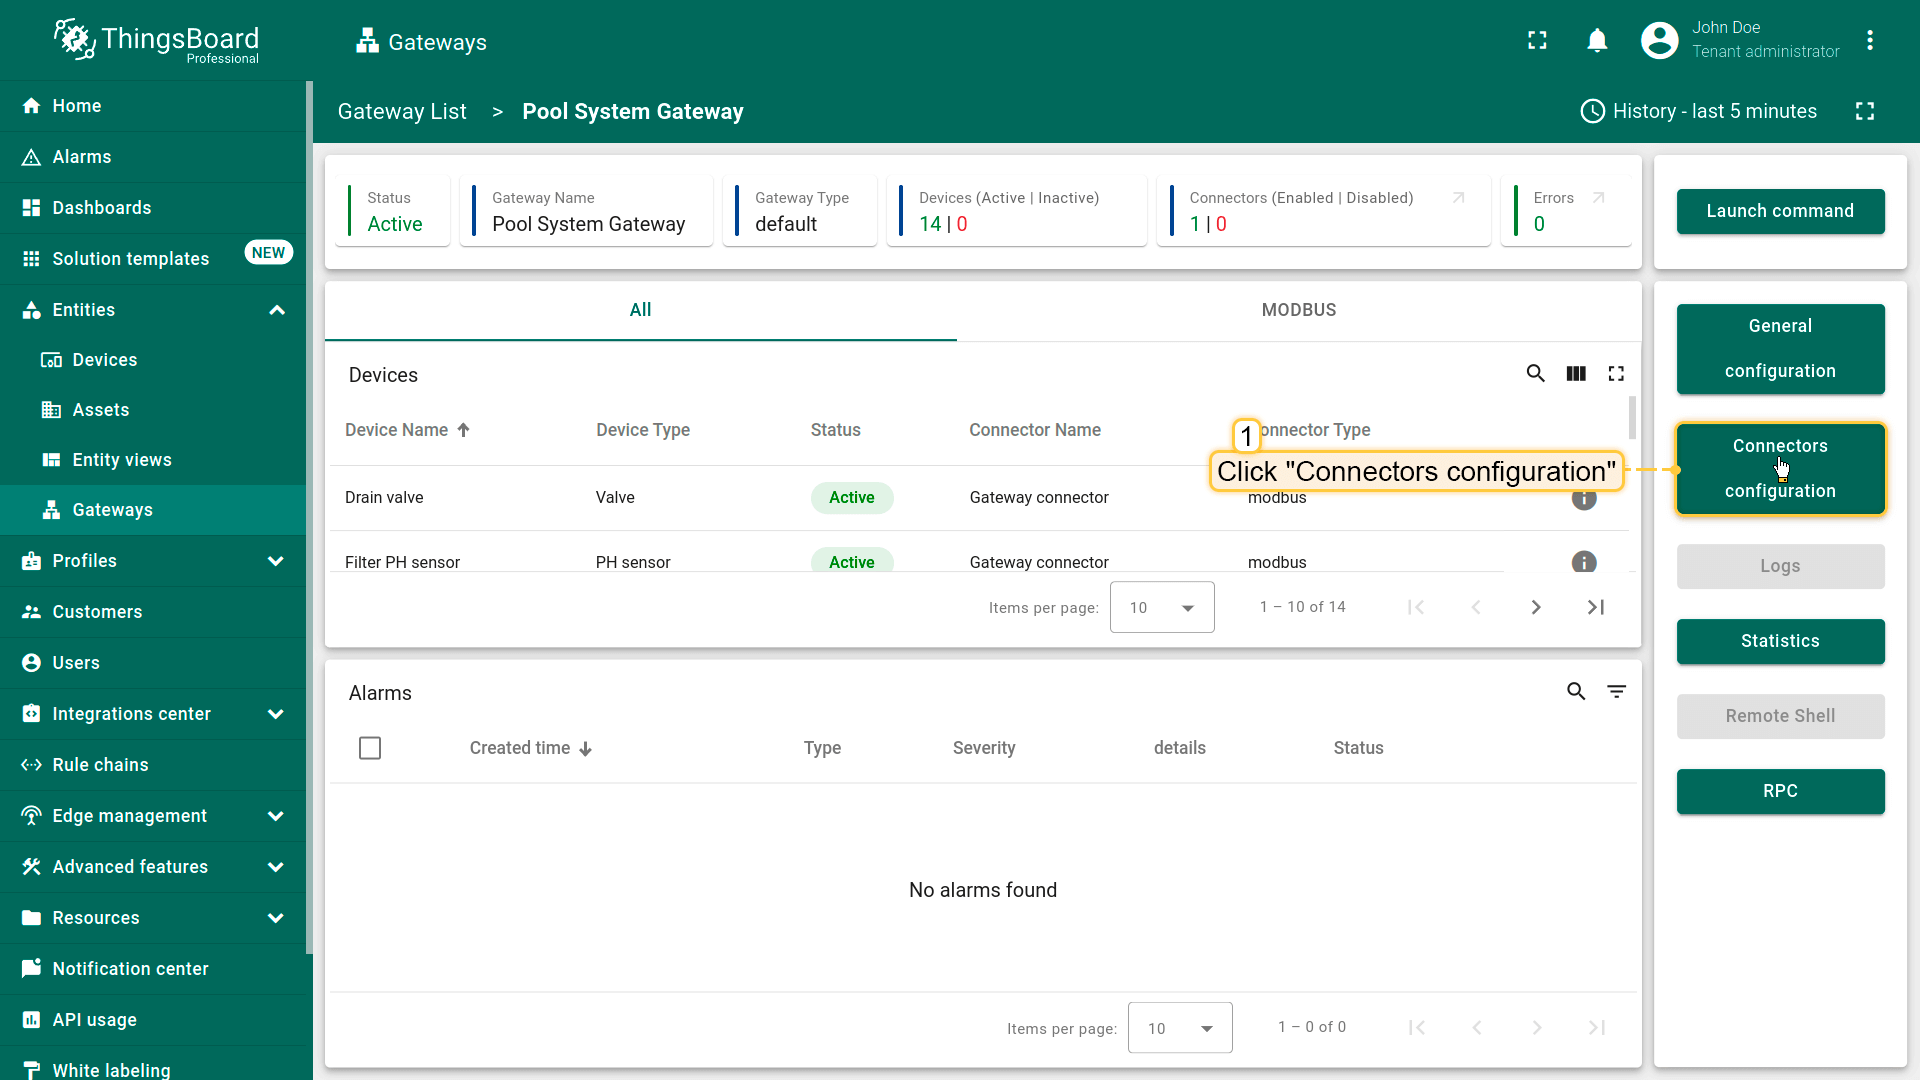
连接器配置
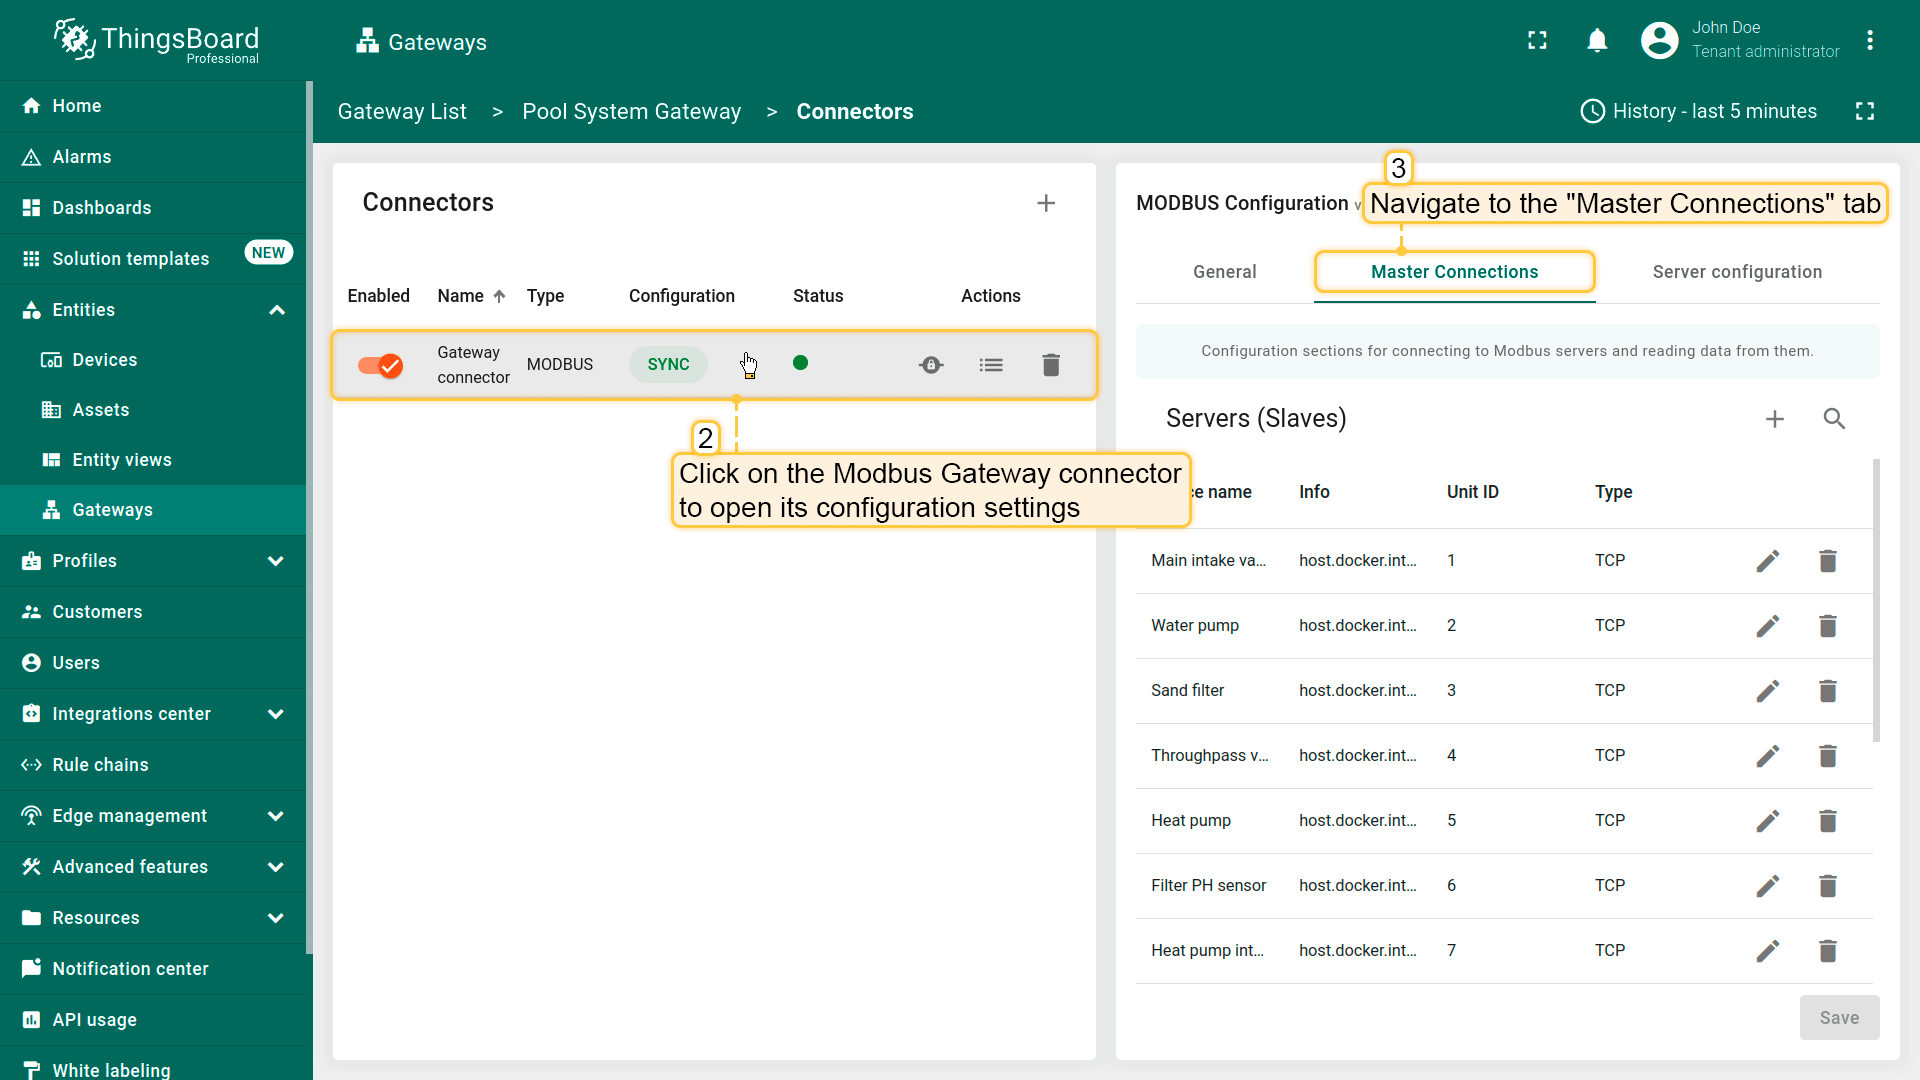
了解连接器设置。点击Connectors configuration按钮显示可用连接器。点击Pool Connector打开其配置。 在Master Connections标签页中可找到连接设备至Modbus服务器的连接参数及各设备的数据处理设置。
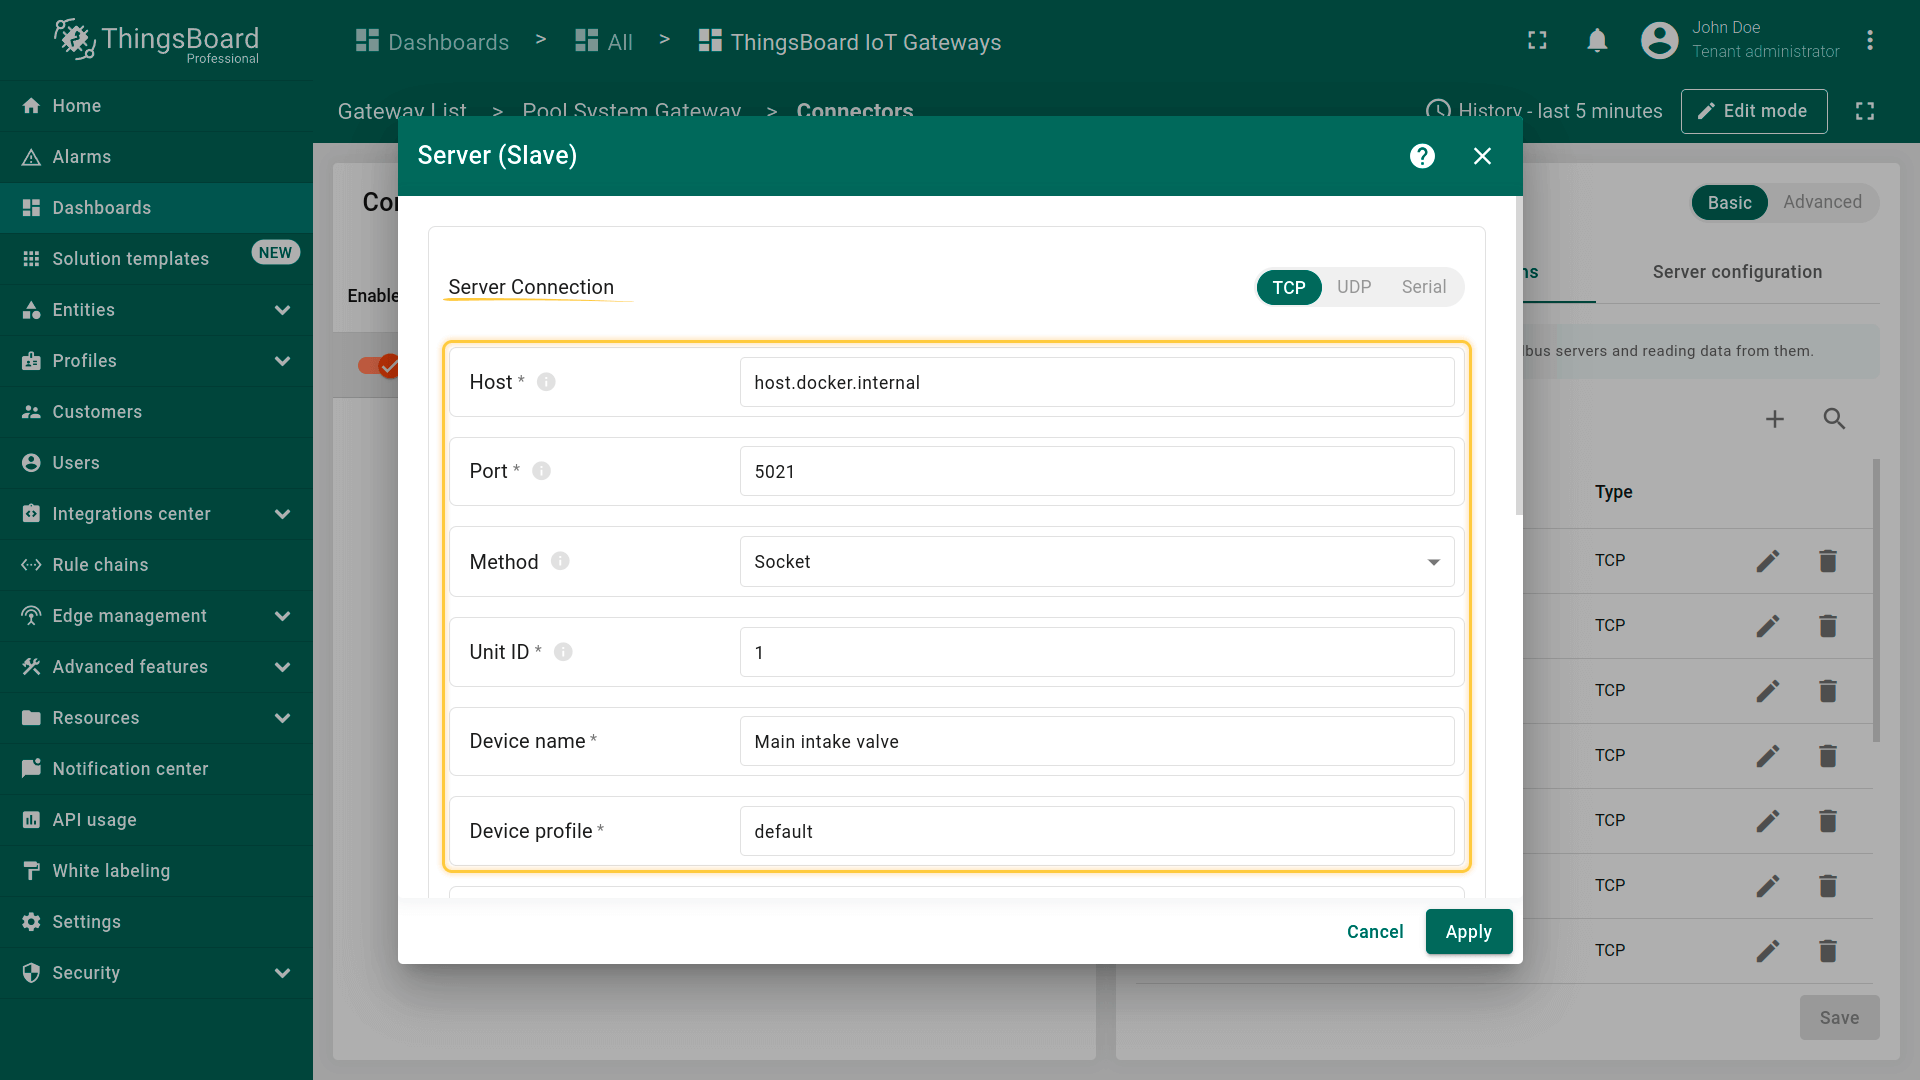
我们以”Main intake valve”设备为例查看配置参数。点击设备名称旁的铅笔图标打开设置窗口。
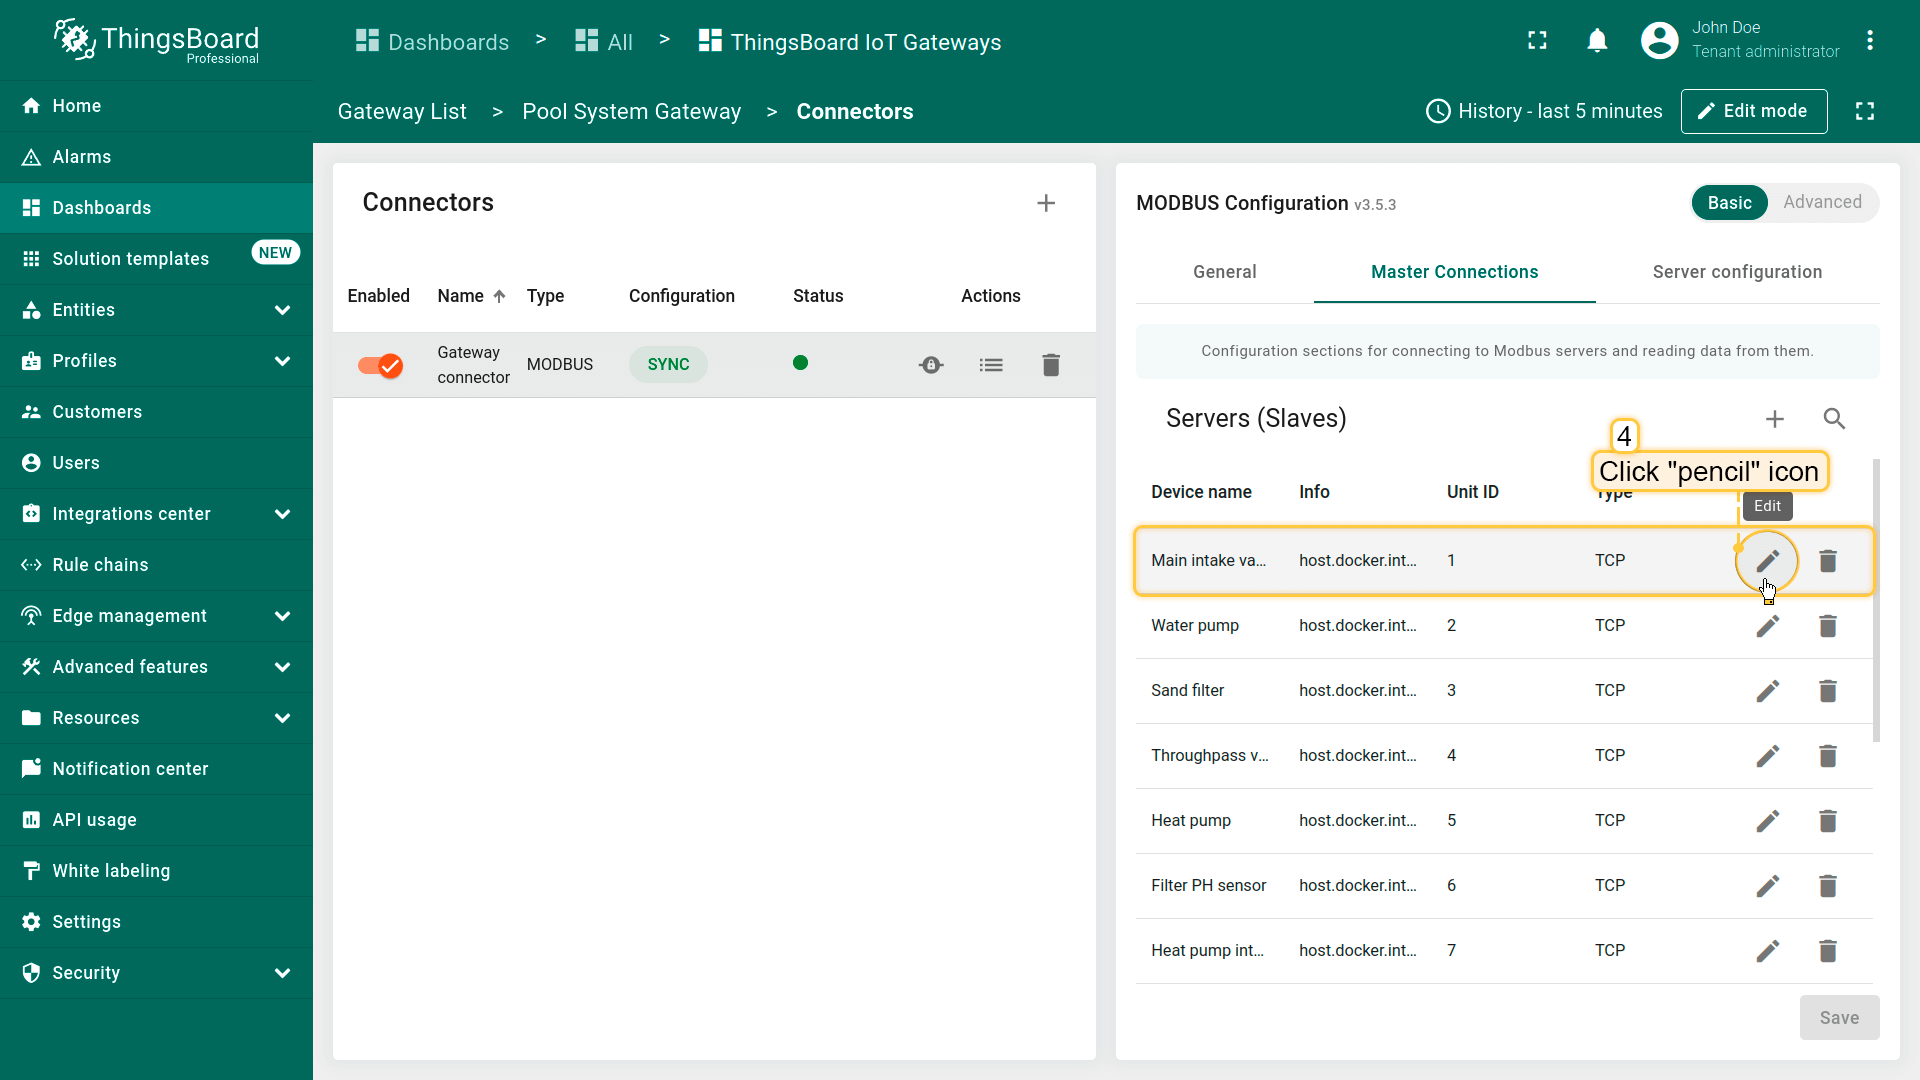
本模板使用仿真器模拟设备及其遥测数据。
主机host.docker.internal和端口5021针对您的Modbus设备。若要连接真实设备,请将主机与端口替换为实际值。
Method、Unit ID等其他参数的详细说明请参见Modbus Connector配置页面。
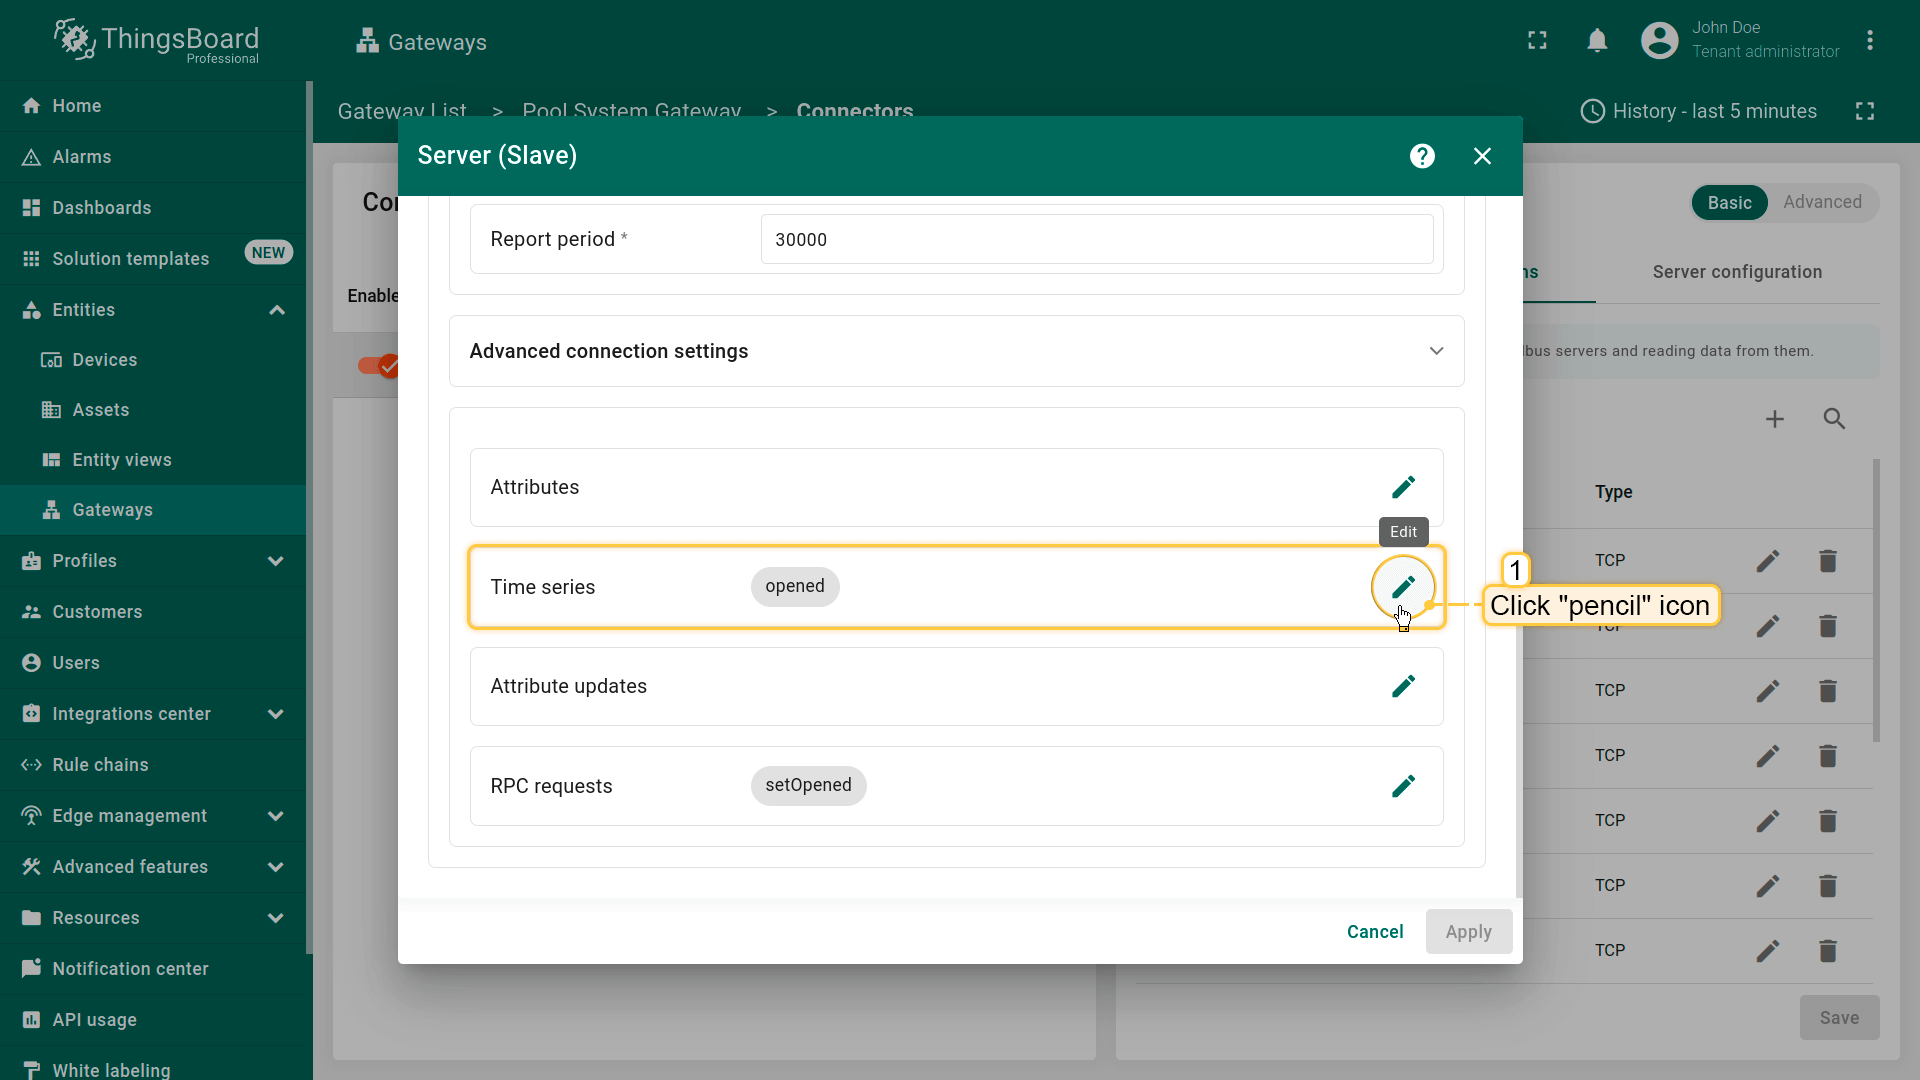
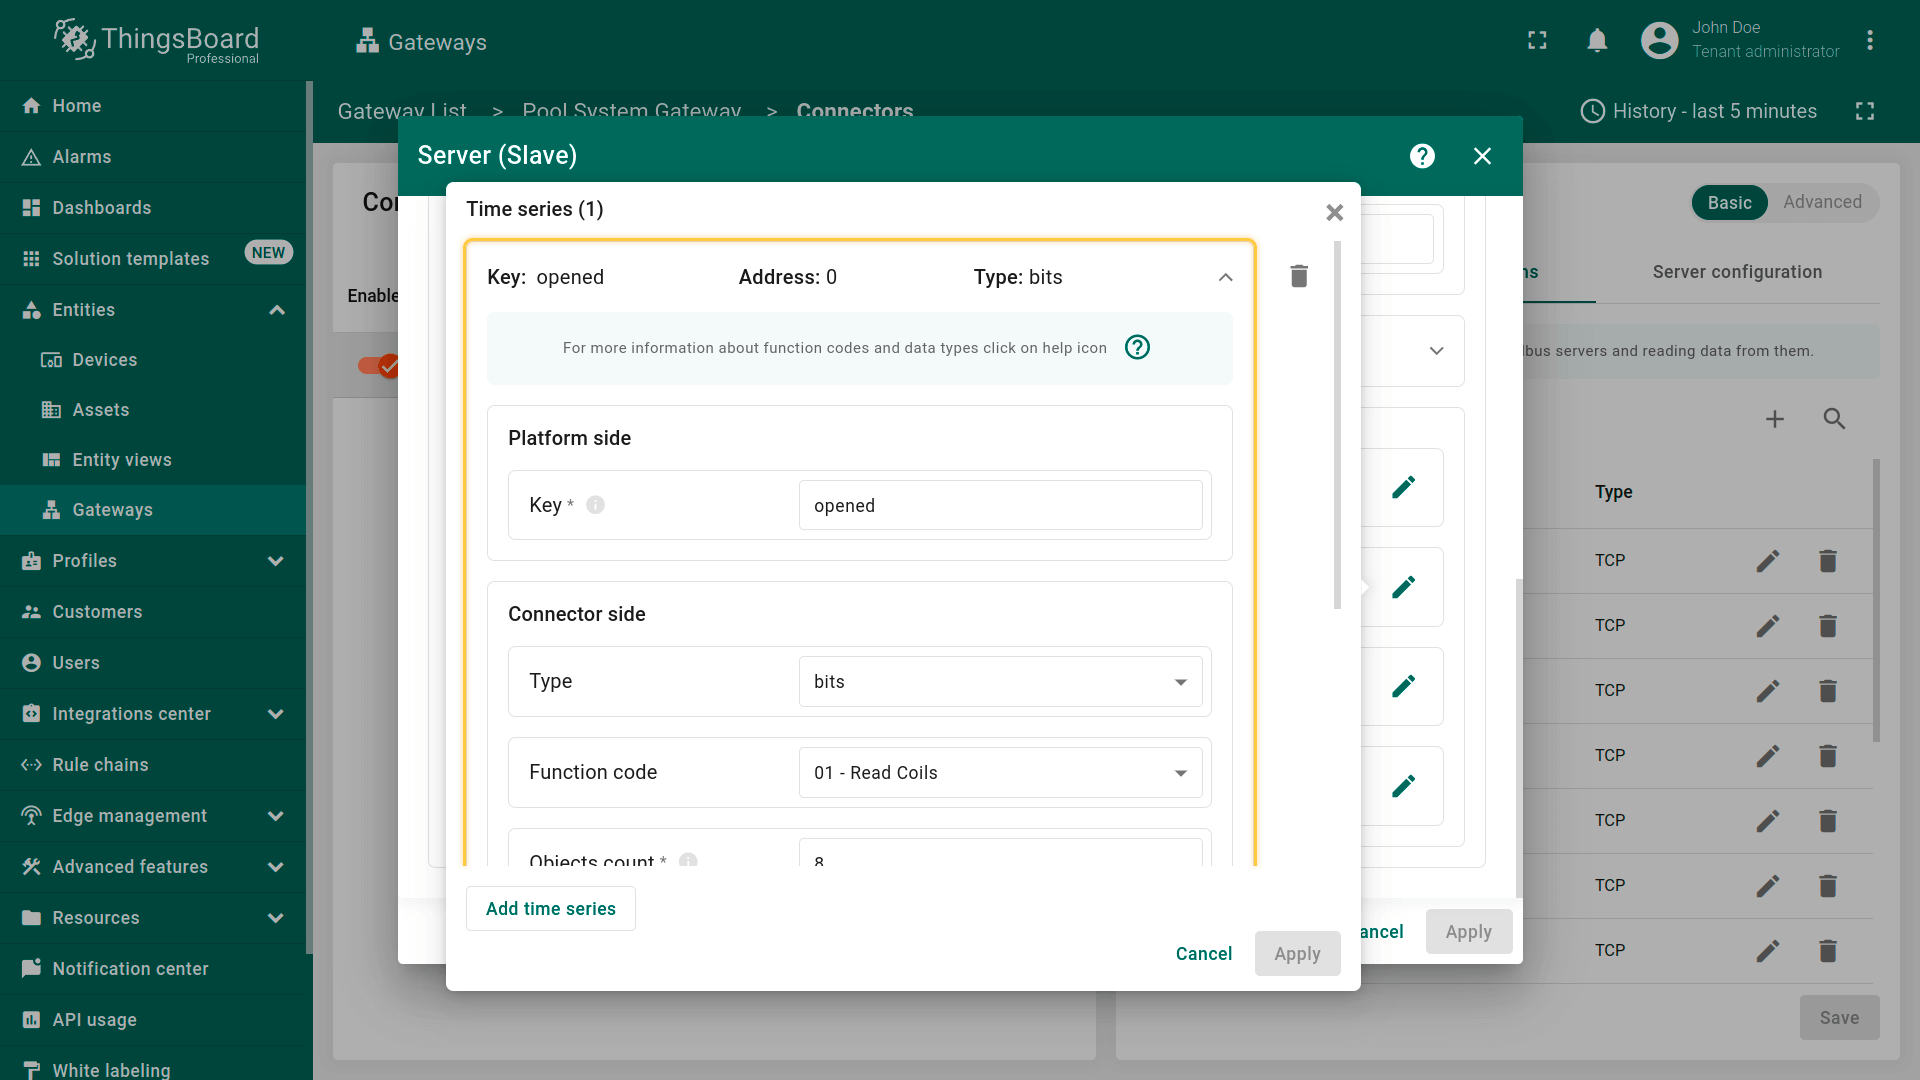
滚动至”Time series”部分。此处可配置入站数据的处理。这些设置将在ThingsBoard中解释为设备遥测数据。 点击铅笔图标打开时间序列配置。有关”Time series”部分各参数与设置的更多说明,请参阅Modbus time series设置文档。
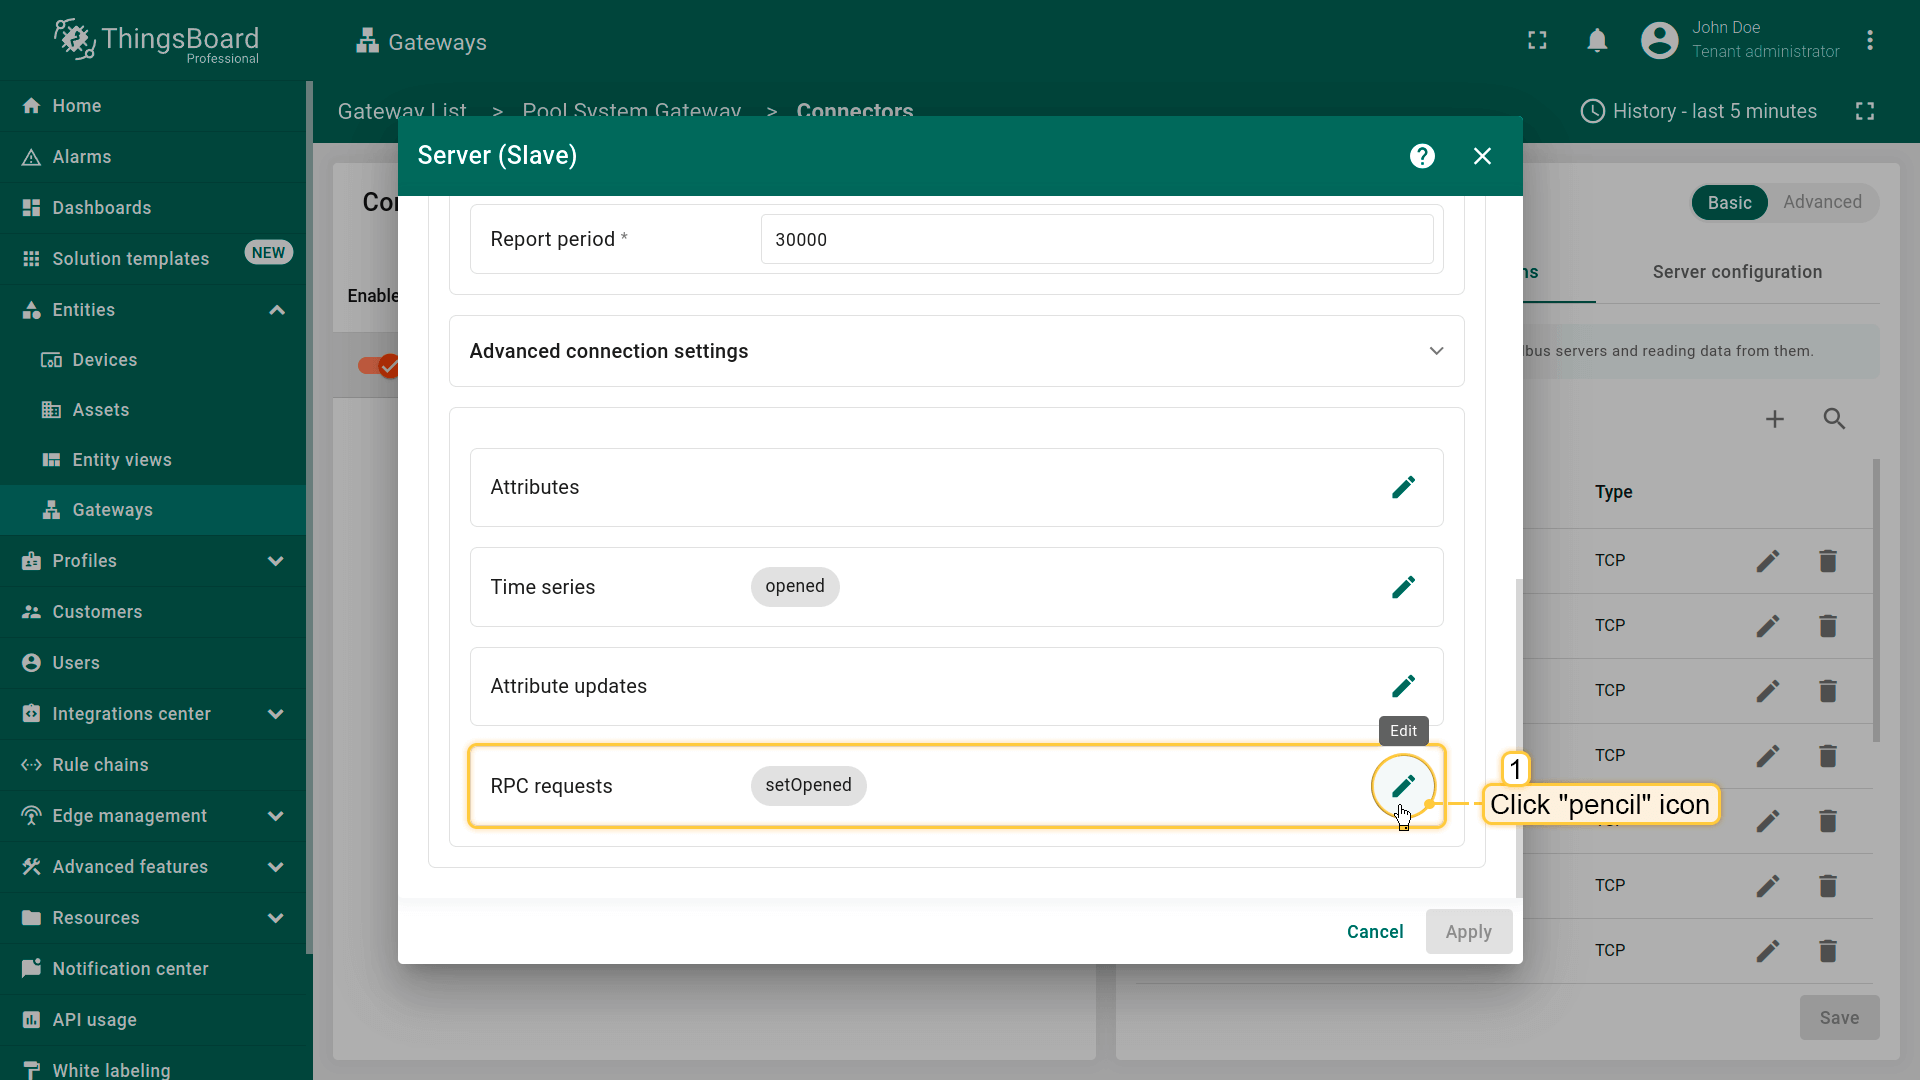
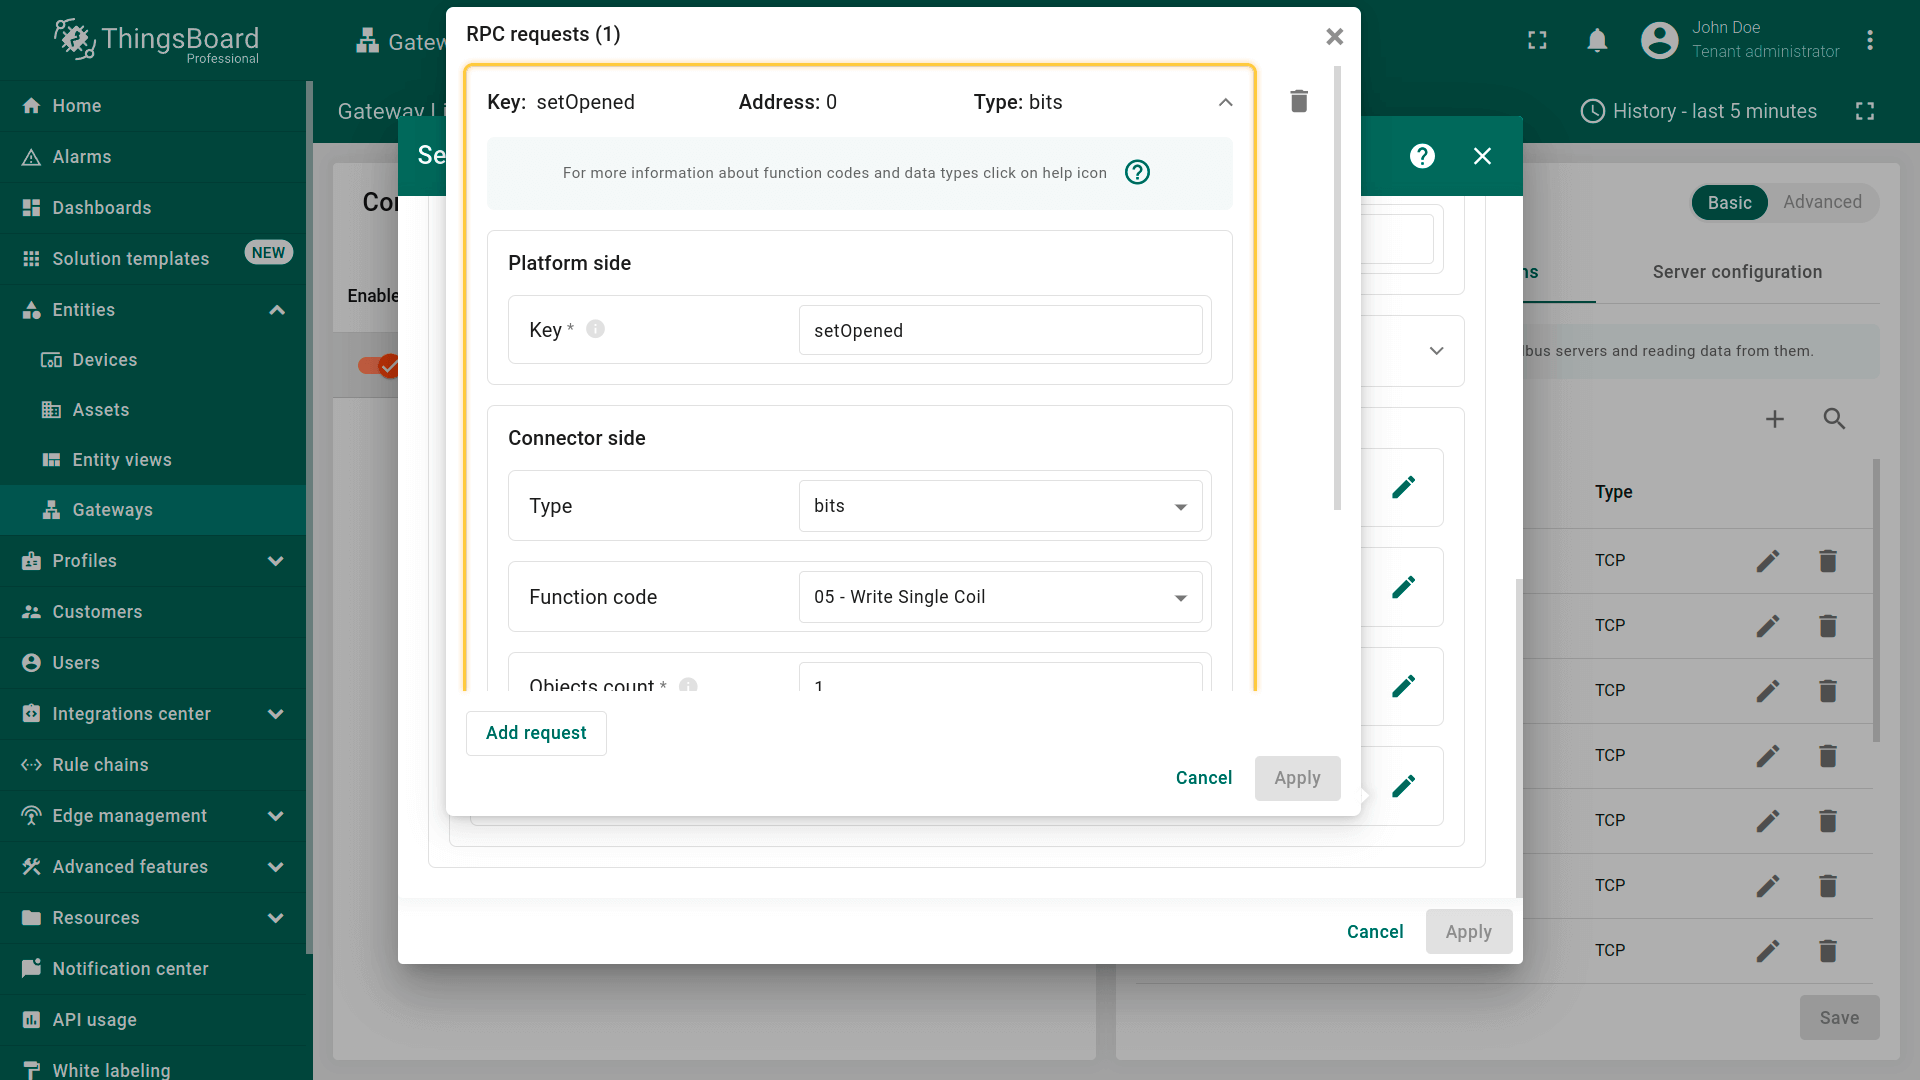
在”RPC Requests”部分可配置从ThingsBoard至设备的远程过程调用(RPC)参数。 该部分用于向设备发送命令并接收响应。 “RPC Requests”中各参数的详细说明请参阅Modbus RPC设置文档。
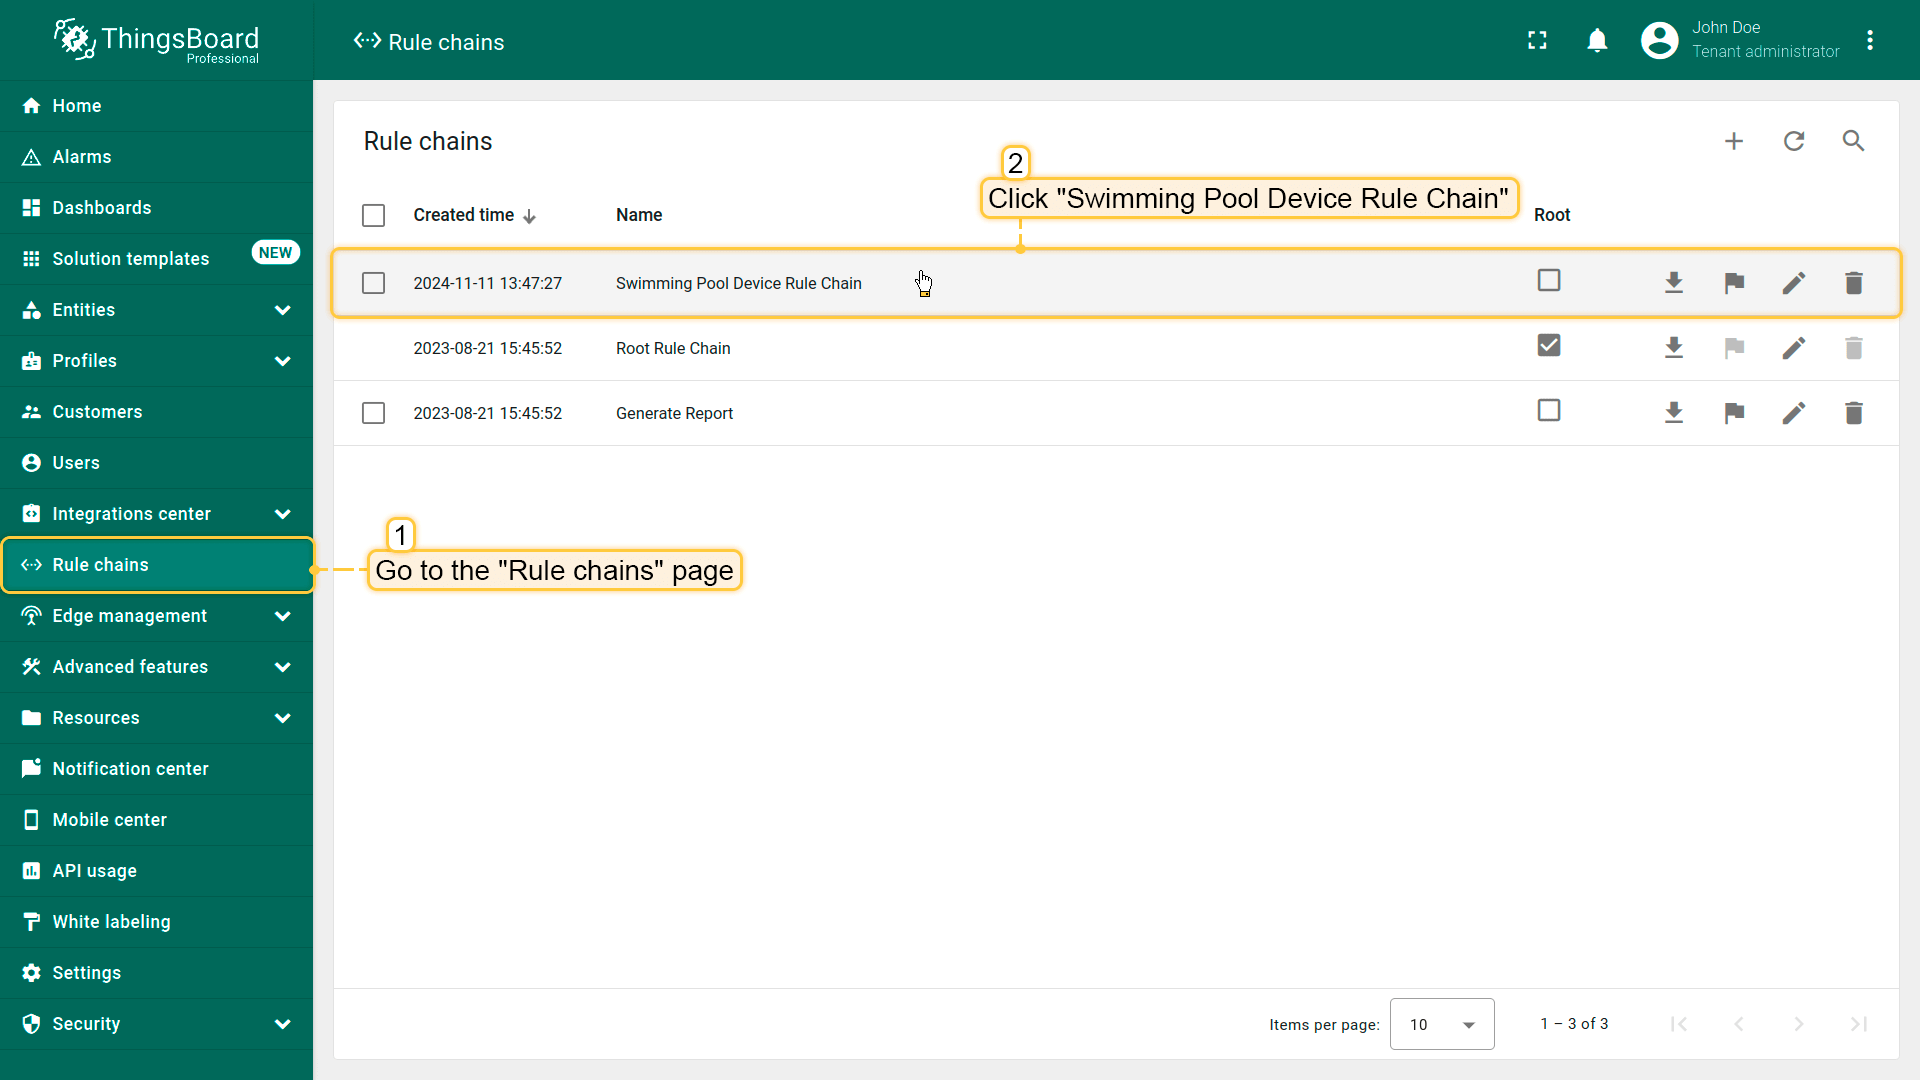
规则链
每条消息经过Swimming Pool Device Rule Chain。在此处保存遥测、属性与RPC请求,生成告警,并执行热泵控制。
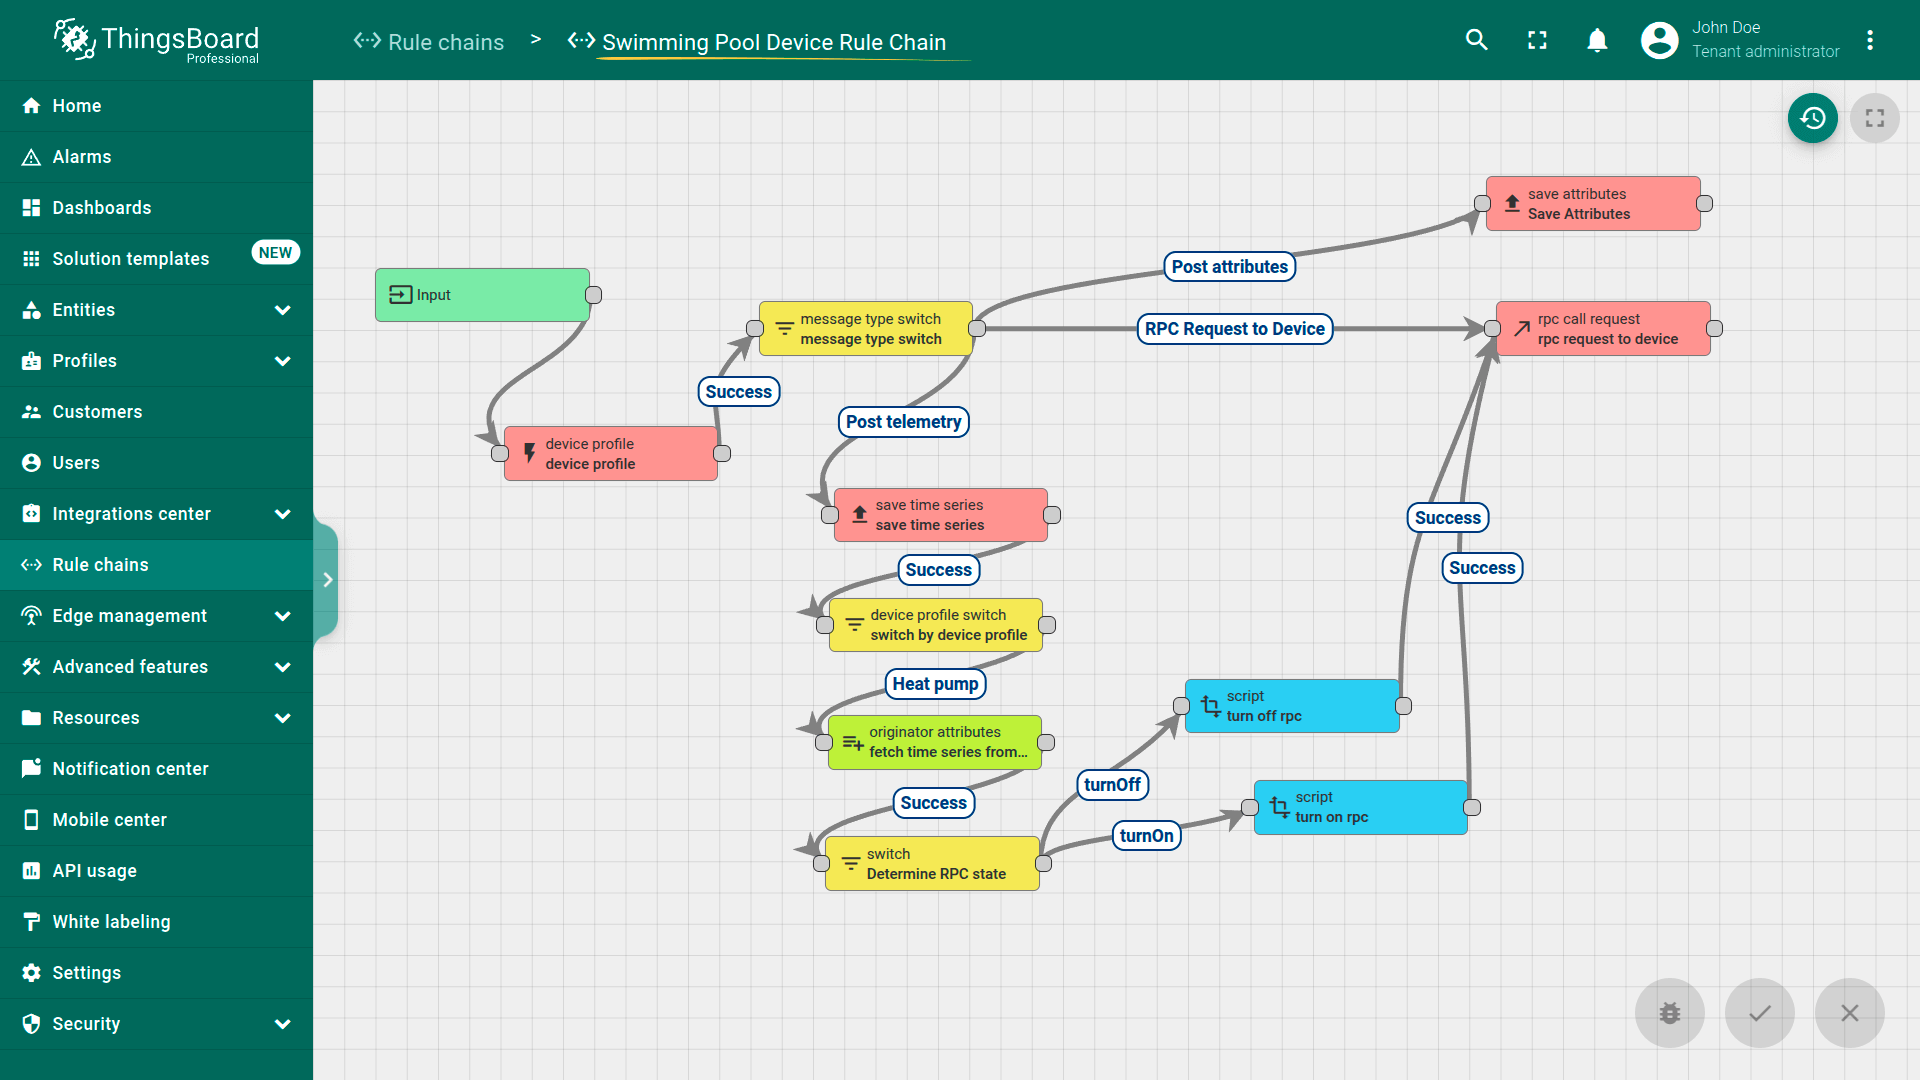
消息处理流程:
- 告警生成: 每条消息首先经过设备配置节点。此步使系统可根据设备配置中定义的条件生成告警(如热泵、水泵、砂滤器)。若遥测超出设定阈值,则触发告警并在仪表板上显示。

- 消息类型切换: 在初次配置文件处理后,消息进入消息类型切换节点。该节点按消息类型(如遥测数据、属性更新、RPC请求)路由消息,将每条消息发送至相应路径进行进一步处理。

-
通用逻辑 – 保存属性、时间序列与RPC请求: 与消息类型无关,以下操作对所有设备执行。
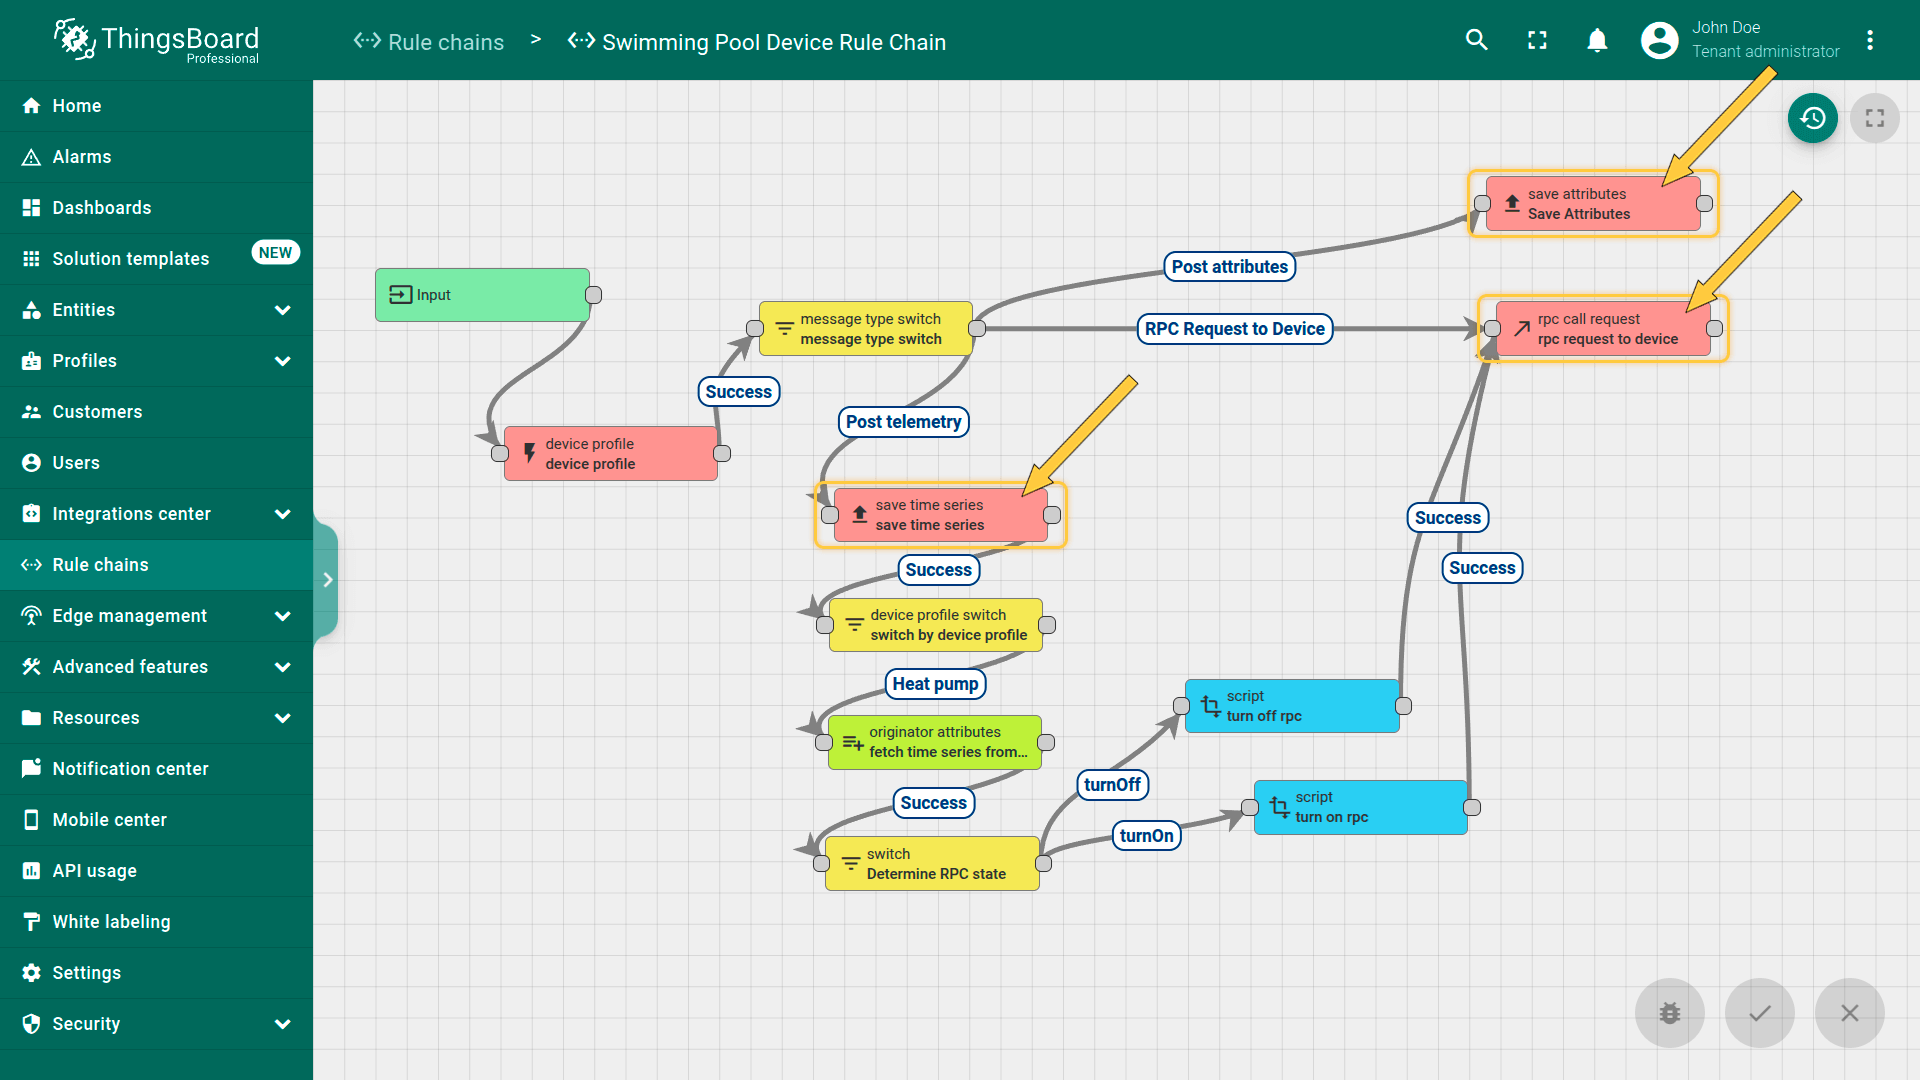
- save attributes节点:设备遥测数据作为属性保存。
- save time series节点:时间序列数据保存以供历史分析与监测。
- rpc call request节点:系统可生成并向设备发送RPC请求。这些RPC命令可开关设备、更改运行模式或控制阀门位置。例如,可根据预设条件或手动请求开关阀门、启停泵。
- 设备配置过滤: 遥测数据保存后,消息经设备配置切换节点路由。该节点按配置文件过滤设备,支持设备特定操作。当检测到热泵遥测时,系统通过switch节点检查目标温度、室外温度、泳池温度等特定条件。若遥测条件满足启停热泵的阈值,则发送RPC请求控制热泵状态。

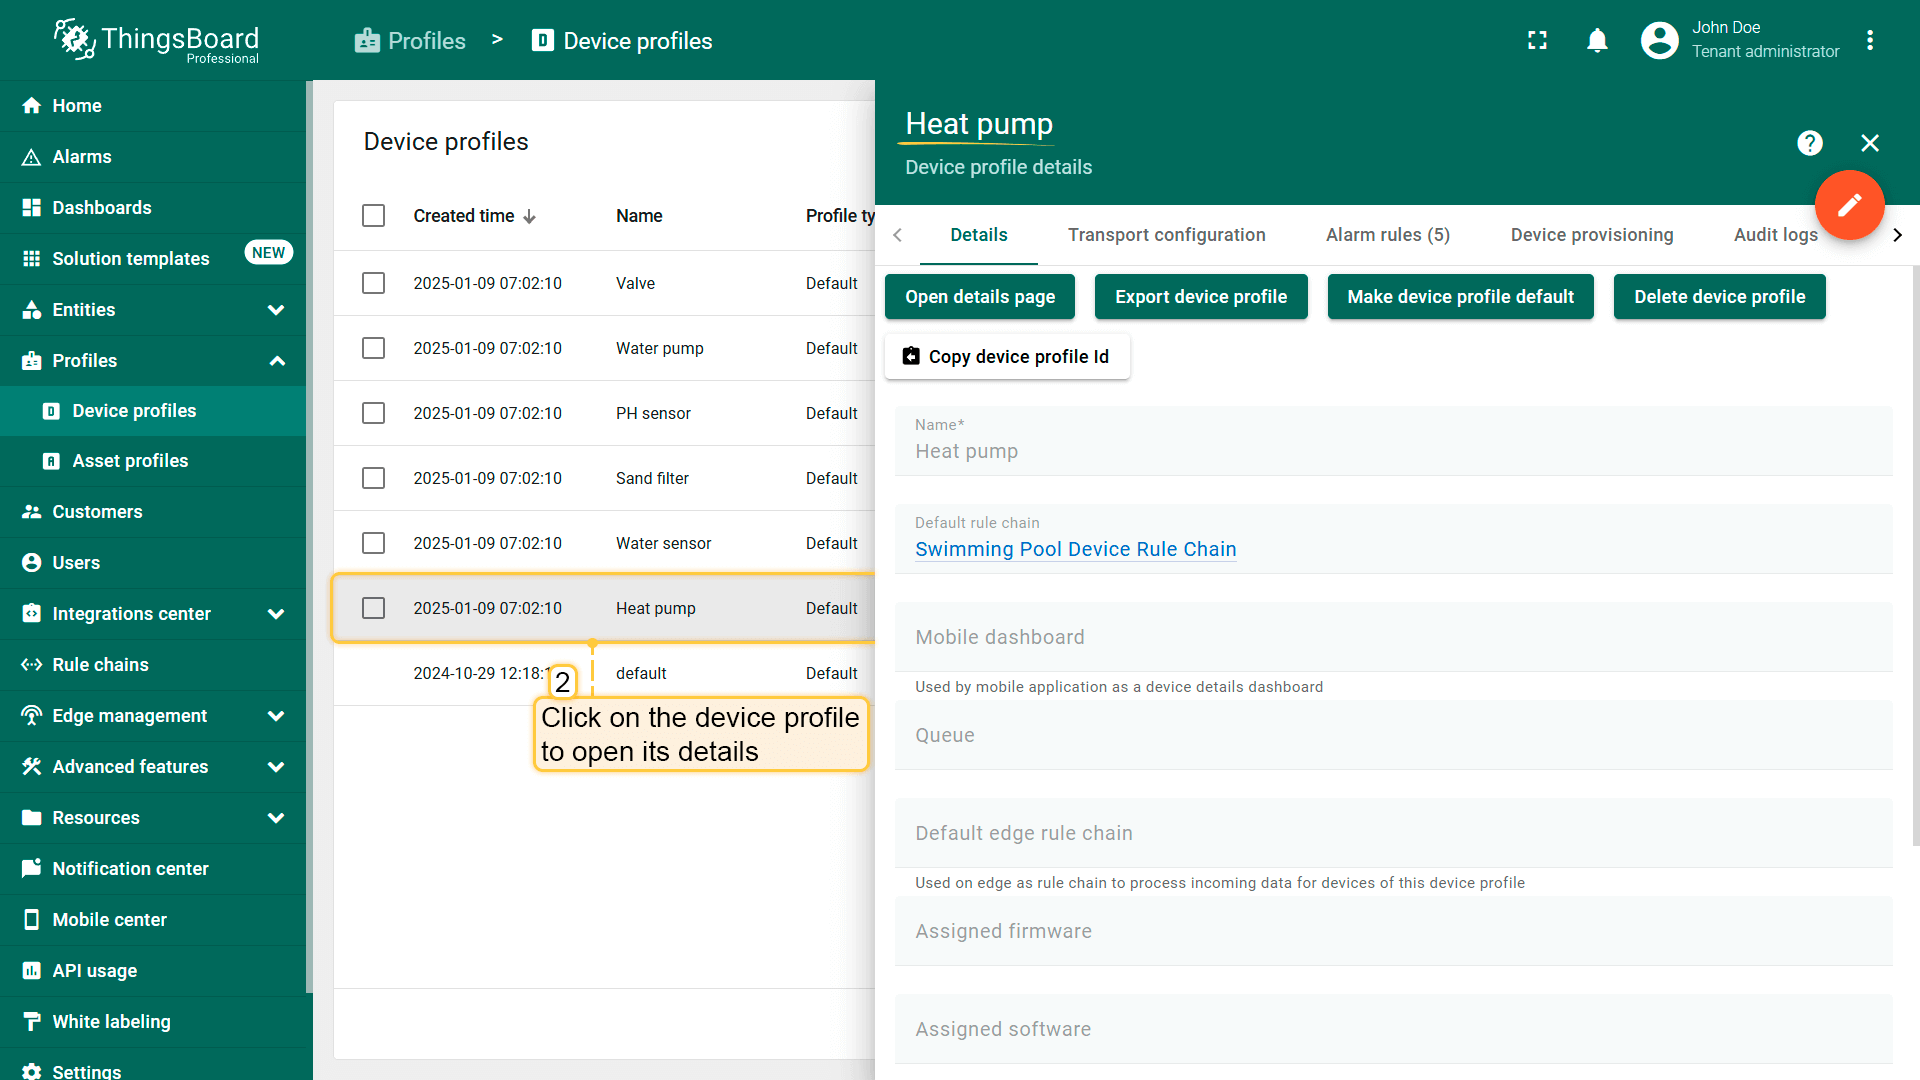
设备配置
在ThingsBoard中,设备配置是一组定义使用该配置的设备行为的配置与规则。设备配置简化具有相似参数的设备管理。 包含处理入站消息与事件的规则链、传输配置、告警规则及其他参数。更多说明请参见此处。
“Swimming Pool SCADA system”解决方案模板为14台运营设备创建了6个设备配置。这些配置文件将”Swimming Pool Device Rule Chain“设为我们设备的默认规则链,传输配置为默认,并为设备定义特定告警规则。 如泳池水温过高或热泵功耗超限等。
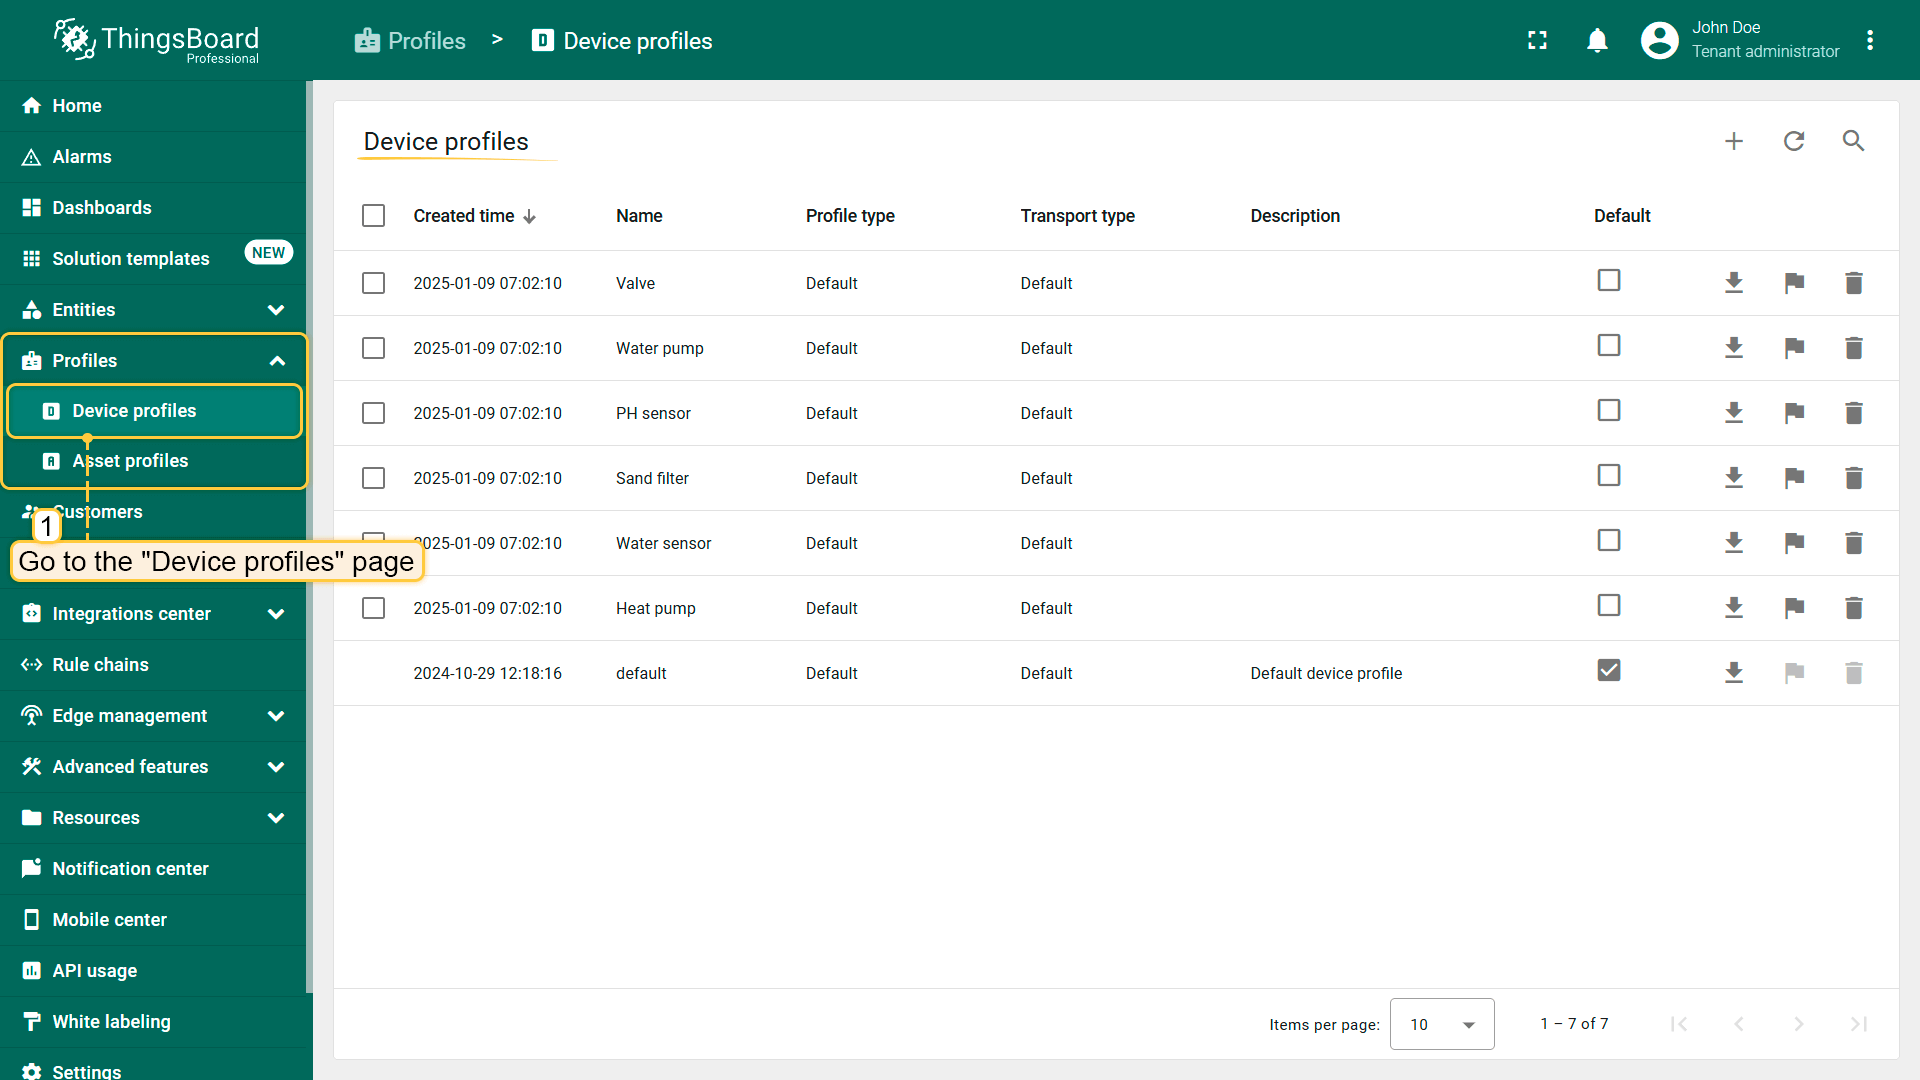
告警规则
Swimming Pool SCADA系统包含关键设备的告警配置,使操作人员可监测关键状况并快速响应潜在问题。告警基于设备配置中预定义的阈值与规则触发,有助于维持系统最佳绩效。
设备专属告警
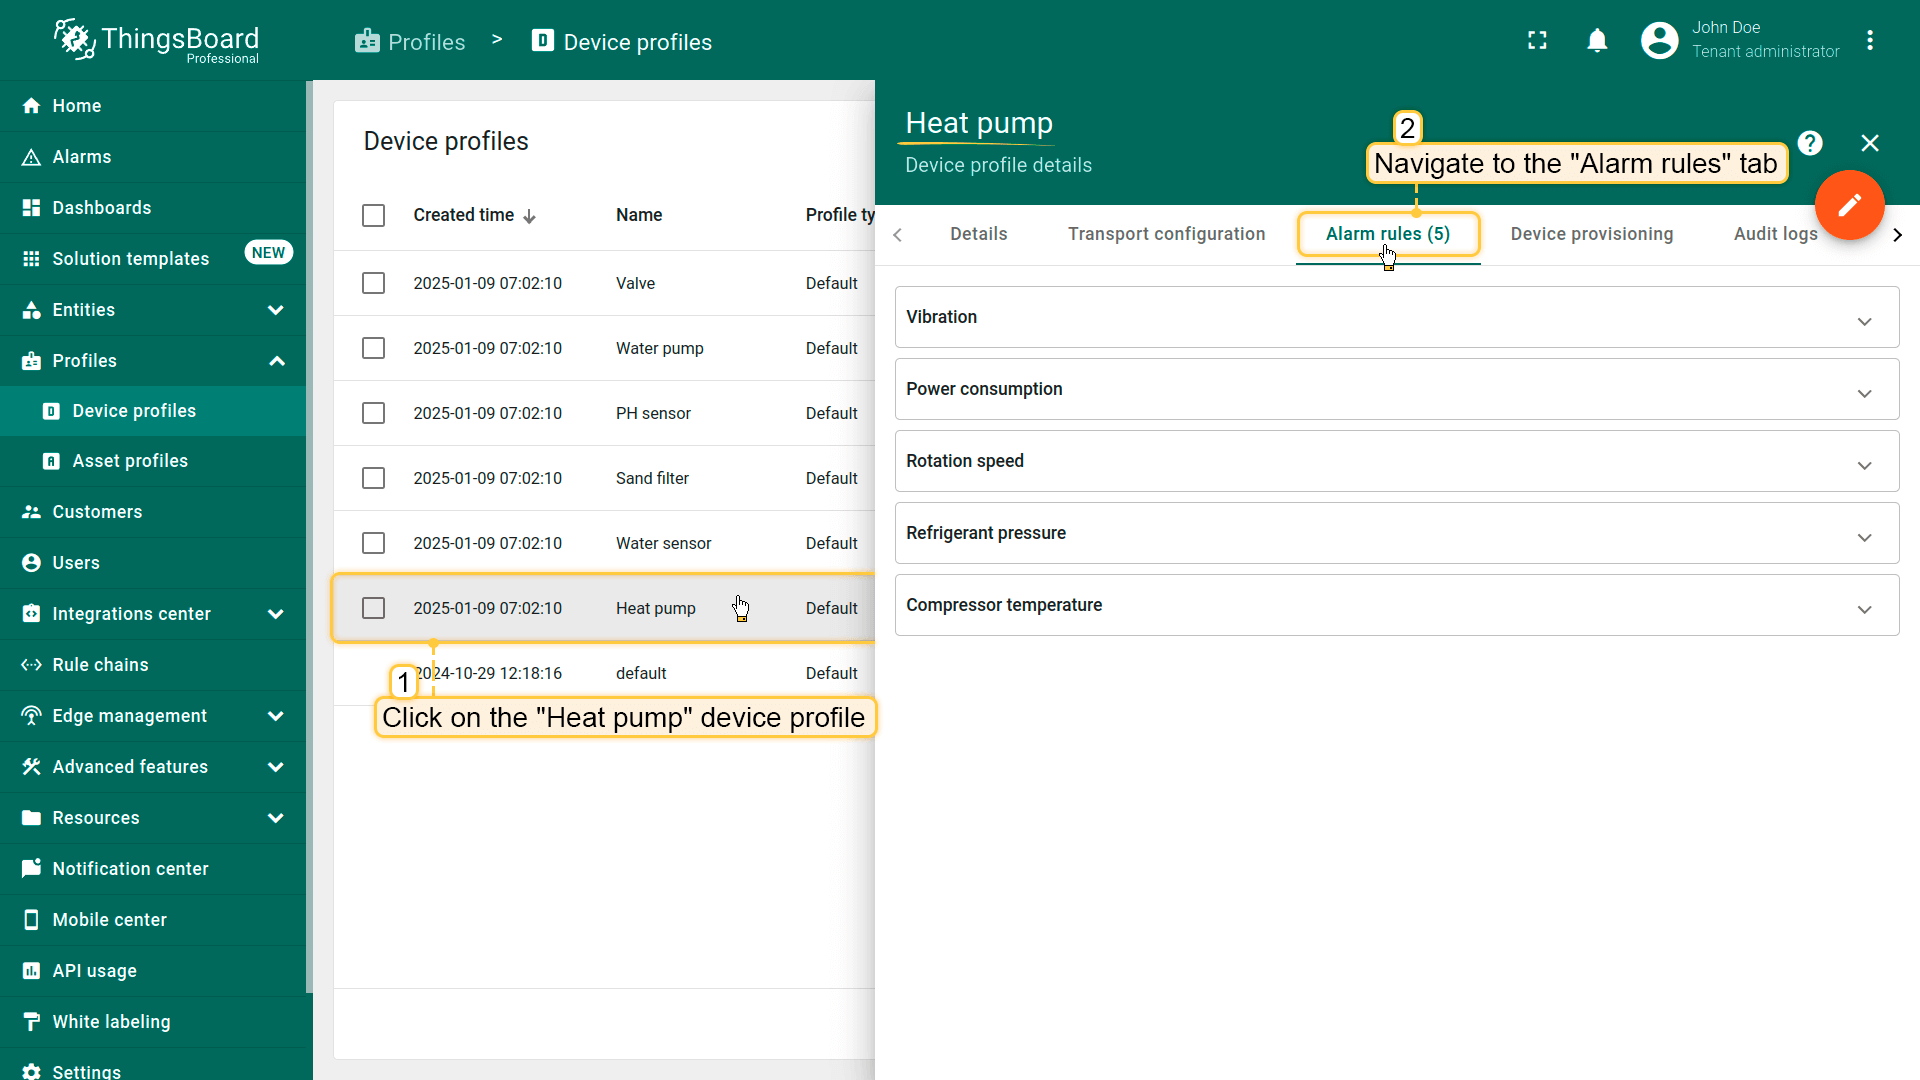
热泵:热泵基于以下指标有五条告警规则:
- 振动水平
- 功耗
- 转速
- 制冷剂压力
- 压缩机温度
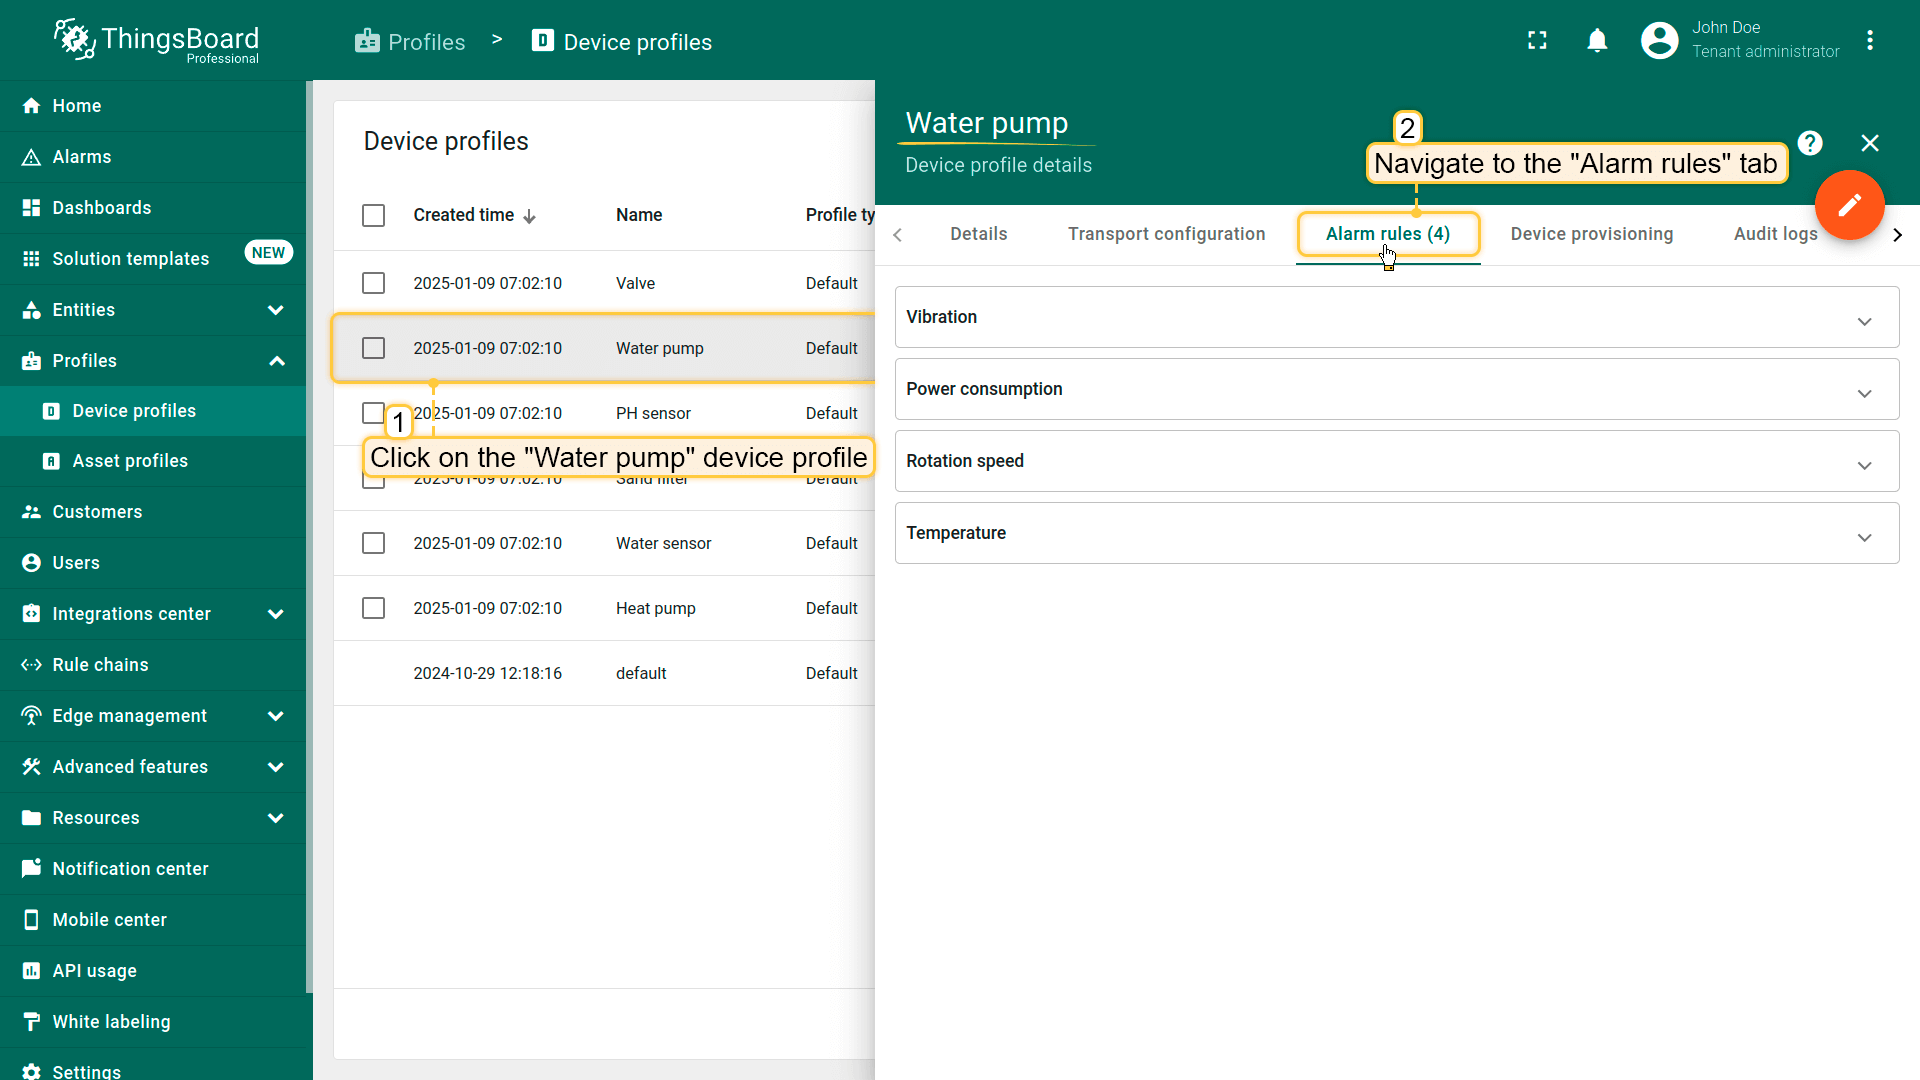
水泵:水泵由基于以下四项规则监测:
- 振动水平
- 功耗
- 转速
- 温度
砂滤器:砂滤器配备三条跟踪以下指标的告警规则:
- 振动水平
- 转速
- 压力
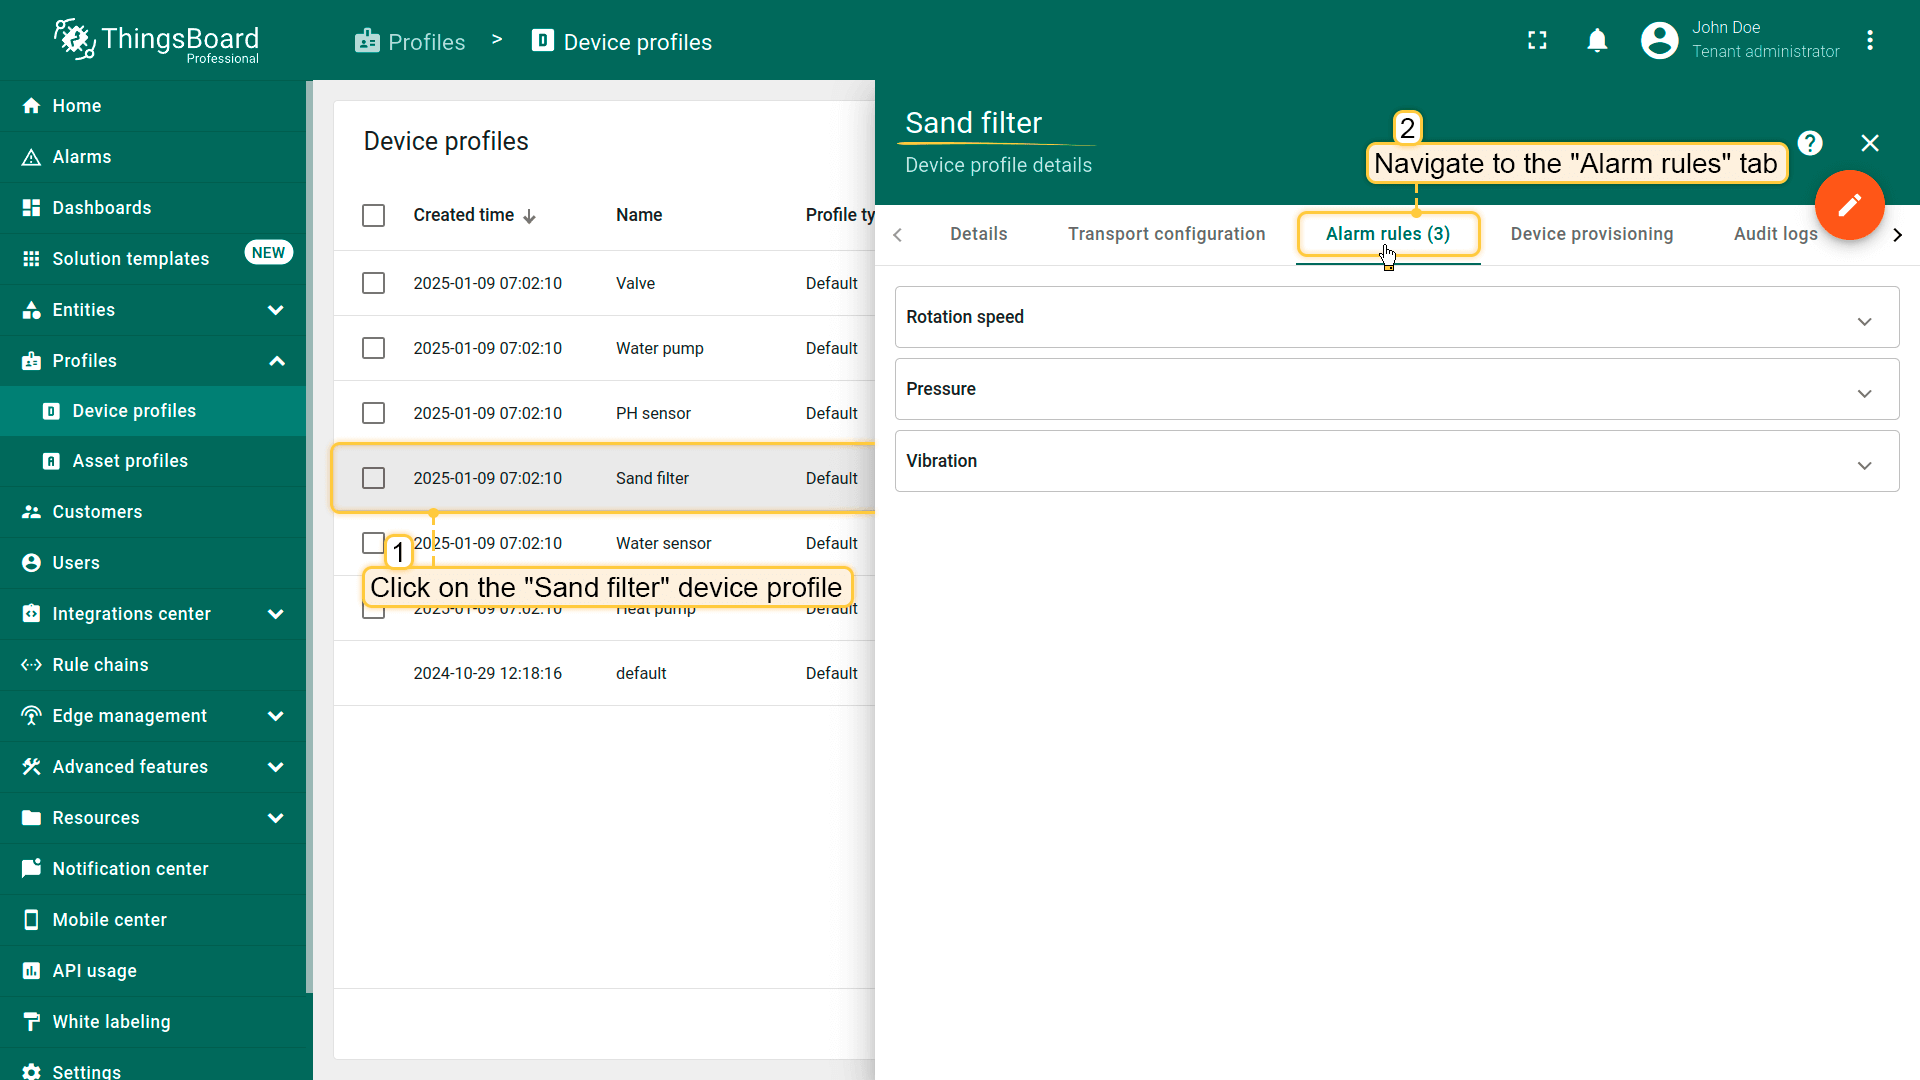
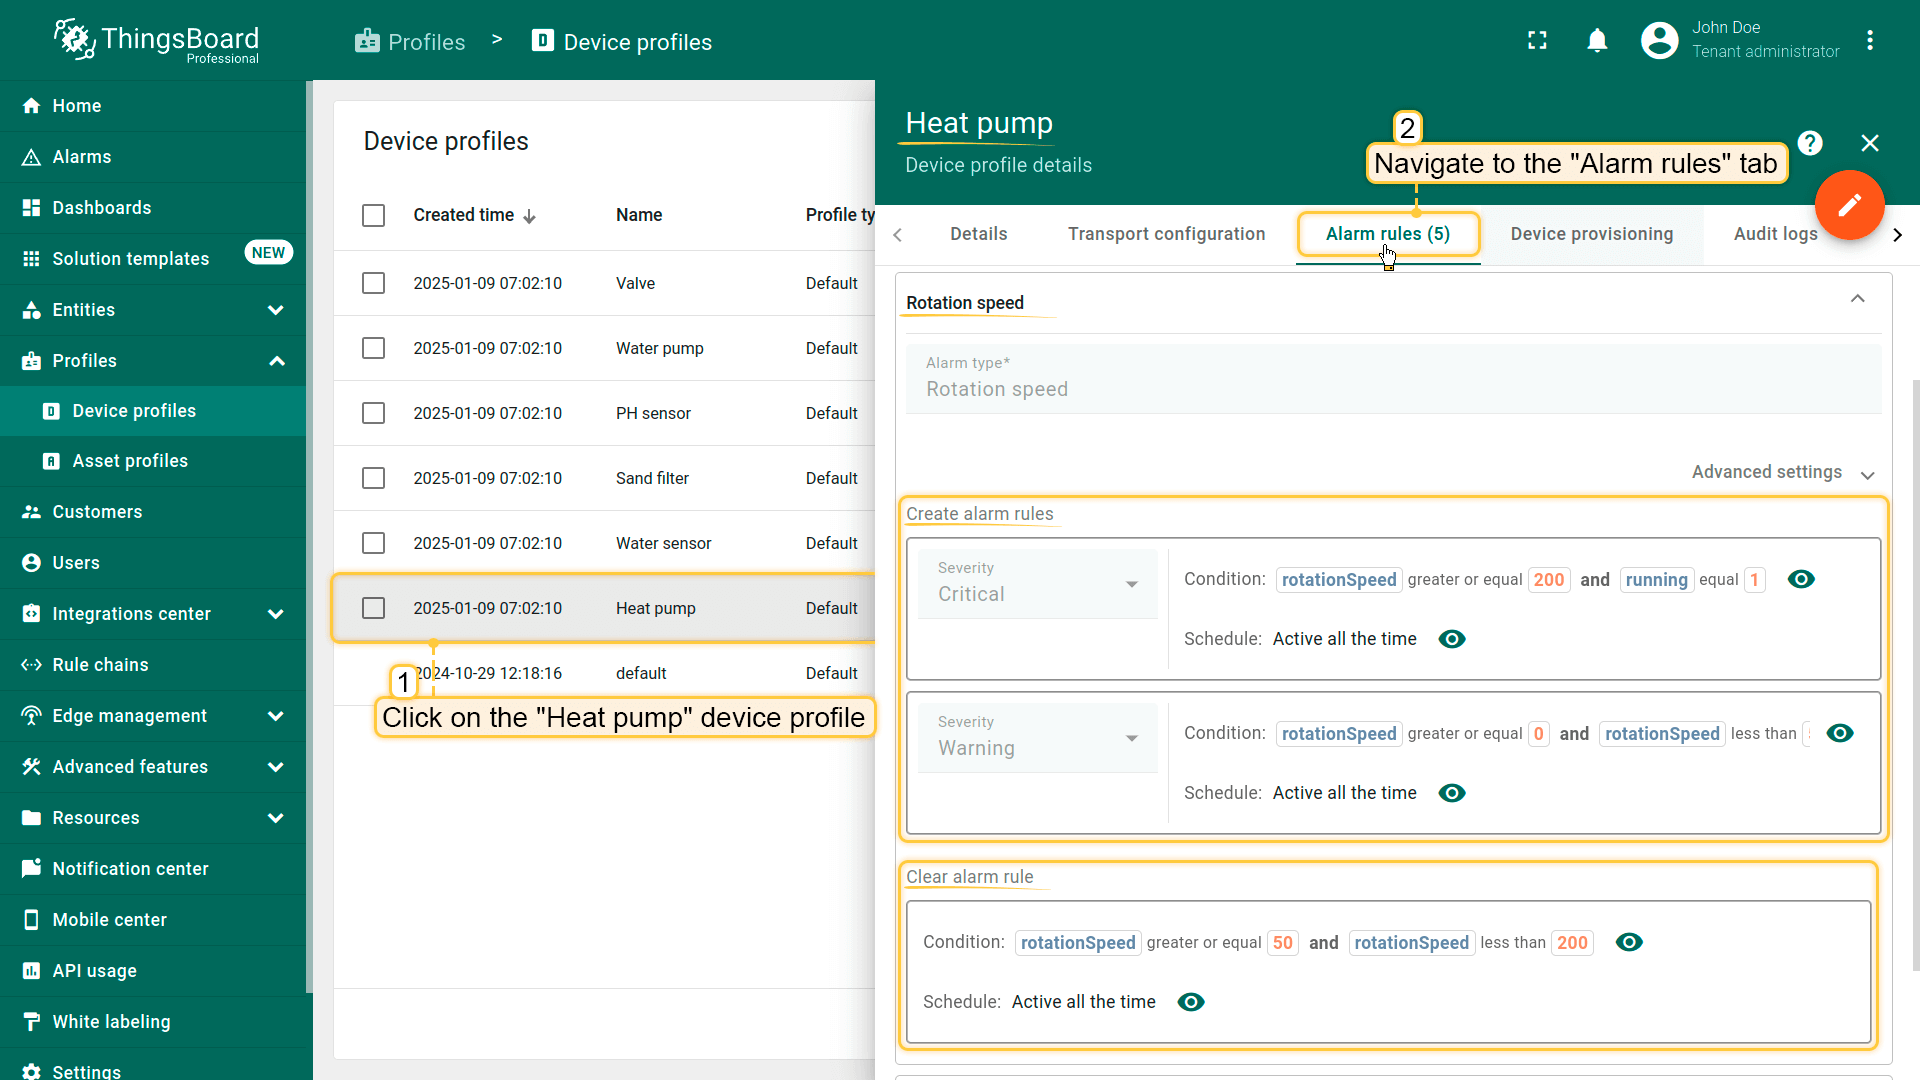
例如,详细查看热泵”Rotation speed”告警规则的配置。
该规则有两个严重级别:
- 若”rotationSpeed”键的值大于等于0且小于50,且”running”等于1,则触发严重级别为”Warning”的告警。
- 若”rotationSpeed”键的值大于等于200且”running”等于1,则触发严重级别为”Critical”的告警。
为清除告警定义了单独规则:
- 若”rotationSpeed”键的值回到大于等于50且小于200的范围,告警将自动清除。
该部件订阅其所用设备配置中reminder alarm status字段,从而接收告警创建、类型及严重程度相关更新。 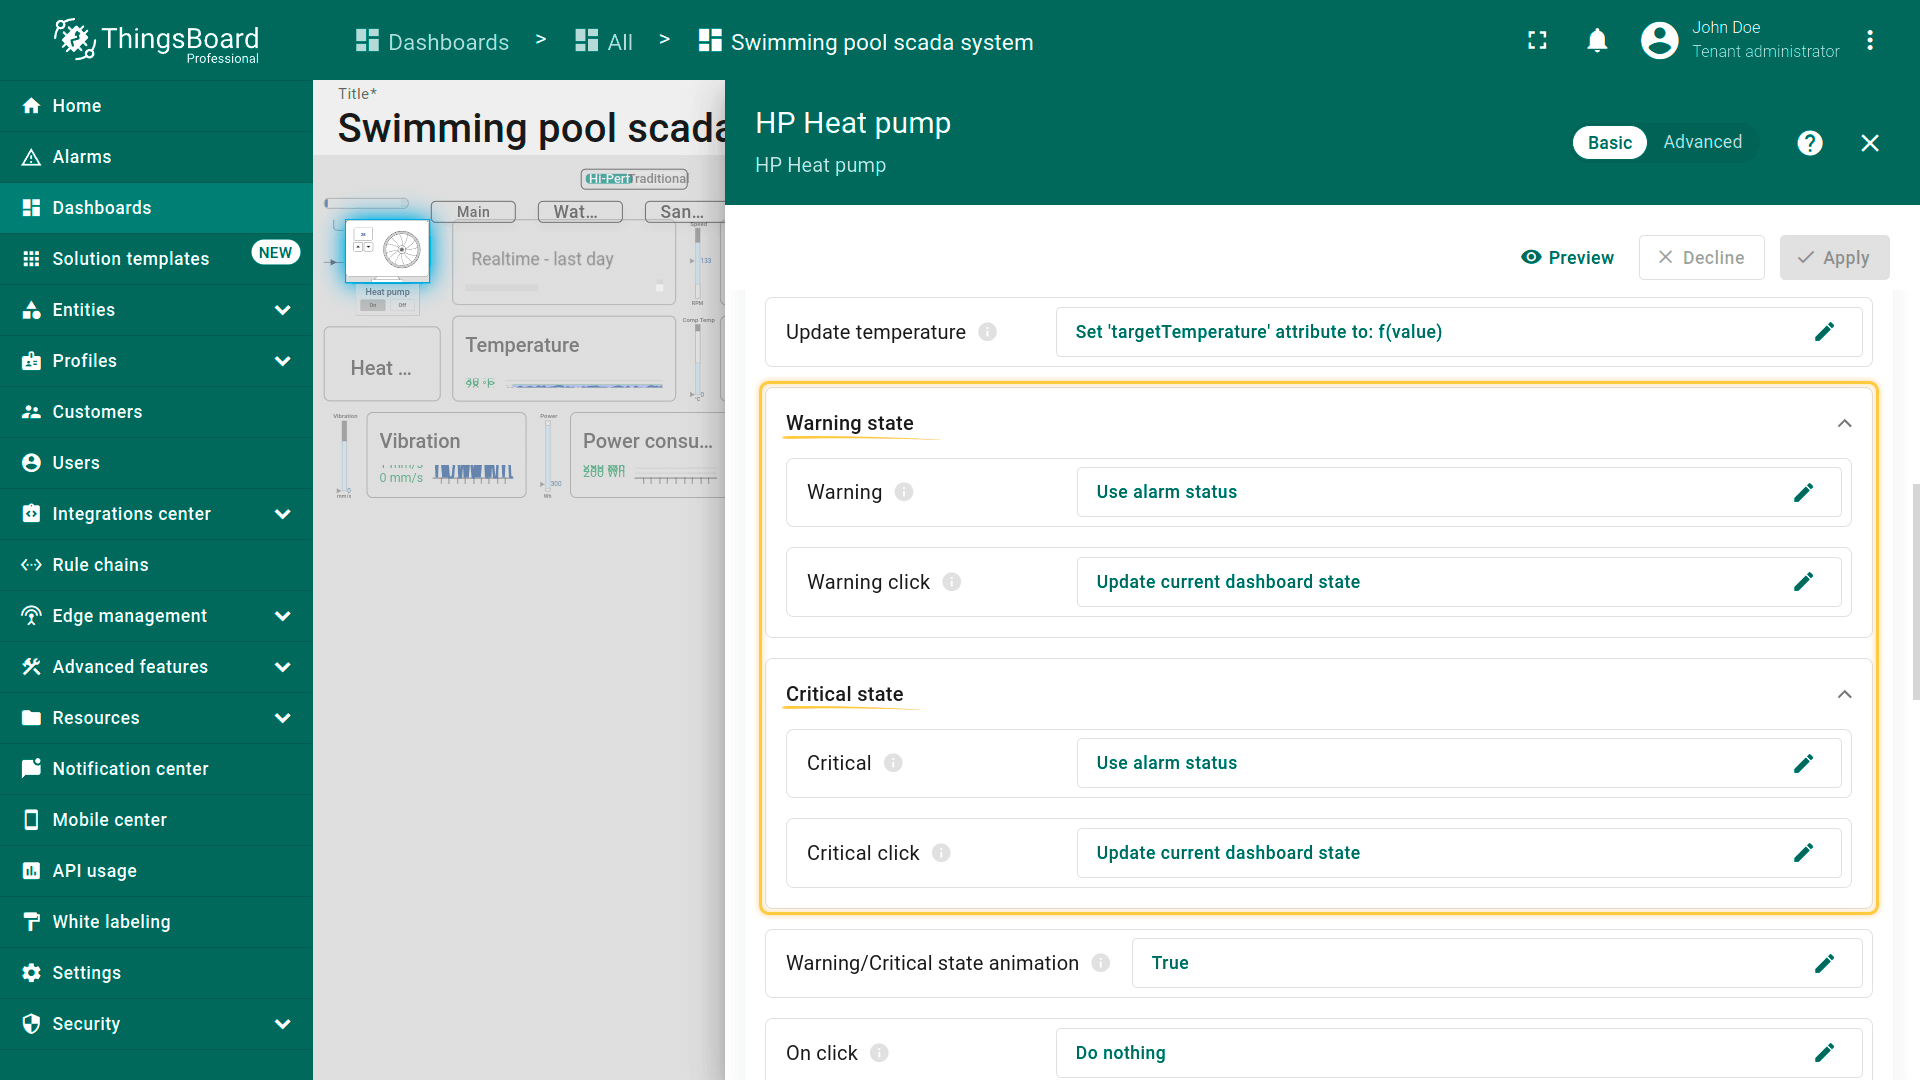 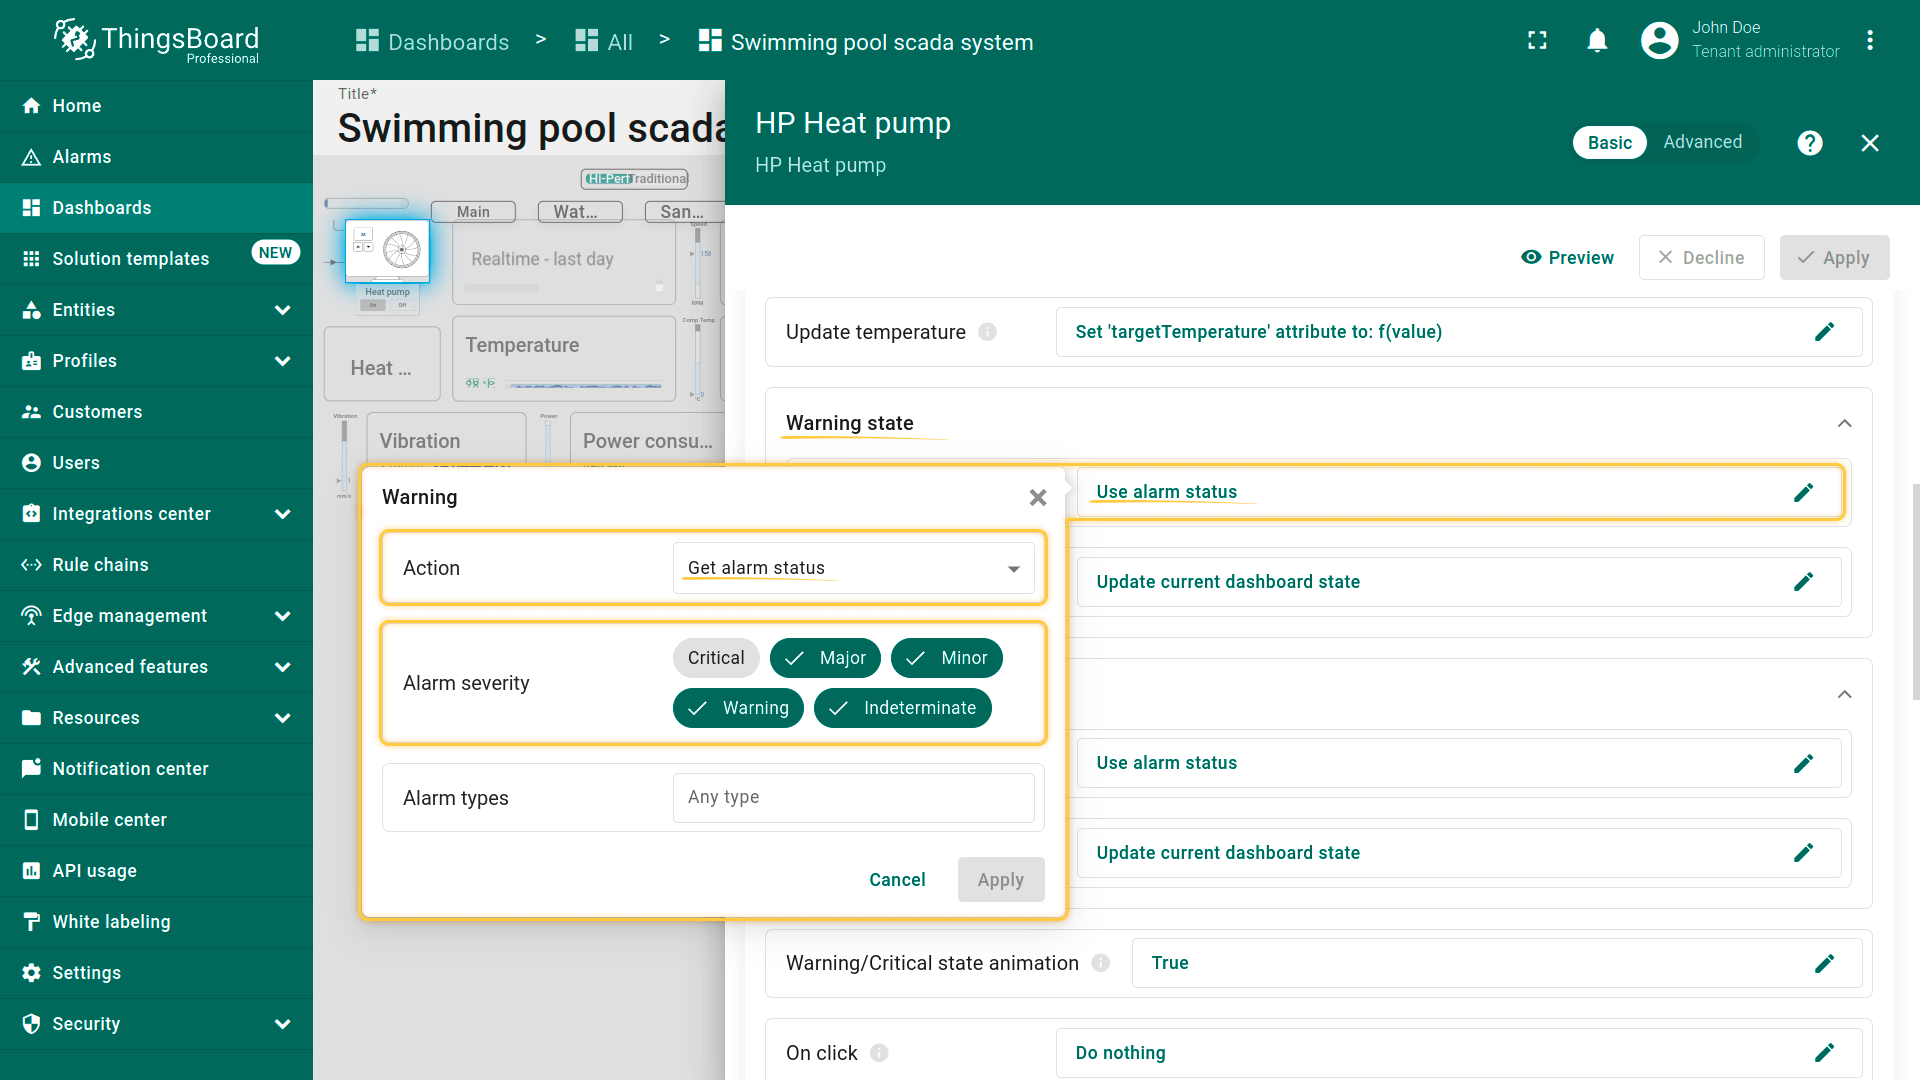 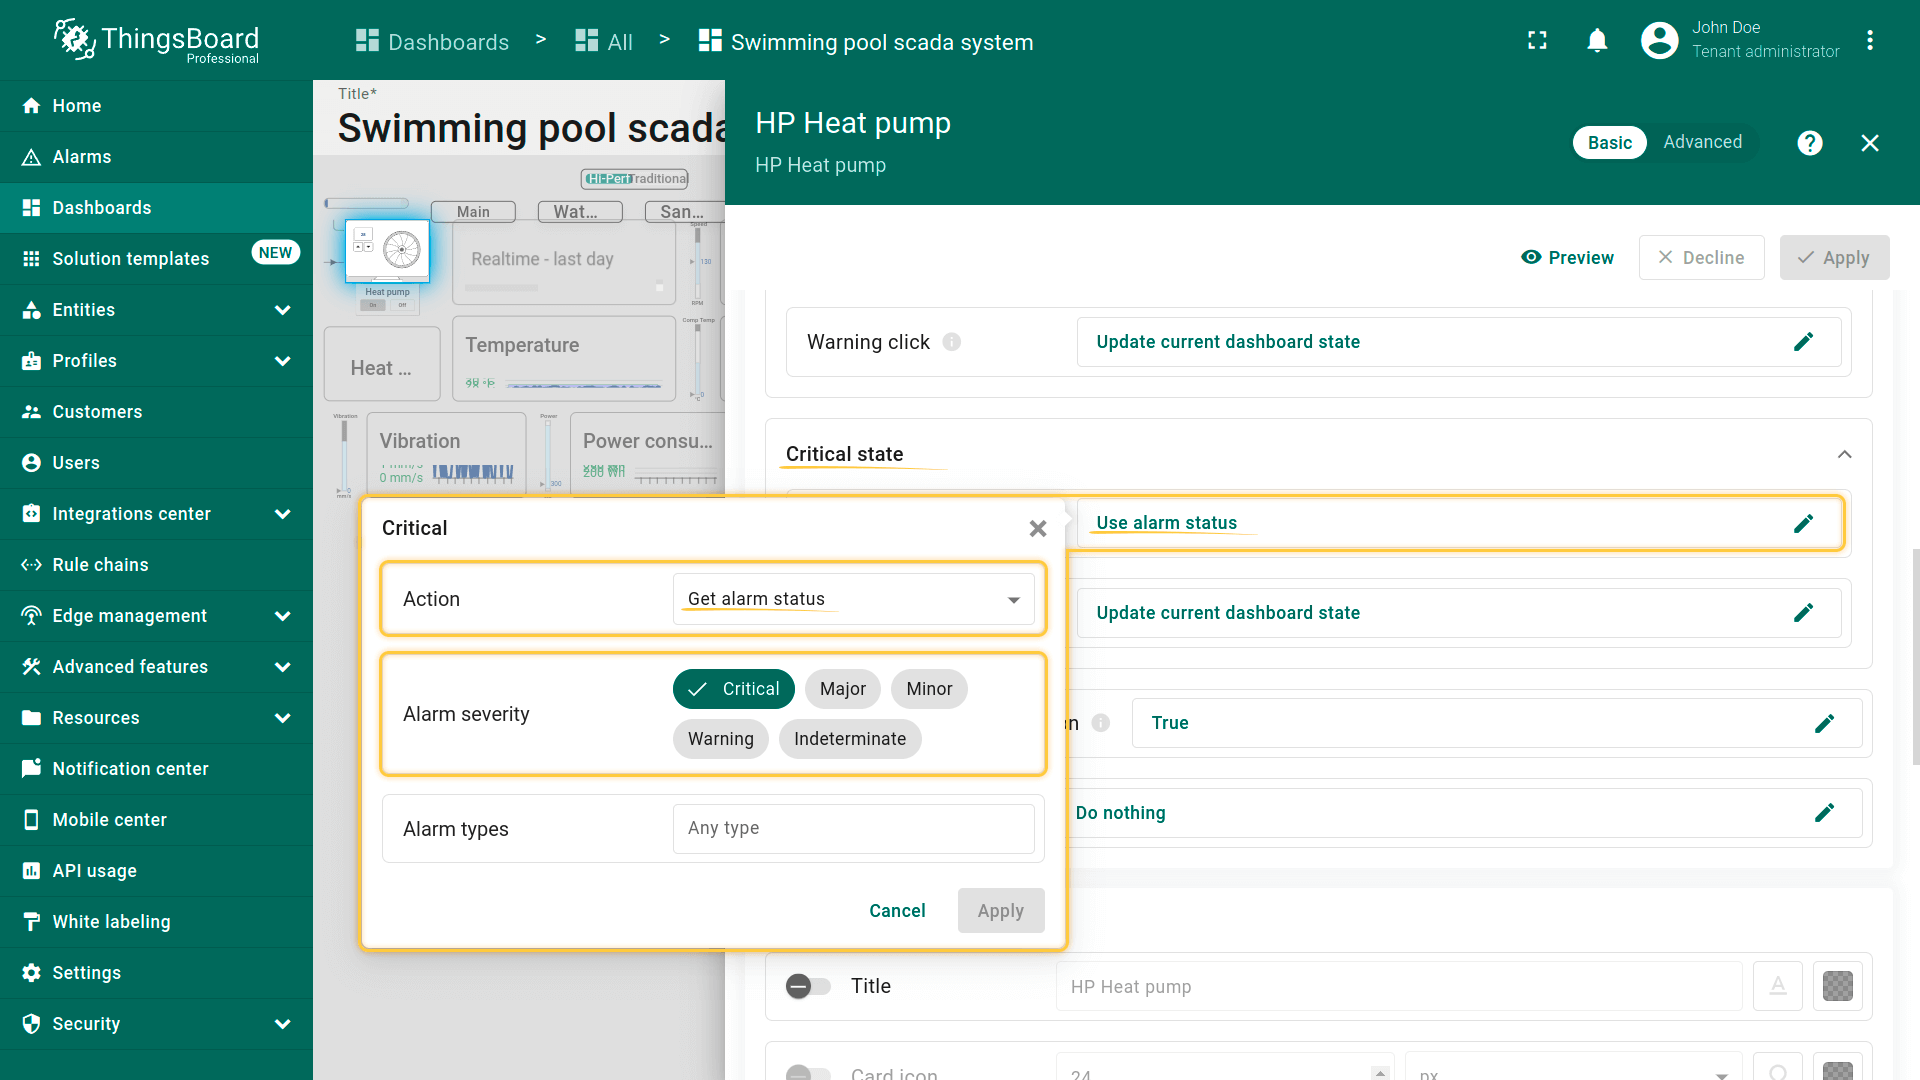 当告警规则触发时,热泵左下角会出现告警图标。
图标类型取决于设备配置中定义的告警严重程度及部件自身设置。 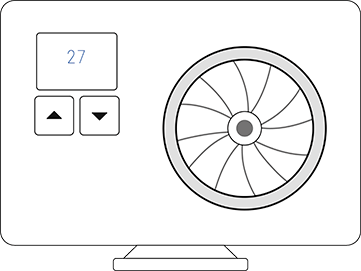 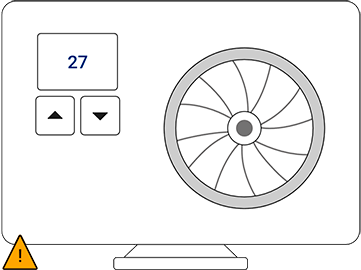 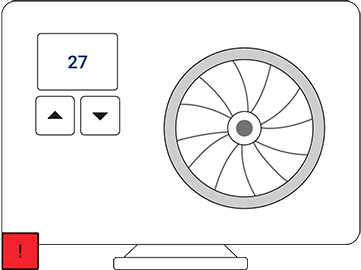 点击热泵设备可进入其状态页,查看运行数据与当前告警。详情包括转速、功耗、制冷剂压力等。 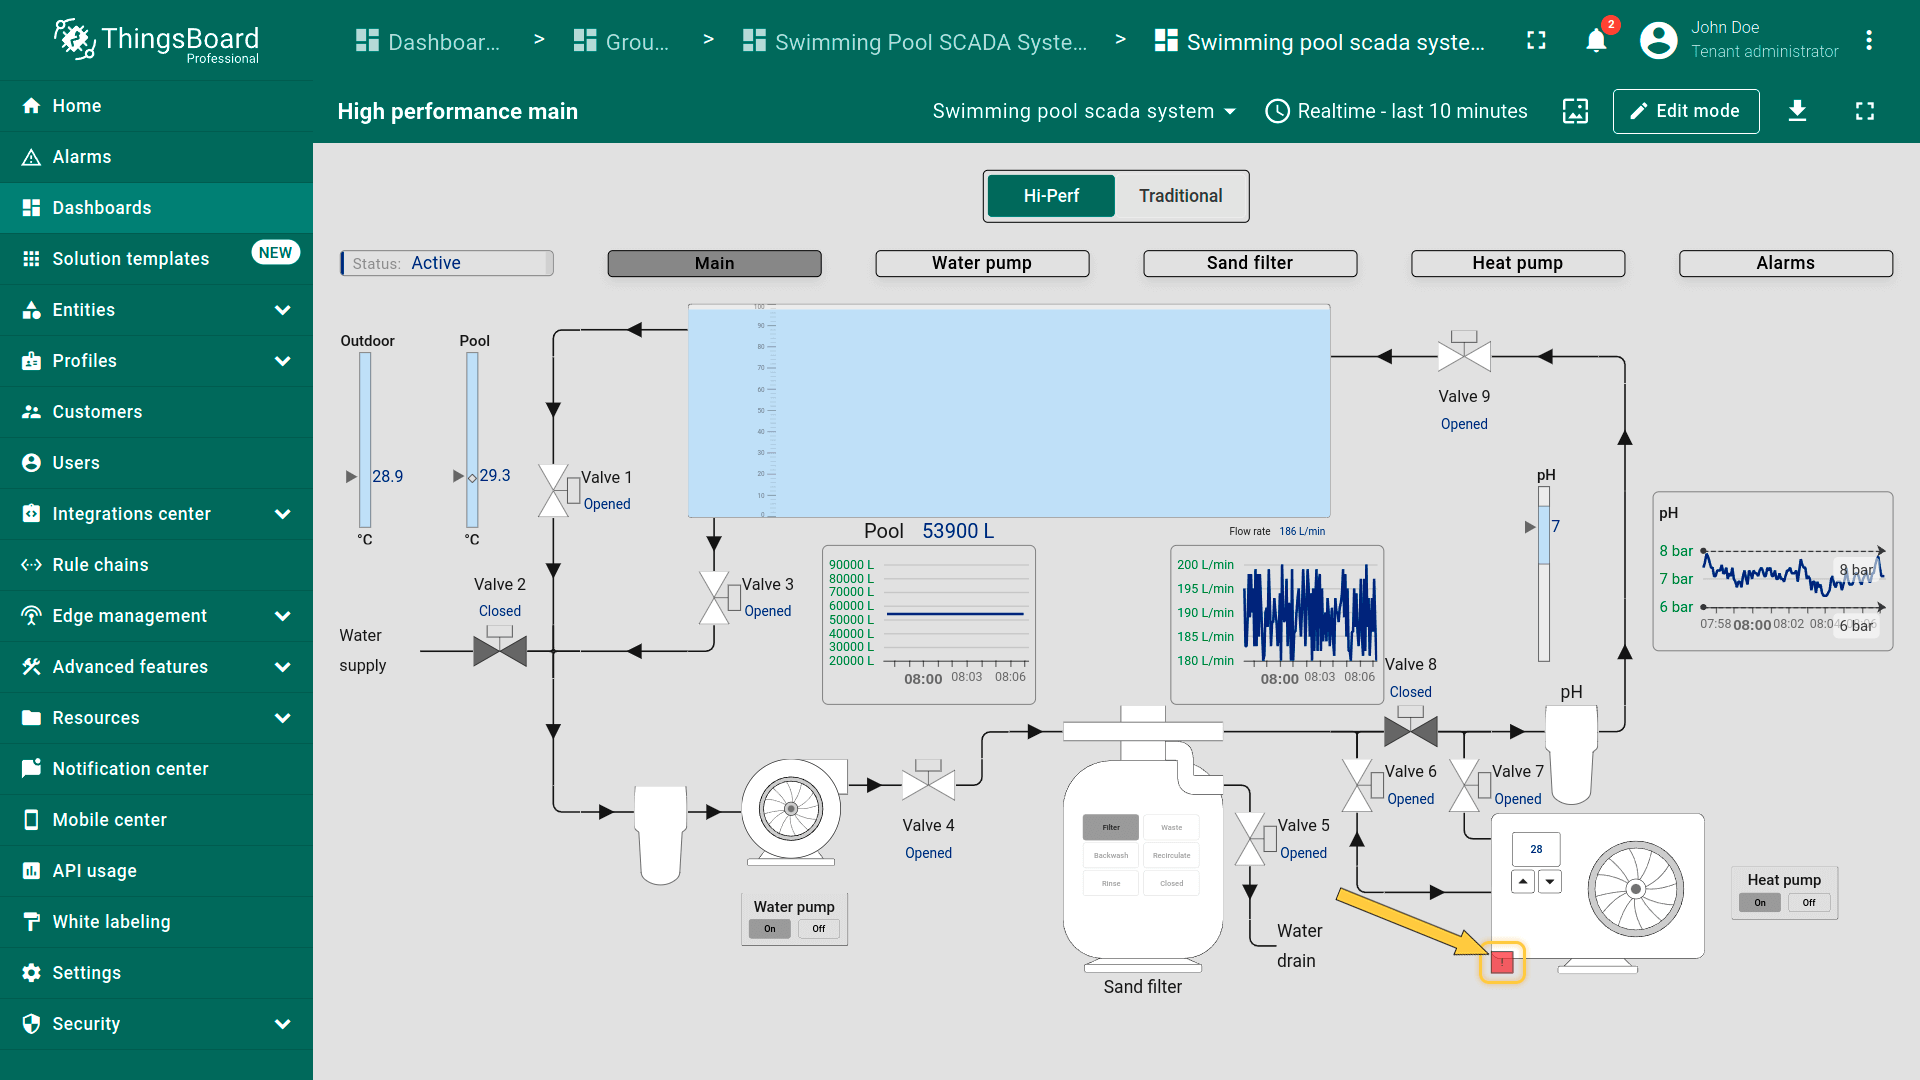 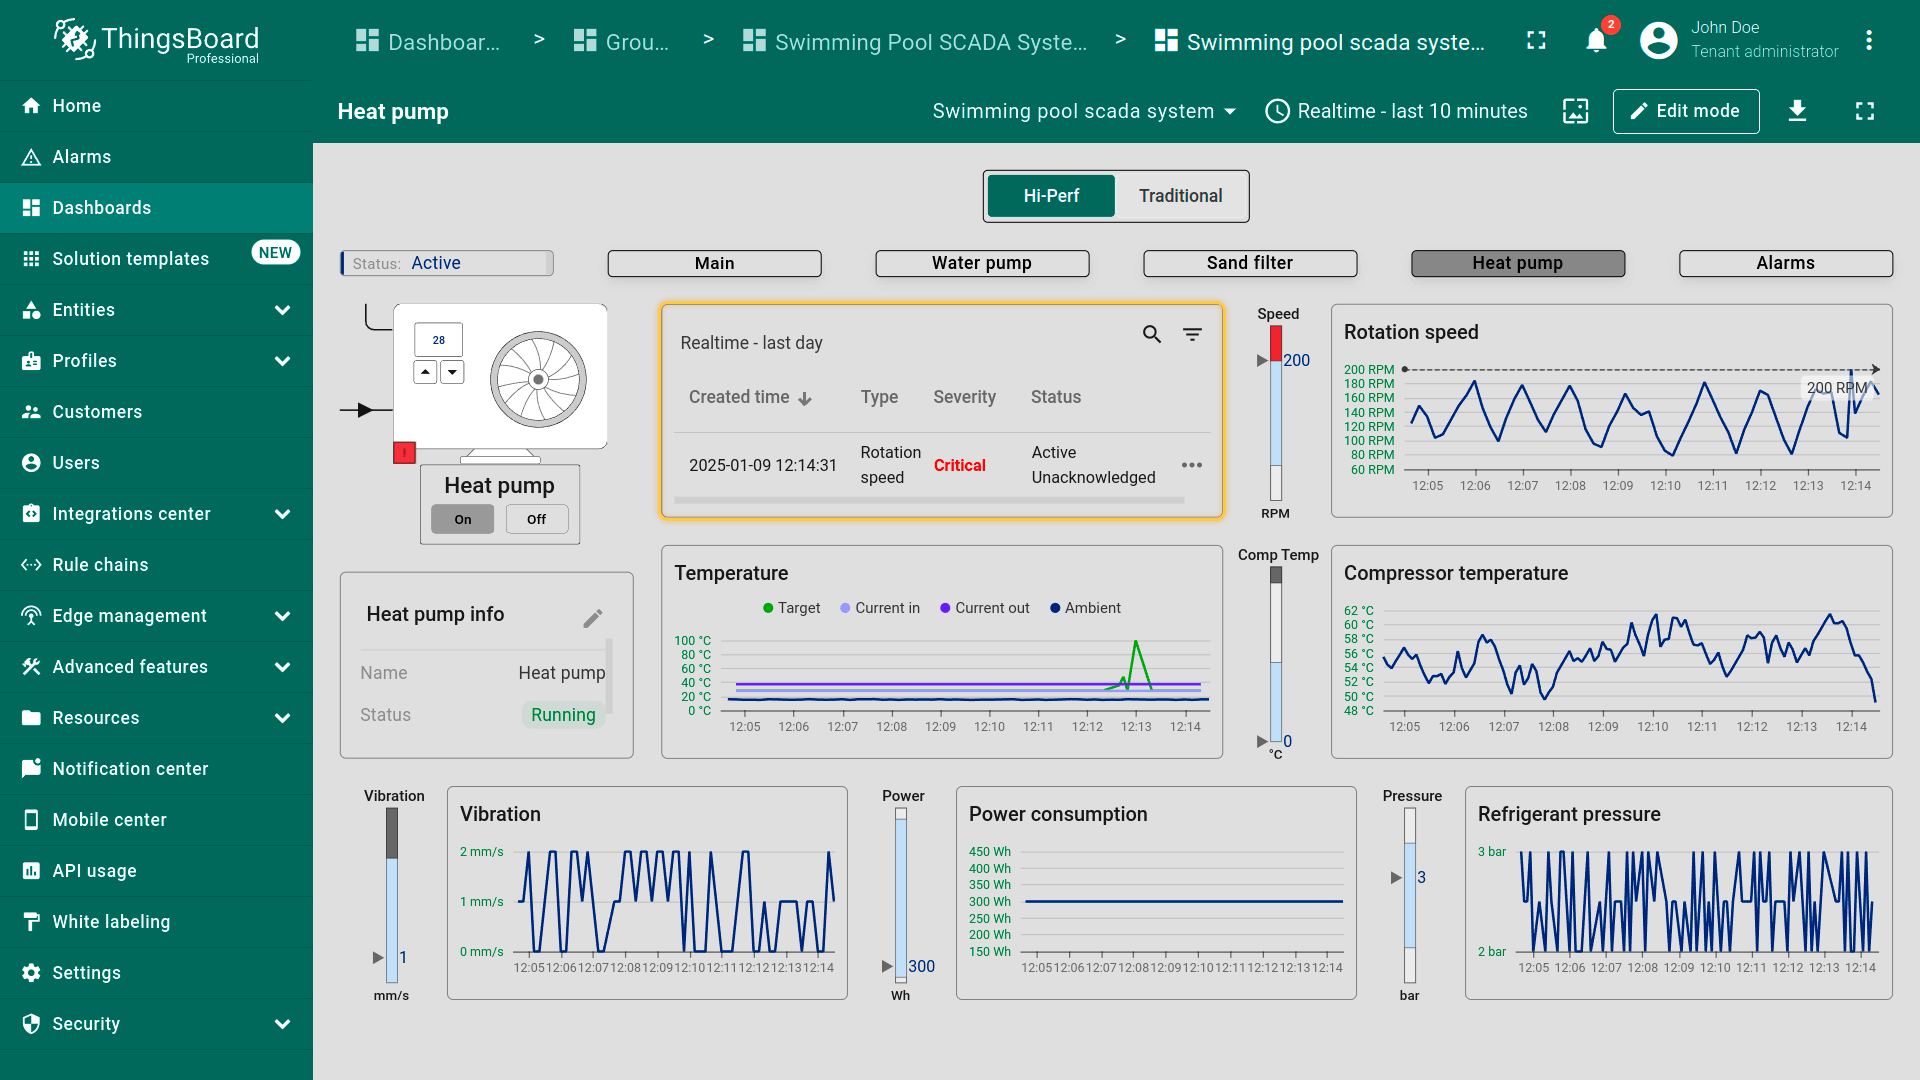 切换到”Alarms”标签可查看系统中所有活跃告警,按来源设备及其告警类型、严重程度分组展示。 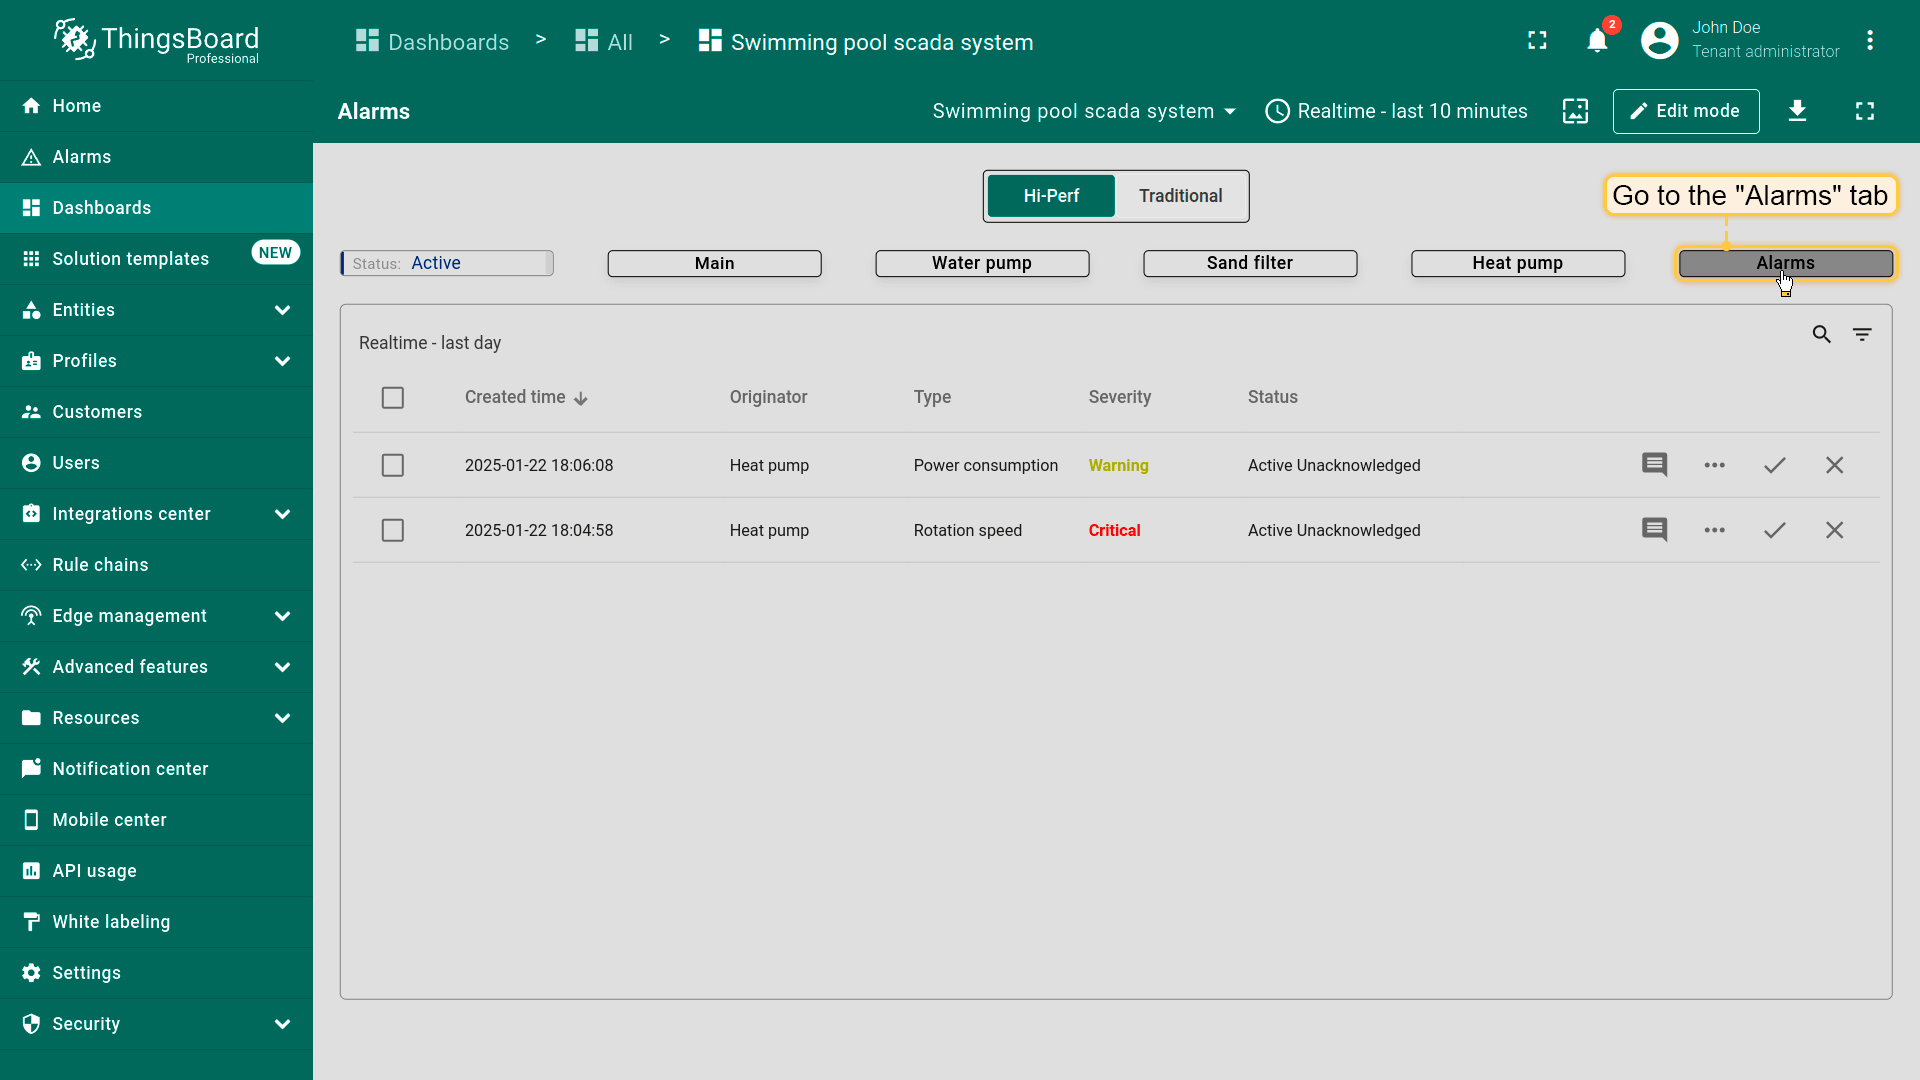 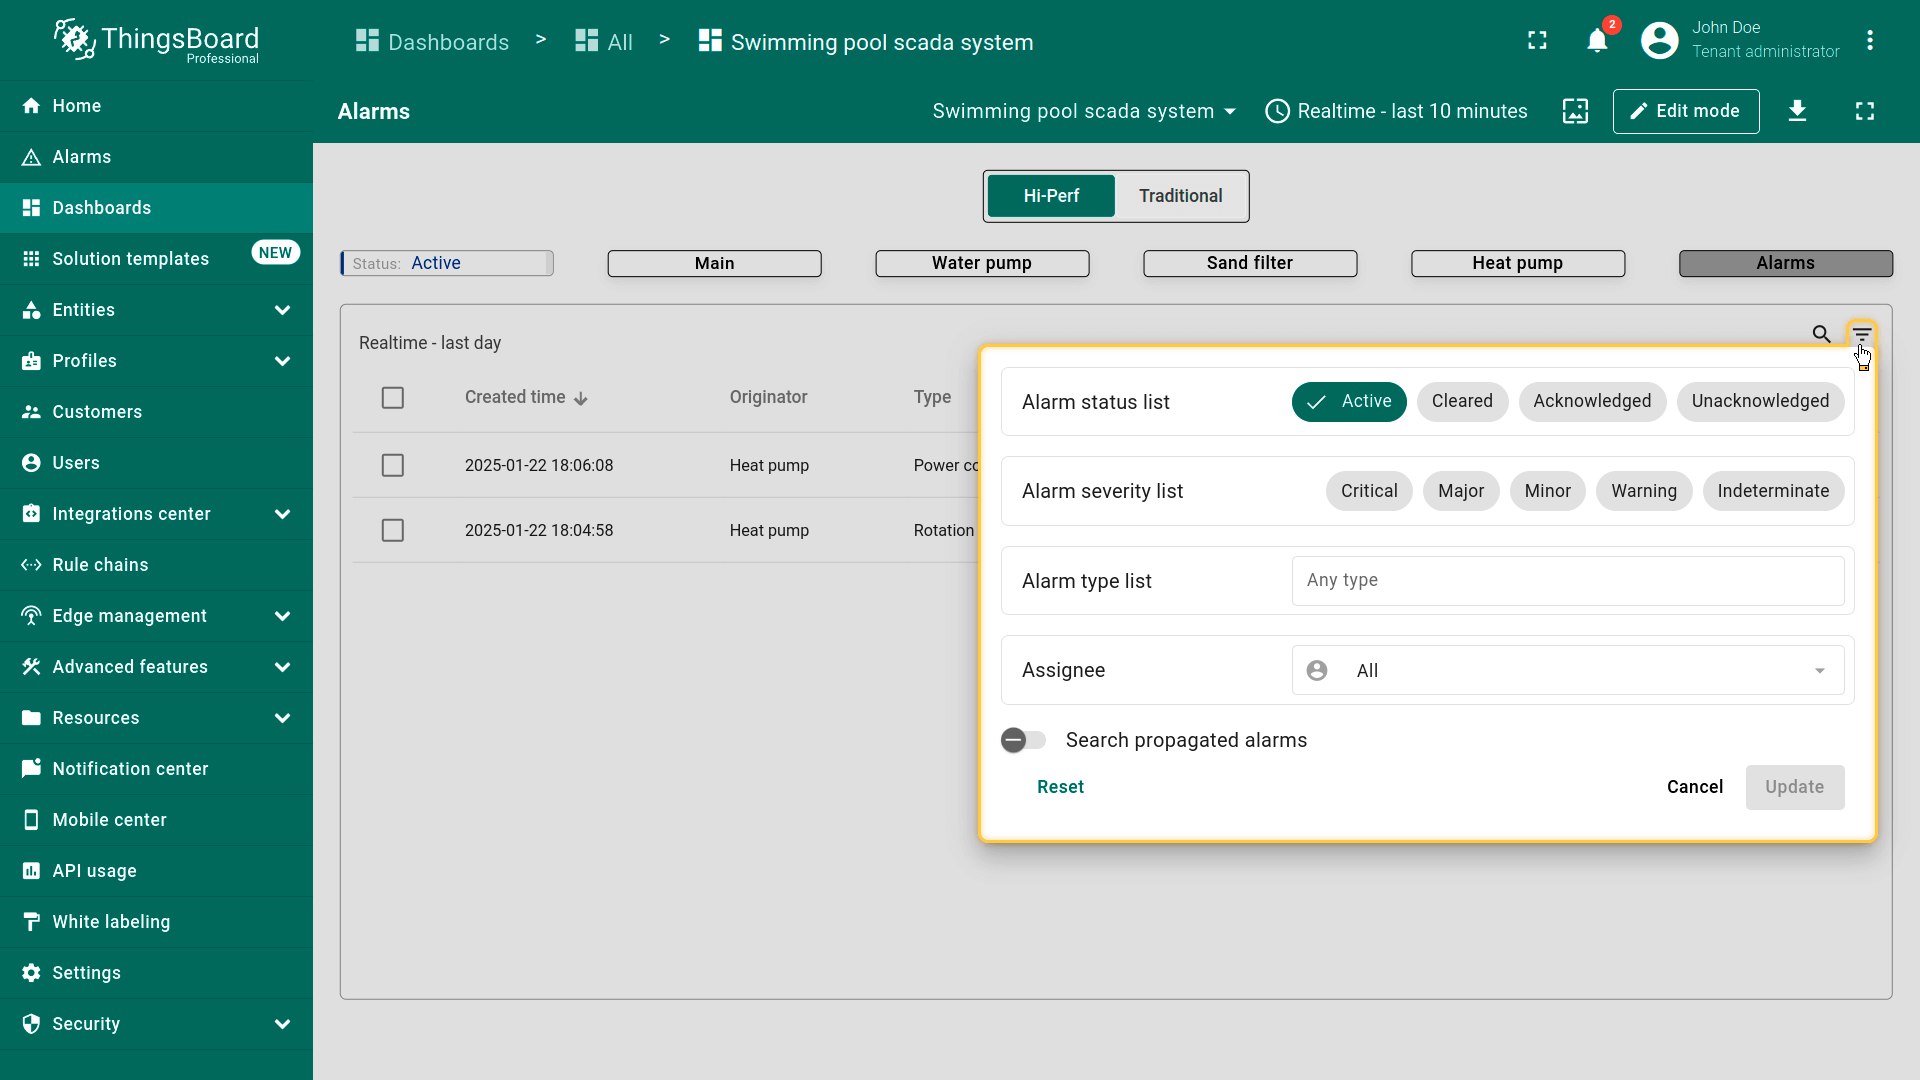 |
该部件订阅其所用设备配置中reminder alarm status字段,从而接收告警创建、类型及严重程度相关更新。 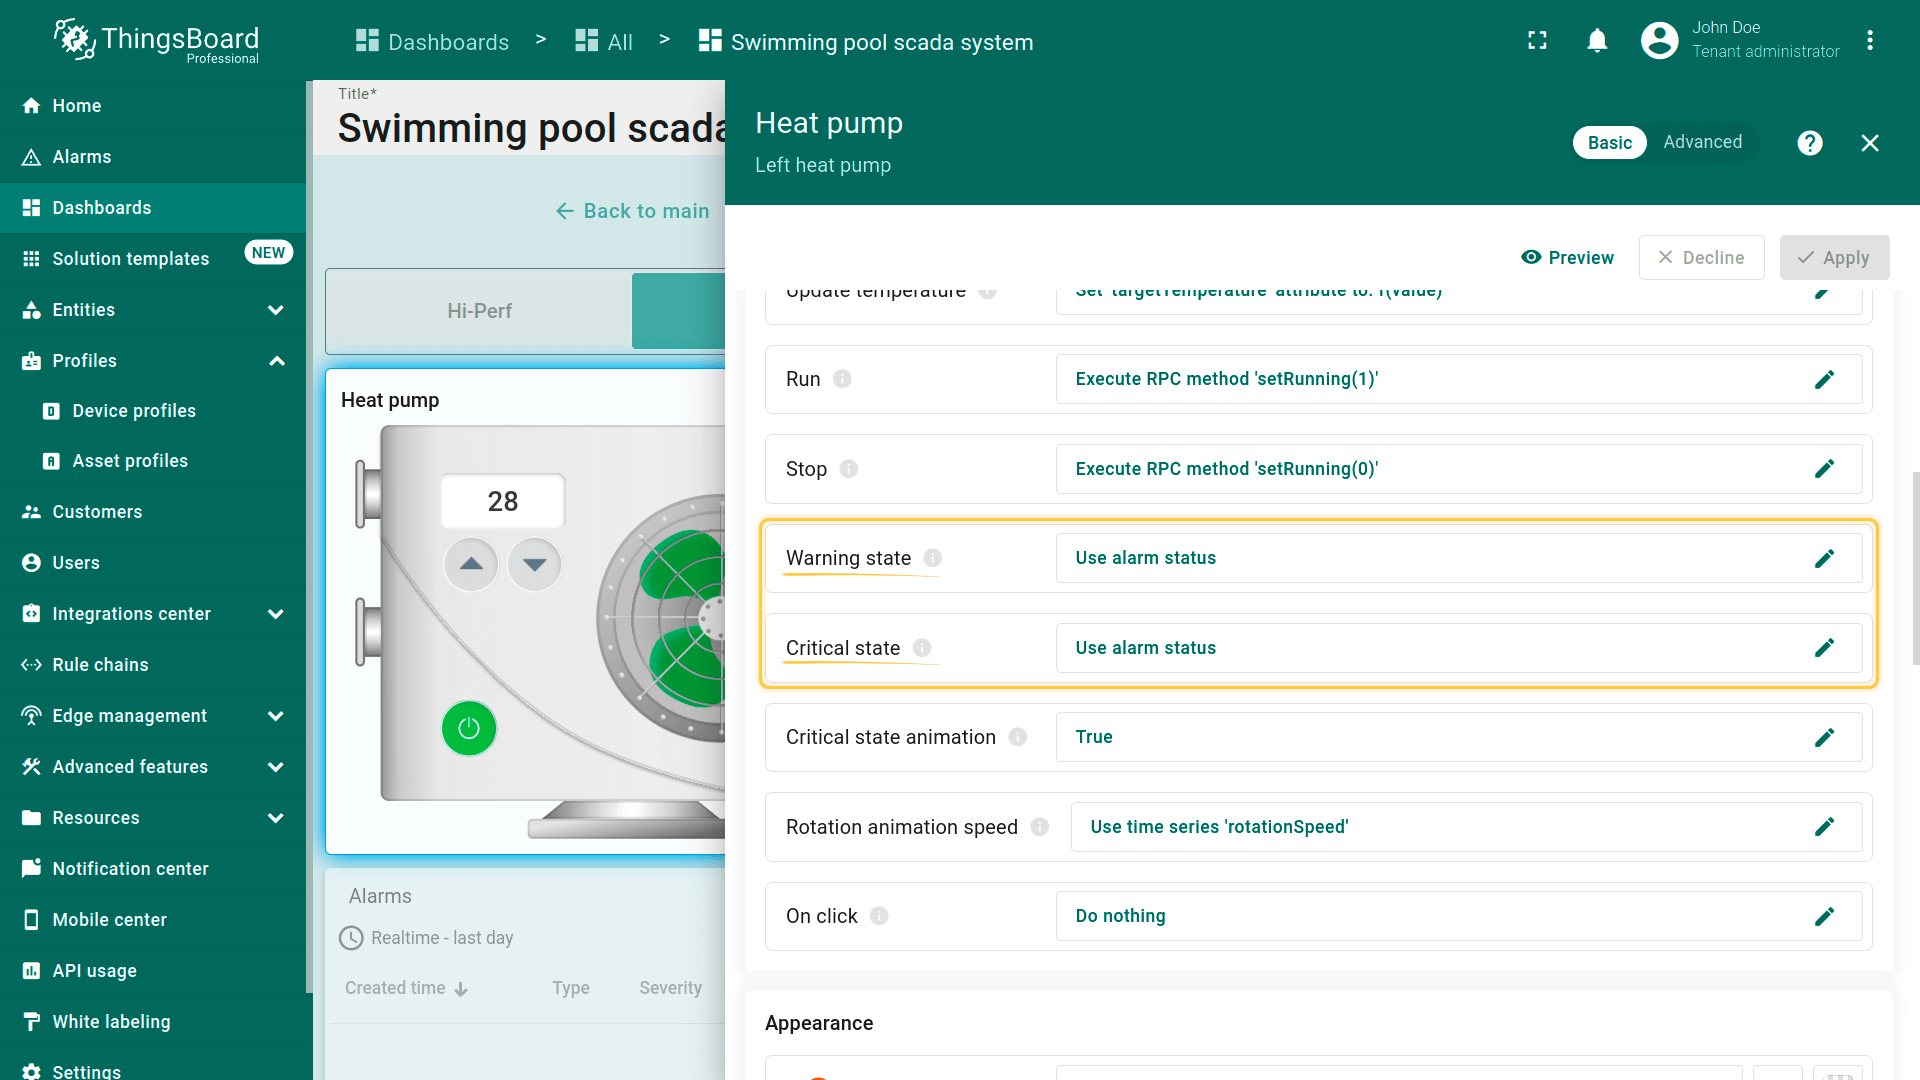 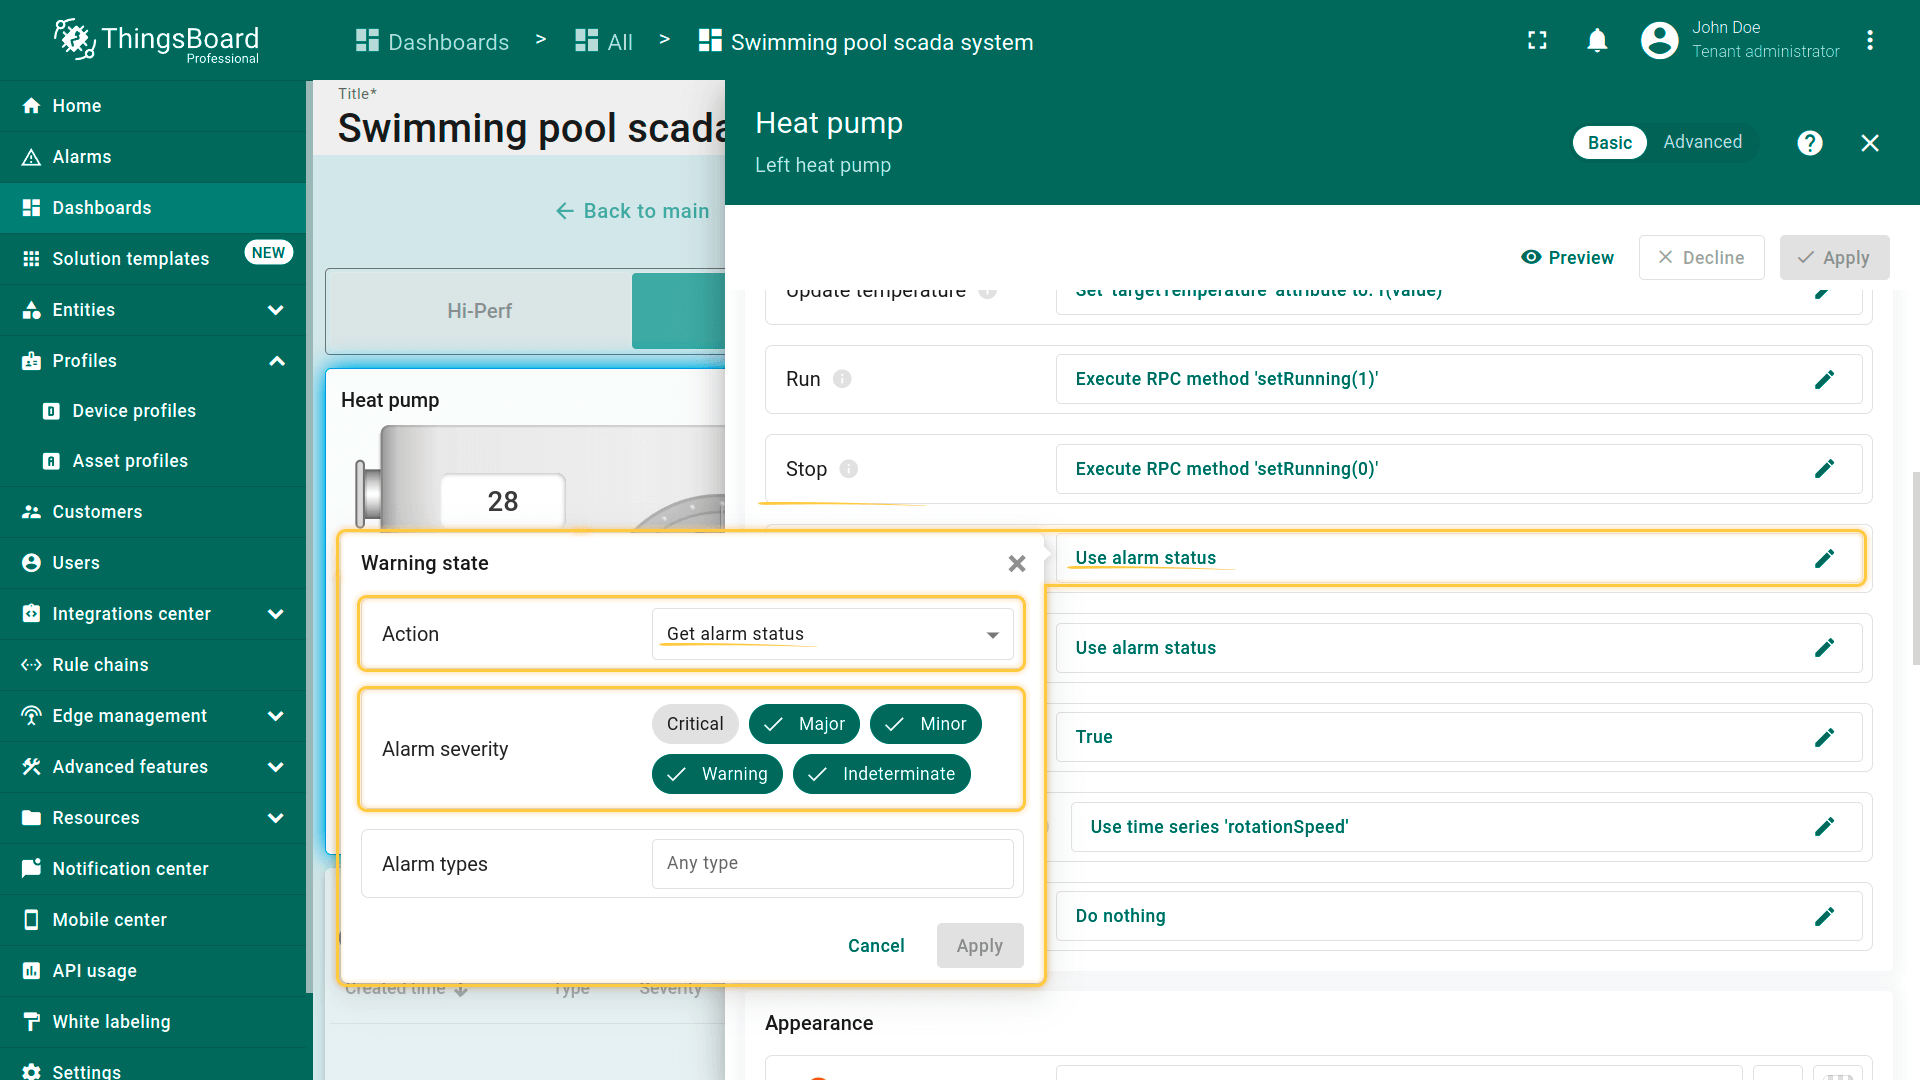 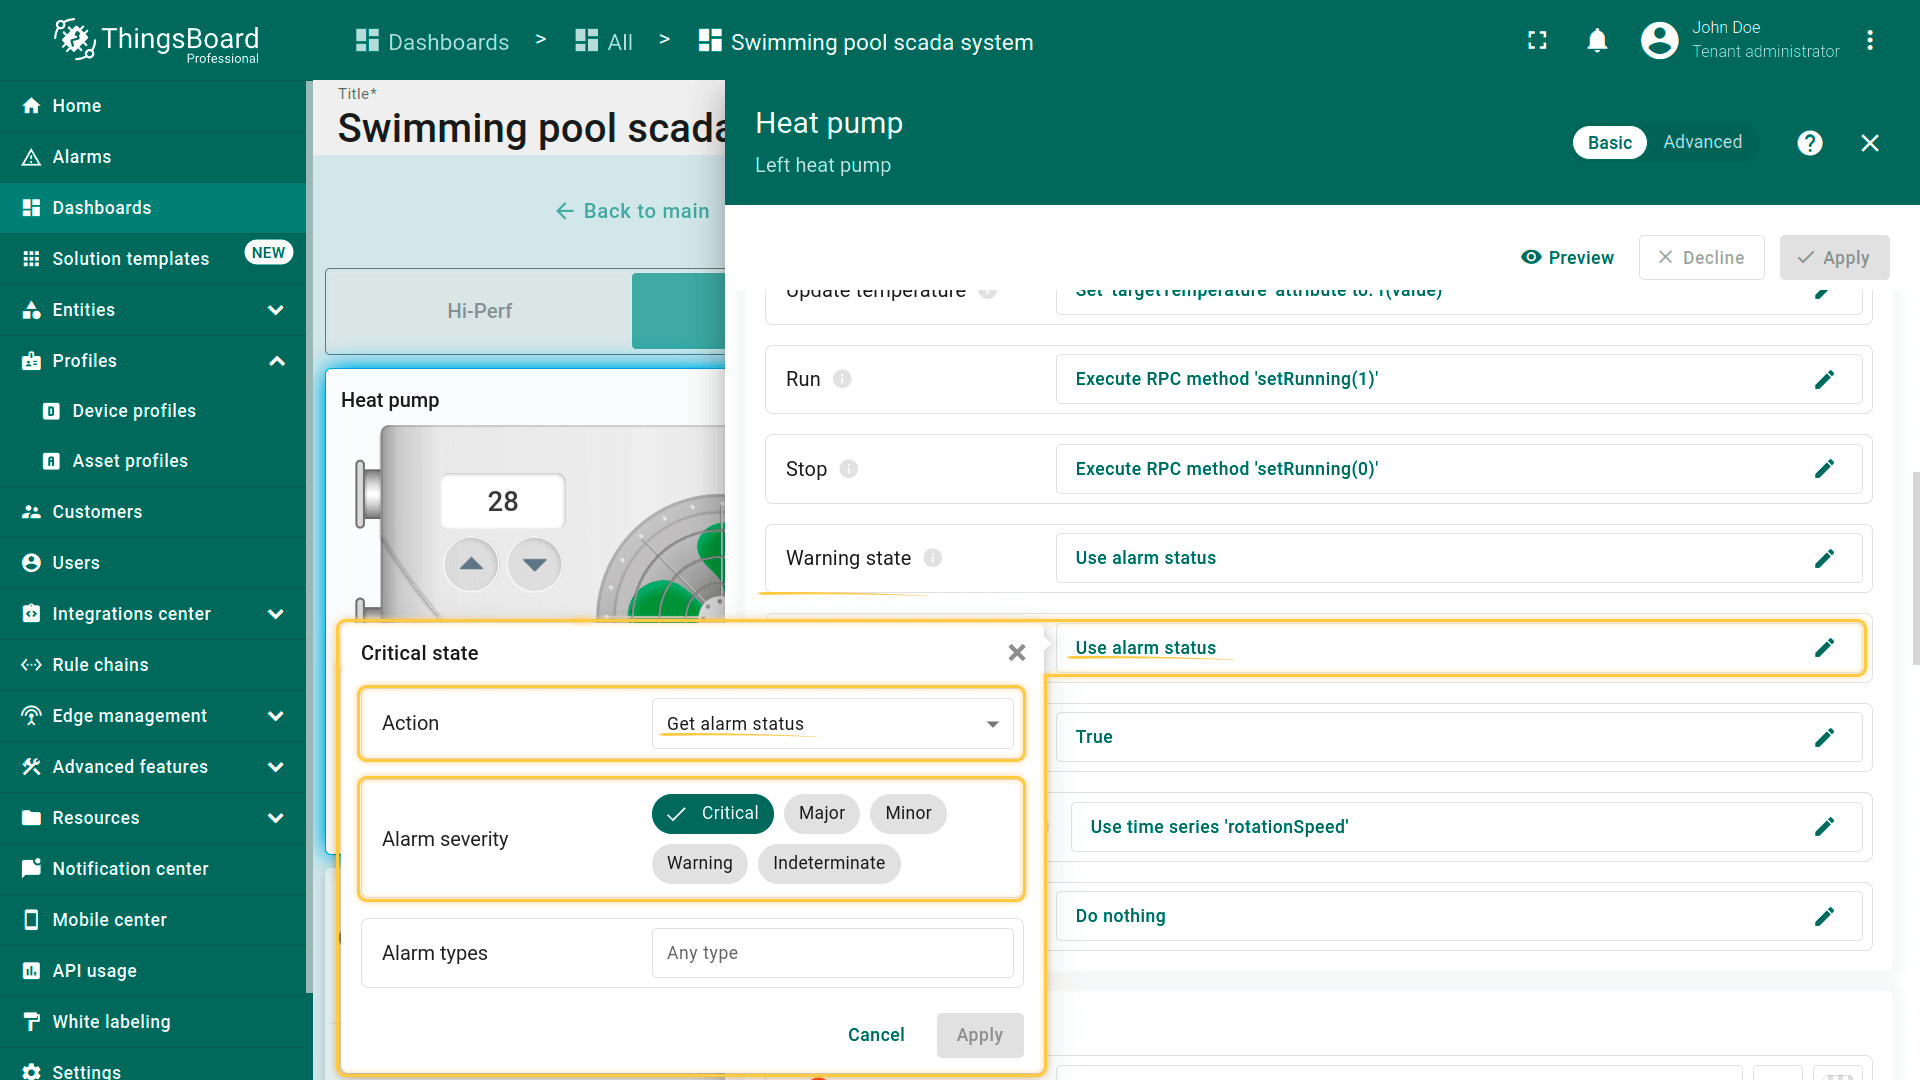 当告警规则触发时,桨叶将根据部件设置及设备配置中定义的告警严重程度类型改变颜色。 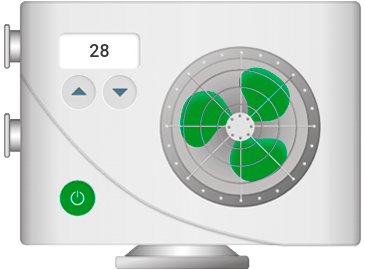 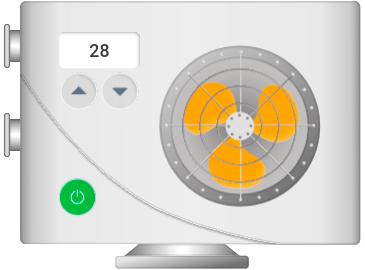 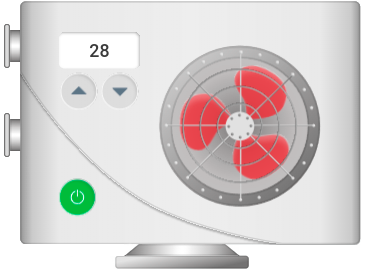 点击热泵设备可进入其状态页,查看运行数据与当前告警。详情包括转速、功耗、制冷剂压力等。 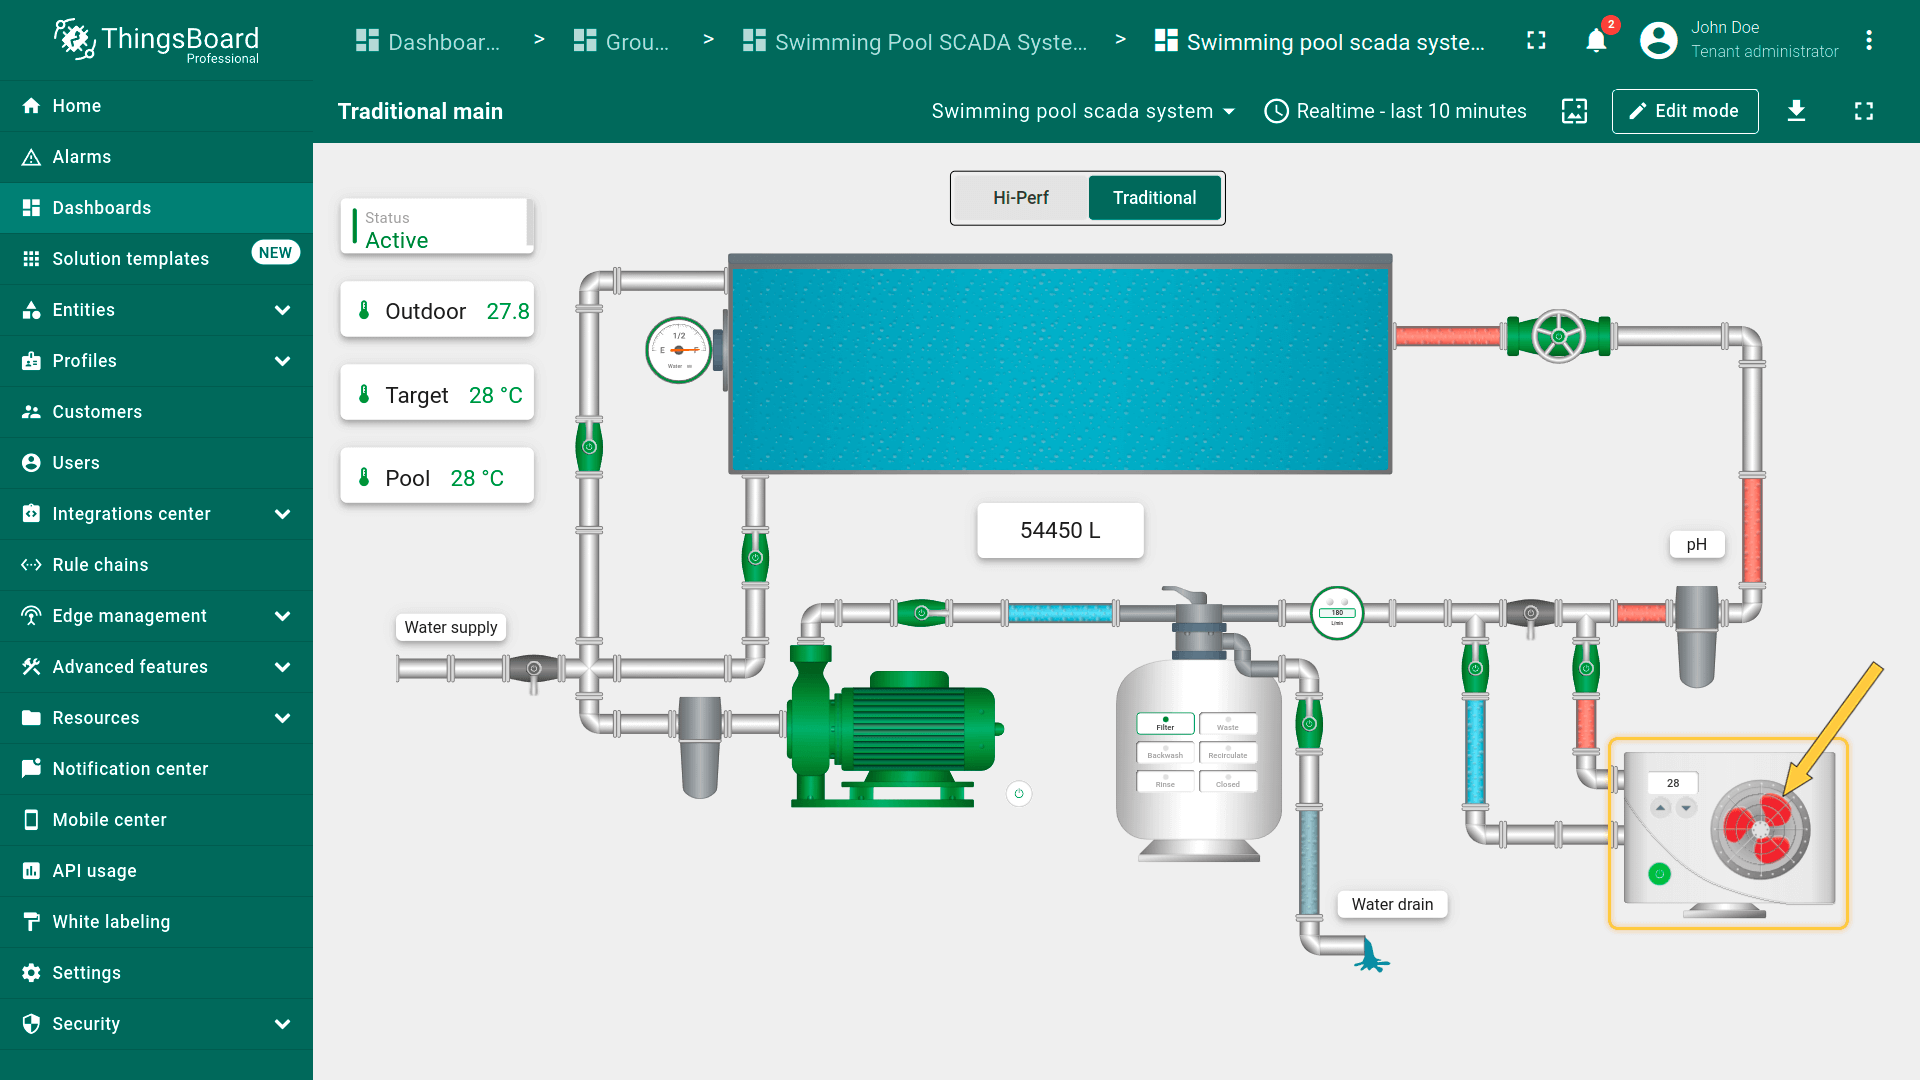 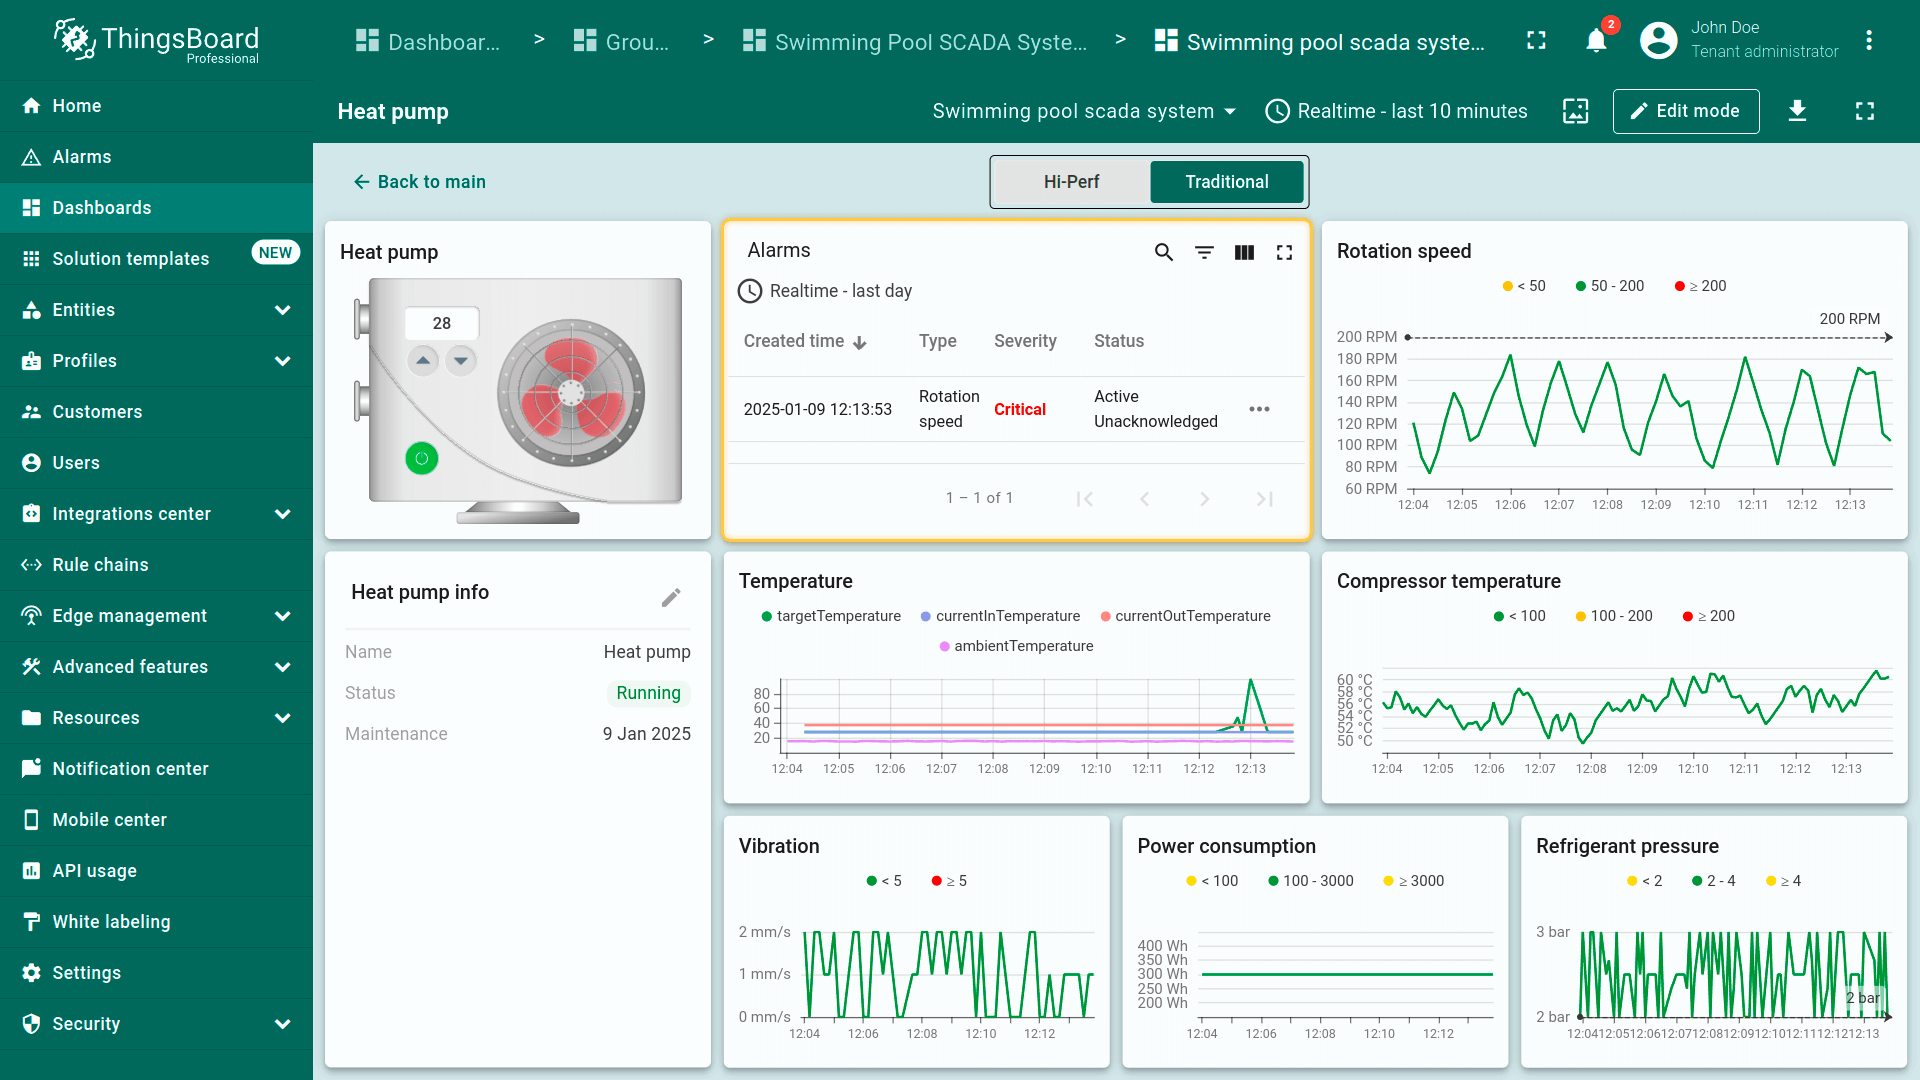 切换到”Alarms”页面可查看系统中所有活跃告警,按来源设备及其告警类型、严重程度分组展示。 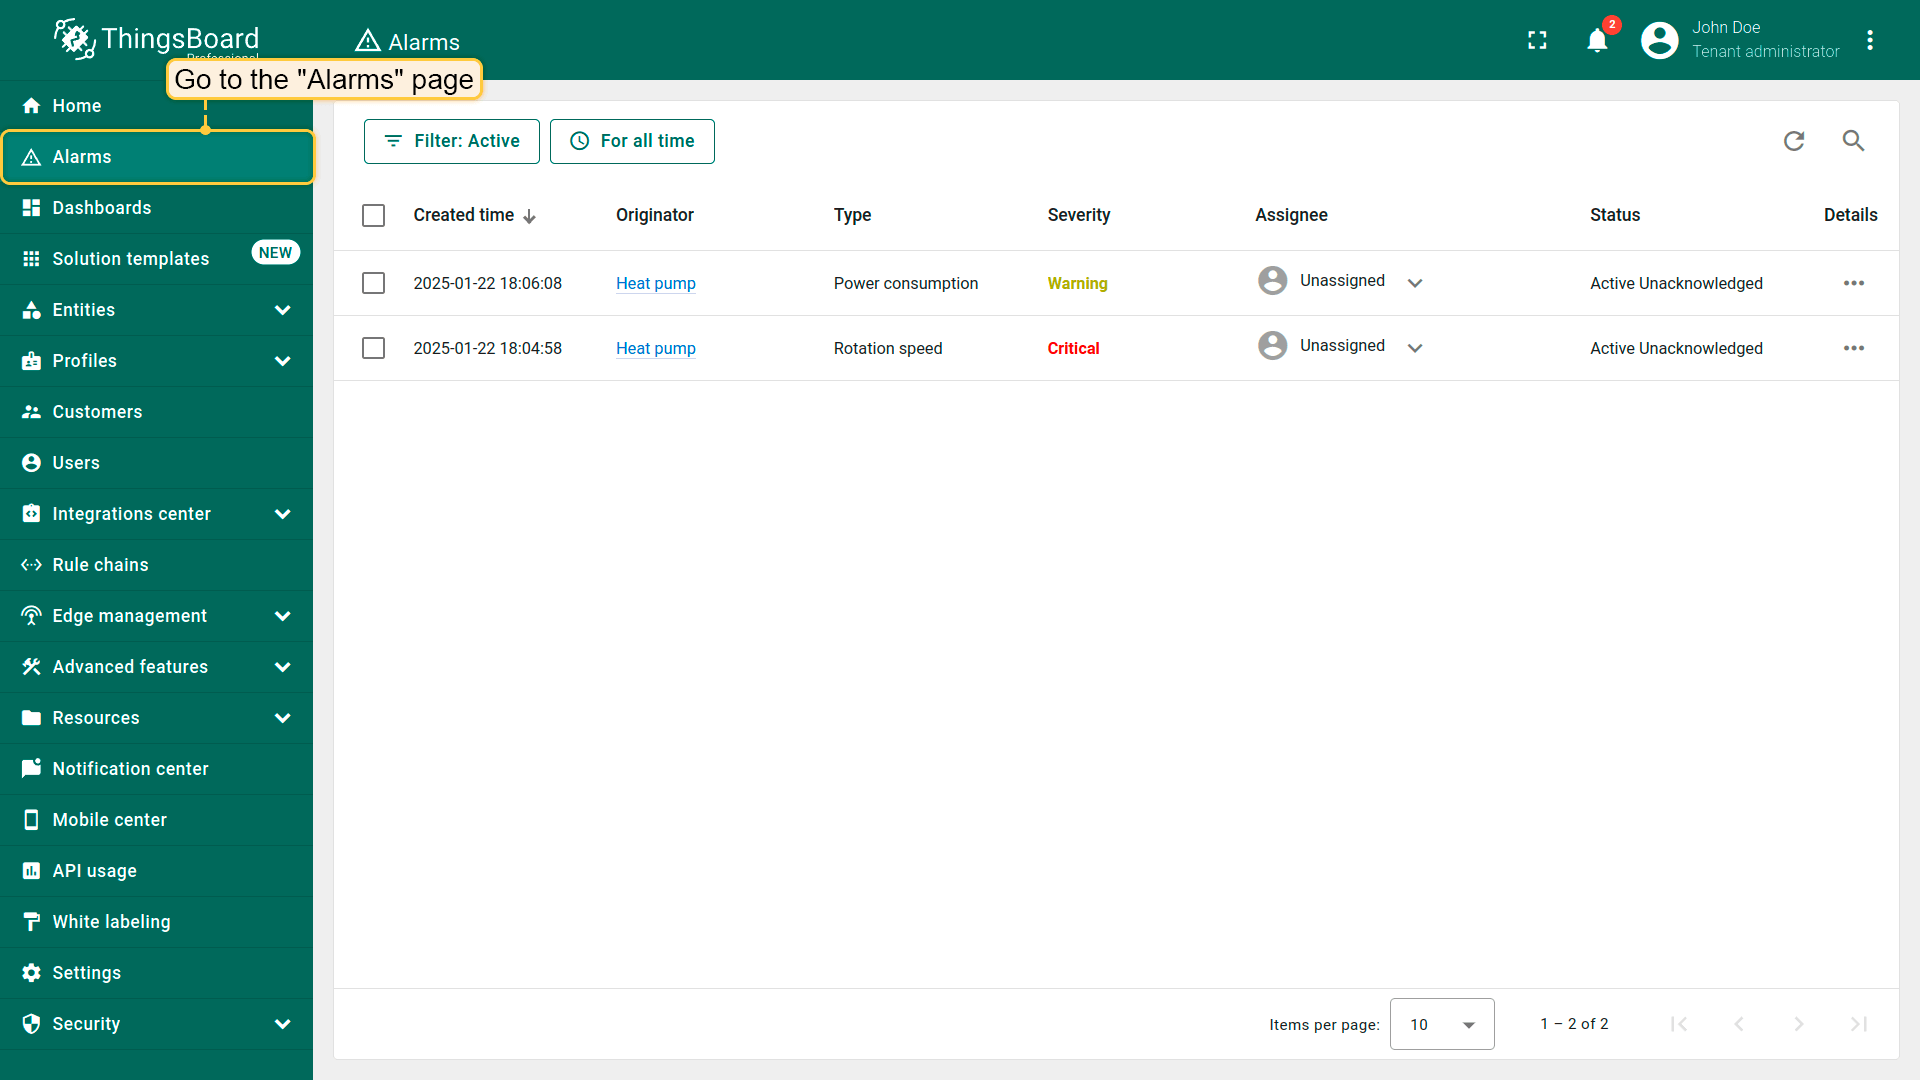 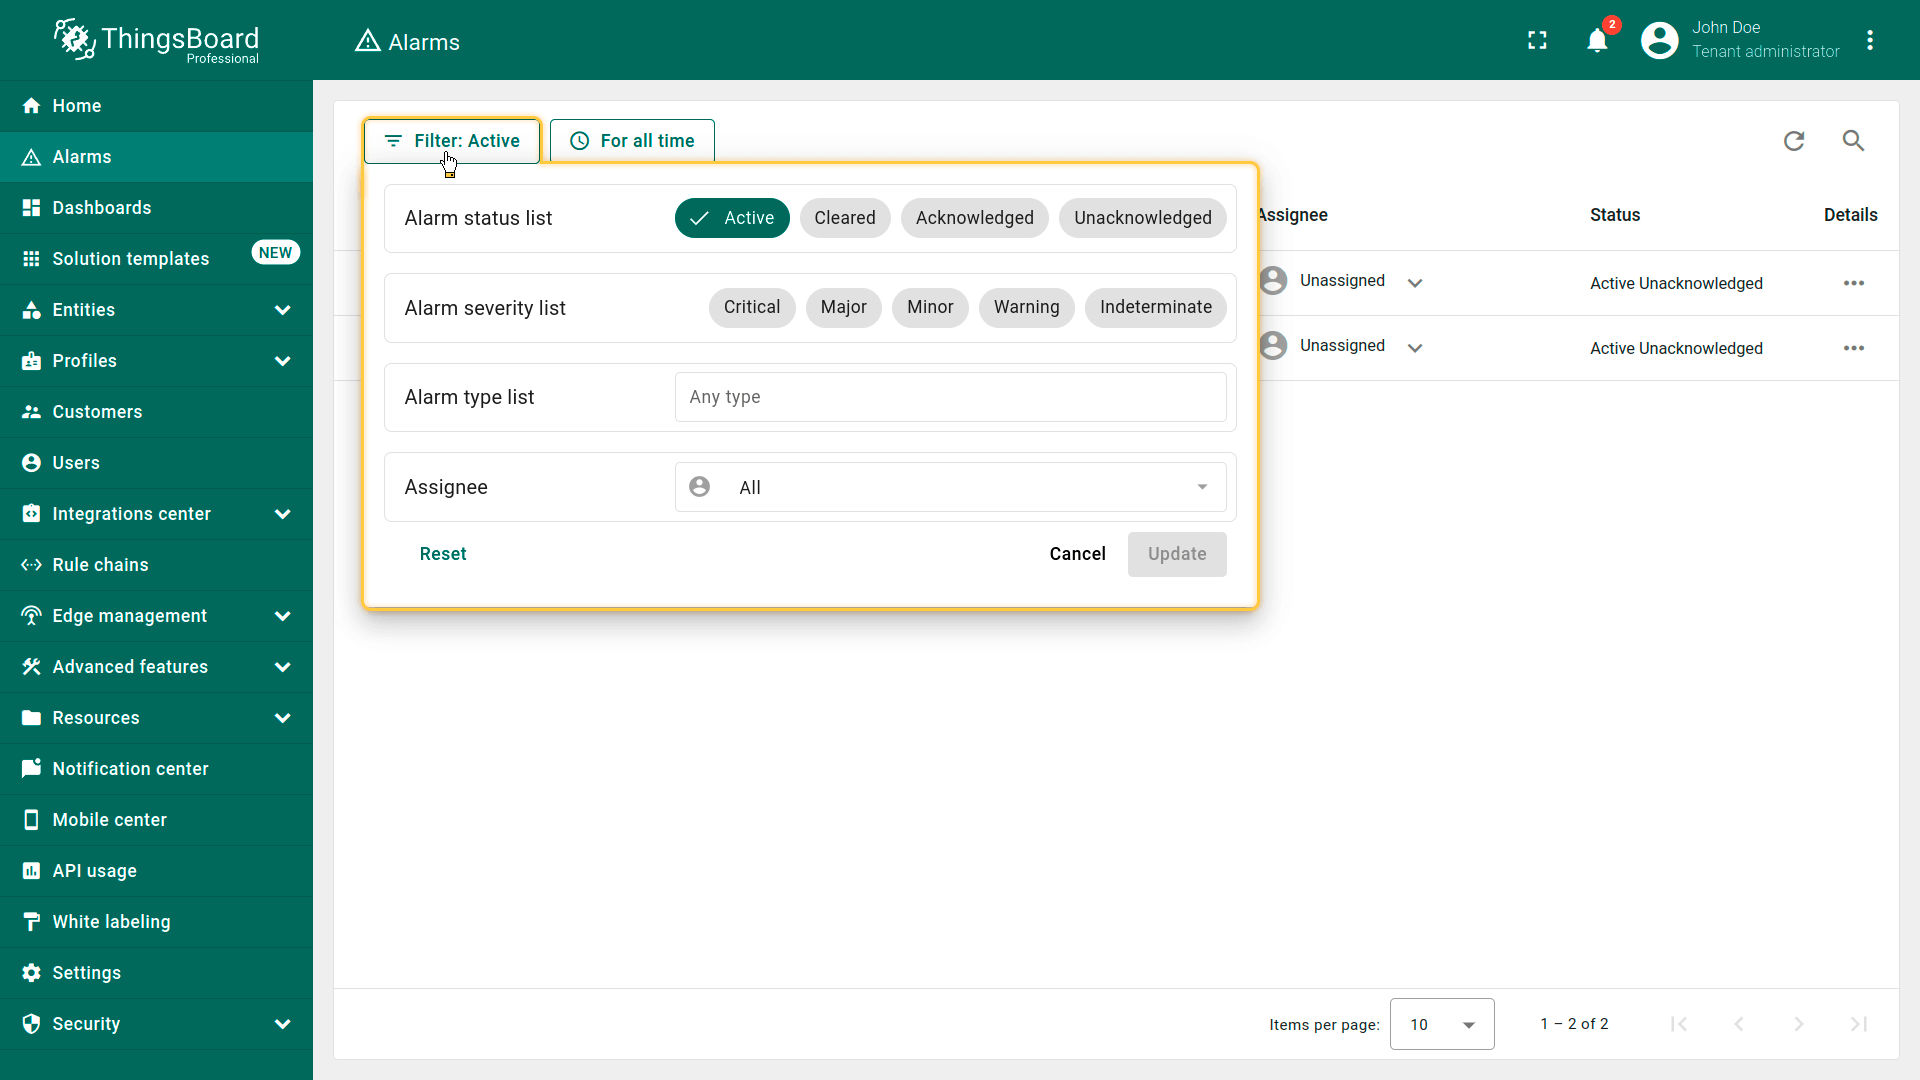 |
其他告警规则的配置与热泵的”Rotation speed”规则类似,请自行查看。
有关告警及其配置的更多说明,请参阅此处。
总结
Swimming Pool SCADA模板为游泳池组件的管理提供即用框架。 确保传感器与ThingsBoard间的无缝集成,支持实时数据采集、处理与可视化。 该配置不仅提升运营效率,更为游泳池系统的集中监管与控制提供可扩展且可靠的解决方案。