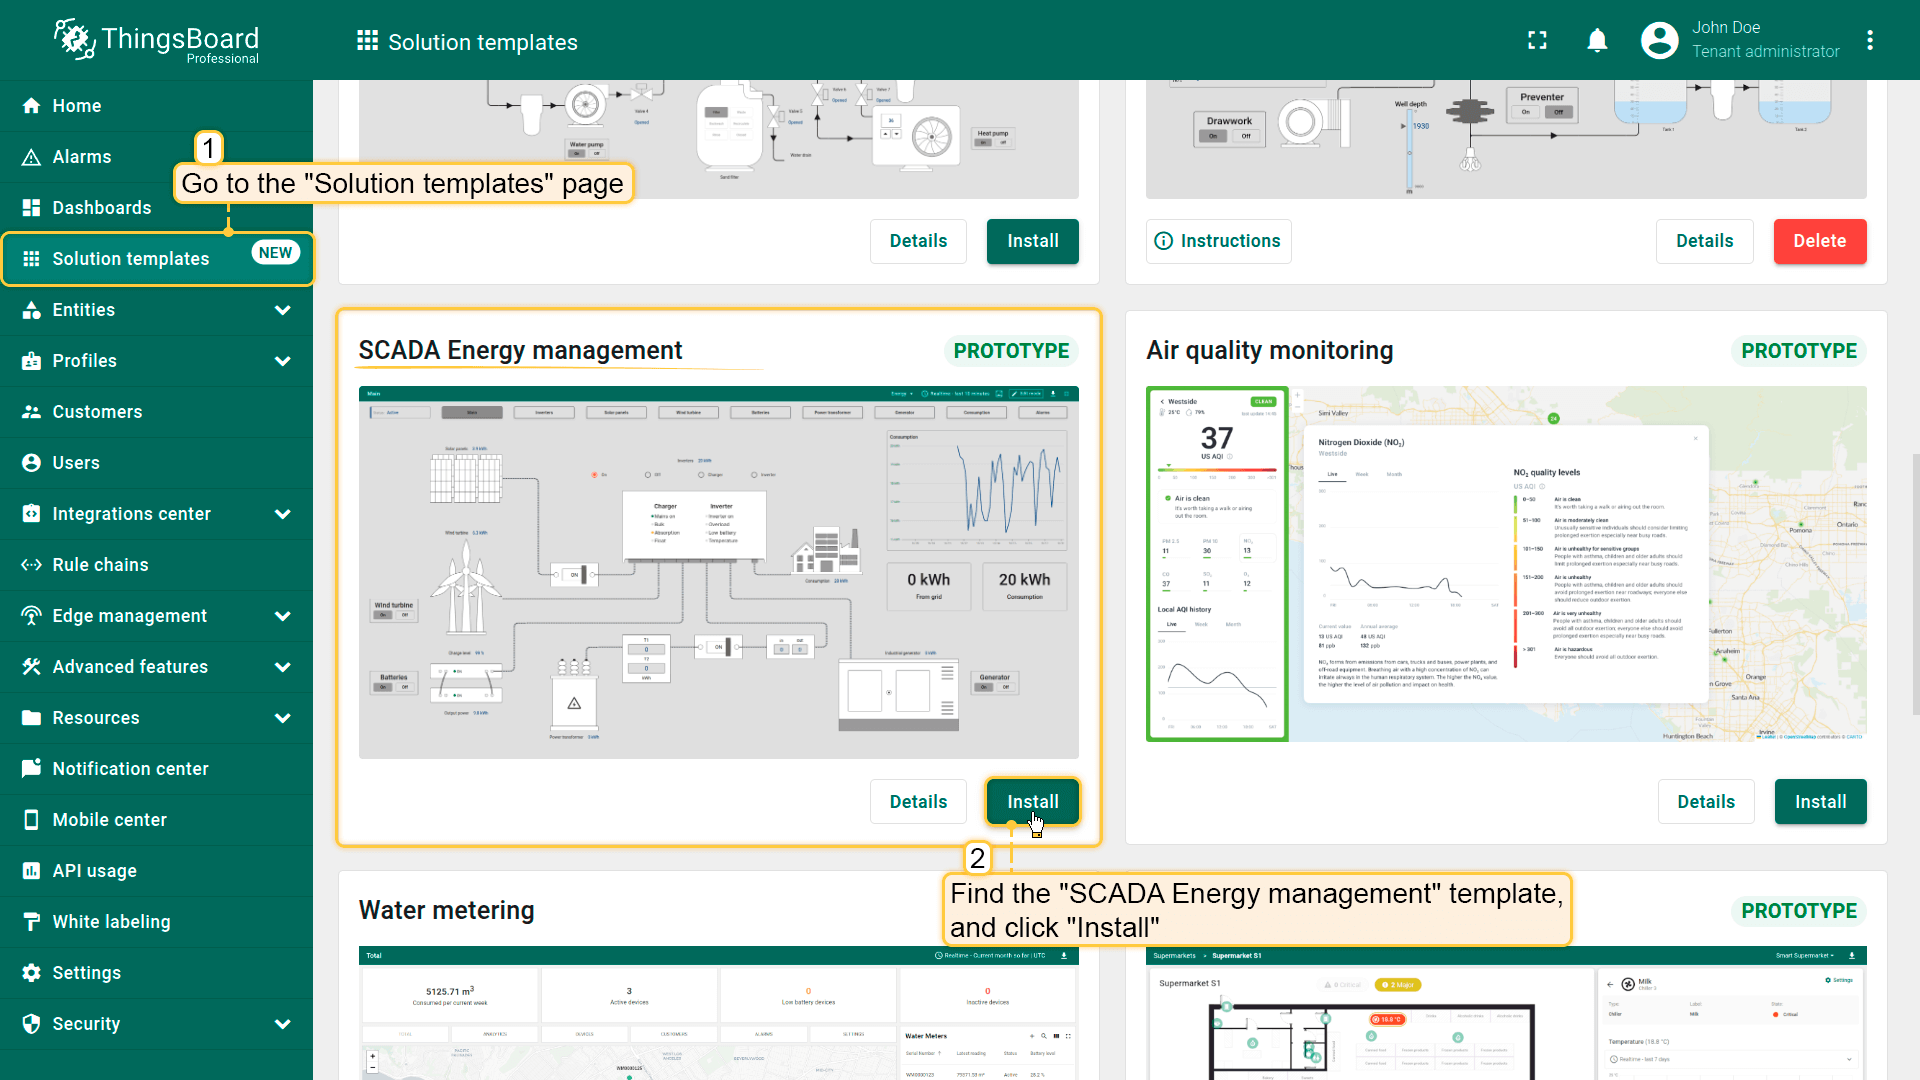
进入“Solution templates”页面,找到“SCADA Energy management”并点击“Install”开始安装。
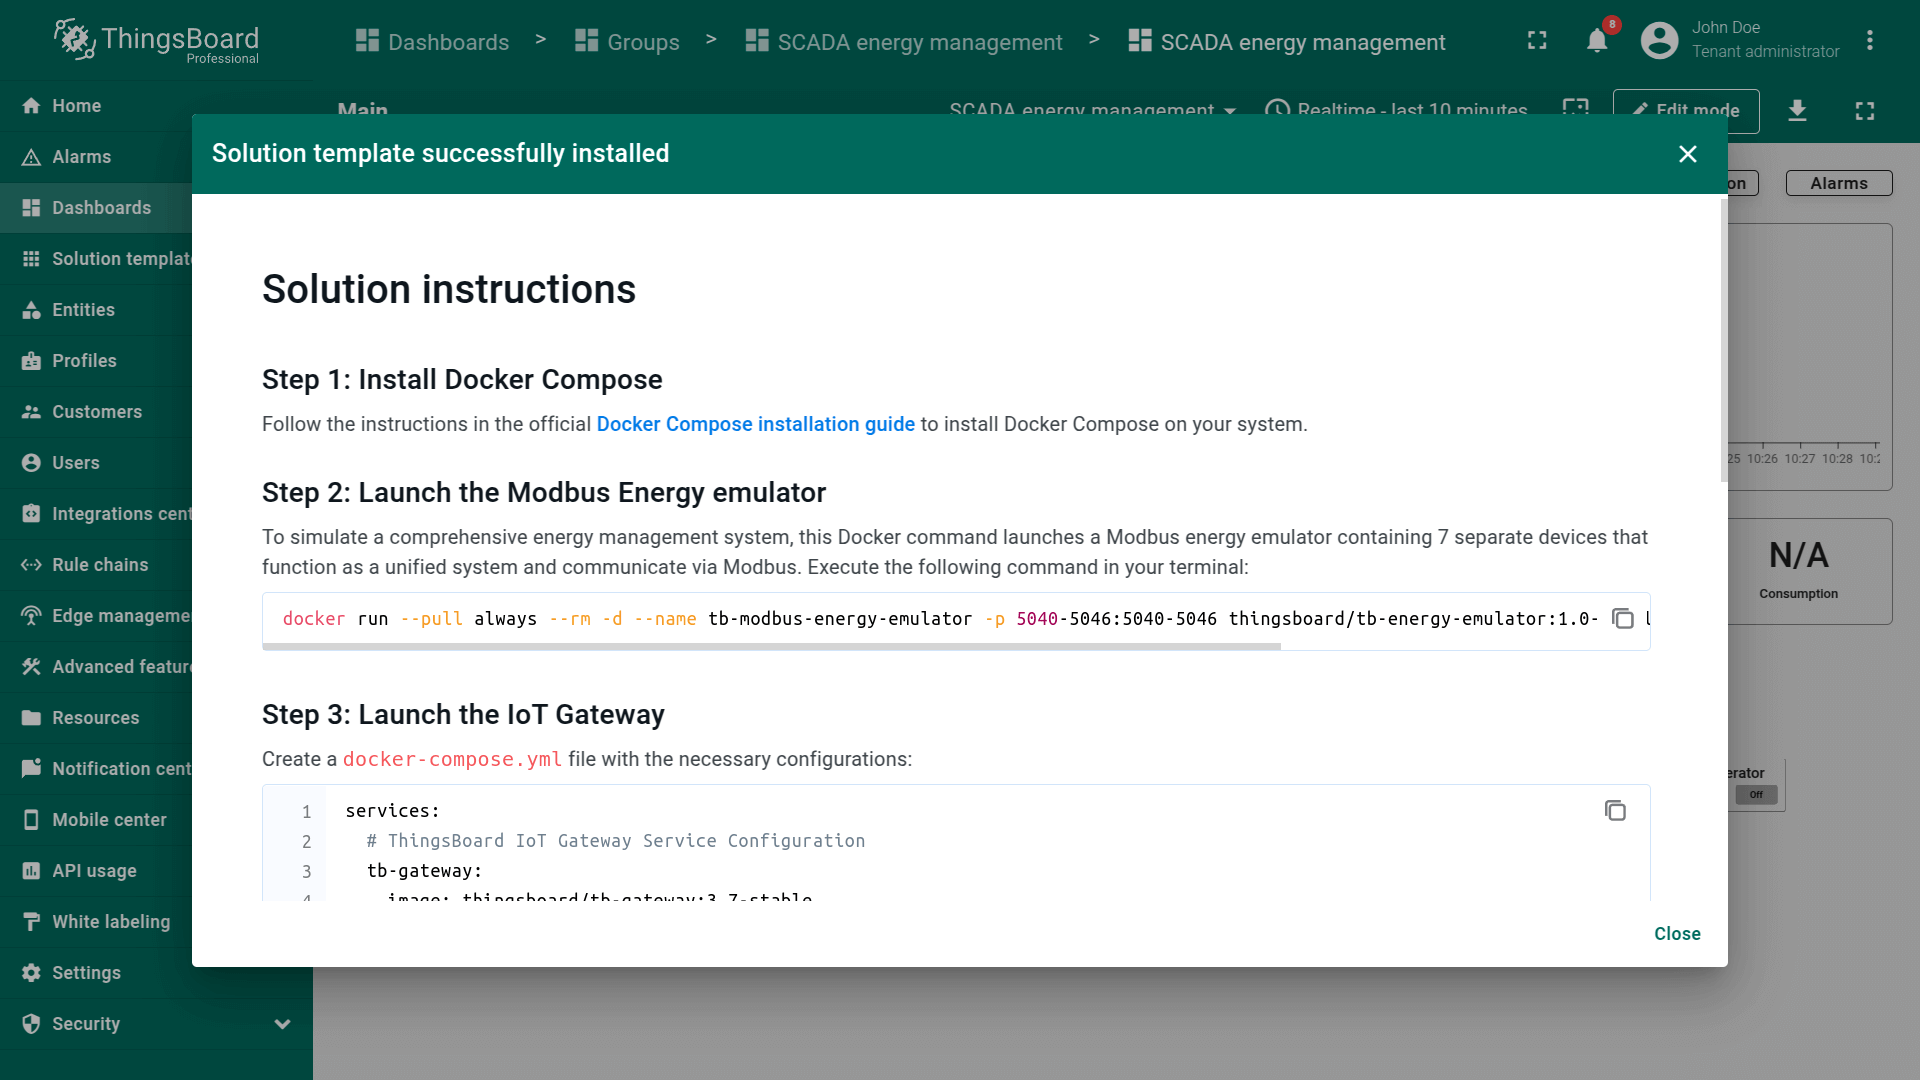
将提供该解决方案的配置说明,请按步骤操作。
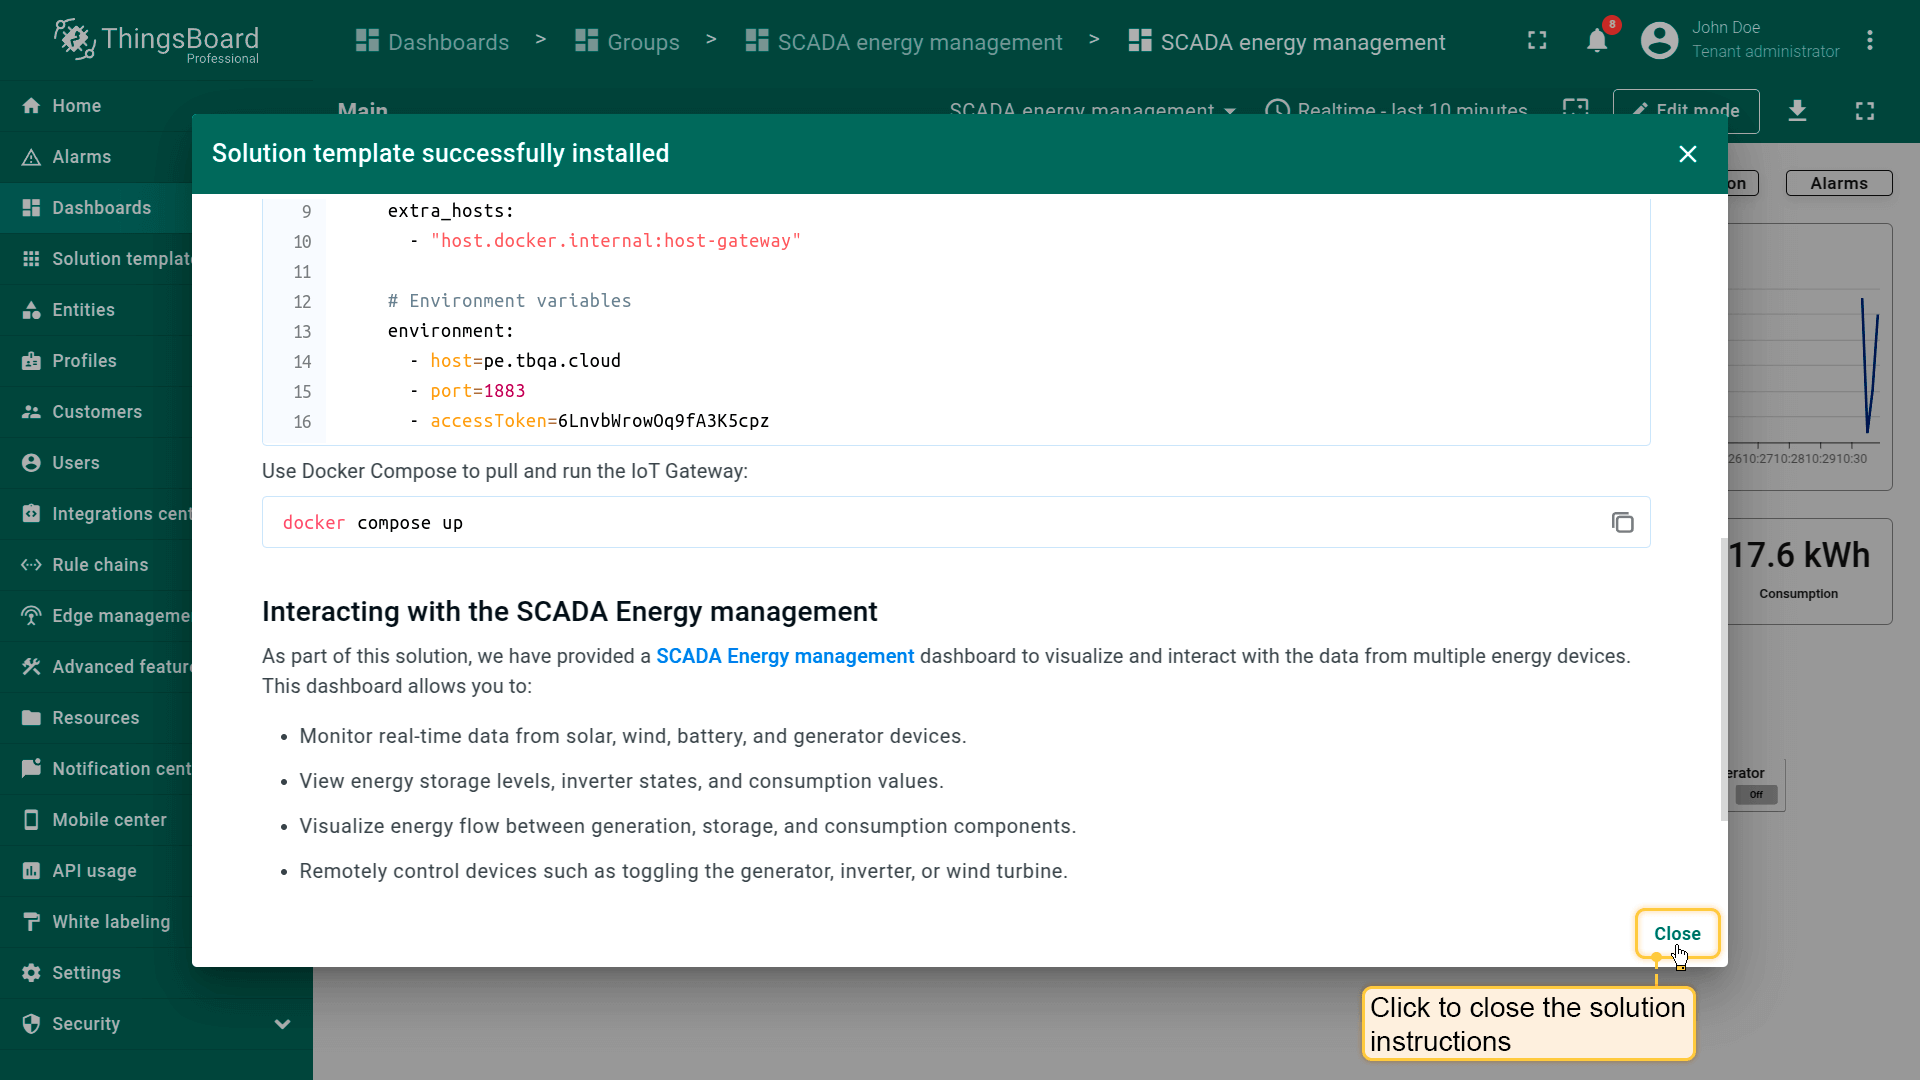
完成后点击“Close”完成设置并进入仪表板。
Go to the "Solution templates" page. Find "SCADA Energy management" and click "Install" to start the installation process.
Configuration instructions for this solution will be provided — follow the steps as instructed.
Once done, click "Close" to complete the setup and proceed to the dashboard.
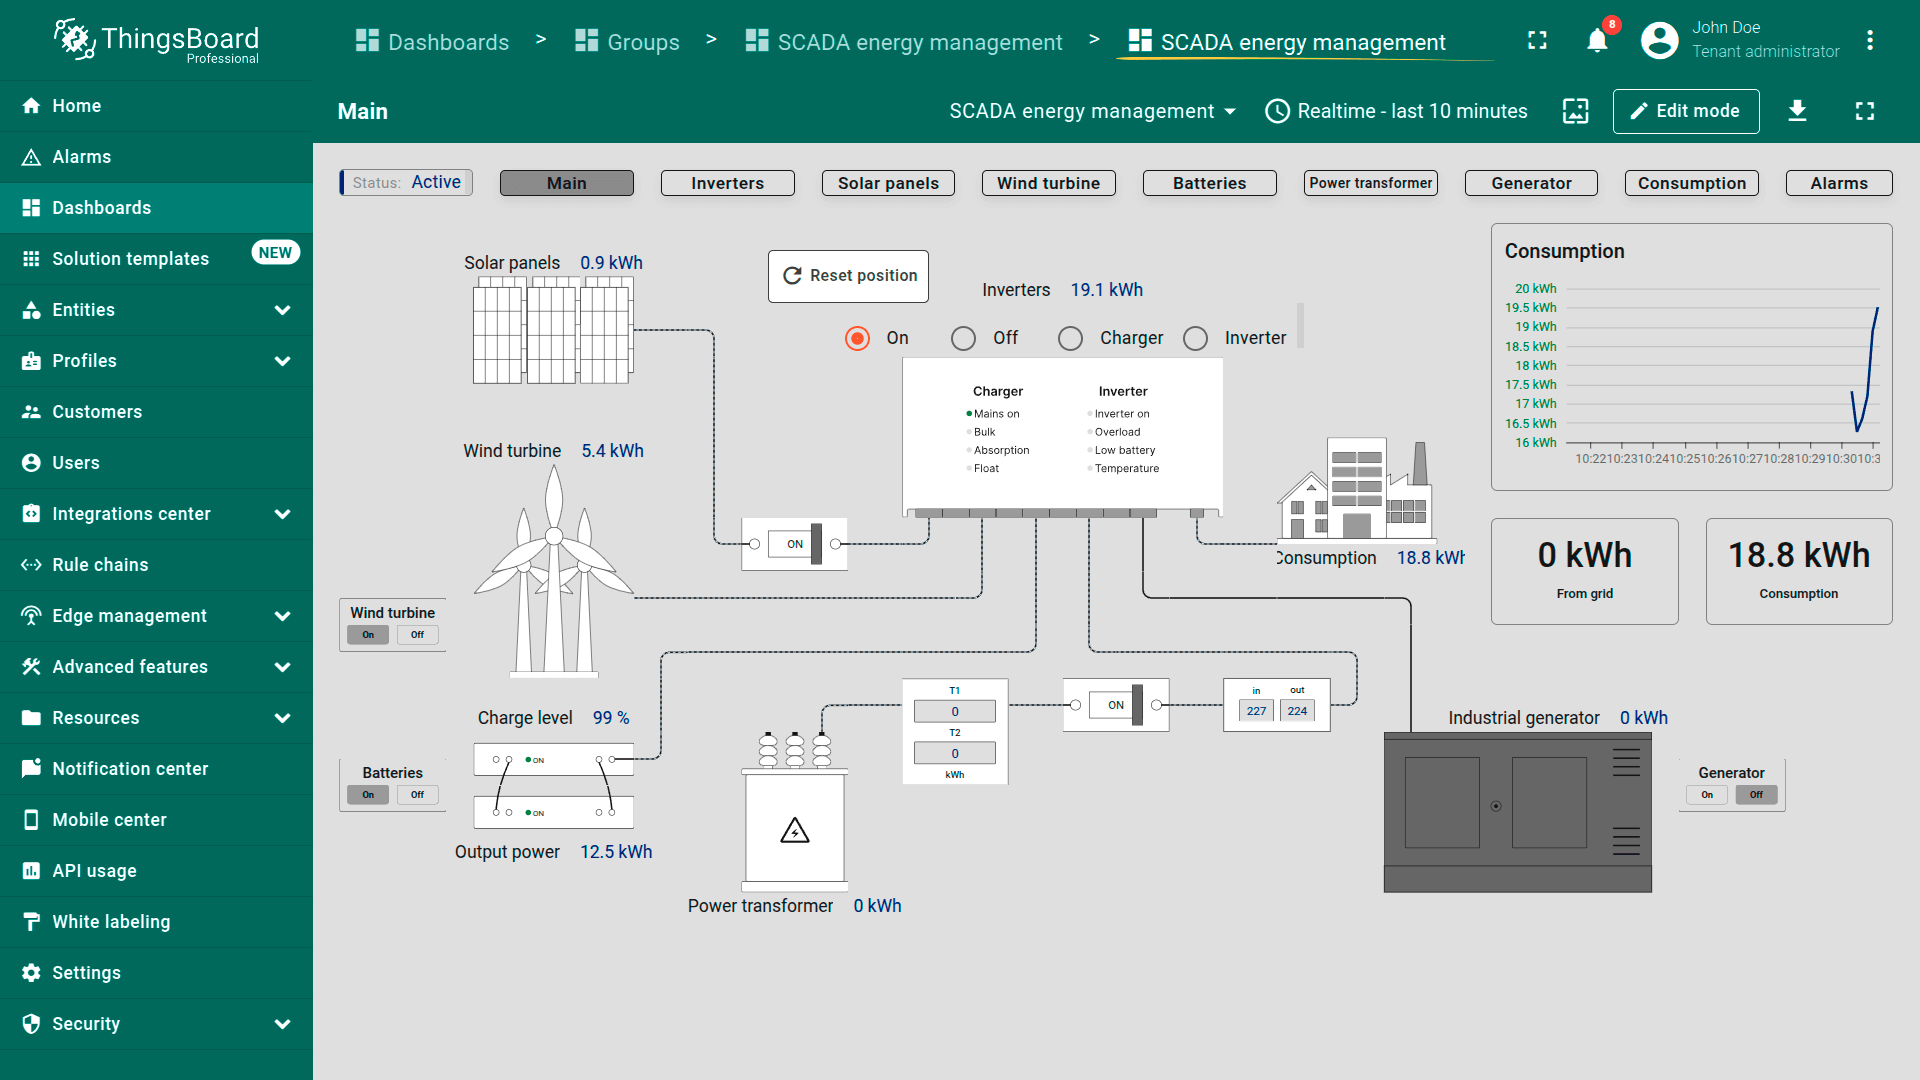
SCADA Energy management dashboard.
仪表板
SCADA System for Smart Energy Management仪表板用于能源资源的实时监测、控制与优化。
使操作人员可跟踪能源系统状态、分析能源流、监管发电机、逆变器、变压器、电池、太阳能板与风机的绩效。
仪表板通过内置告警与历史数据分析帮助检测故障、预防故障并提升能效。
确保可靠供电、减少能源损失并促进多能源源的无缝整合。
仪表板结构
通过导航按钮在仪表板状态间切换,以跟踪和管理各能源组件的详情。
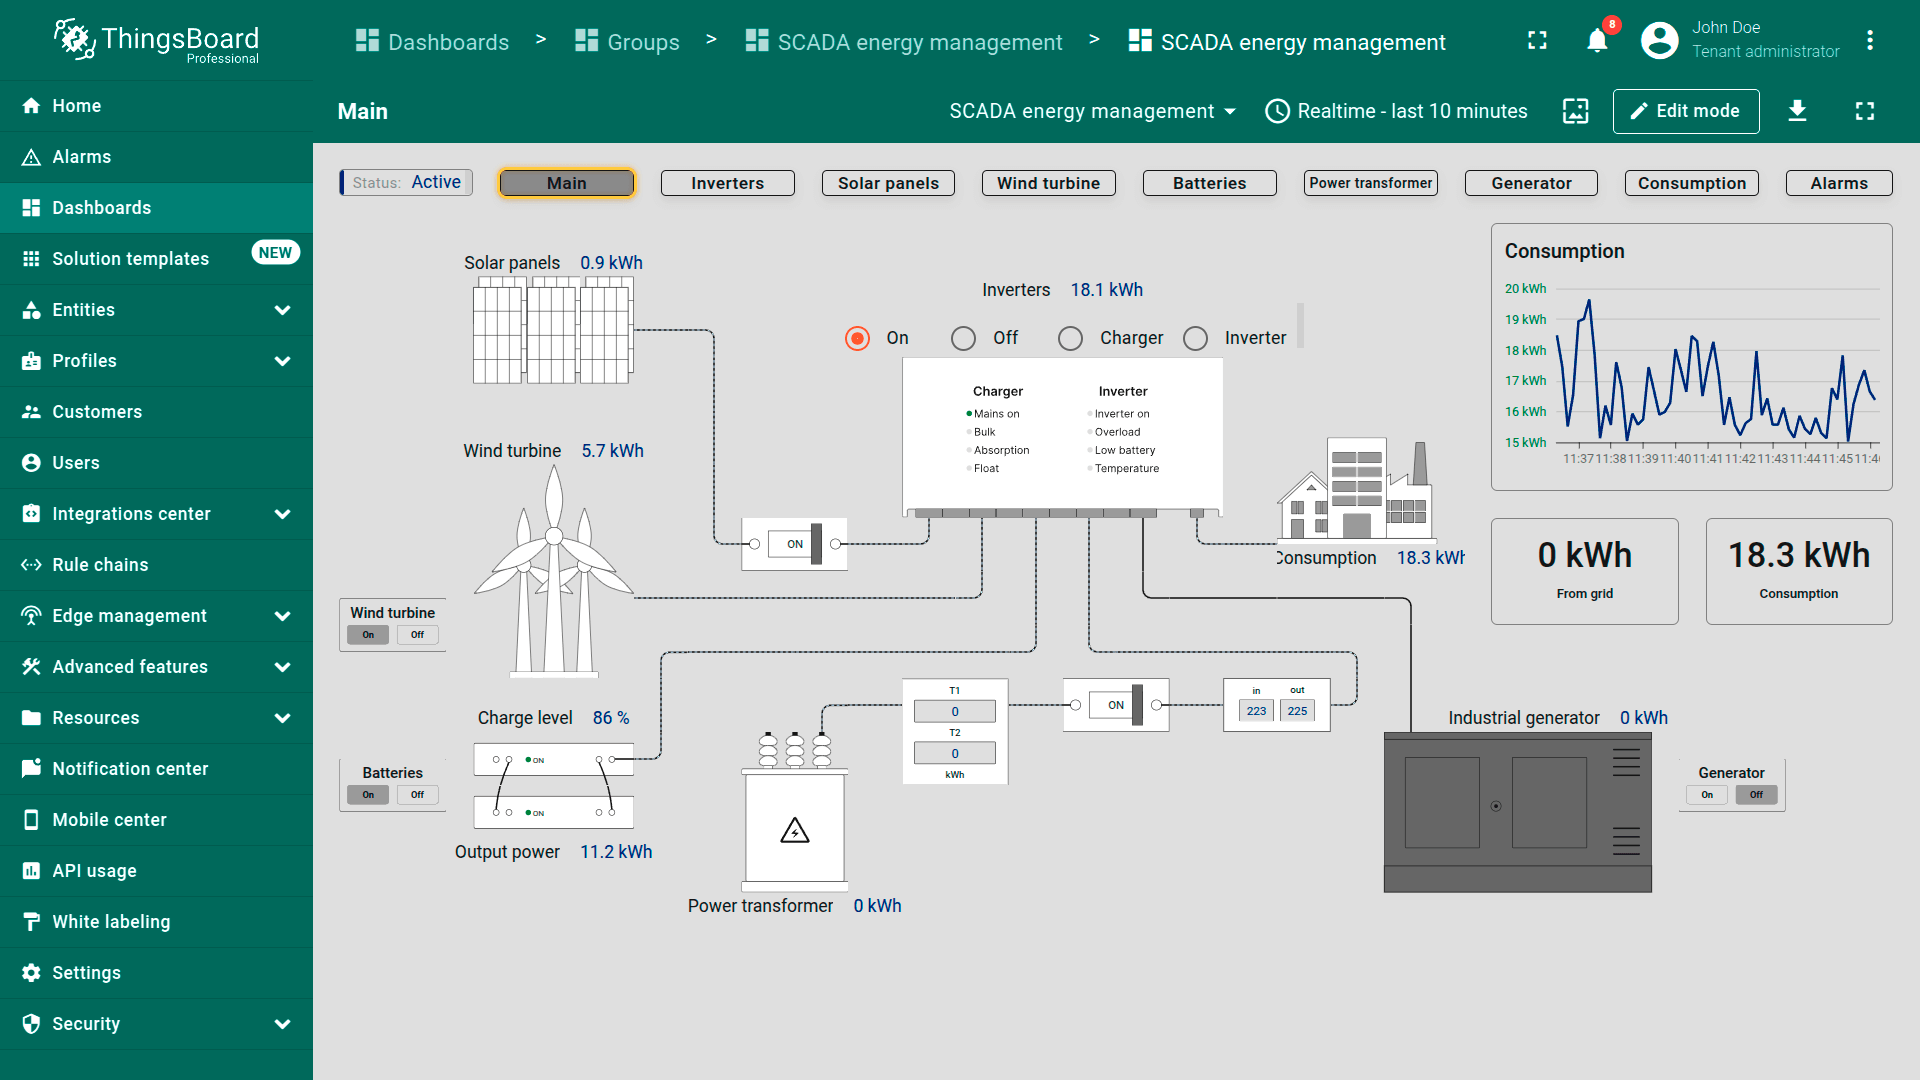
Main dashboard state。提供能源系统总览,展示电源状态(太阳能、风能、电池、变压器、发电机)、实时能源流与用电。电网输入、用电量、电池水平等关键指标均以交互控件展示,用于管理电源。
Main dashboard state. Provides a high-level overview of the energy system. Shows the status of power sources (solar, wind, batteries, transformers, generators), real-time energy flow, and consumption. Key metrics like grid input, power usage, and battery levels are displayed with interactive controls to manage sources.
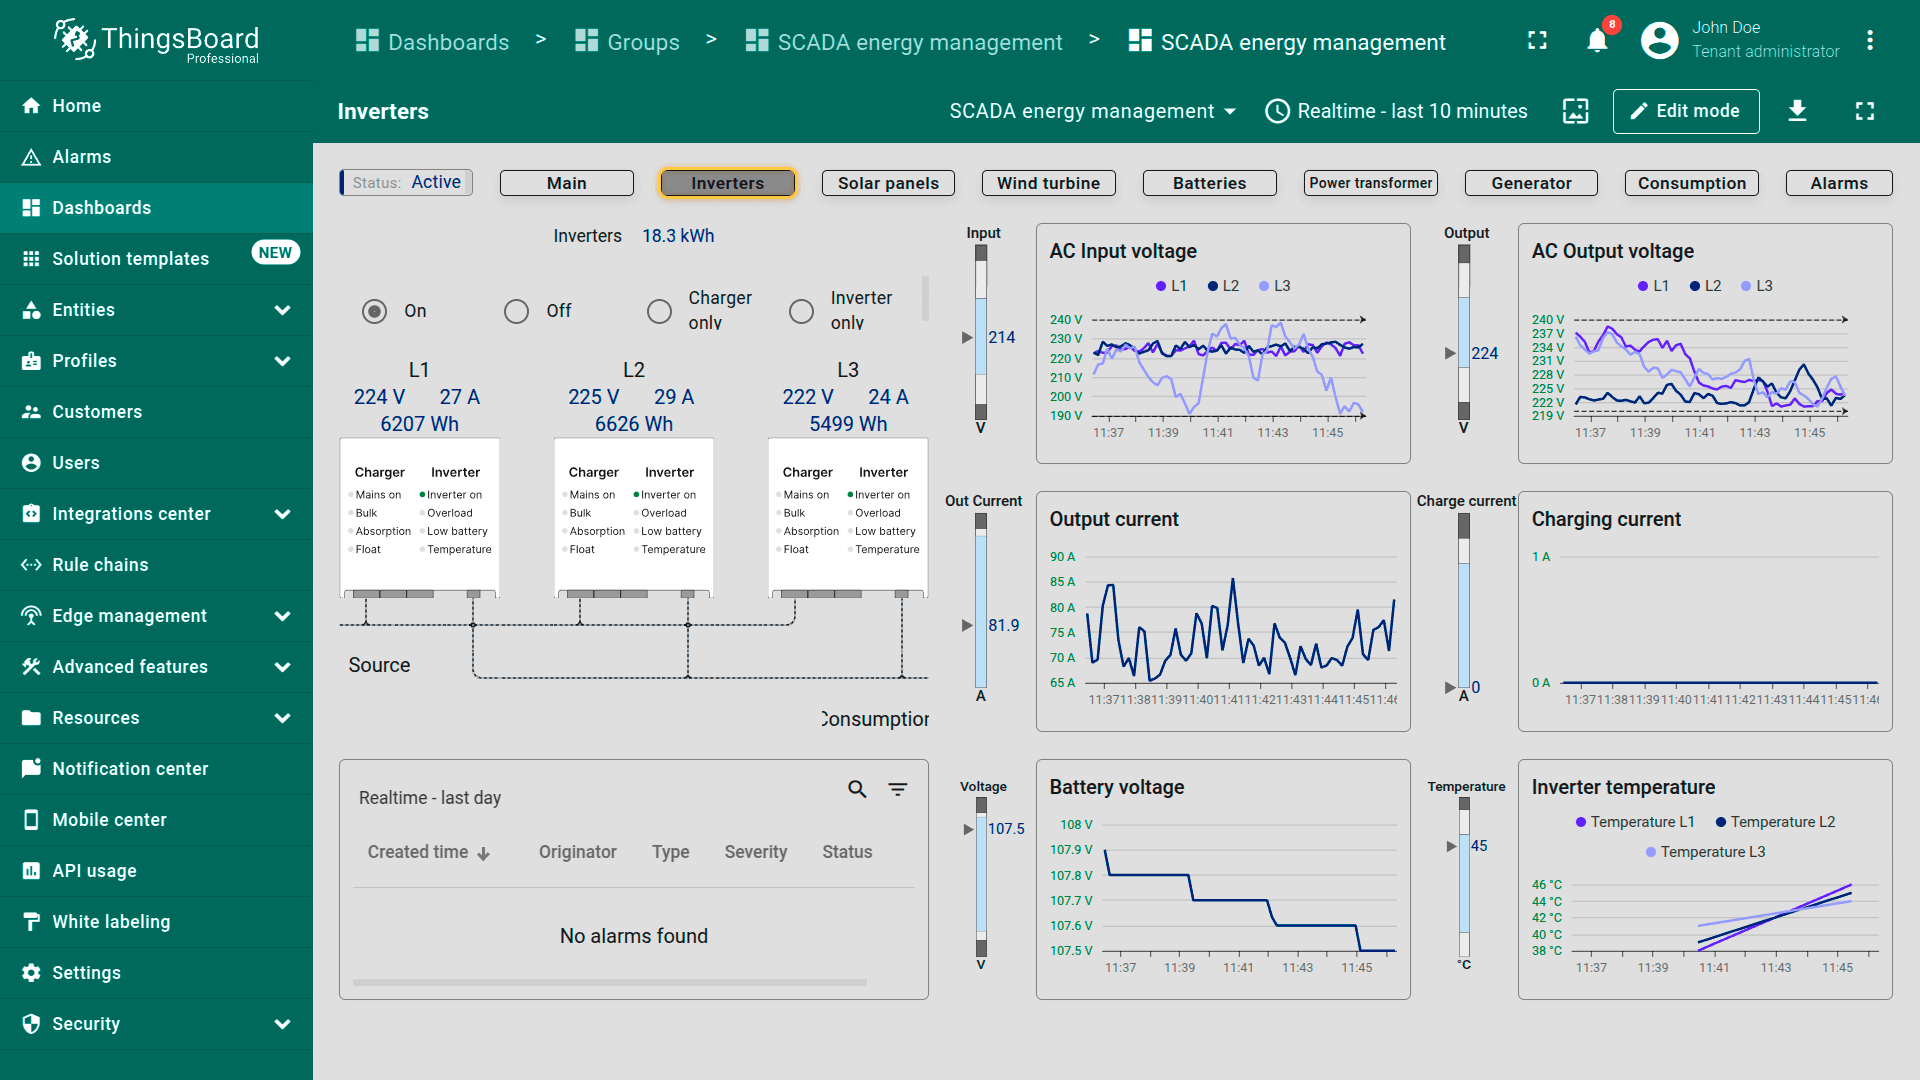
Inverters. Focuses on inverter performance and load distribution. Displays voltage, current, and power output for each phase (L1, L2, L3), with real-time graphs and an alarm section for issues like overload or overheating.
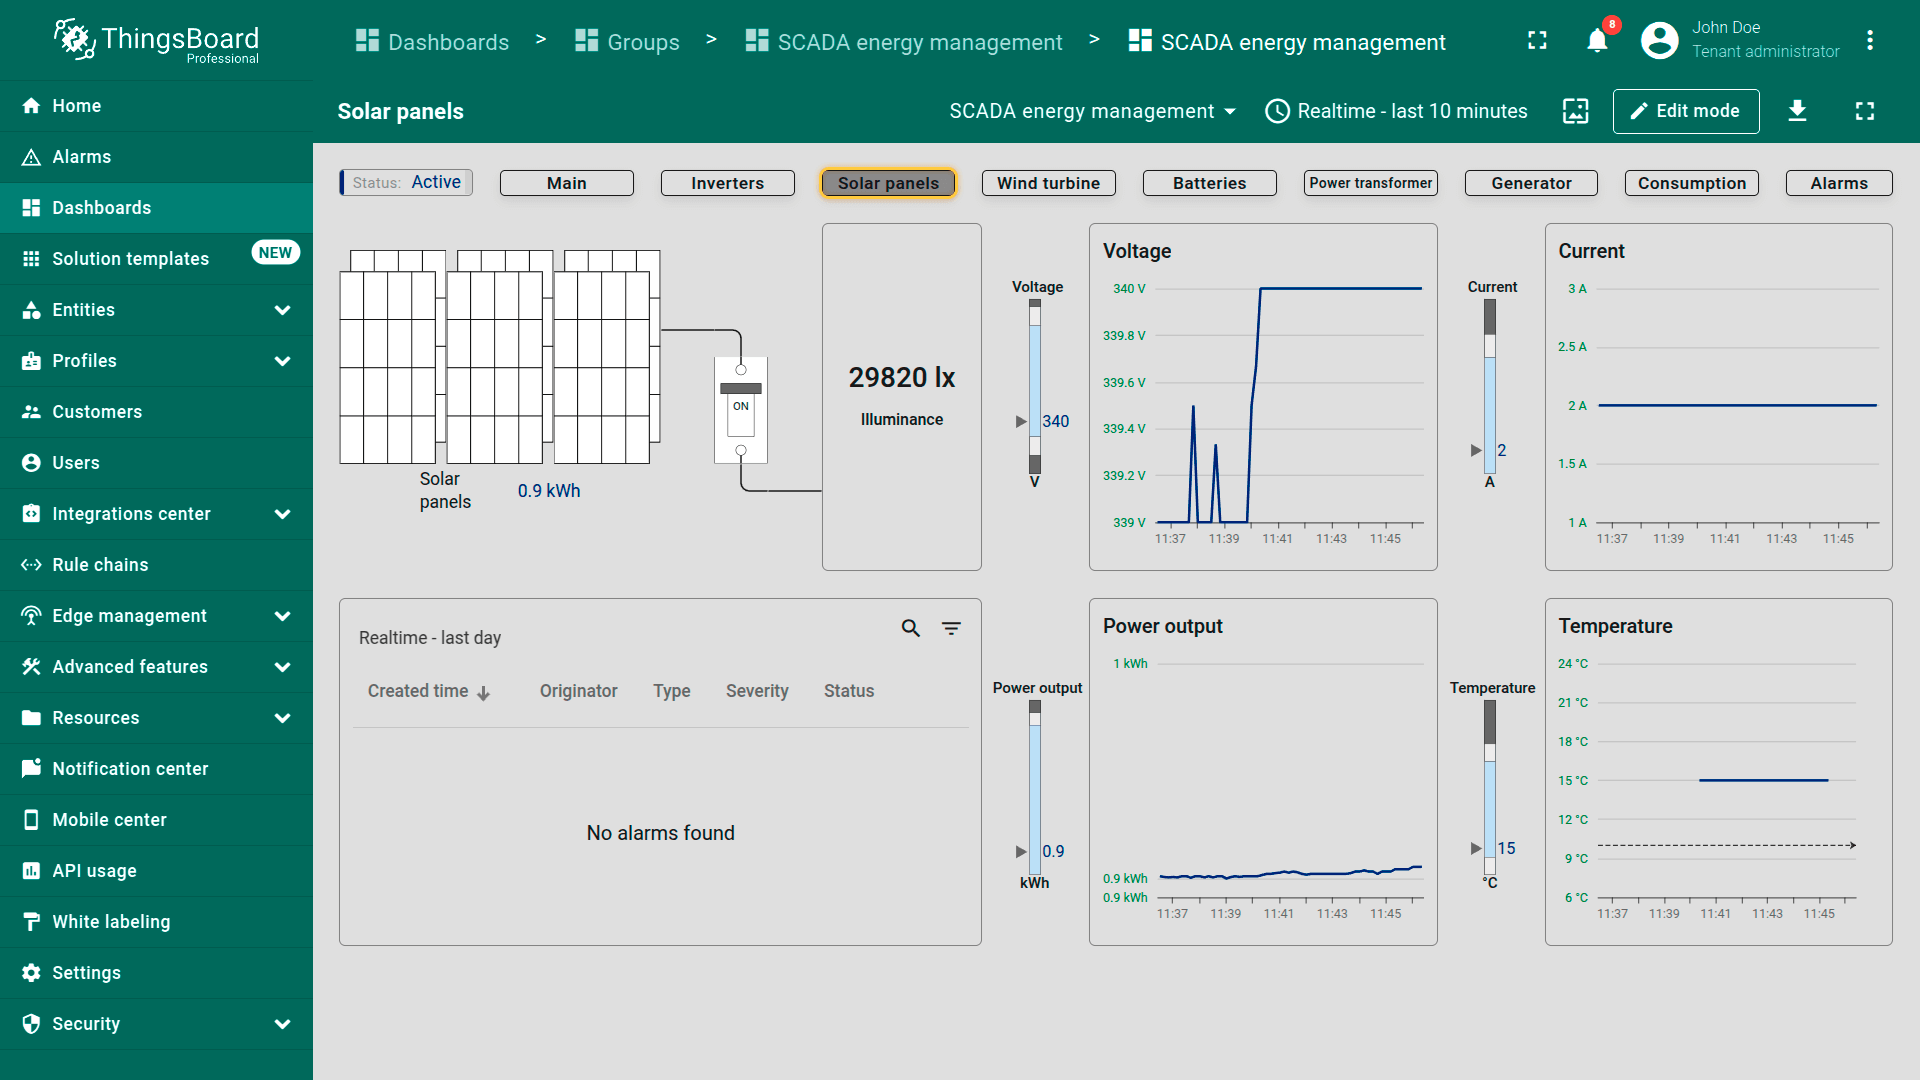
Solar panels. Monitors solar panel performance in real time: illumination, voltage, and power output. Includes historical trends for voltage, current, and temperature, plus alerts for generation issues.
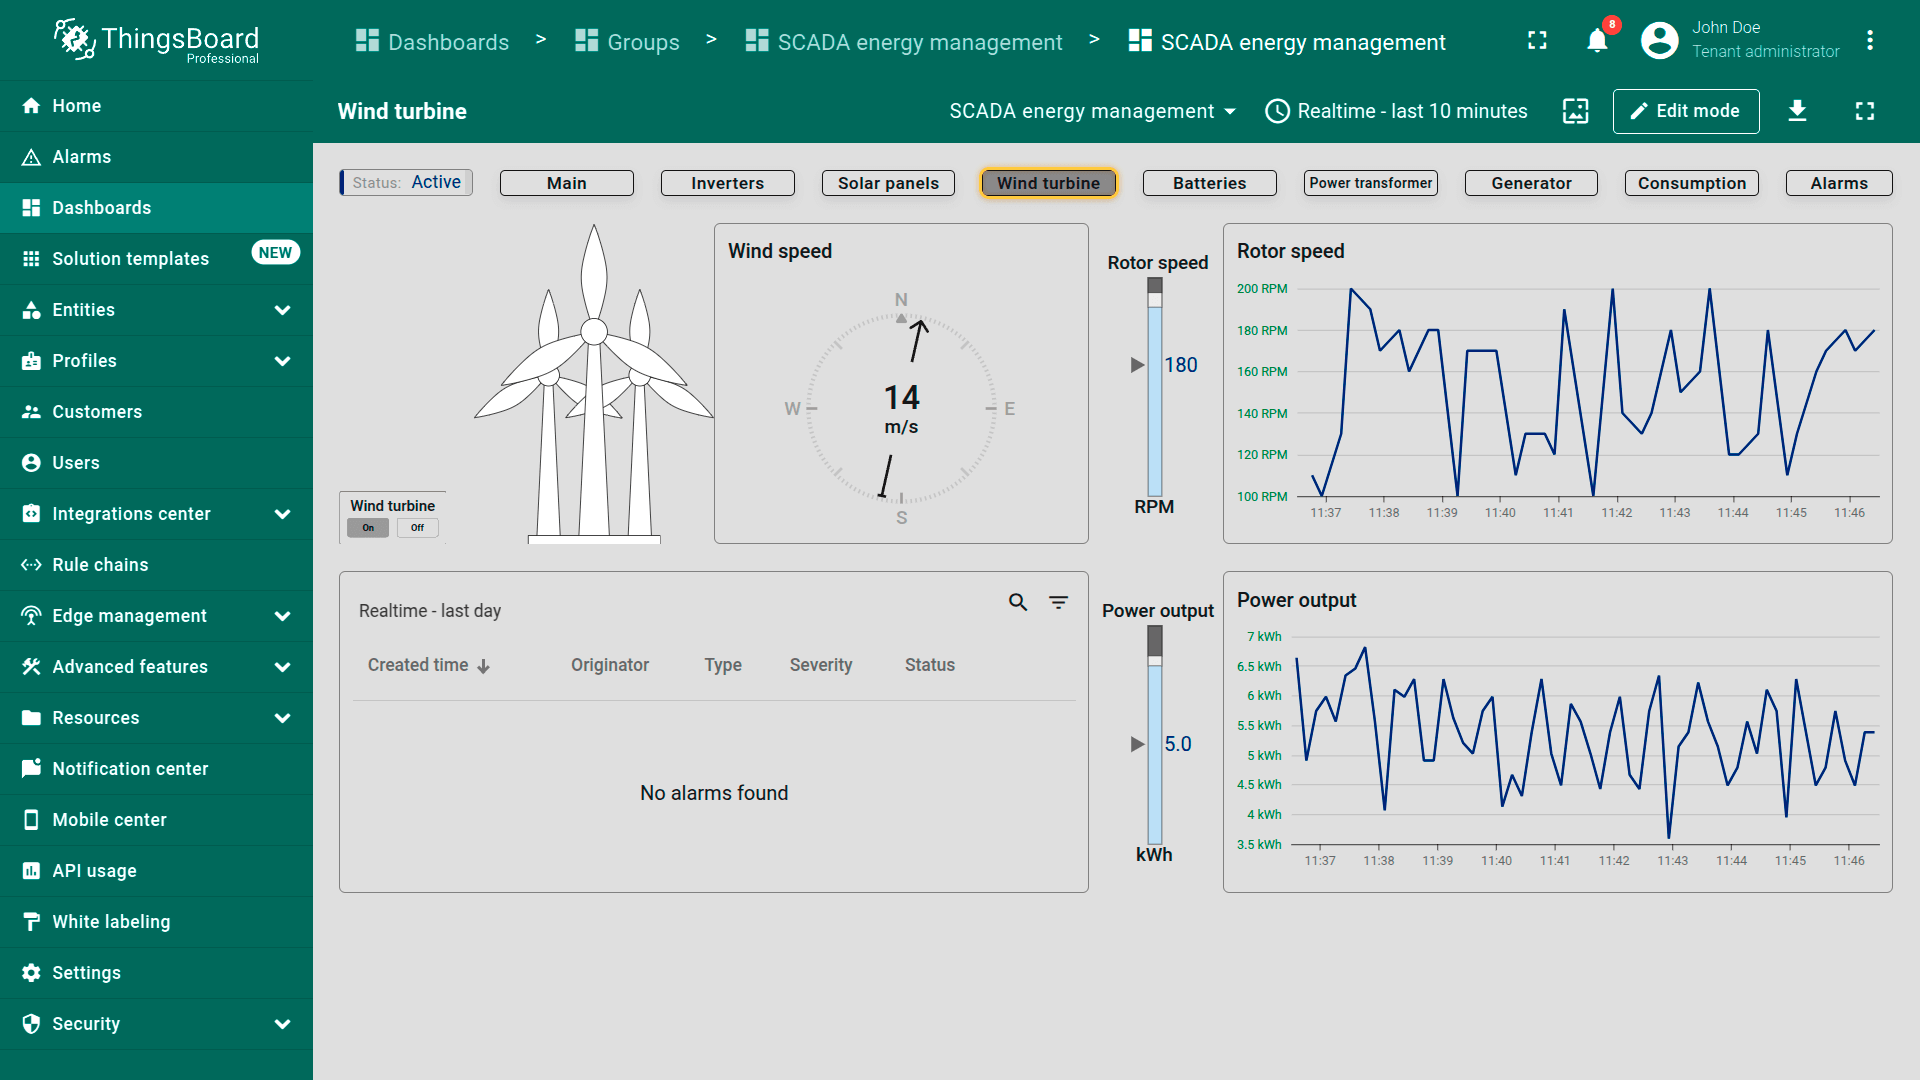
Wind turbine. Tracks wind turbine data: wind speed, rotor speed, and power output. Graphs show rotor speed and energy trends over time. Alerts notify users of issues like excessive vibrations or speed spikes.
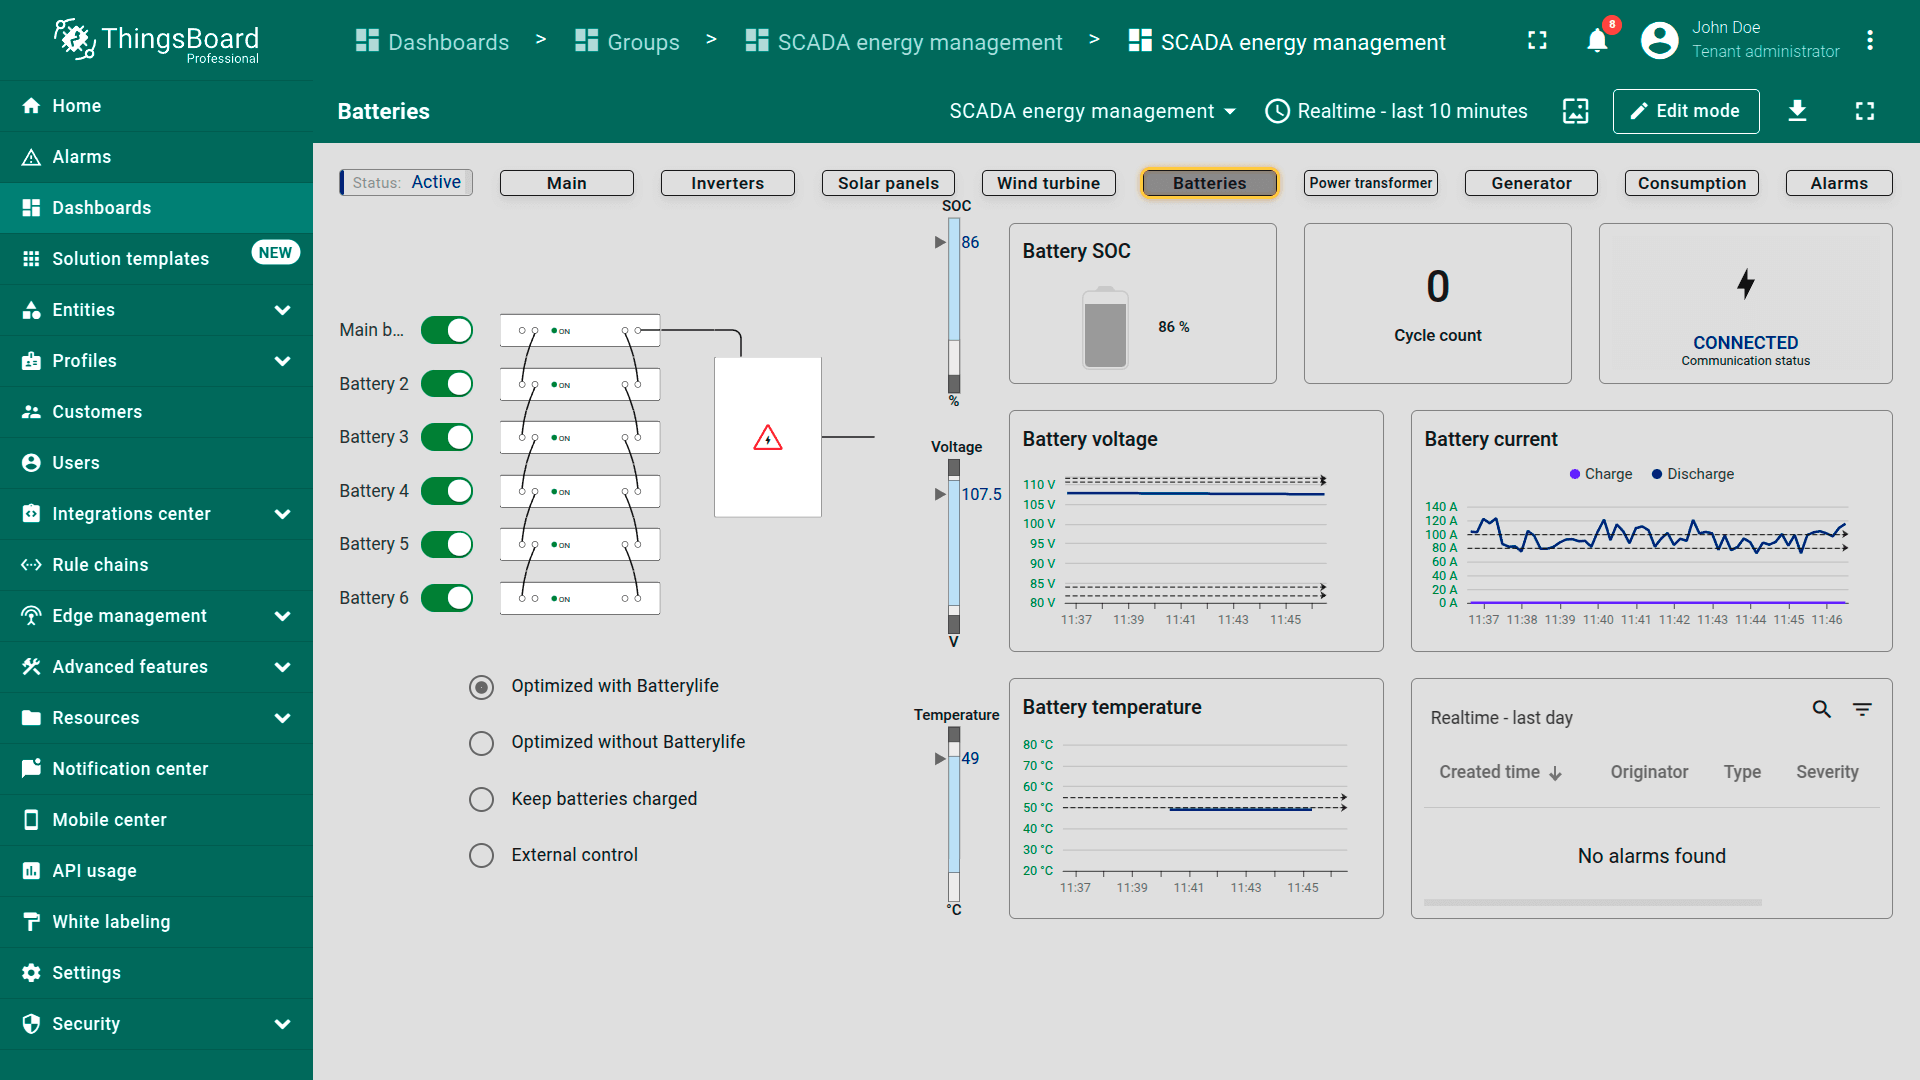
Batteries. Shows battery storage status including charge level (SOC), cycle count, and voltage. Graphs track charging/discharging currents, temperature, and voltage trends. The alarm section highlights battery health or operation problems.
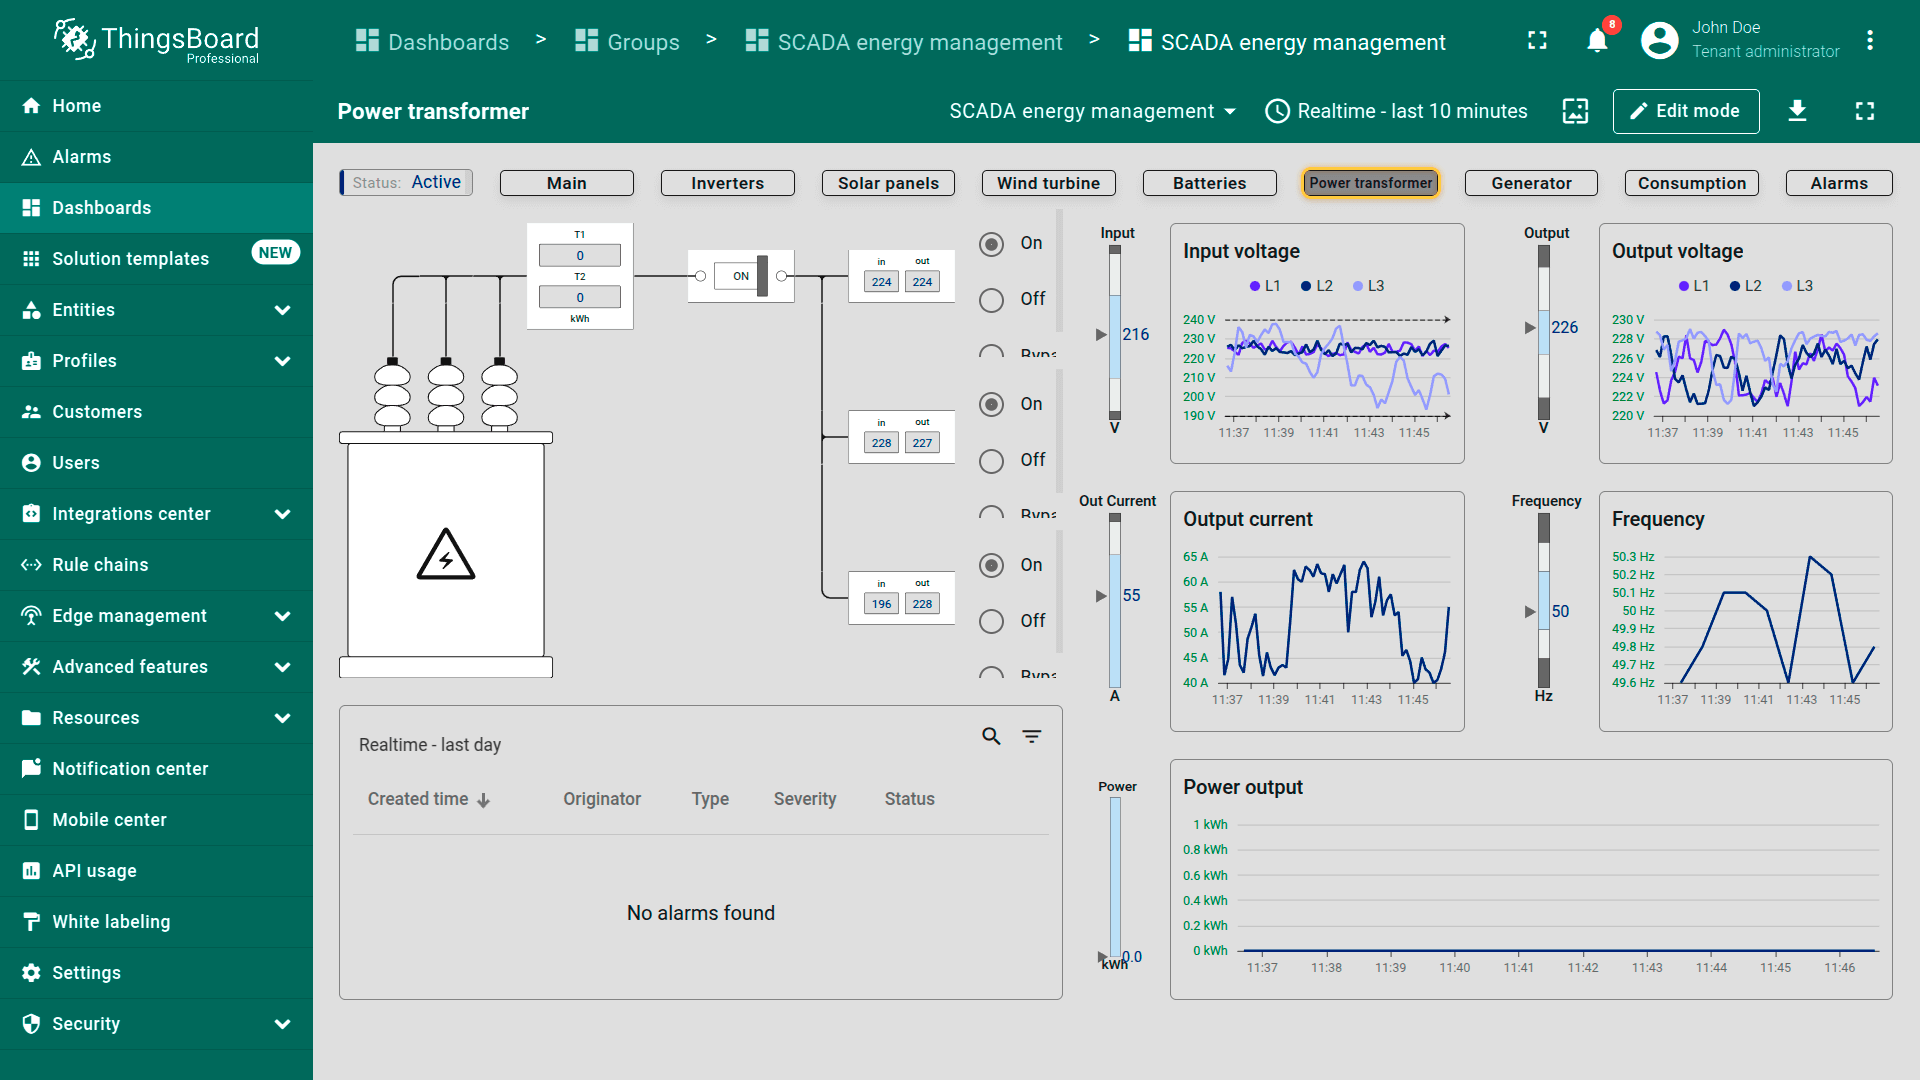
Power transformer. Displays transformer performance: input/output voltage, current, and frequency. Real-time energy flow monitoring is supported by historical graphs and alerts for transformer faults or instabilities.
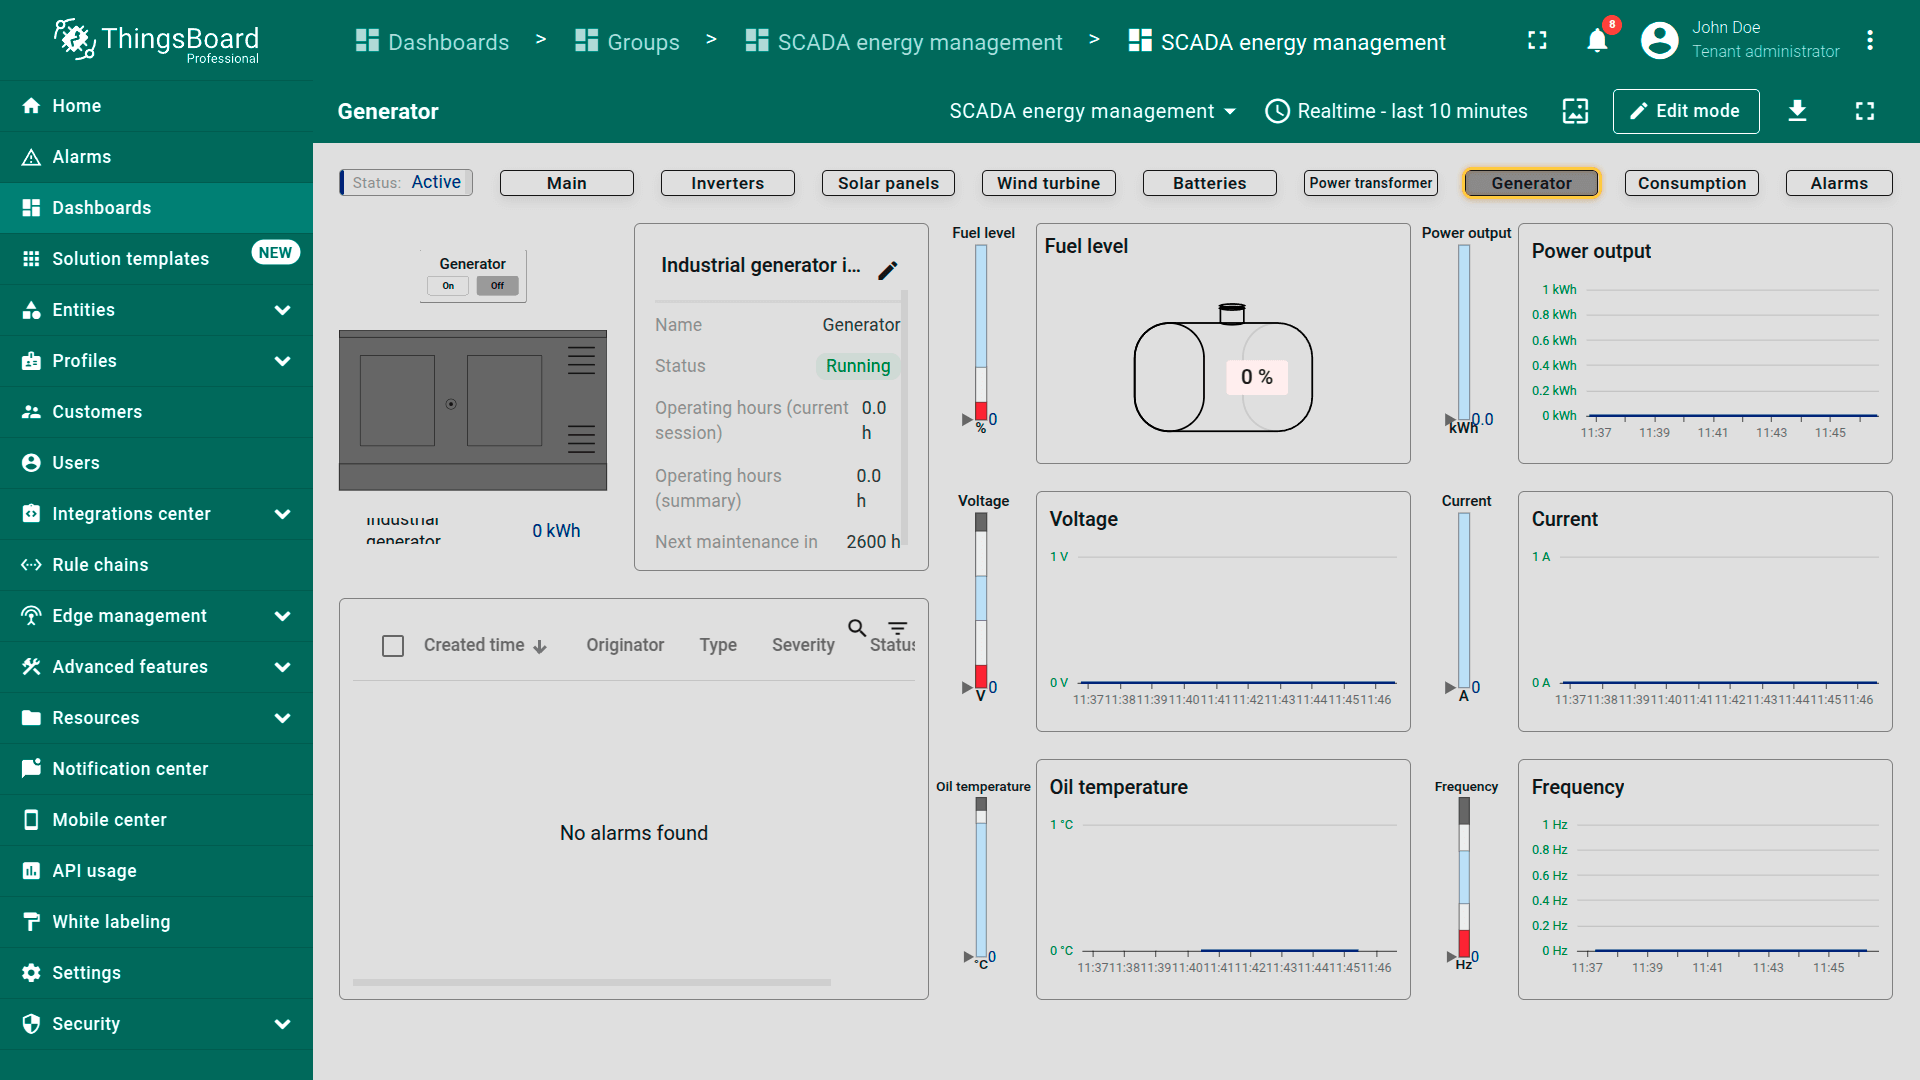
Generator. Provides insights into generator operation: fuel levels, voltage, current, and oil temperature. Shows operating hours, maintenance status, and alerts for critical conditions to ensure reliable backup power.
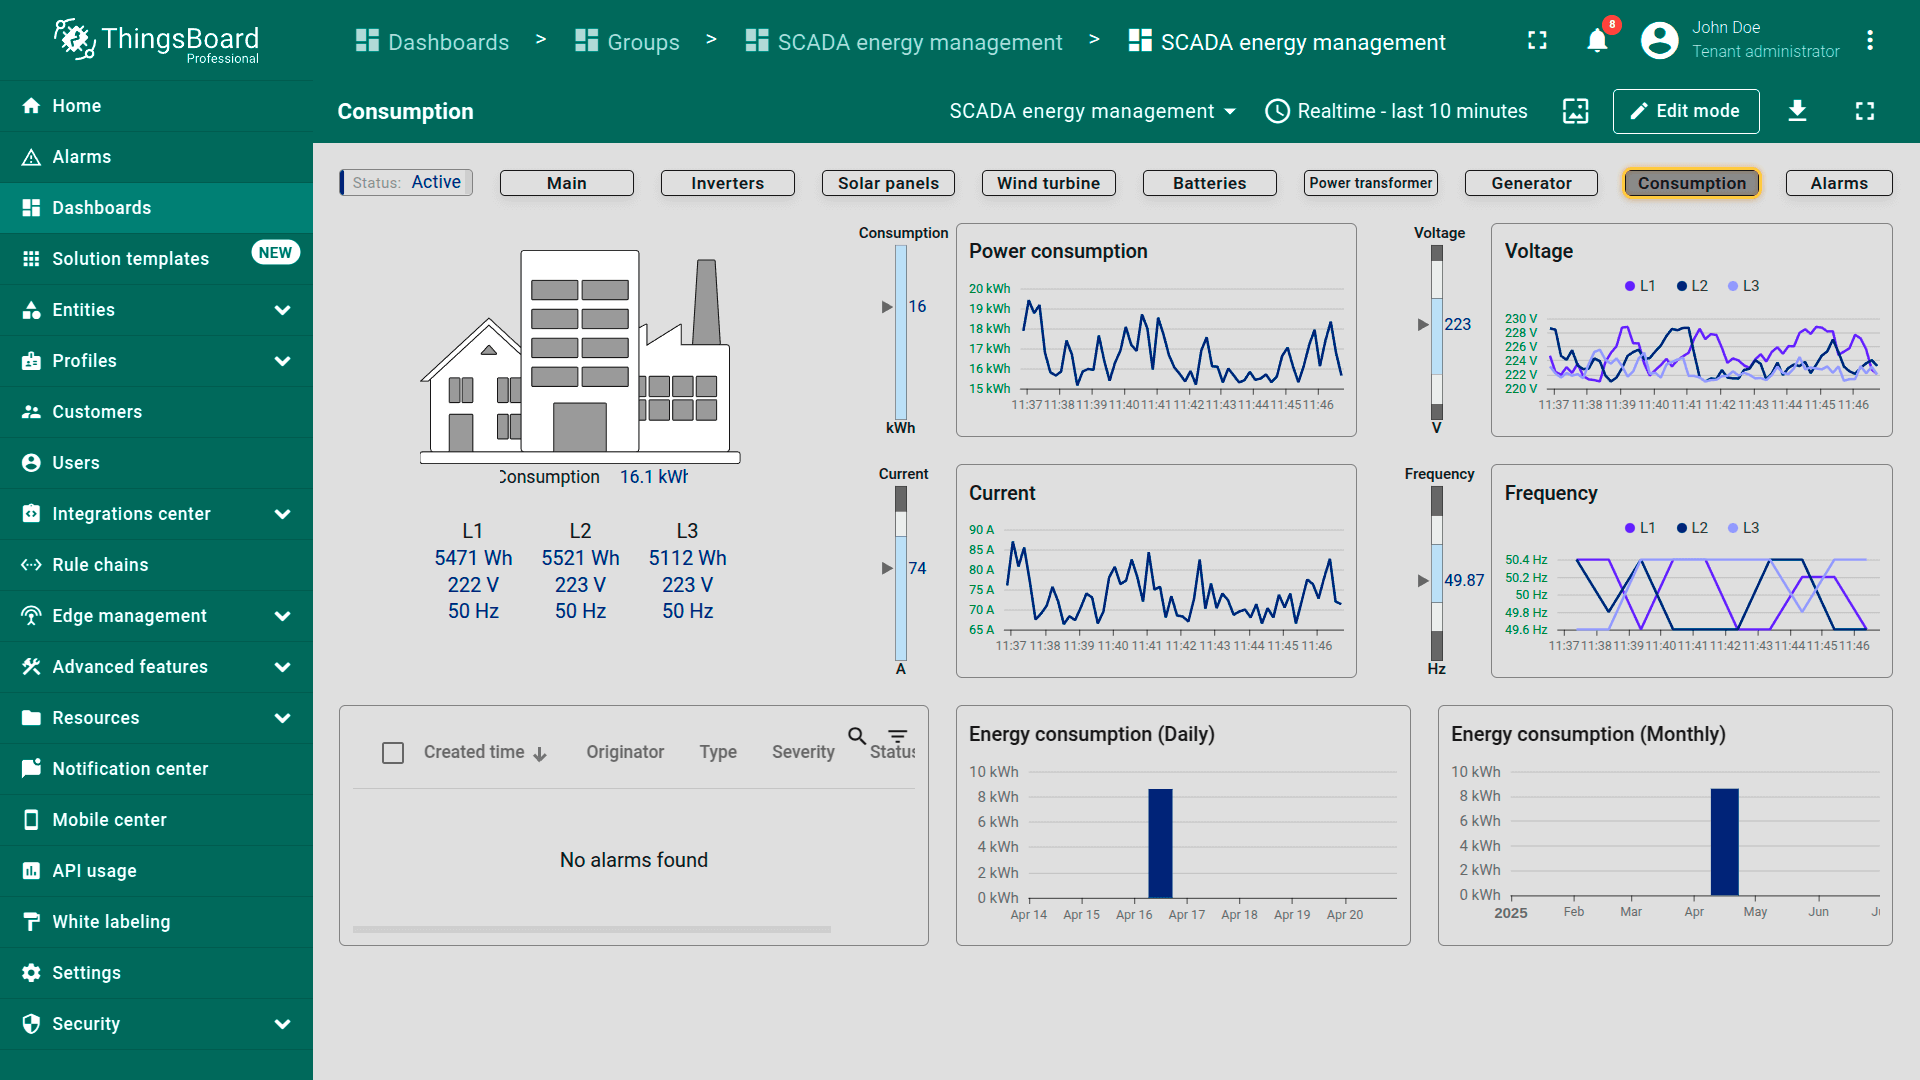
Consumption. Visualizes energy usage over daily and monthly periods. Graphs show consumption, voltage, current, and frequency to help optimize efficiency. Alarms flag unusual consumption patterns or system issues.
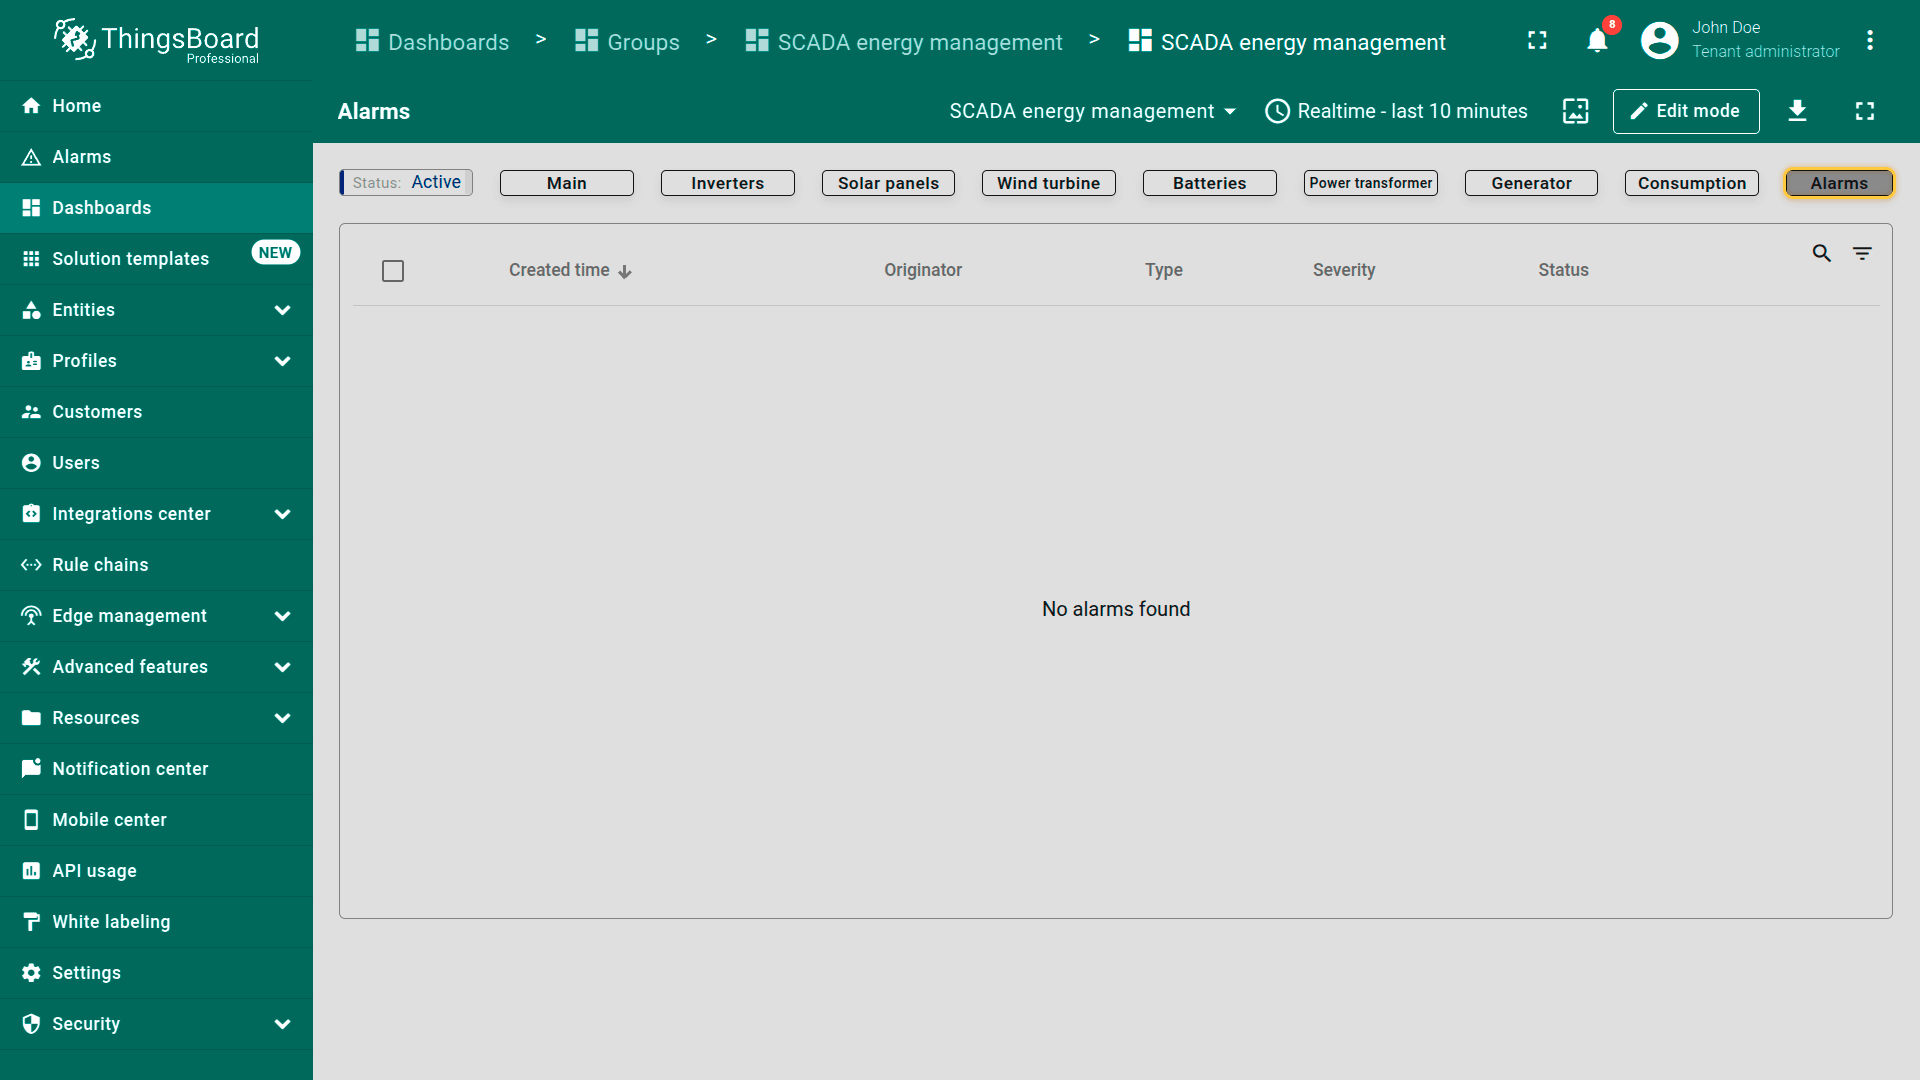
Alarms. Lists all active and historical system alarms with timestamps, severity, and status. Users can acknowledge or resolve alerts related to faults, vibrations, and performance deviations.
移动端视图
移动端视图展示仪表板的灵活性,支持在平板与智能手机等不同设备上管理并监测SCADA Energy management。