- 部件类型
- 向仪表板添加部件
- 部件设置
- 部件的导入与导出(Import and Export widget)
- 下一步
在阅读本指南前,建议先完成快速入门以熟悉ThingsBoard设备和仪表盘,有助于更好理解本文所述概念。
部件是仪表板中用于展示特定类型数据或提供功能的元素。
部件可用于:
- 可视化设备数据(遥测与属性)
- 远程控制设备(RPC)
- 处理告警(创建/查看/确认)
- 显示静态自定义HTML内容
部件类型
ThingsBoard提供五类主要部件:
- 时序部件。按选定时间窗口展示数据,窗口可为:
- 实时 — 滚动区间,如最近5分钟或24小时
- 历史 — 固定过去区间
示例:折线图、柱状图或面积图部件
注意:时序部件面向遥测(时序)数据,而非属性。
-
控制部件。向设备发送RPC命令
示例:设置温控器目标温度 - 告警部件。展示和管理告警及通知
- 静态部件。展示静态内容,如平面图或公司信息(含自定义HTML)
更多部件类型说明见此处。
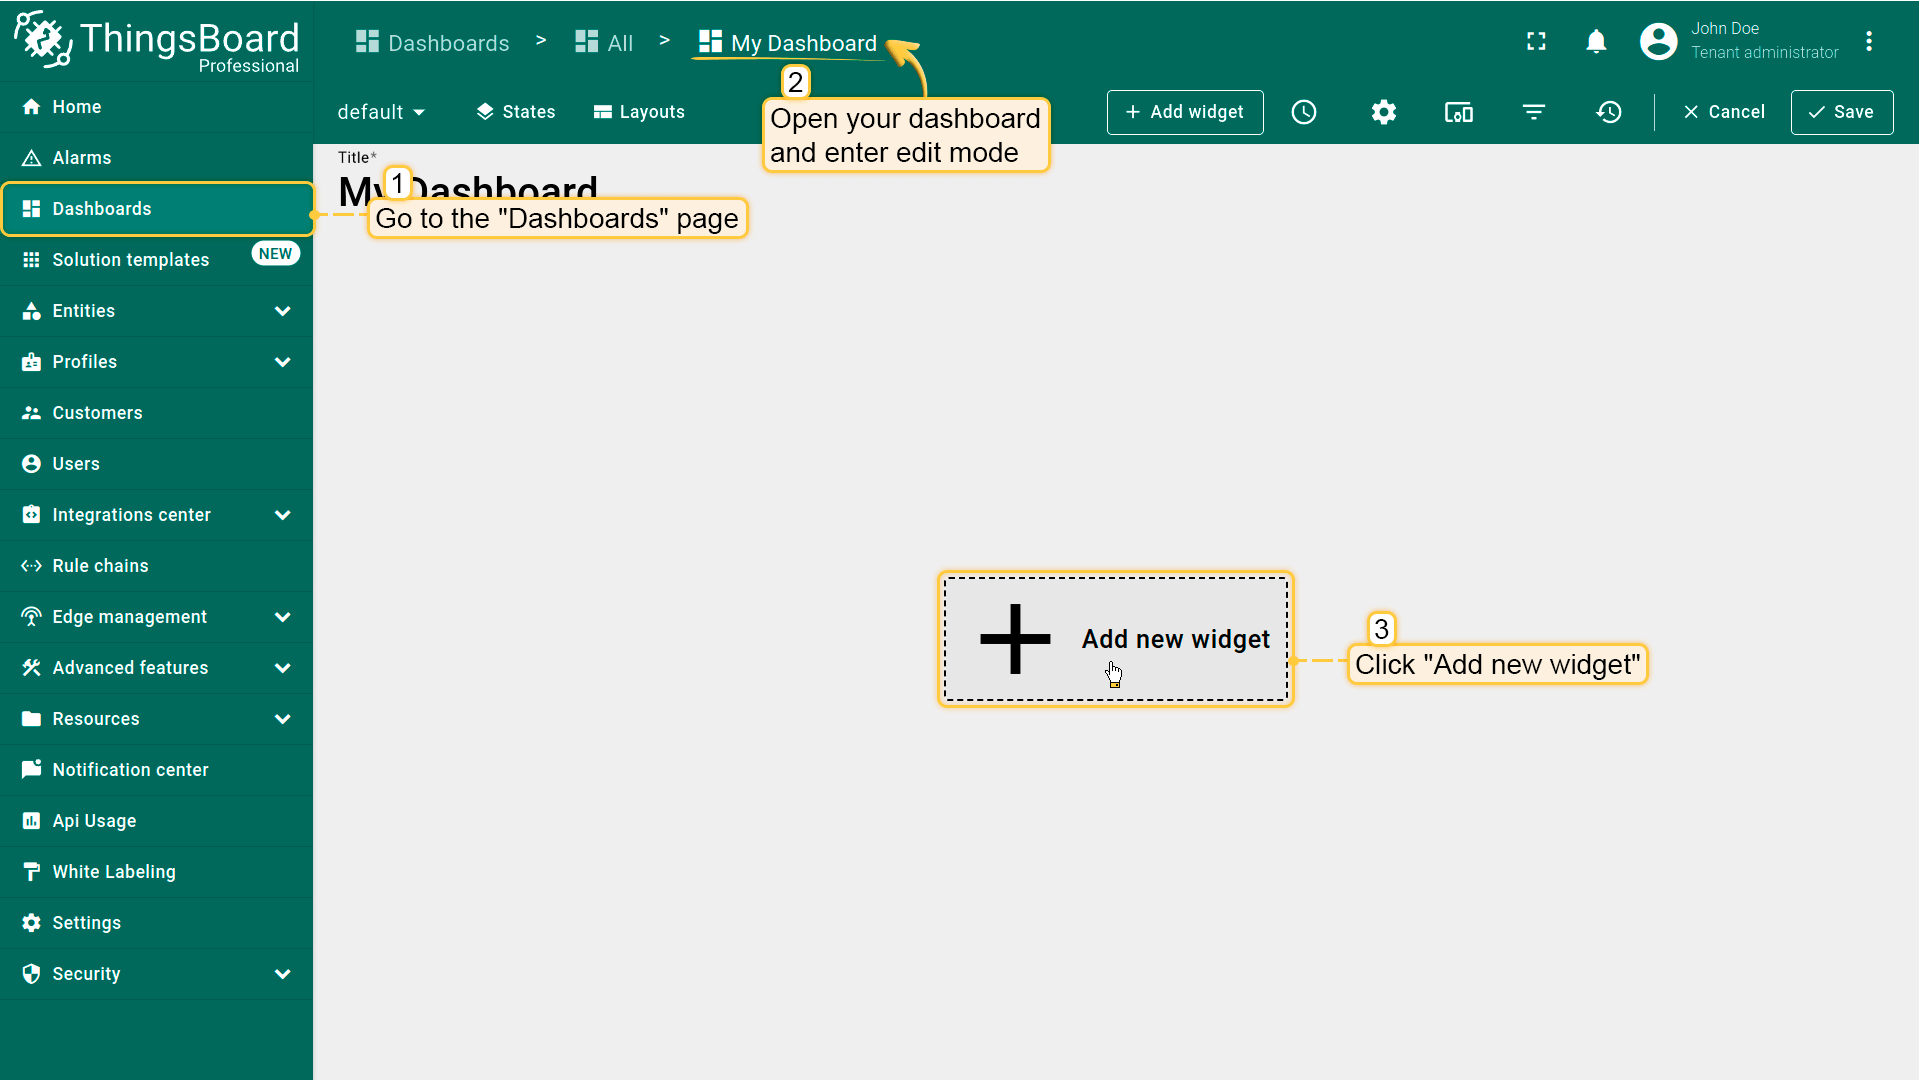
向仪表板添加部件
要向仪表板添加新部件,请按以下步骤操作:
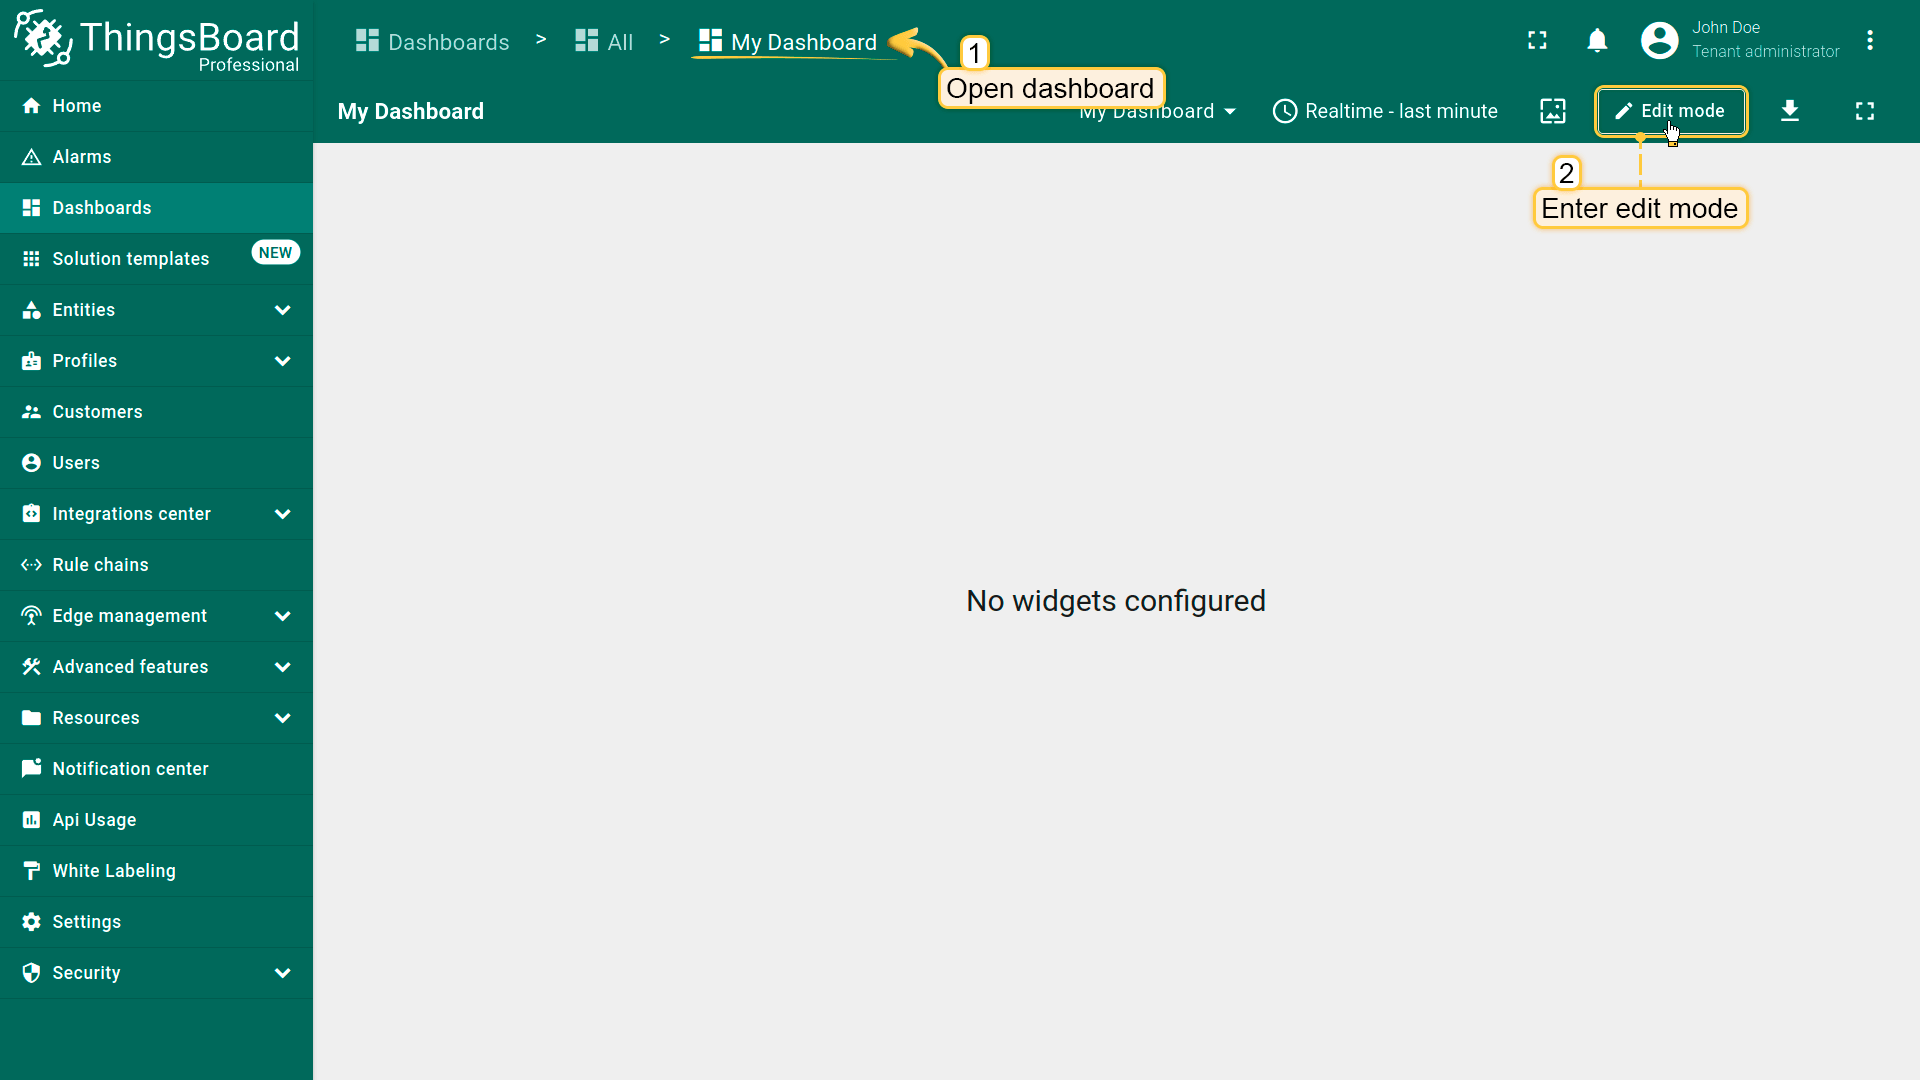
- Open your dashboard and switch to Edit mode;
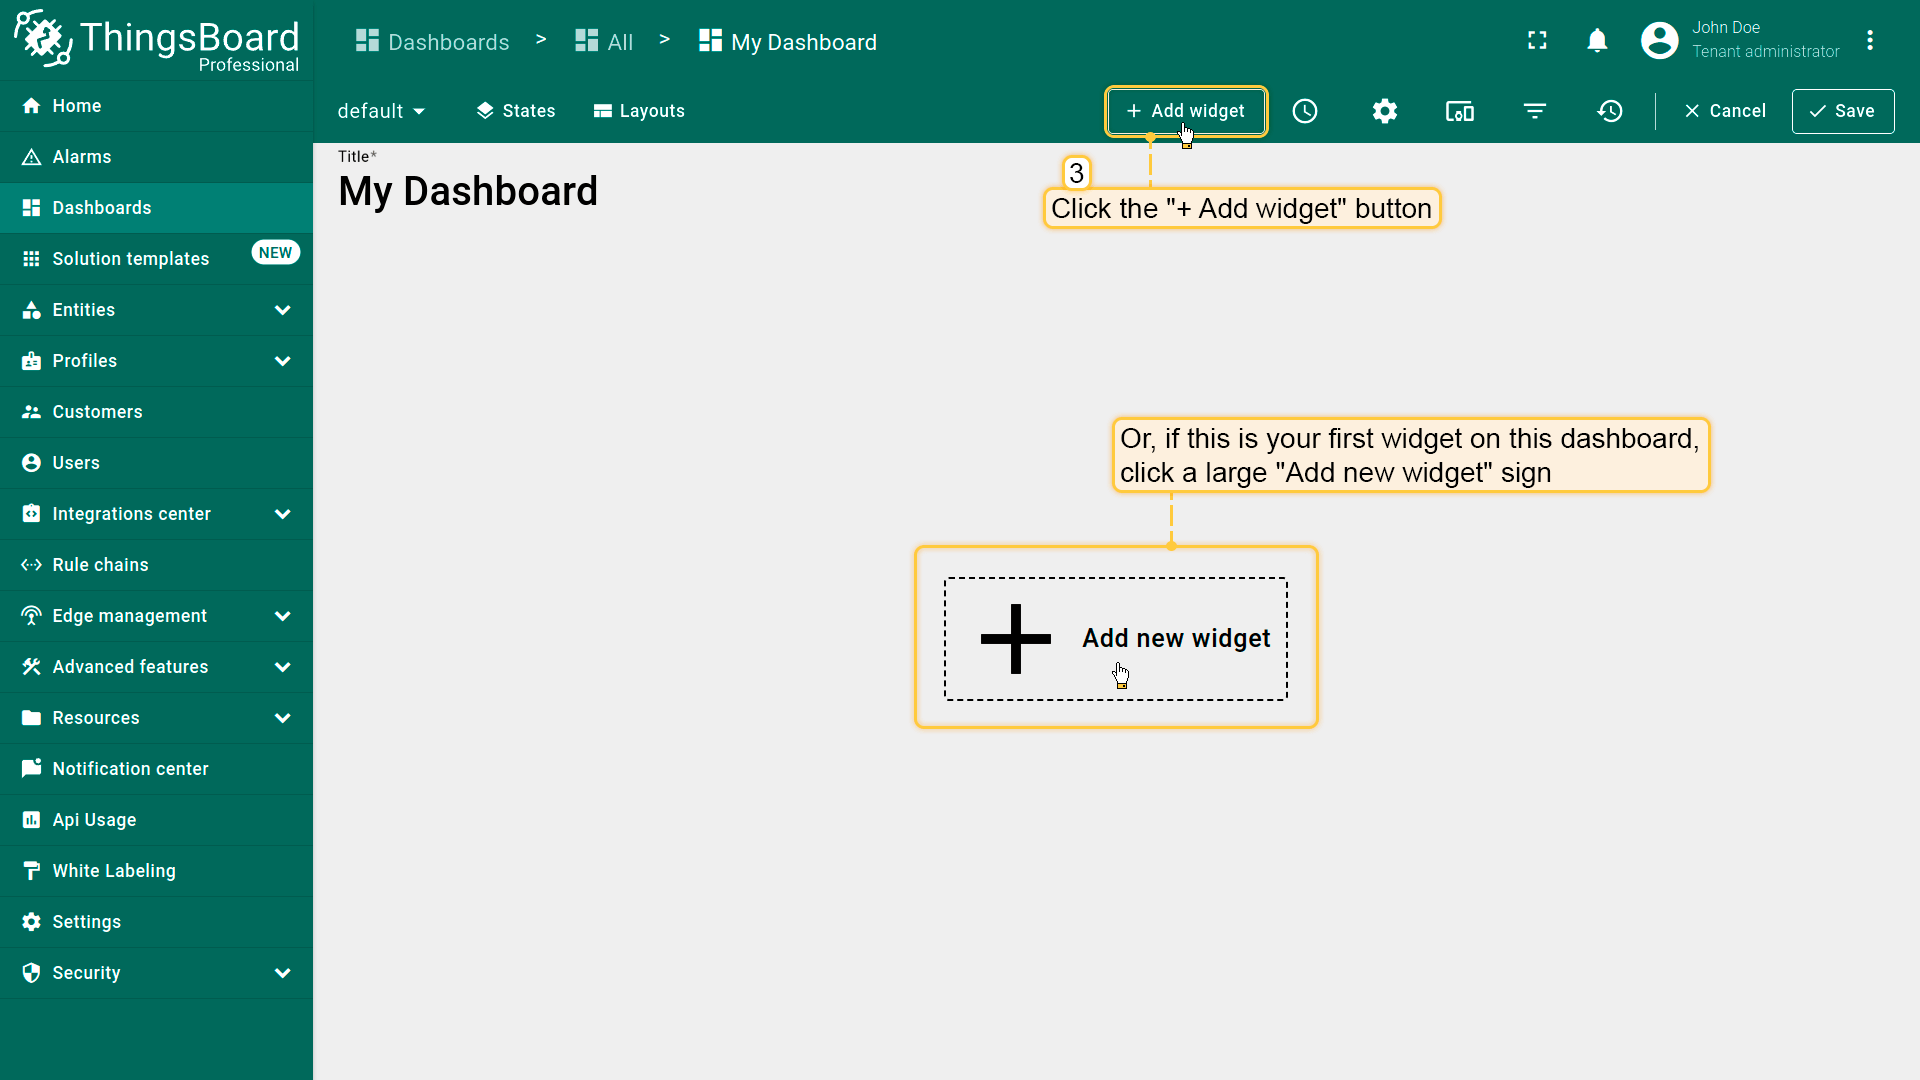
- Click the + Add widget at the top of the screen. If this is your first widget on the dashboard, you can also click Add new widget in the center of the screen to open the Widget bundle dialog;
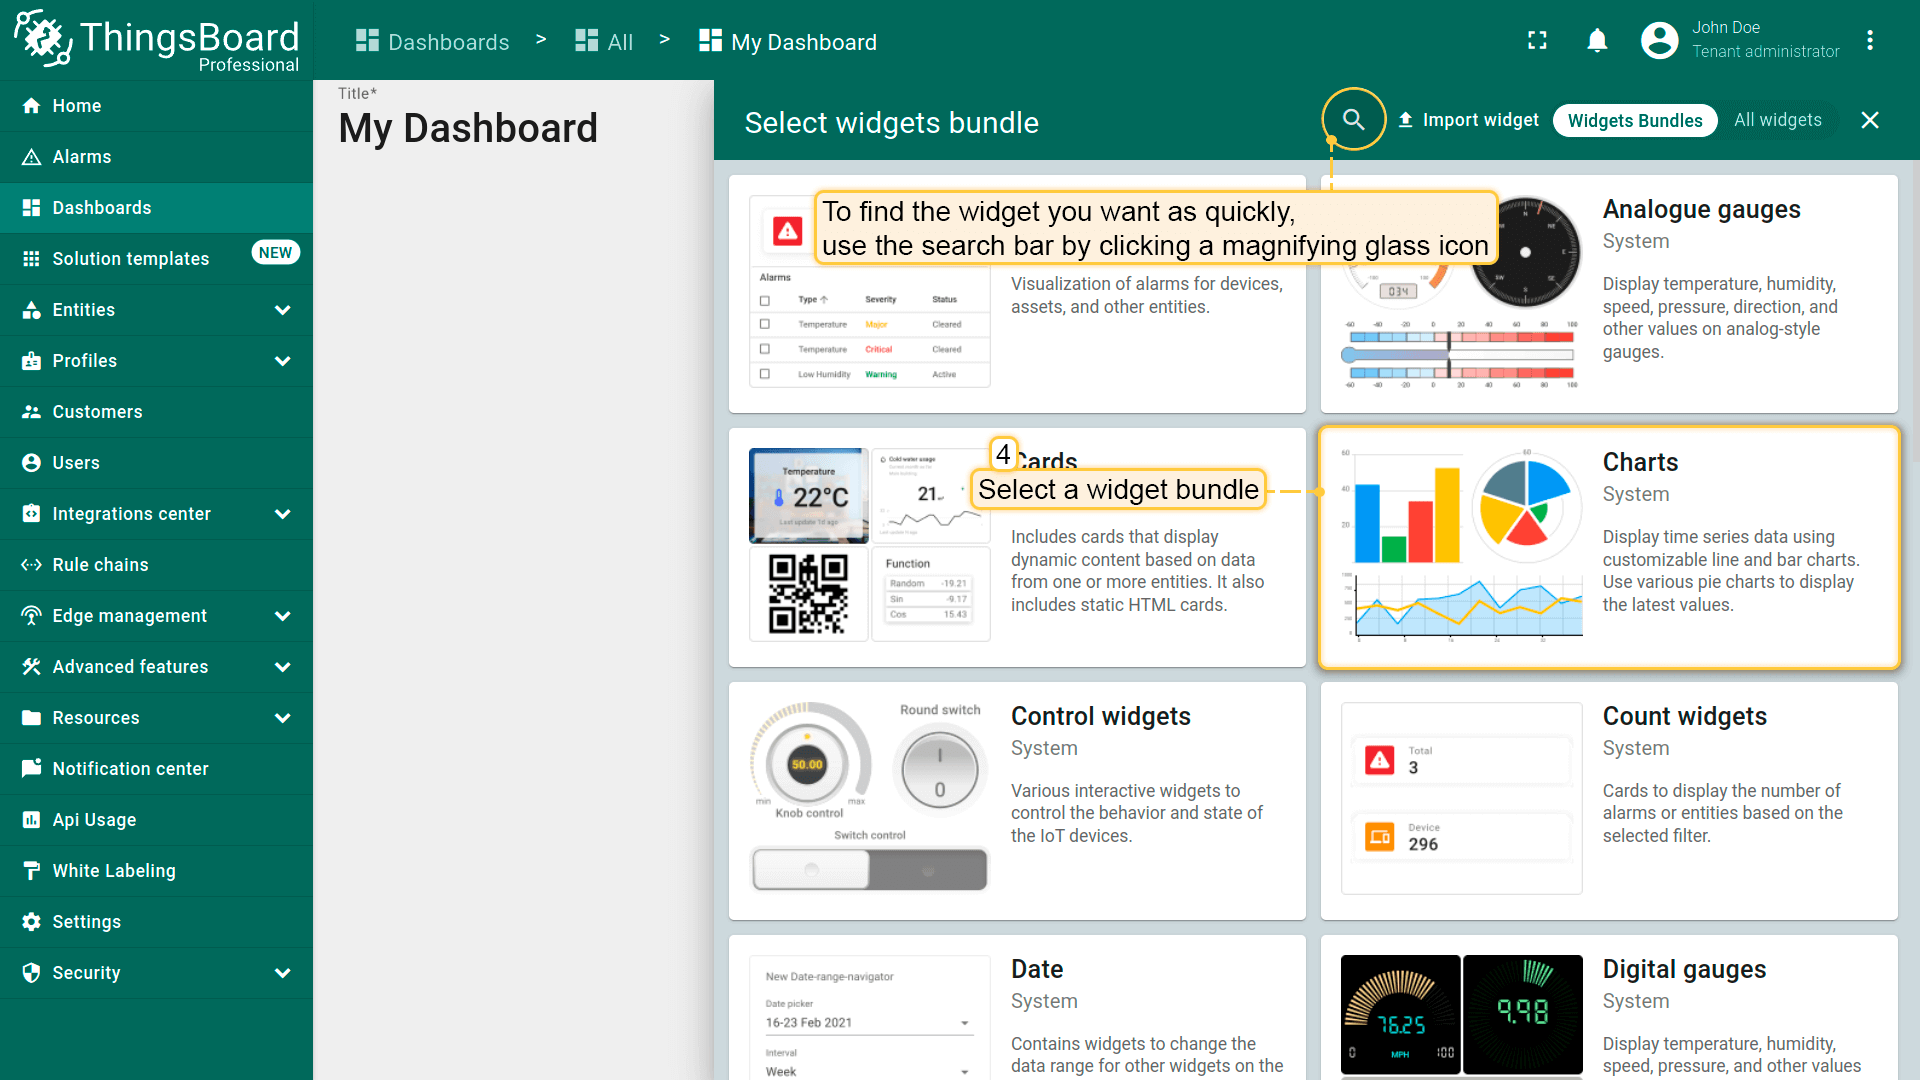
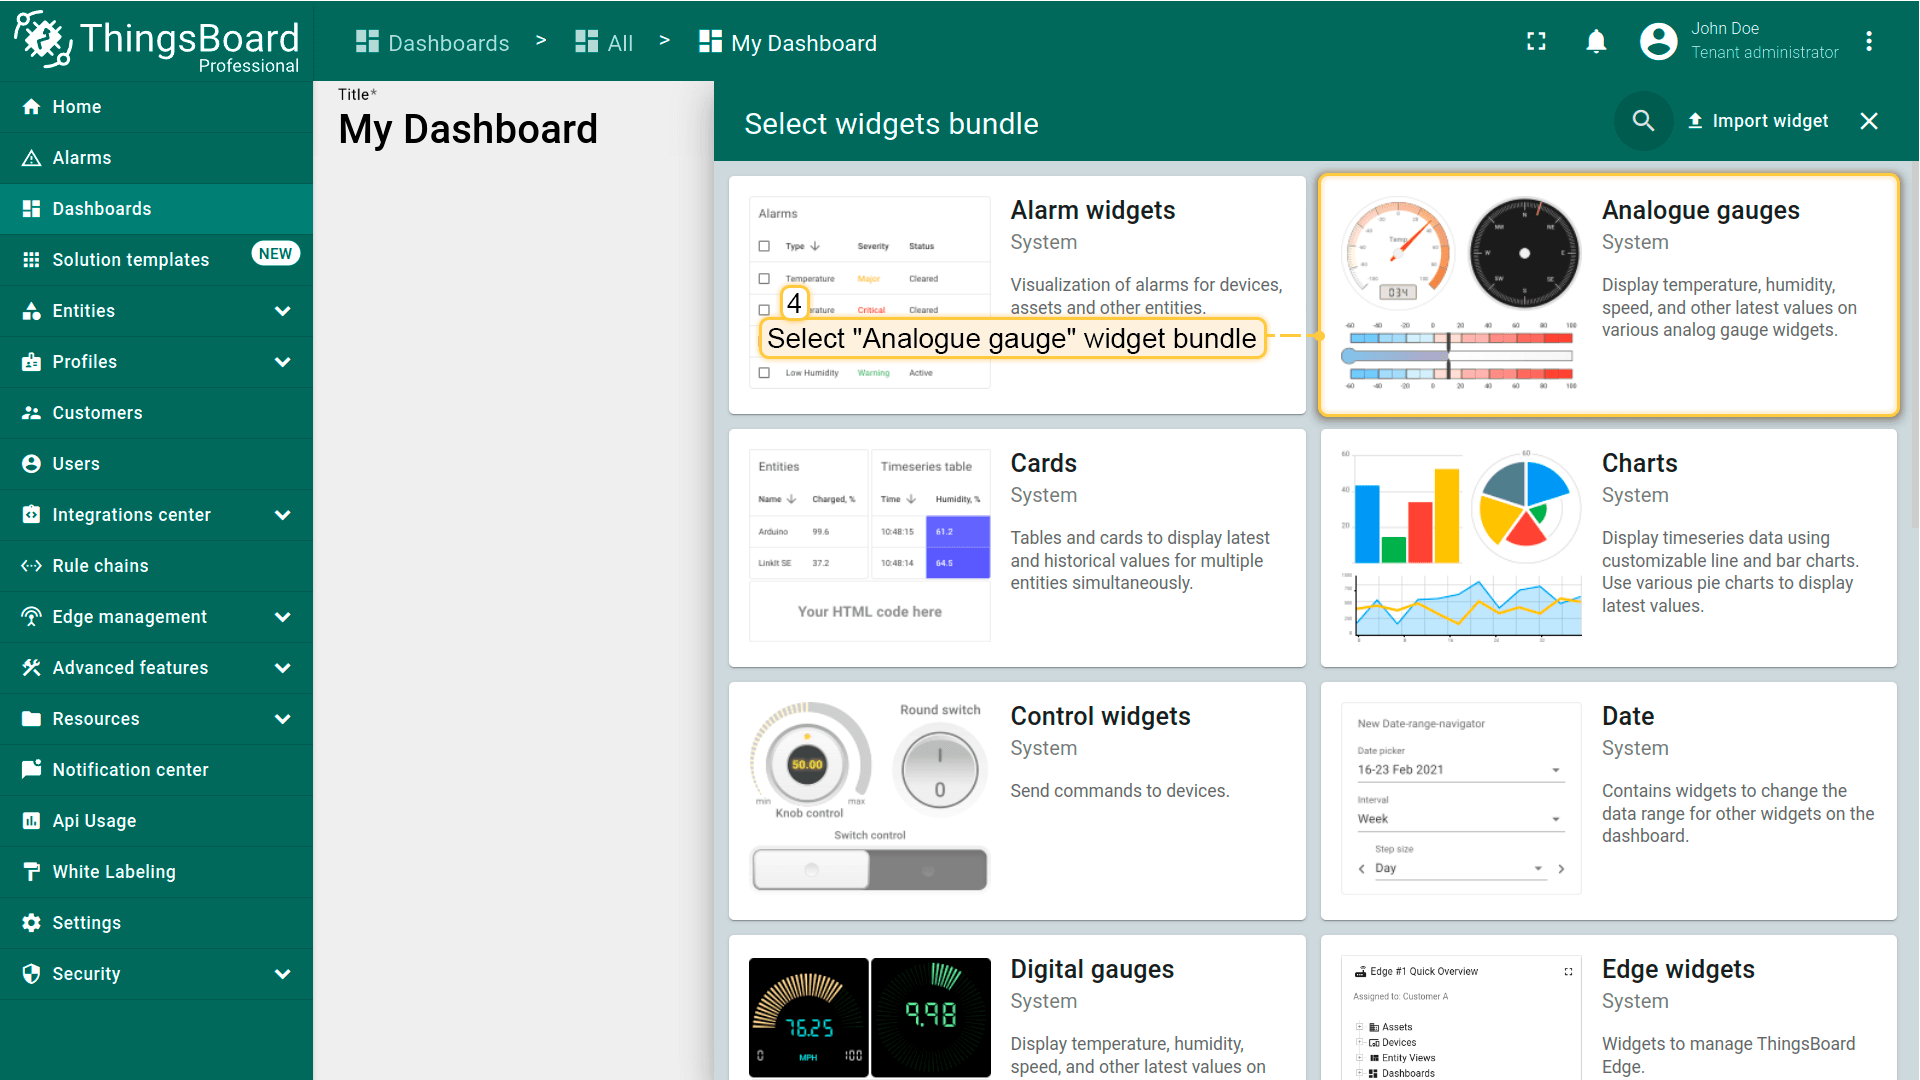
- Choose a widget bundle (for example, Charts). To quickly find your desired widget, use the search bar by clicking the magnifying glass icon and entering the widget's name;
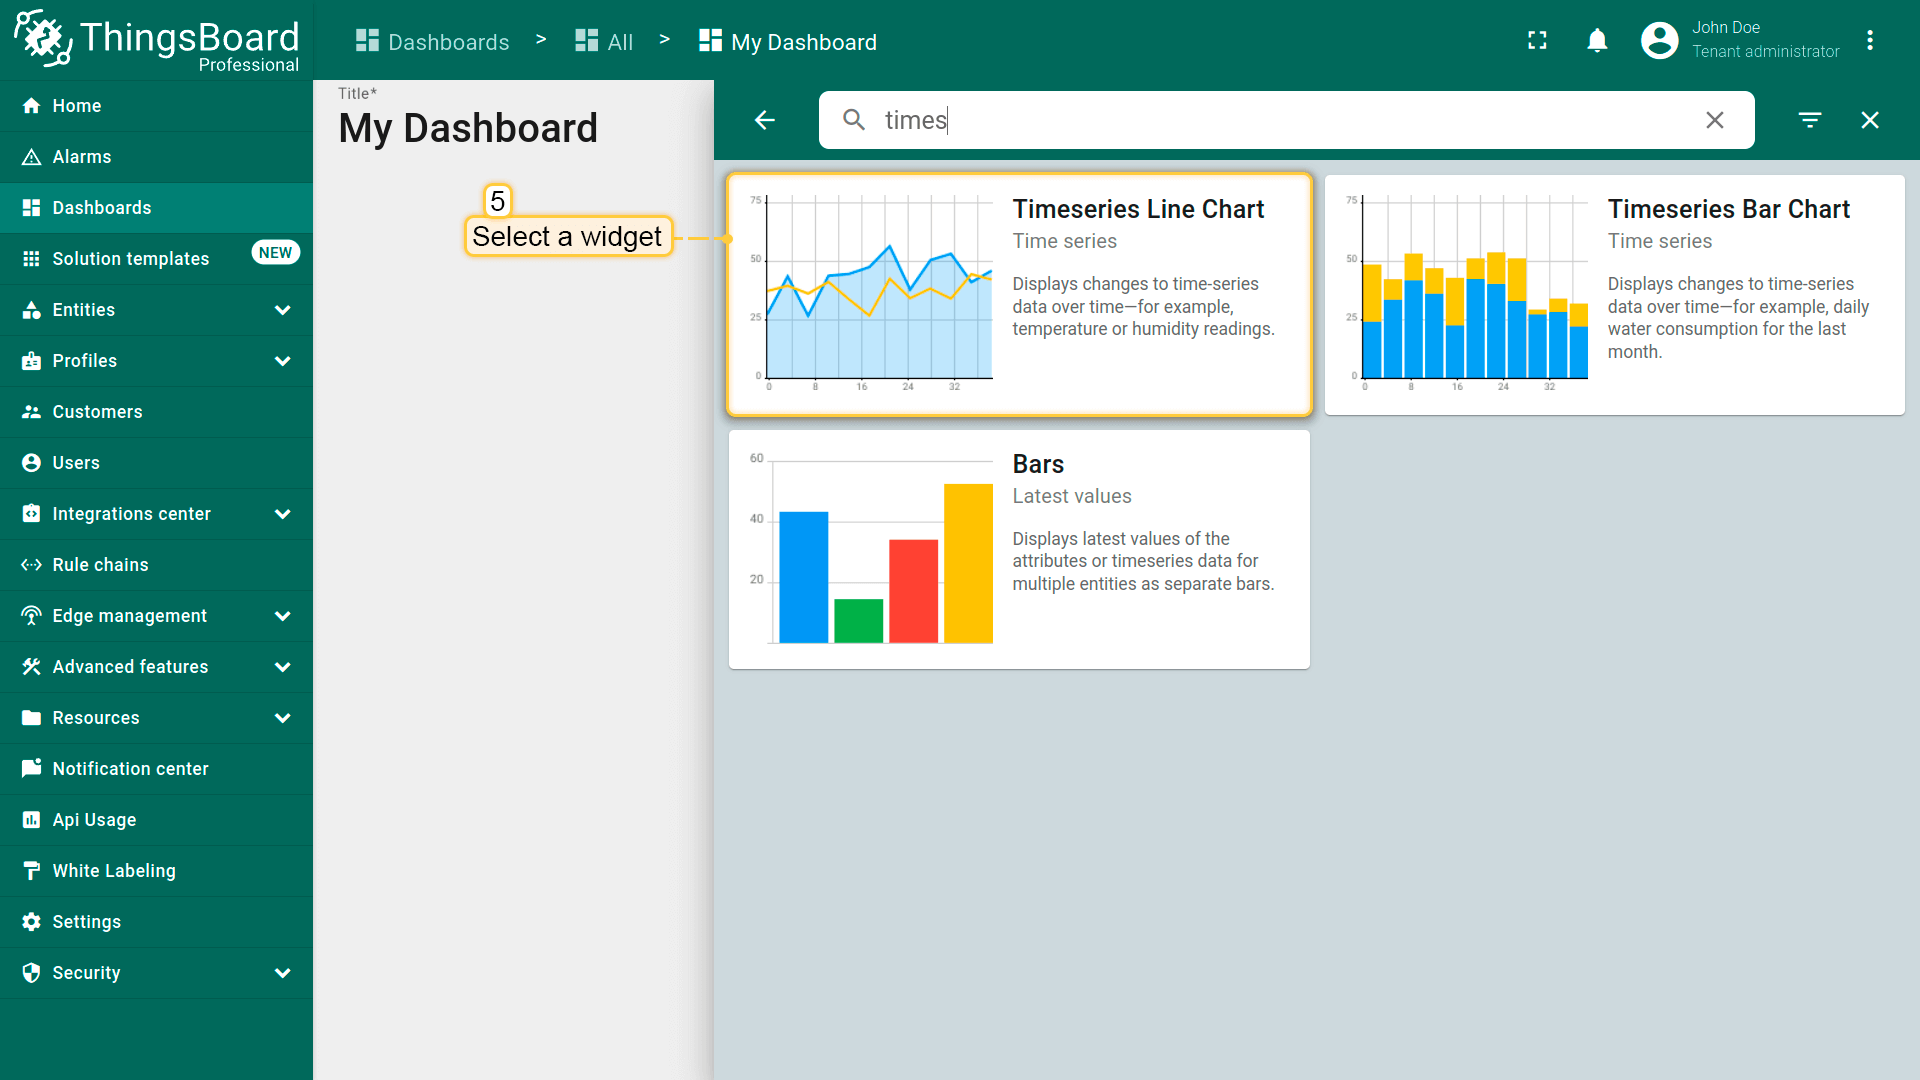
- Select a widget (for example, Time series chart) to open the Add widget dialog;
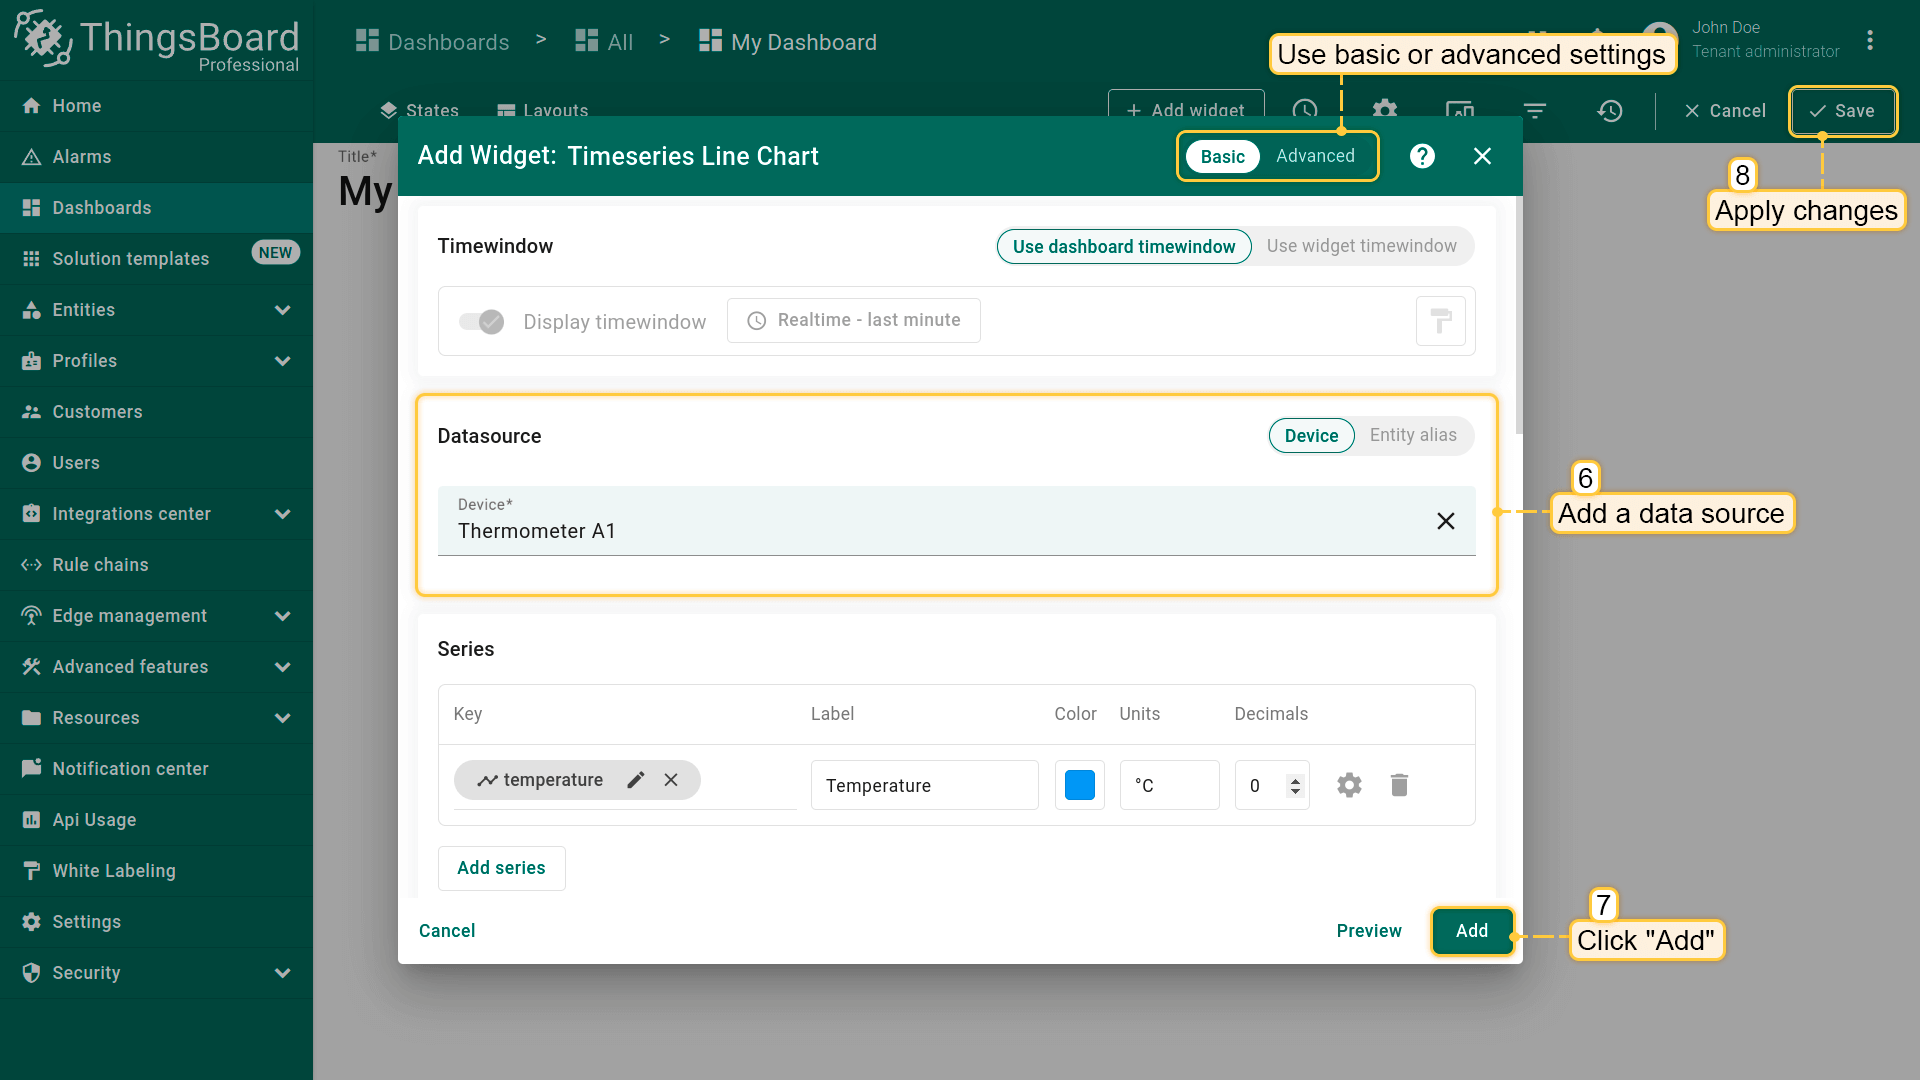
- Specify the data source, add at least one data key, and click Add. Then Apply changes.
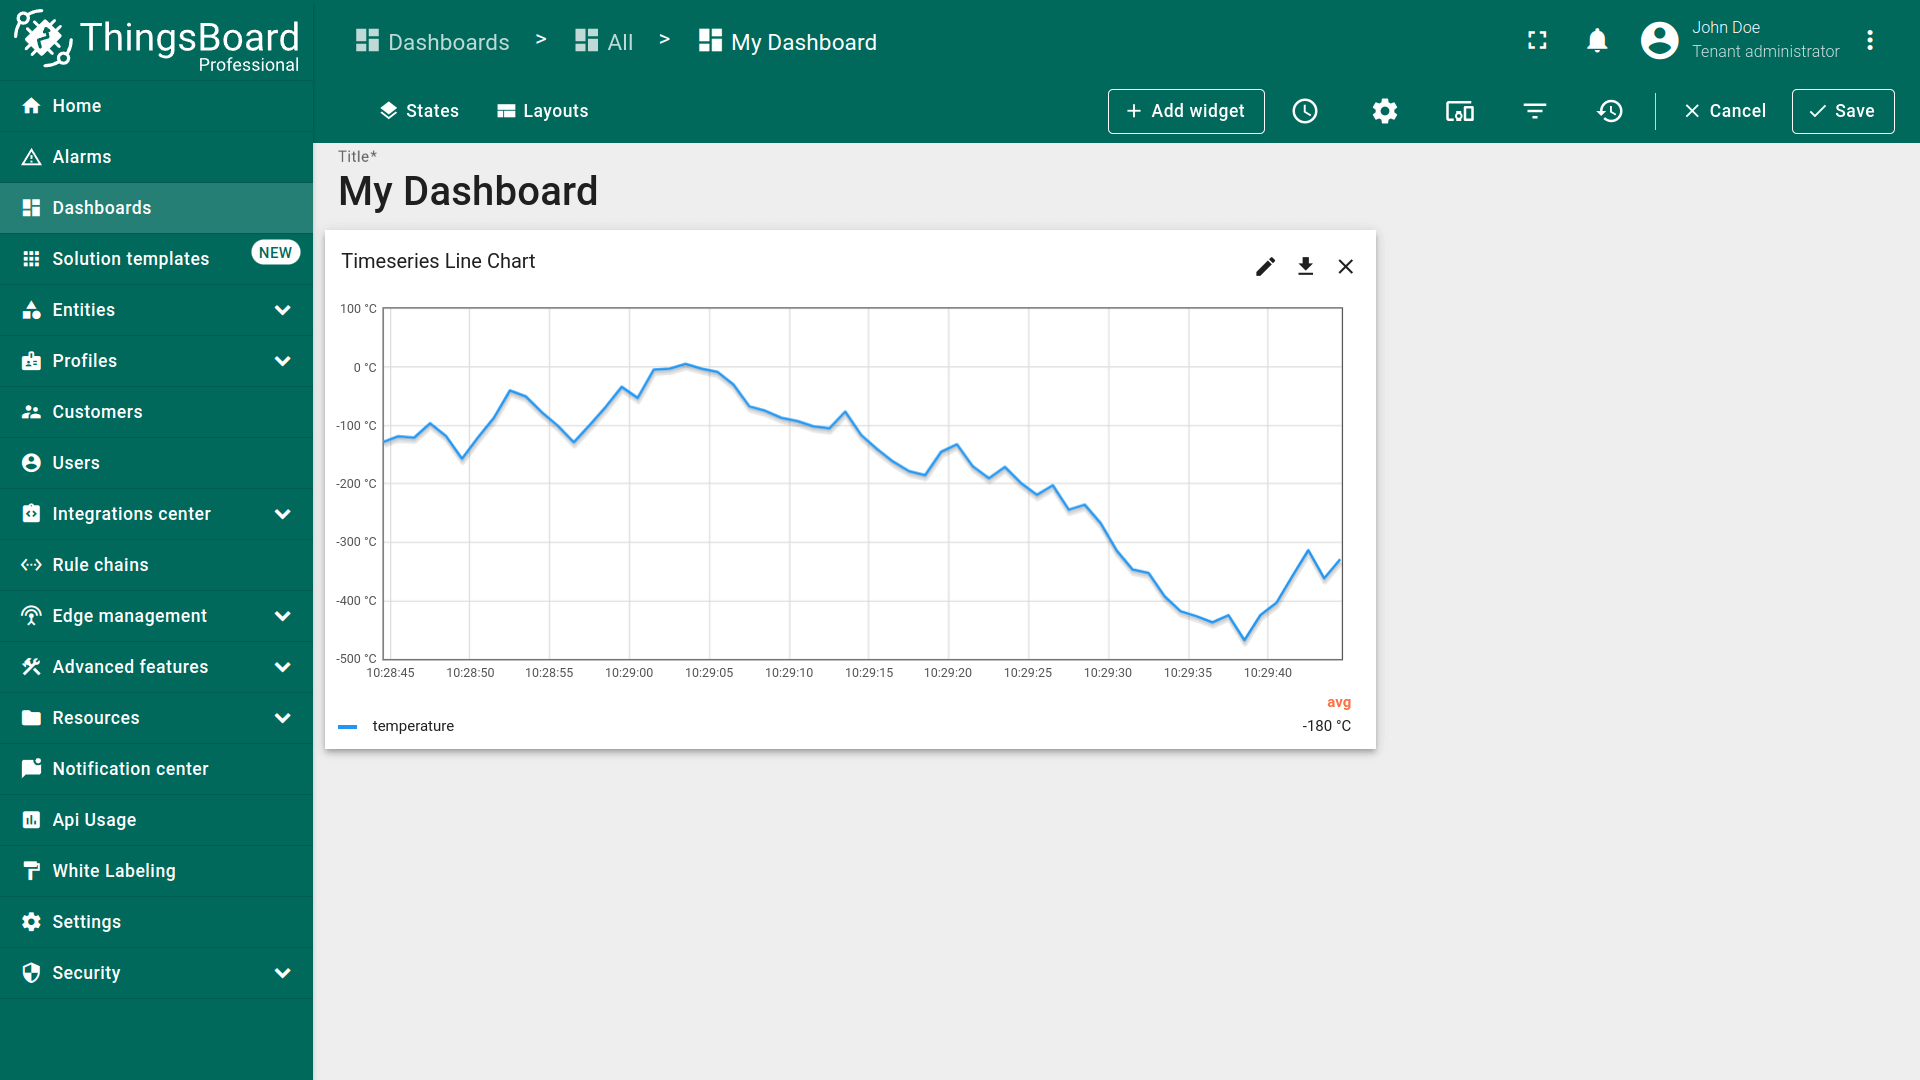
- The widget is now created.
部件设置
部件配置包括设置一个或多个数据源(部分部件可能无数据源),以及配置外观、部件卡片参数、操作和布局。
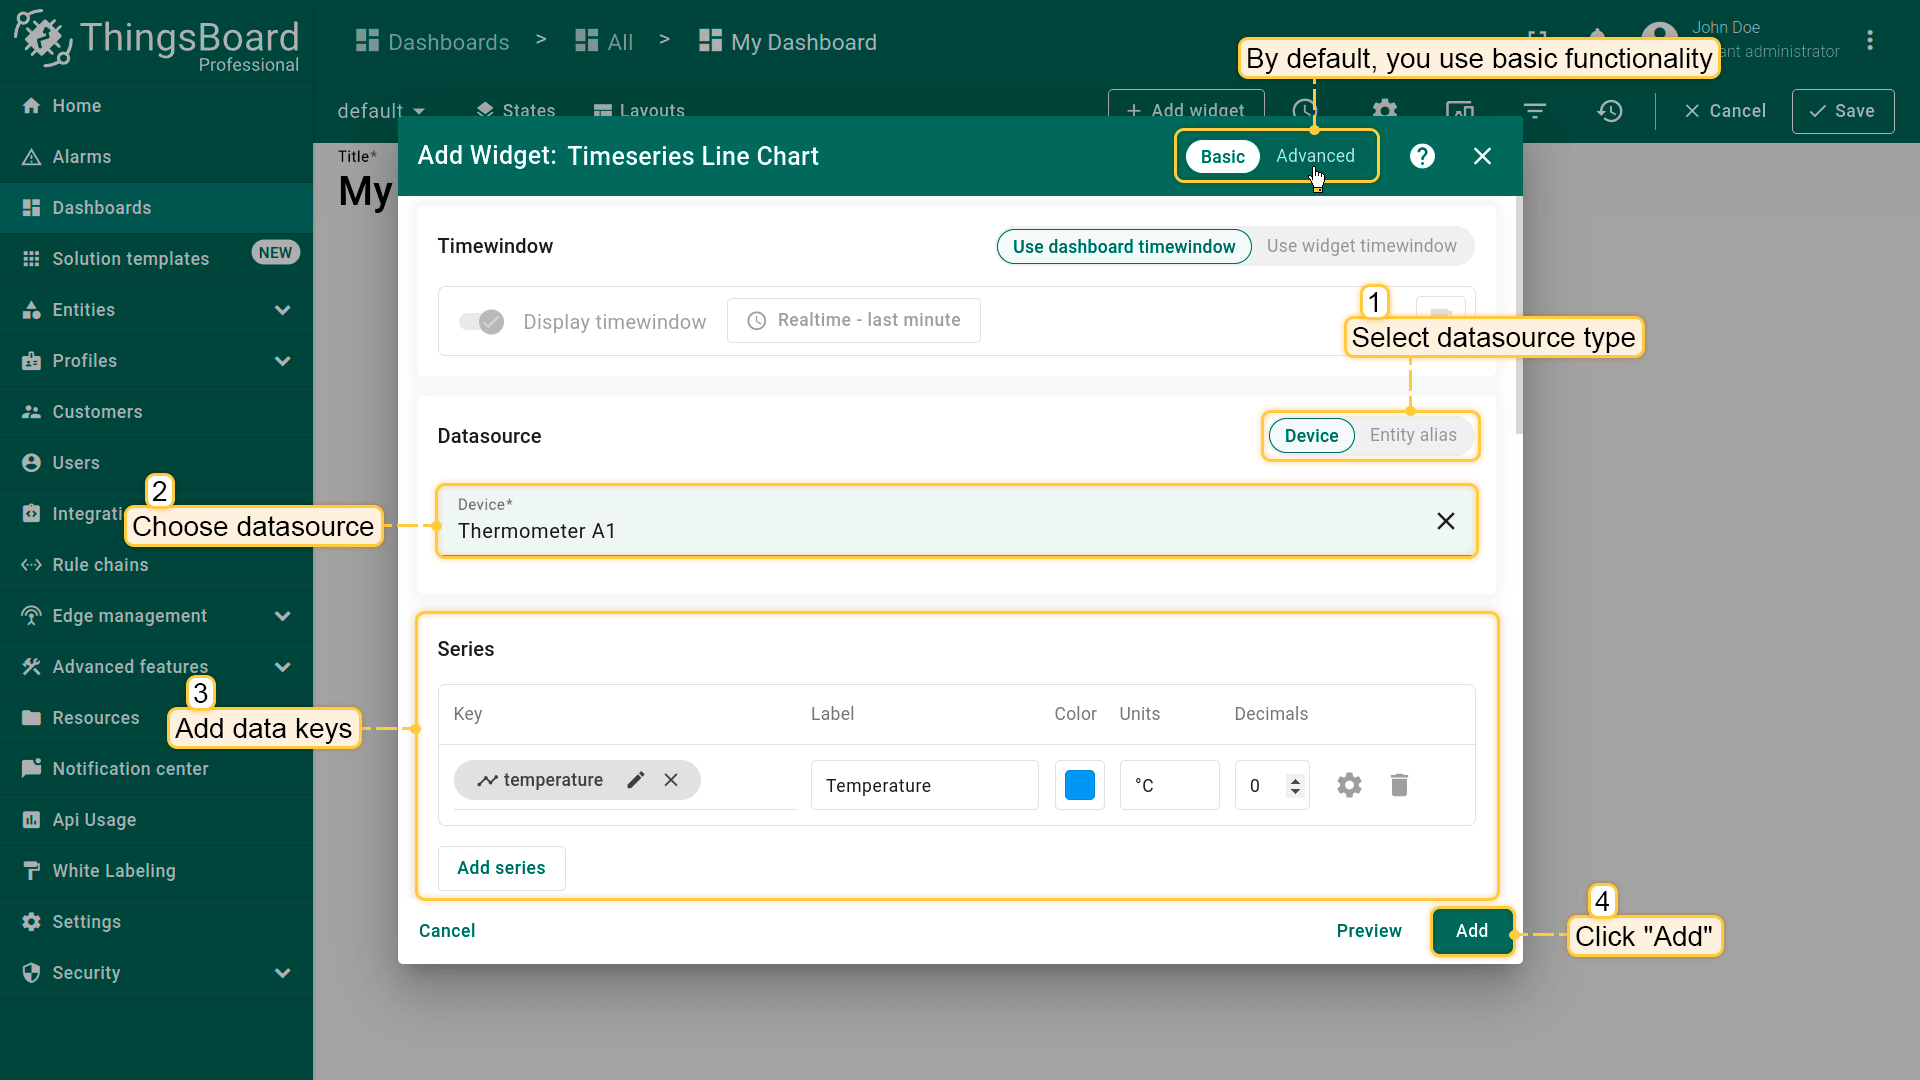
创建部件时,可通过部件对话框右上角的开关在基础和高级模式间切换。
基础模式
使用基础模式可快速配置单一数据源,无需额外过滤器。您将配置:
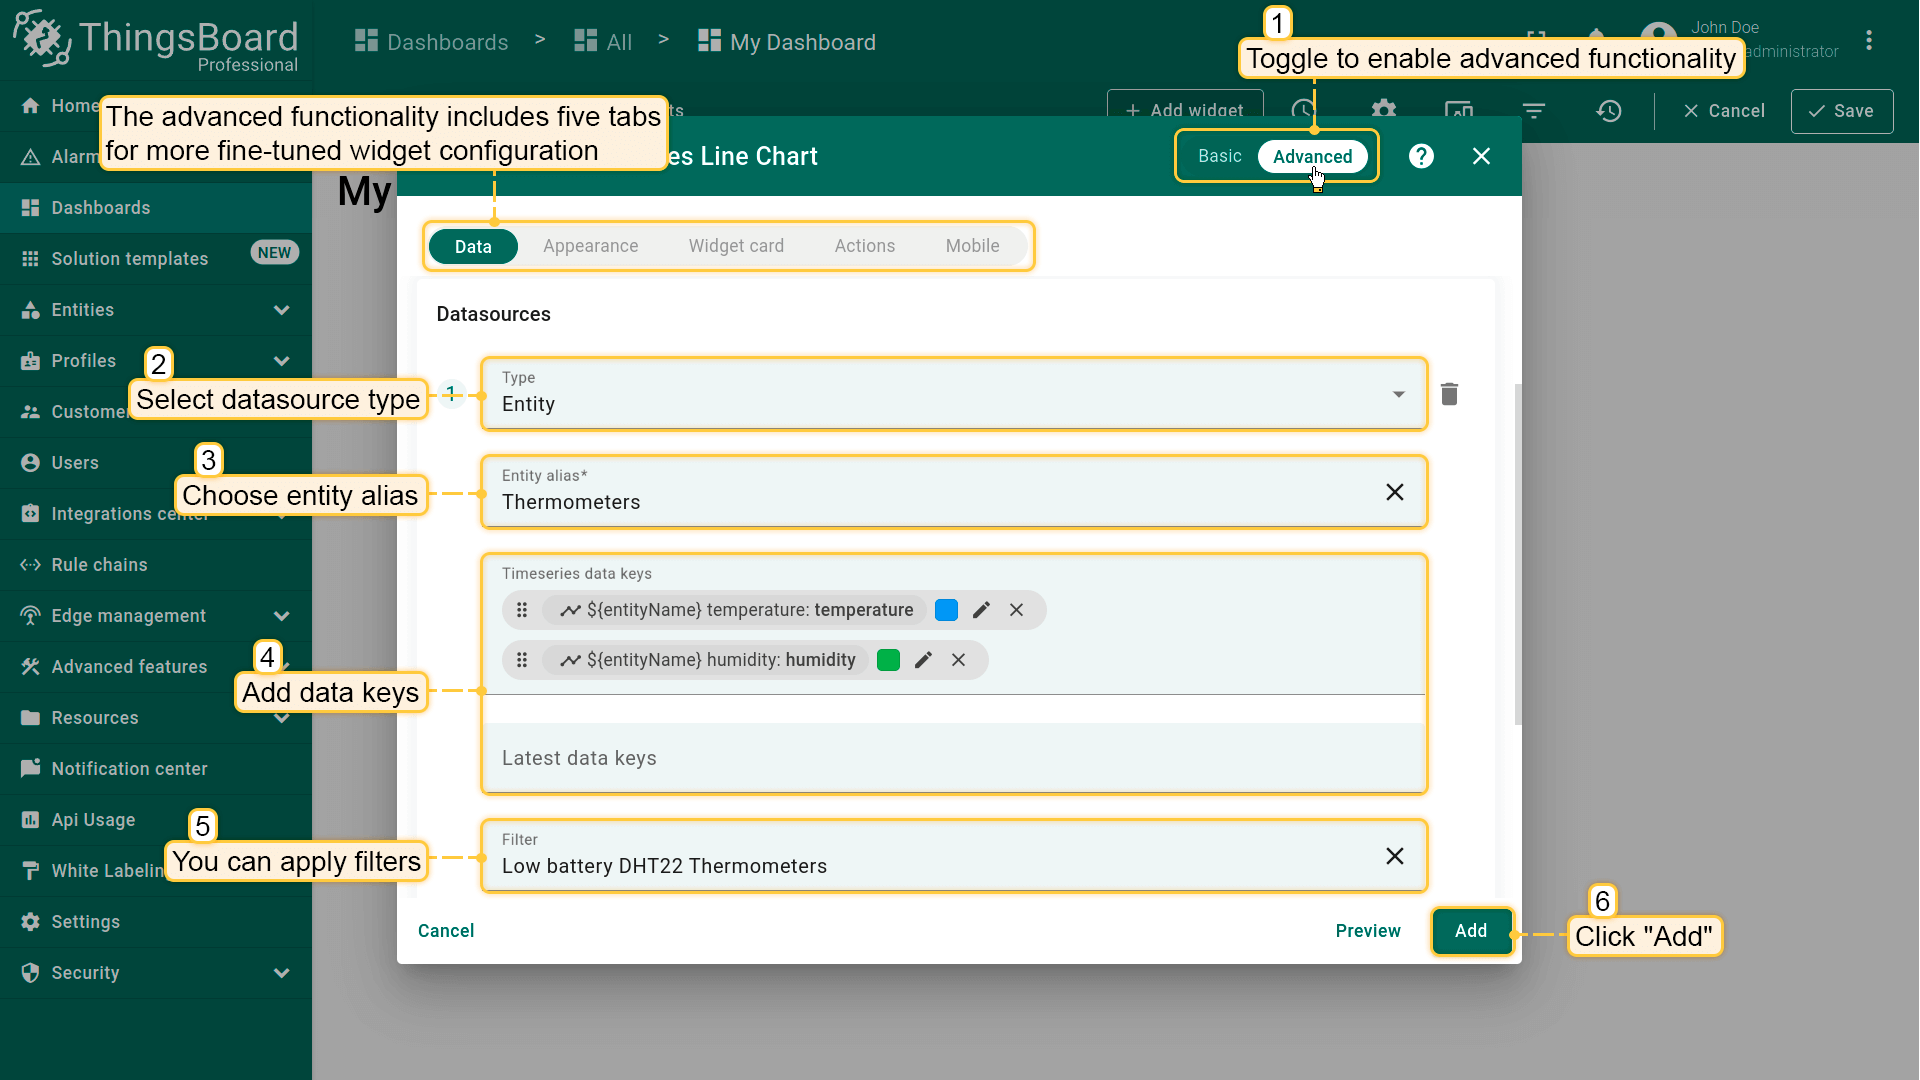
高级模式
高级模式支持多个数据源(若部件支持)、过滤以及五个配置选项卡以精细控制:数据、外观、部件卡片、操作和布局。
高级模式提供额外数据源类型(取决于部件):函数、实体数量和告警数量。
数据设置
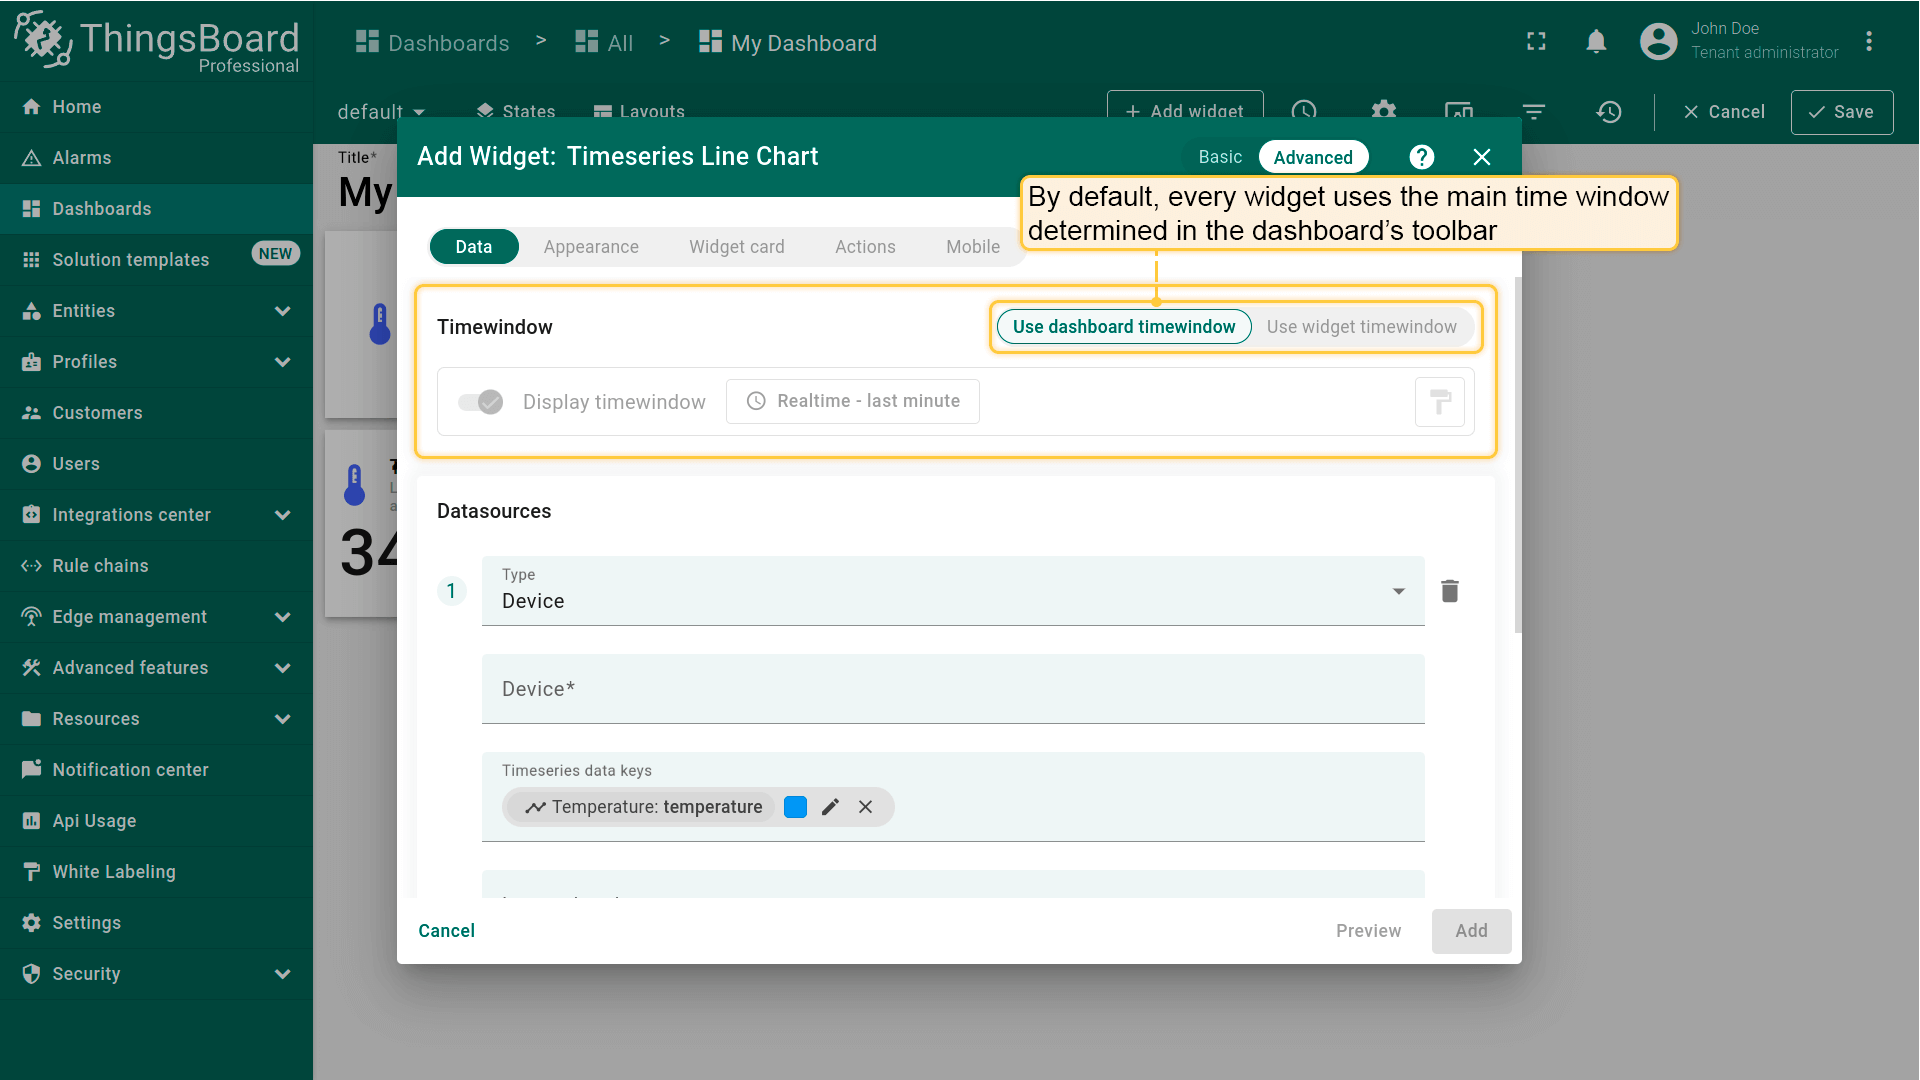
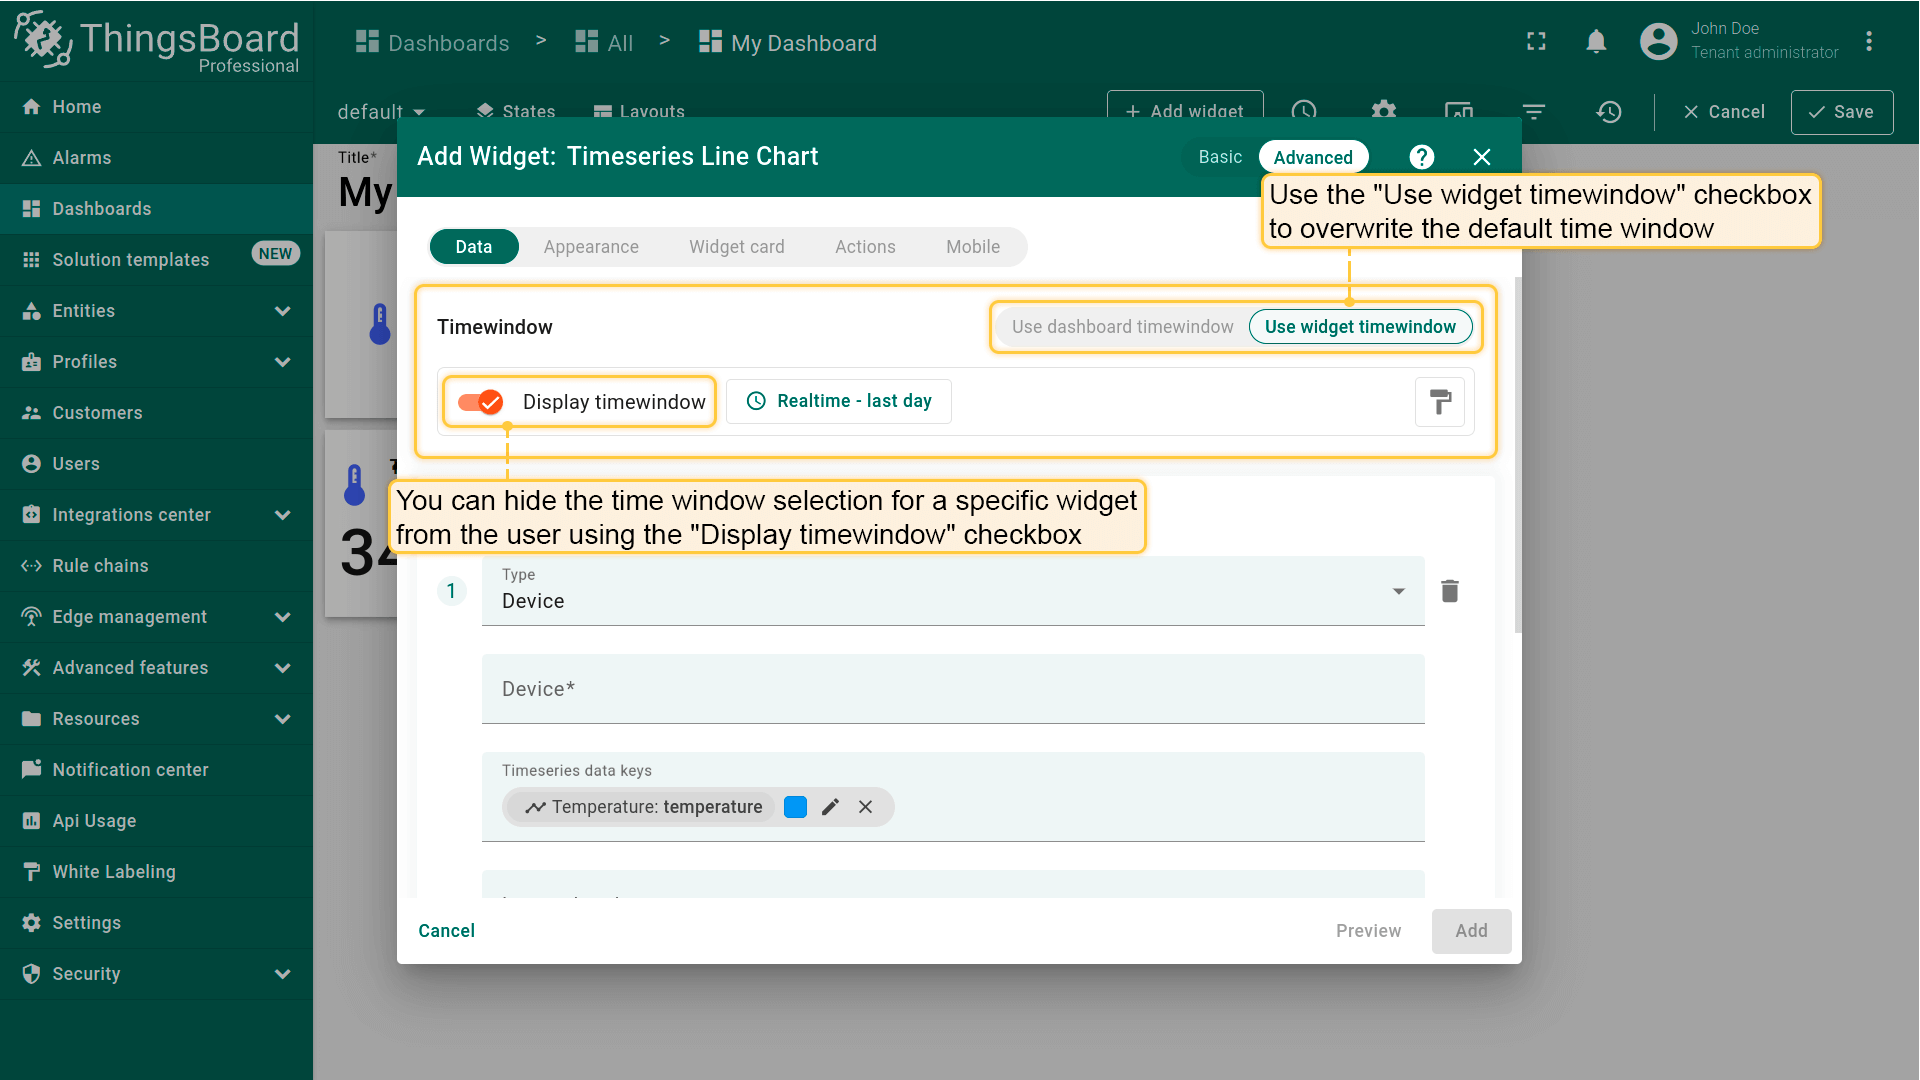
部件时间窗口
部件的时间窗口定义了获取遥测或告警数据使用的时间区间和聚合函数。
默认情况下,每个部件使用其自身时间窗口。可通过启用对应选项改为使用仪表板时间窗口。
要对此部件隐藏时间窗口选择器,需关闭显示时间窗口选项。
详见时间窗口指南。
数据源类型
部件数据设置允许添加一个或多个数据源。
数据源由数据源类型、可选过滤器以及数据键列表(属性 / 遥测)组成,用于定义部件从哪些实体获取并显示数据。
可用类型:
- 设备 — 从单个指定设备读取数据
- 实体 — 从实体别名解析的实体及可选过滤器读取数据
- 函数 — 生成数据(如随机值)以在无实时遥测时预览部件
- 实体数量 — 显示匹配别名/过滤器的实体数量
- 告警数量 — 显示匹配所选过滤器的告警数量
设备作为数据源
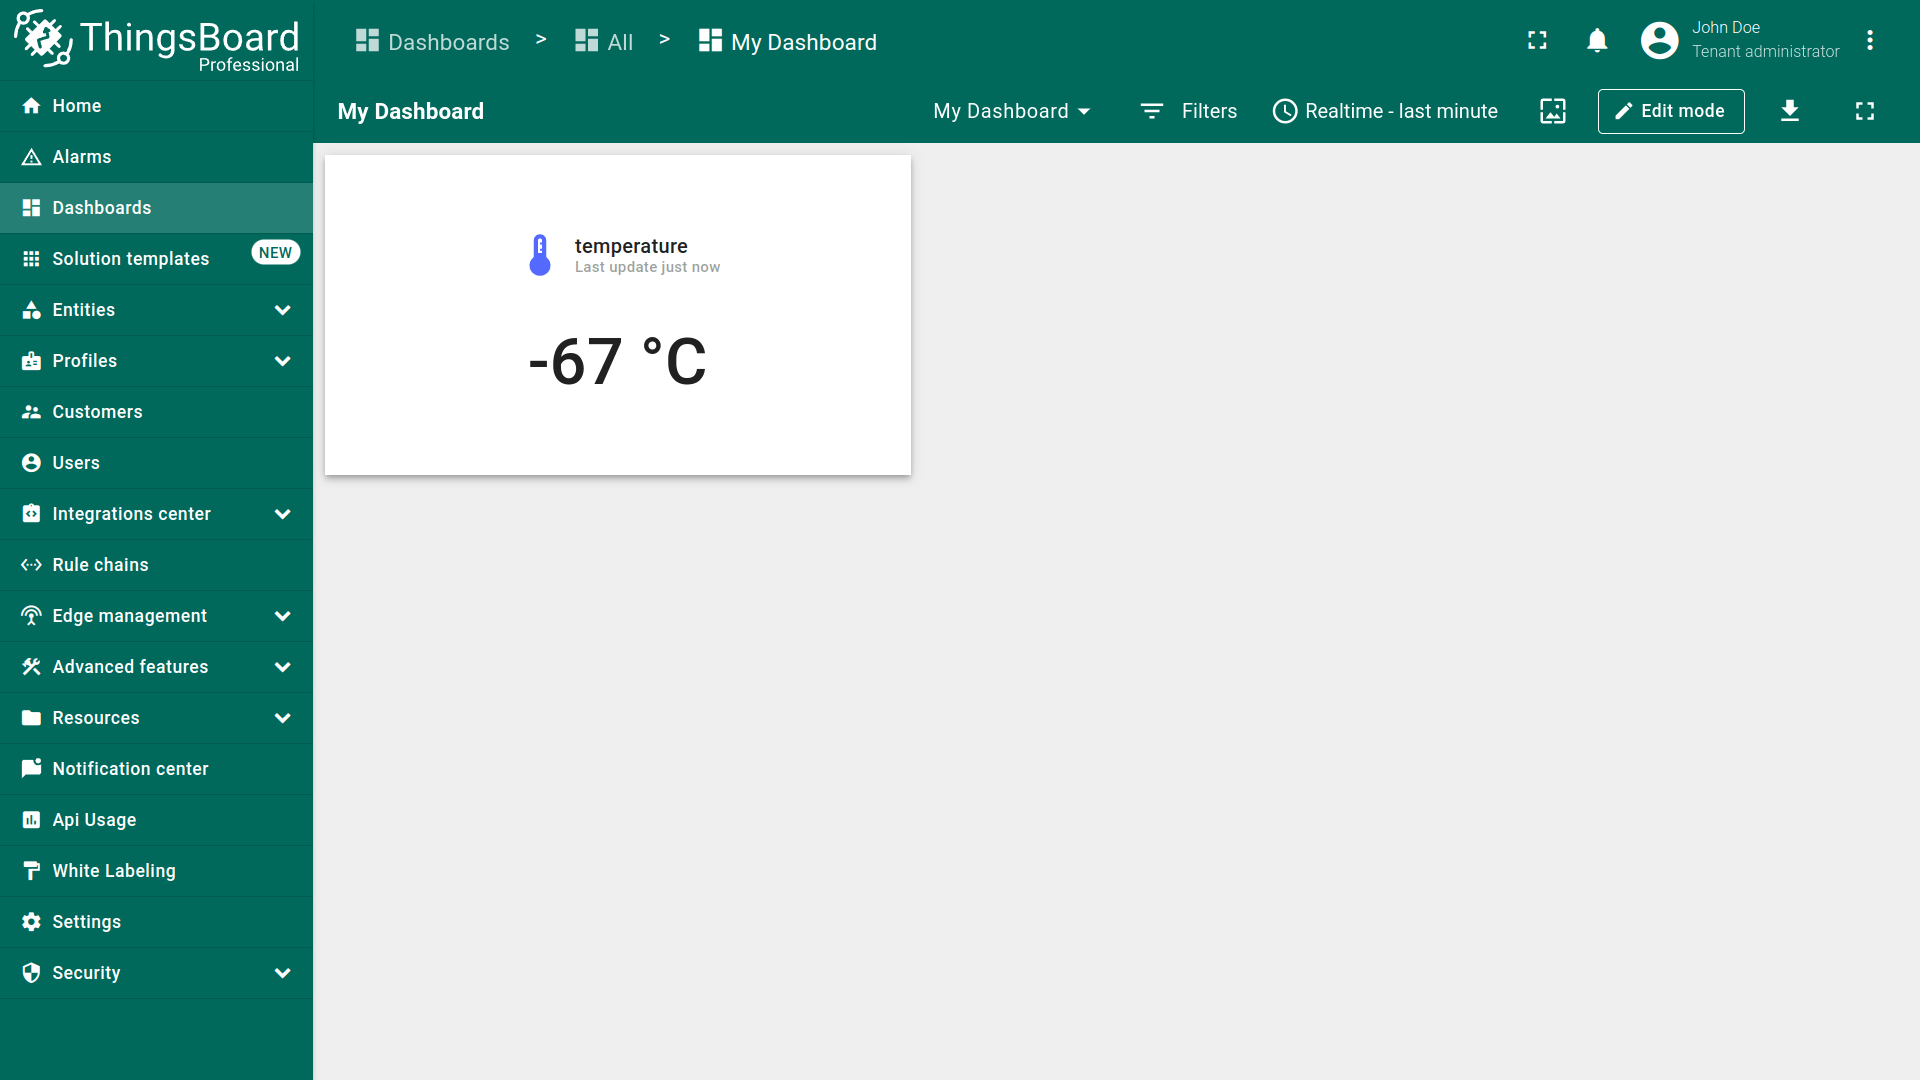
用于从单个设备获取遥测数据。
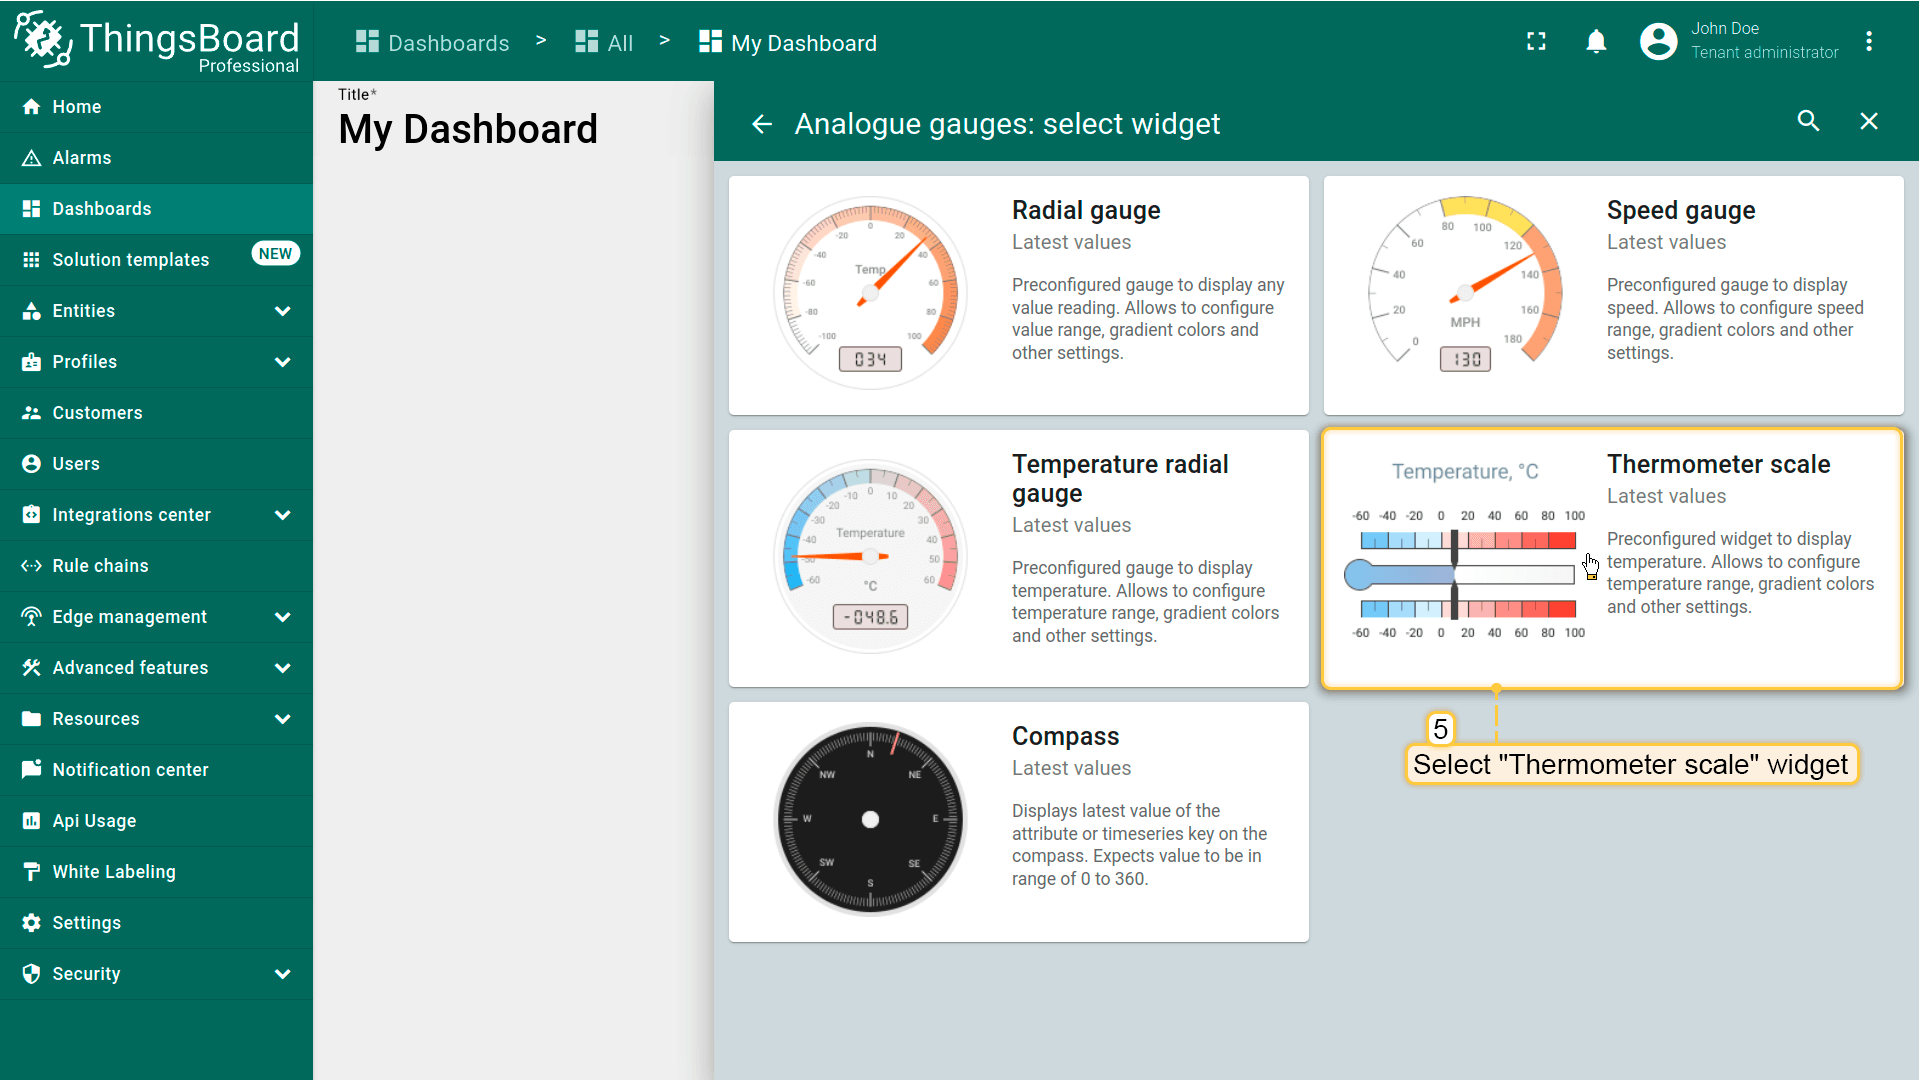
示例:假设某设备发布室内温度数据,希望将其显示在部件中,可使用温度计刻度部件进行可视化。
- Open your dashboard and enter edit mode. Then click the "+ Add widget" icon at the top of the screen, or (if this is your first widget on this dashboard) click a large "Add new widget" sign in the middle of the screen to open the "Widgets bundle” dialog window;
- Select "Analogue gauge" widget bundle;
- Then select a "Thermometer scale" widget;
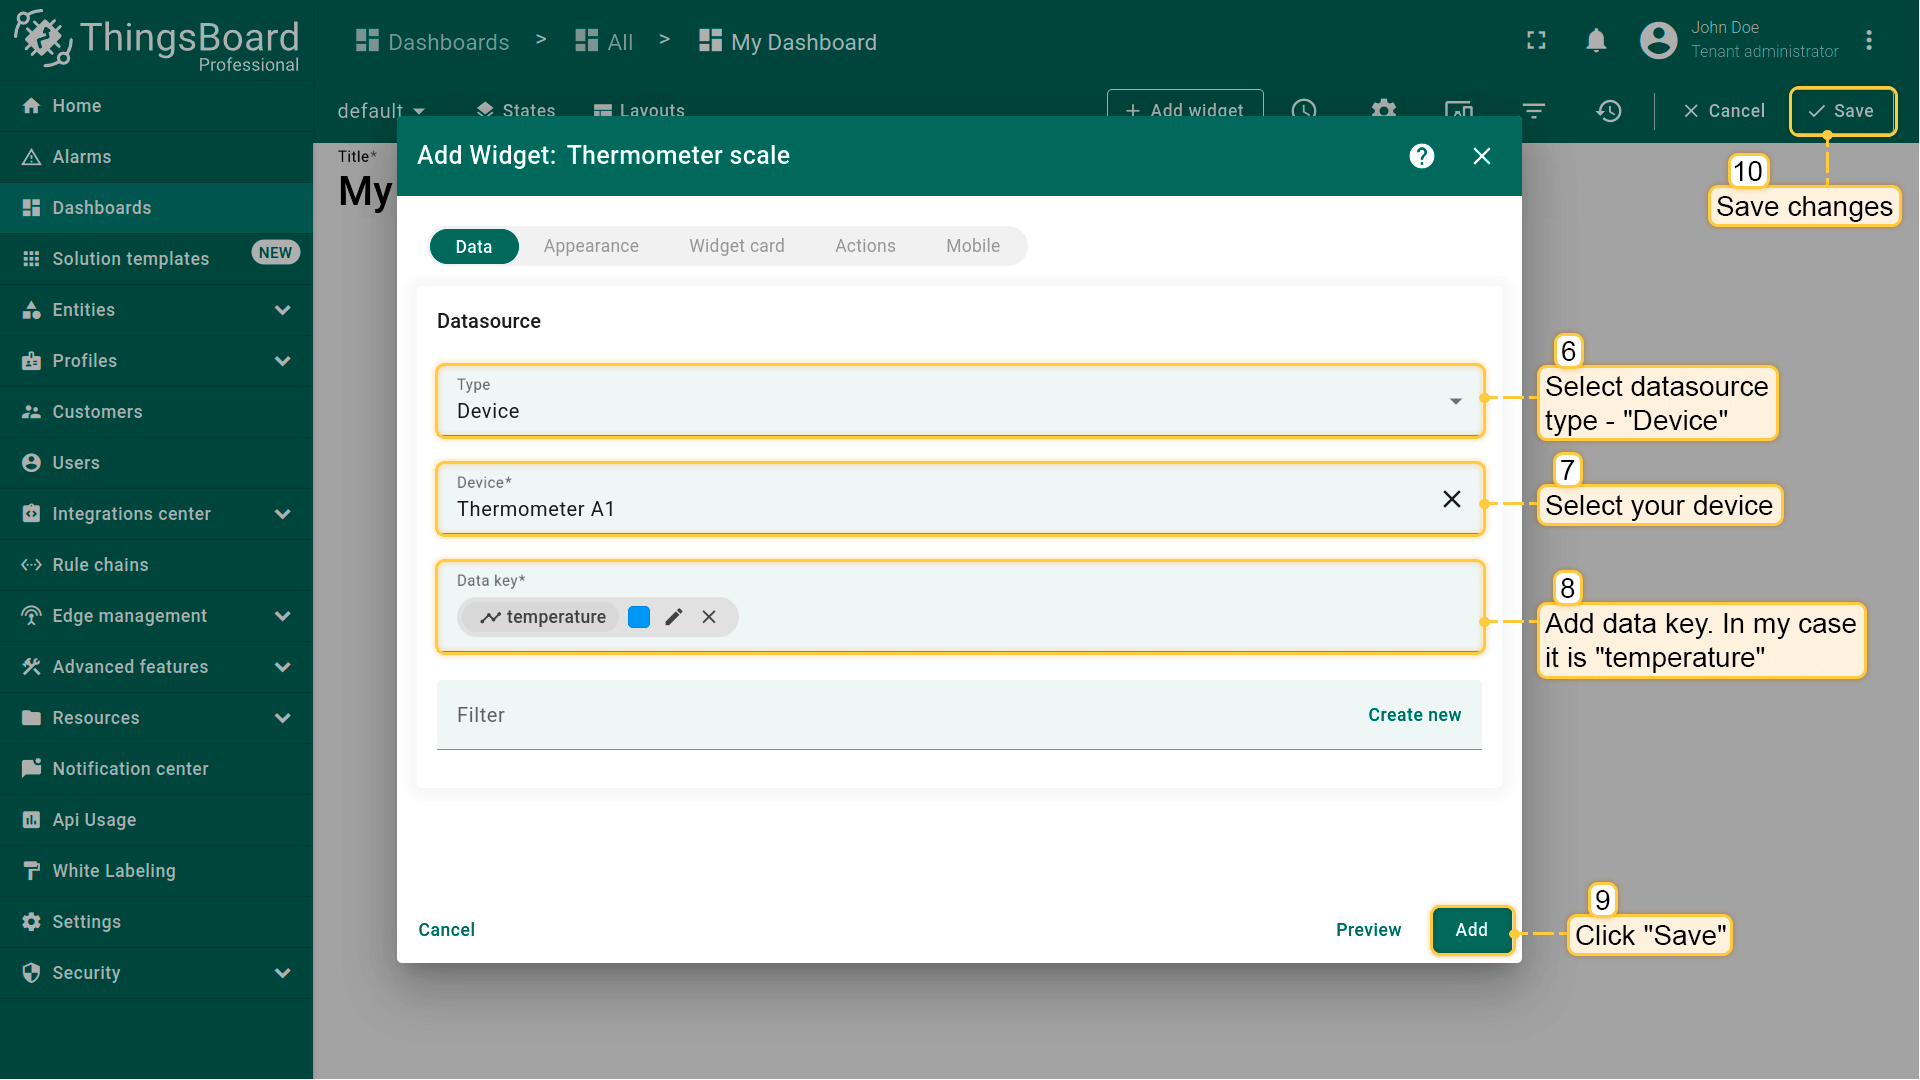
- The "Add Widget" dialog window will open. Select data source type - "Device" and select your device. Then add data key - "temperature". Click "Add" and save all changes;
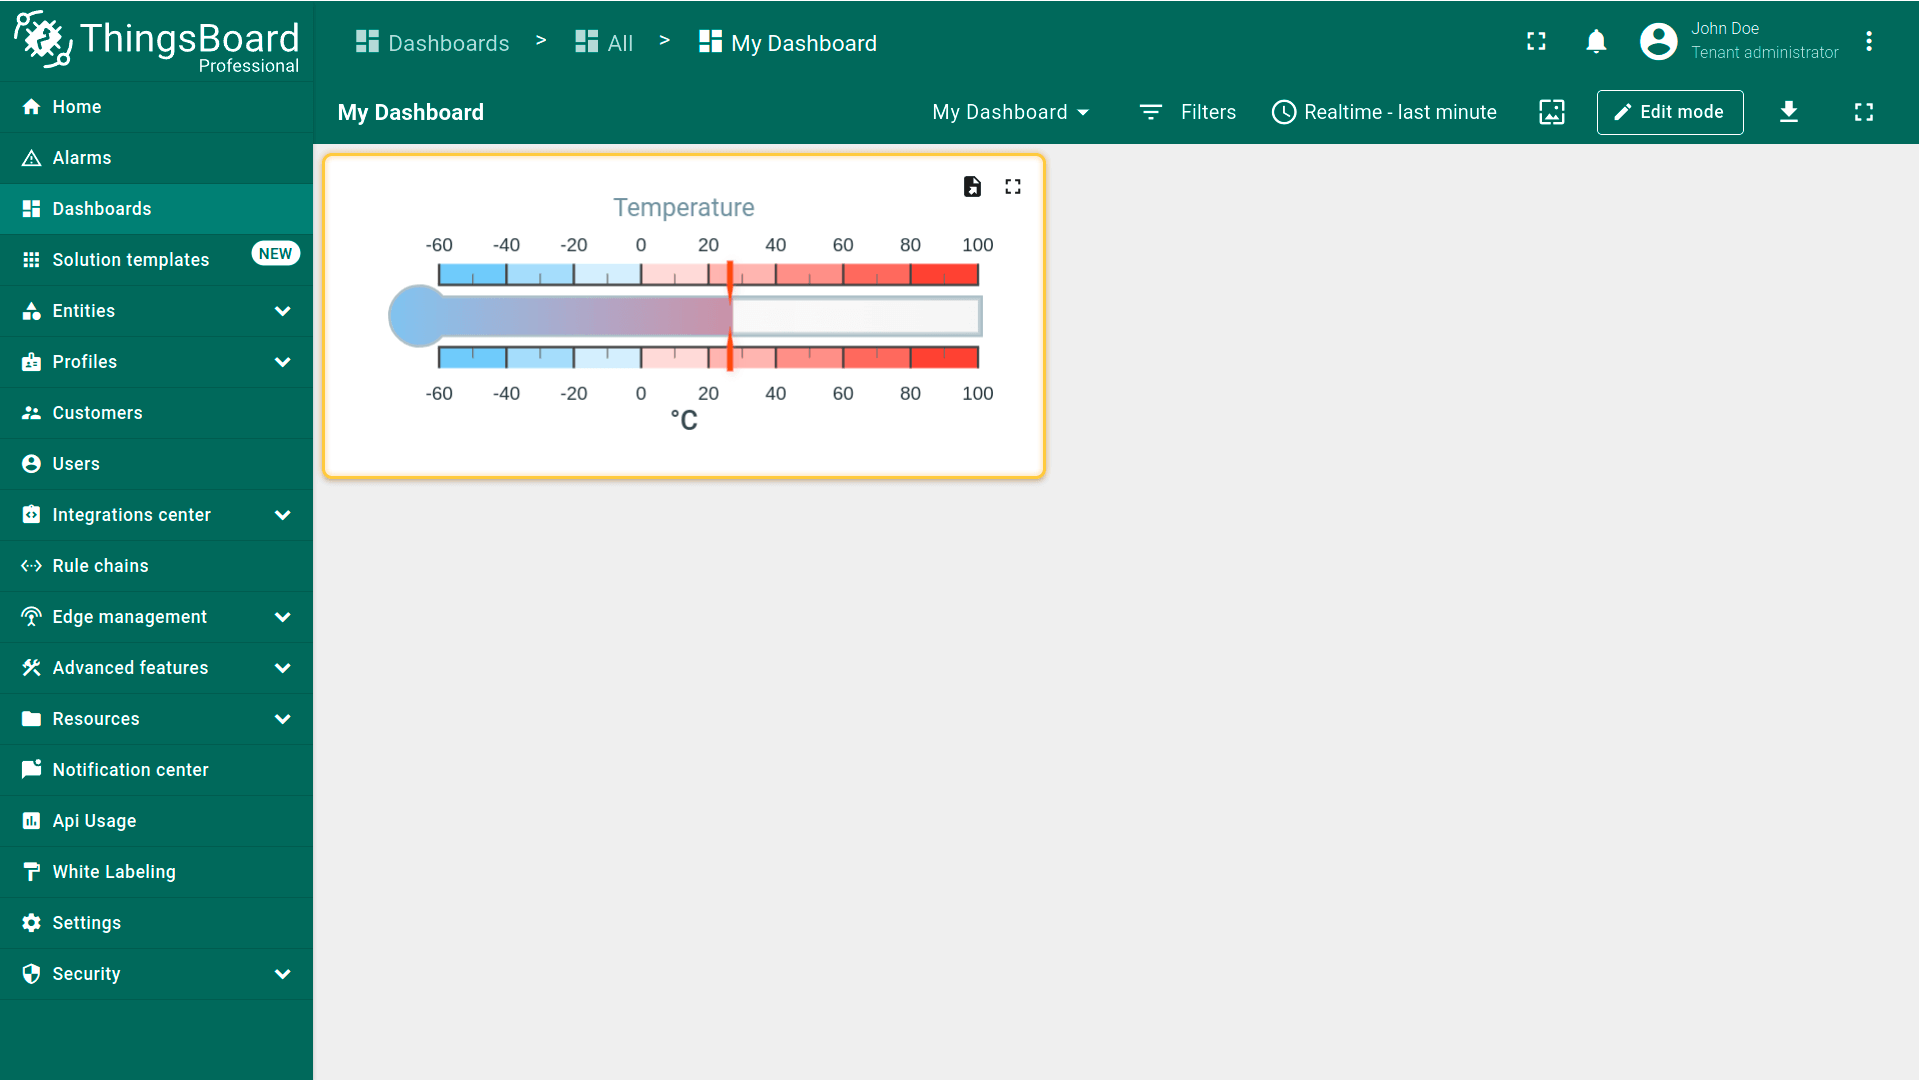
- Thermometer scale widget is created.
实体作为数据源
用于从实体别名解析的实体获取数据(例如:全部设备、按类型设备、分组资产等)。
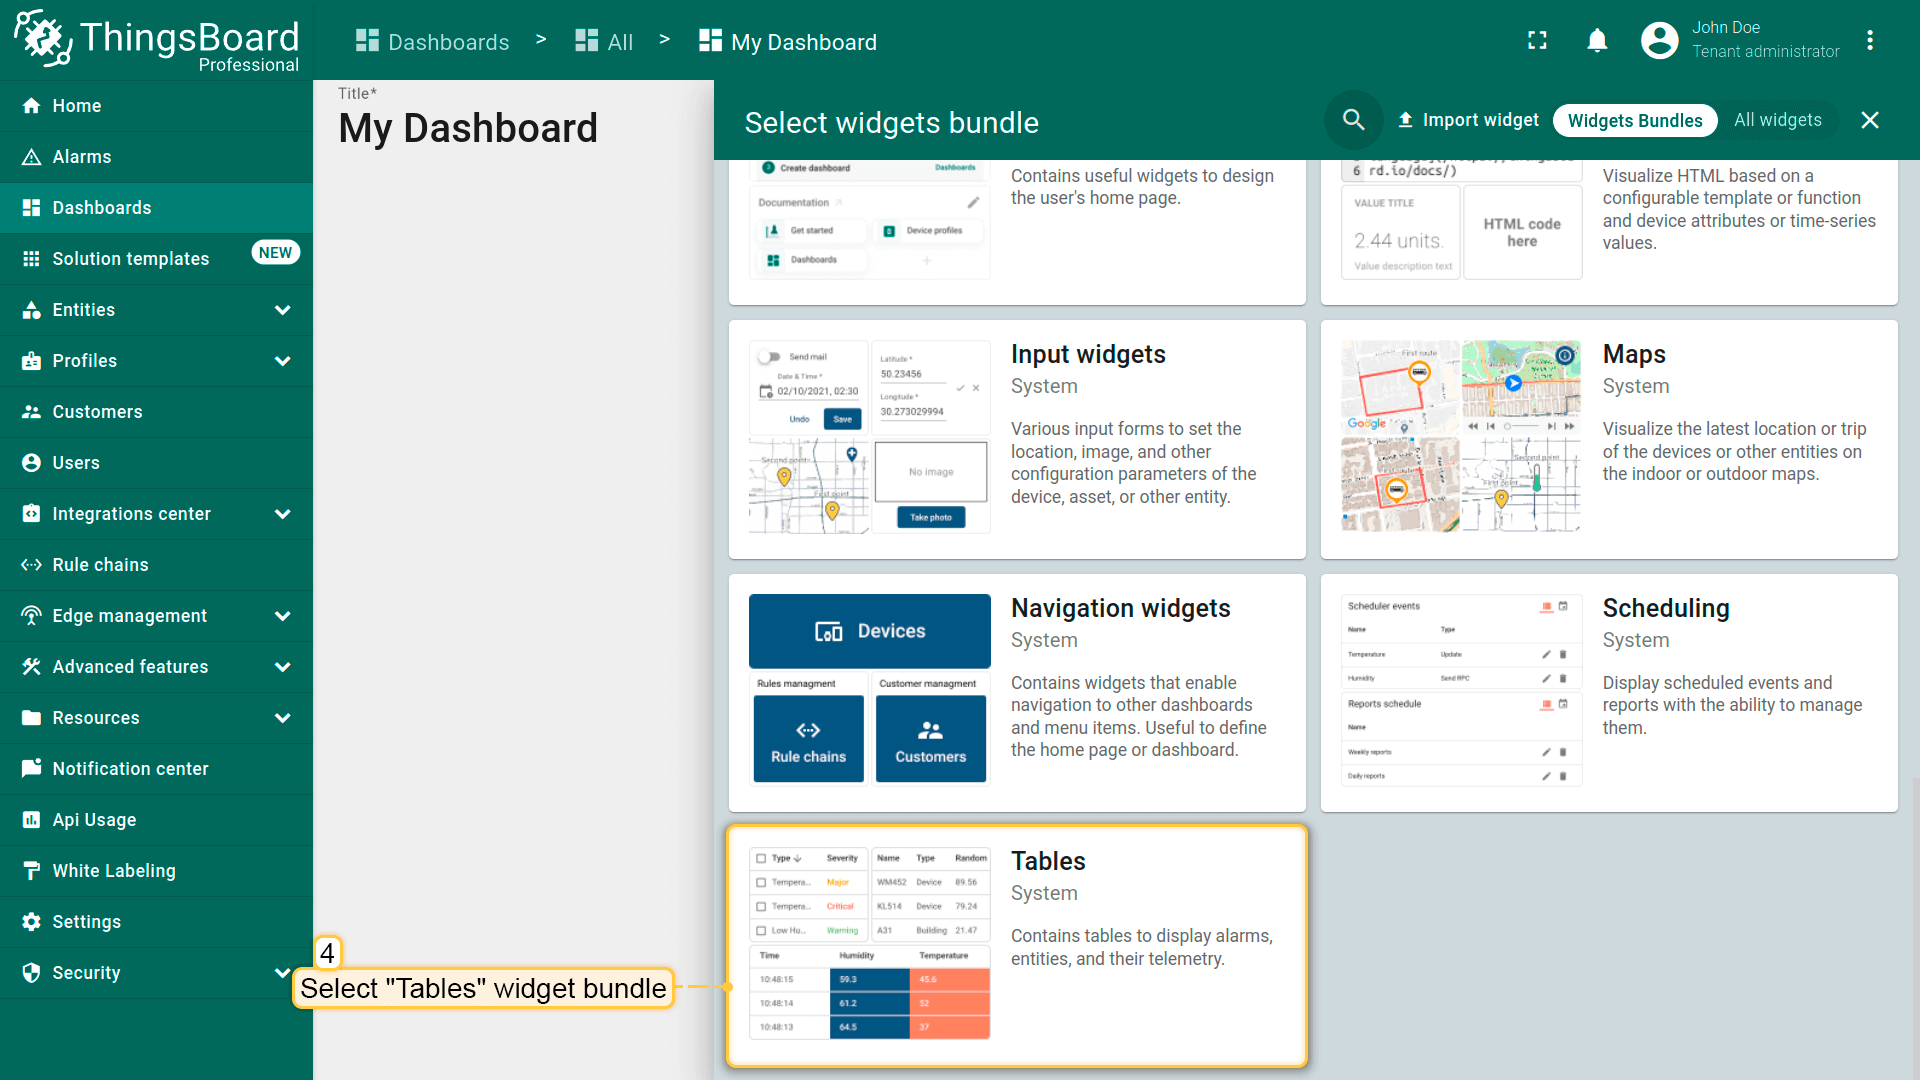
示例:在实体表中列出所有设备。
- Open your dashboard and enter edit mode. Then click the "+ Add widget" icon at the top of the screen, or (if this is your first widget on this dashboard) click a large "Add new widget" sign in the middle of the screen to open the "Widgets bundle” dialog window;
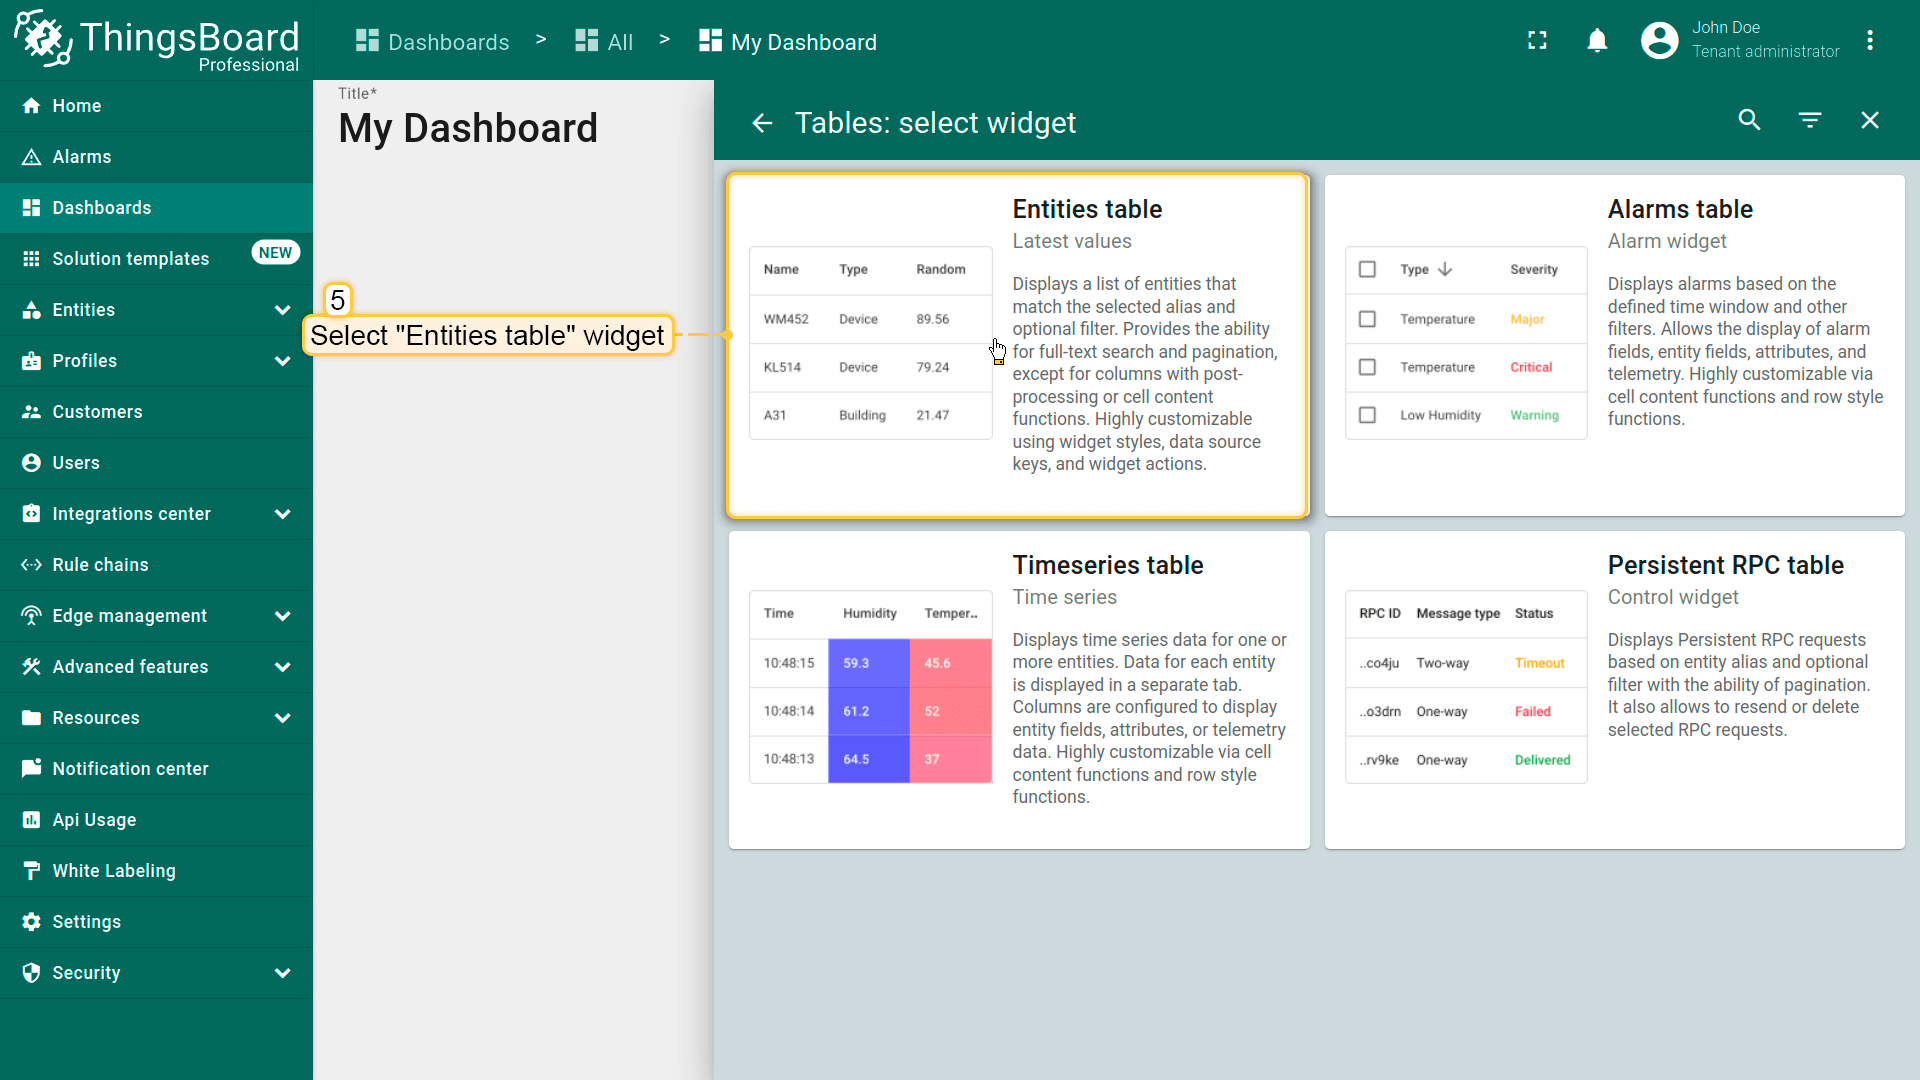
- Select "Tables" widget bundle;
- Then select an "Entities table" widget;
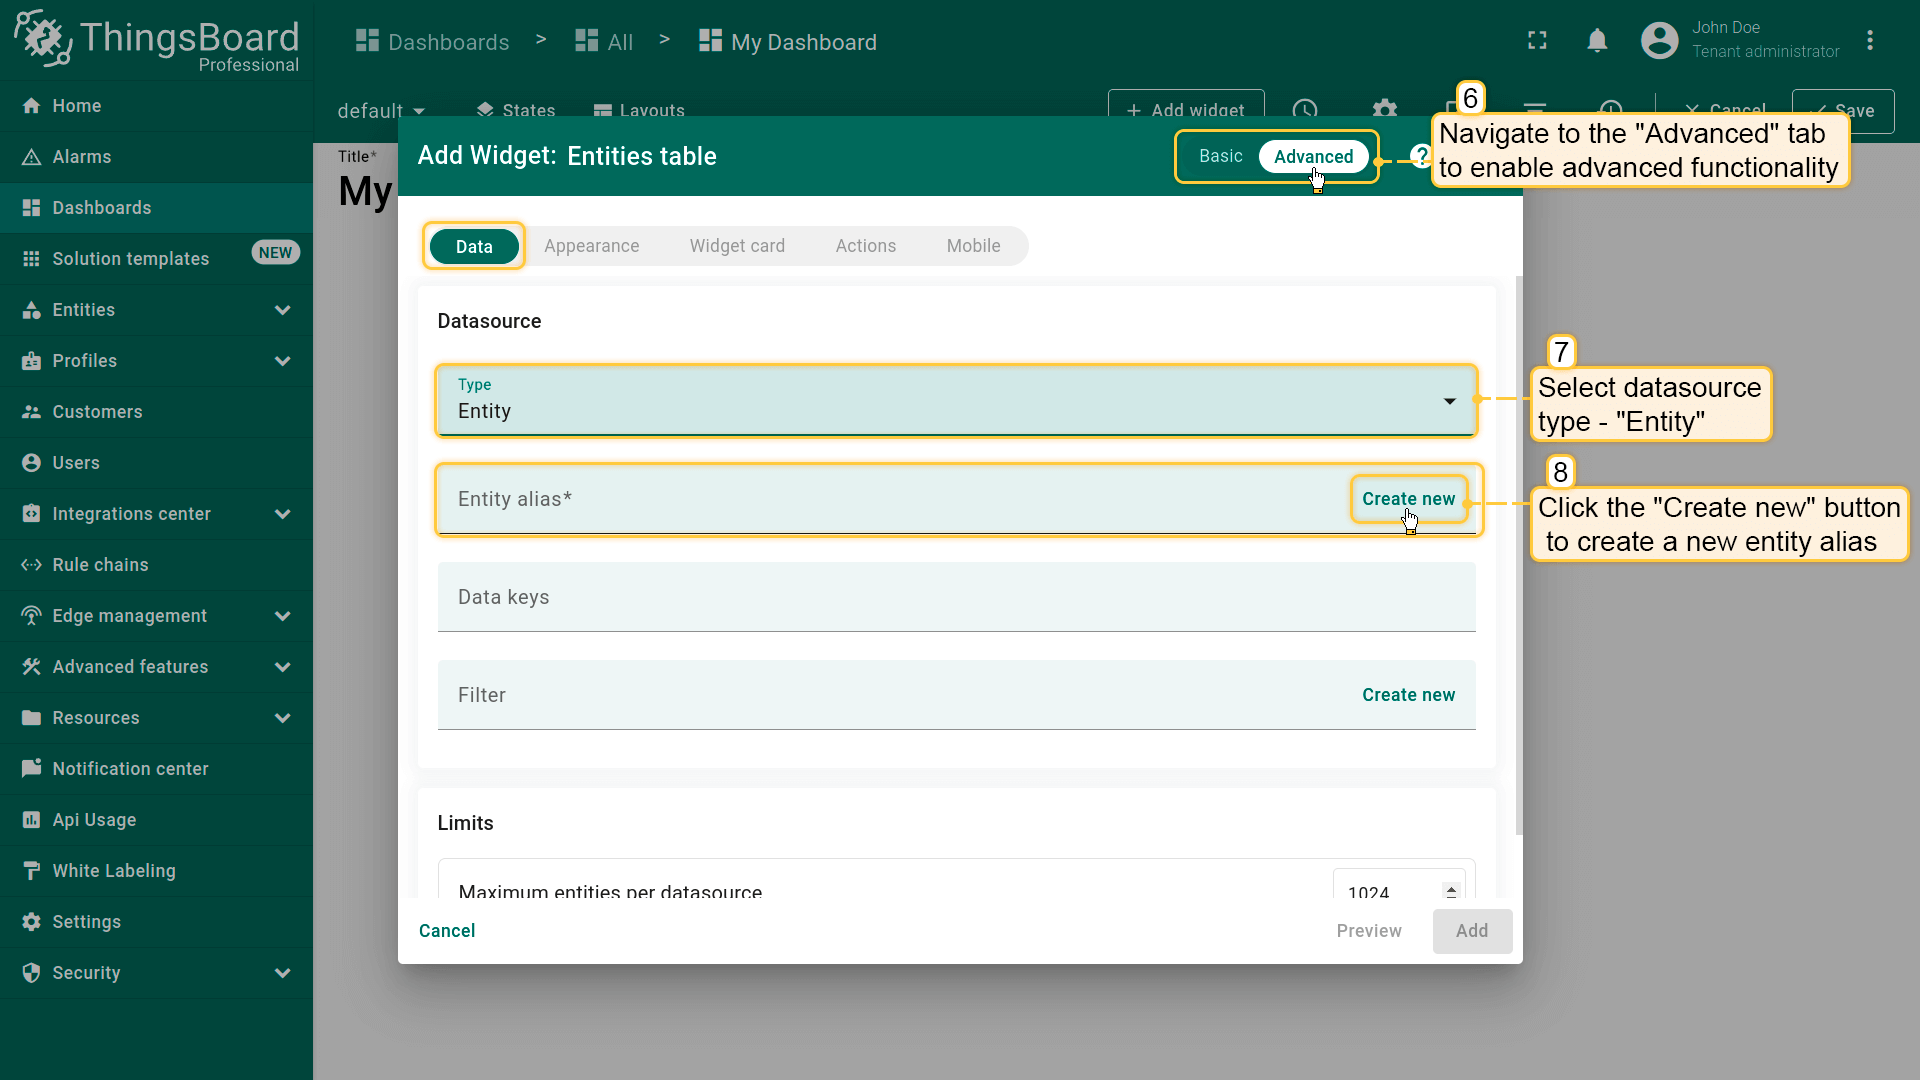
- The "Add Widget" dialog window will open. Select data source type - "Entity". Now, we need to create a new entity alias. Click "Create new" button in the entity alias row;
- In the opened Add alias dialog, enter an alias name, select filter type - "Entity type", and choose an entity type - "Device". Click "Add";
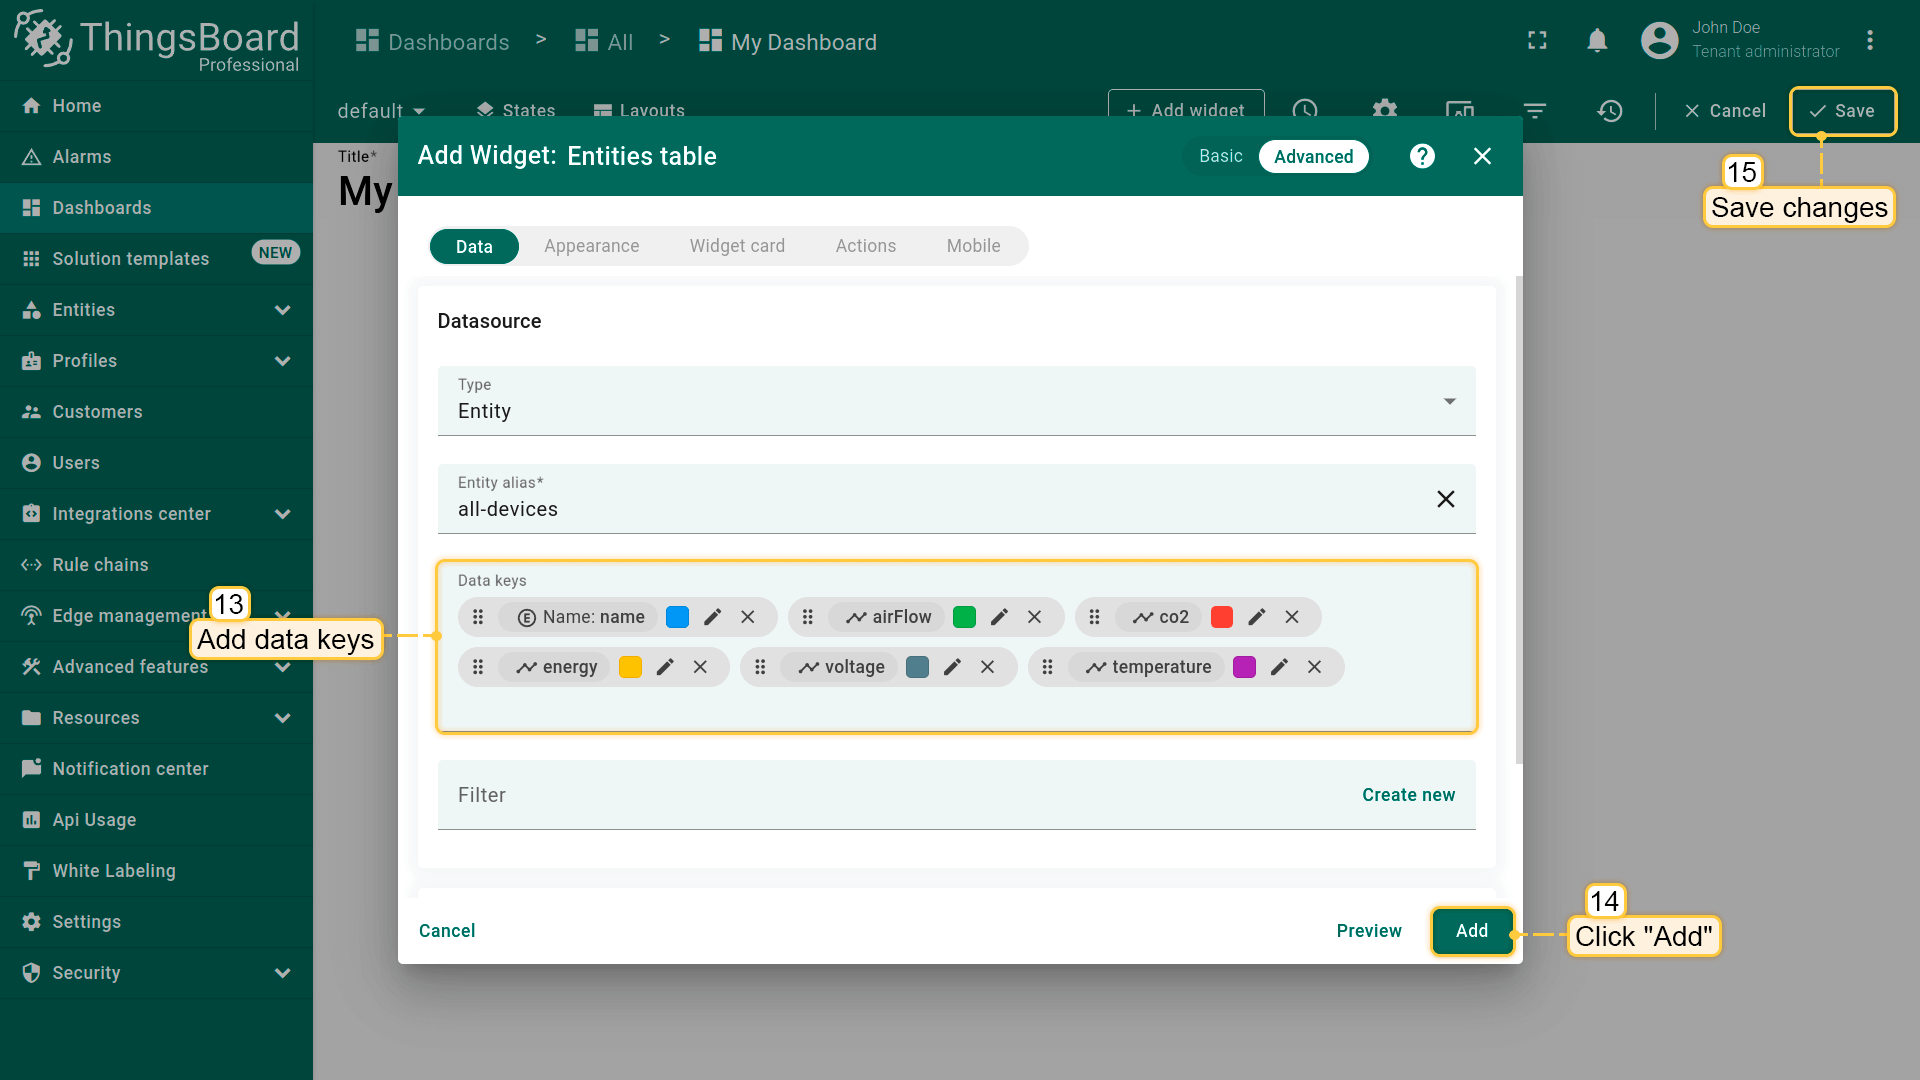
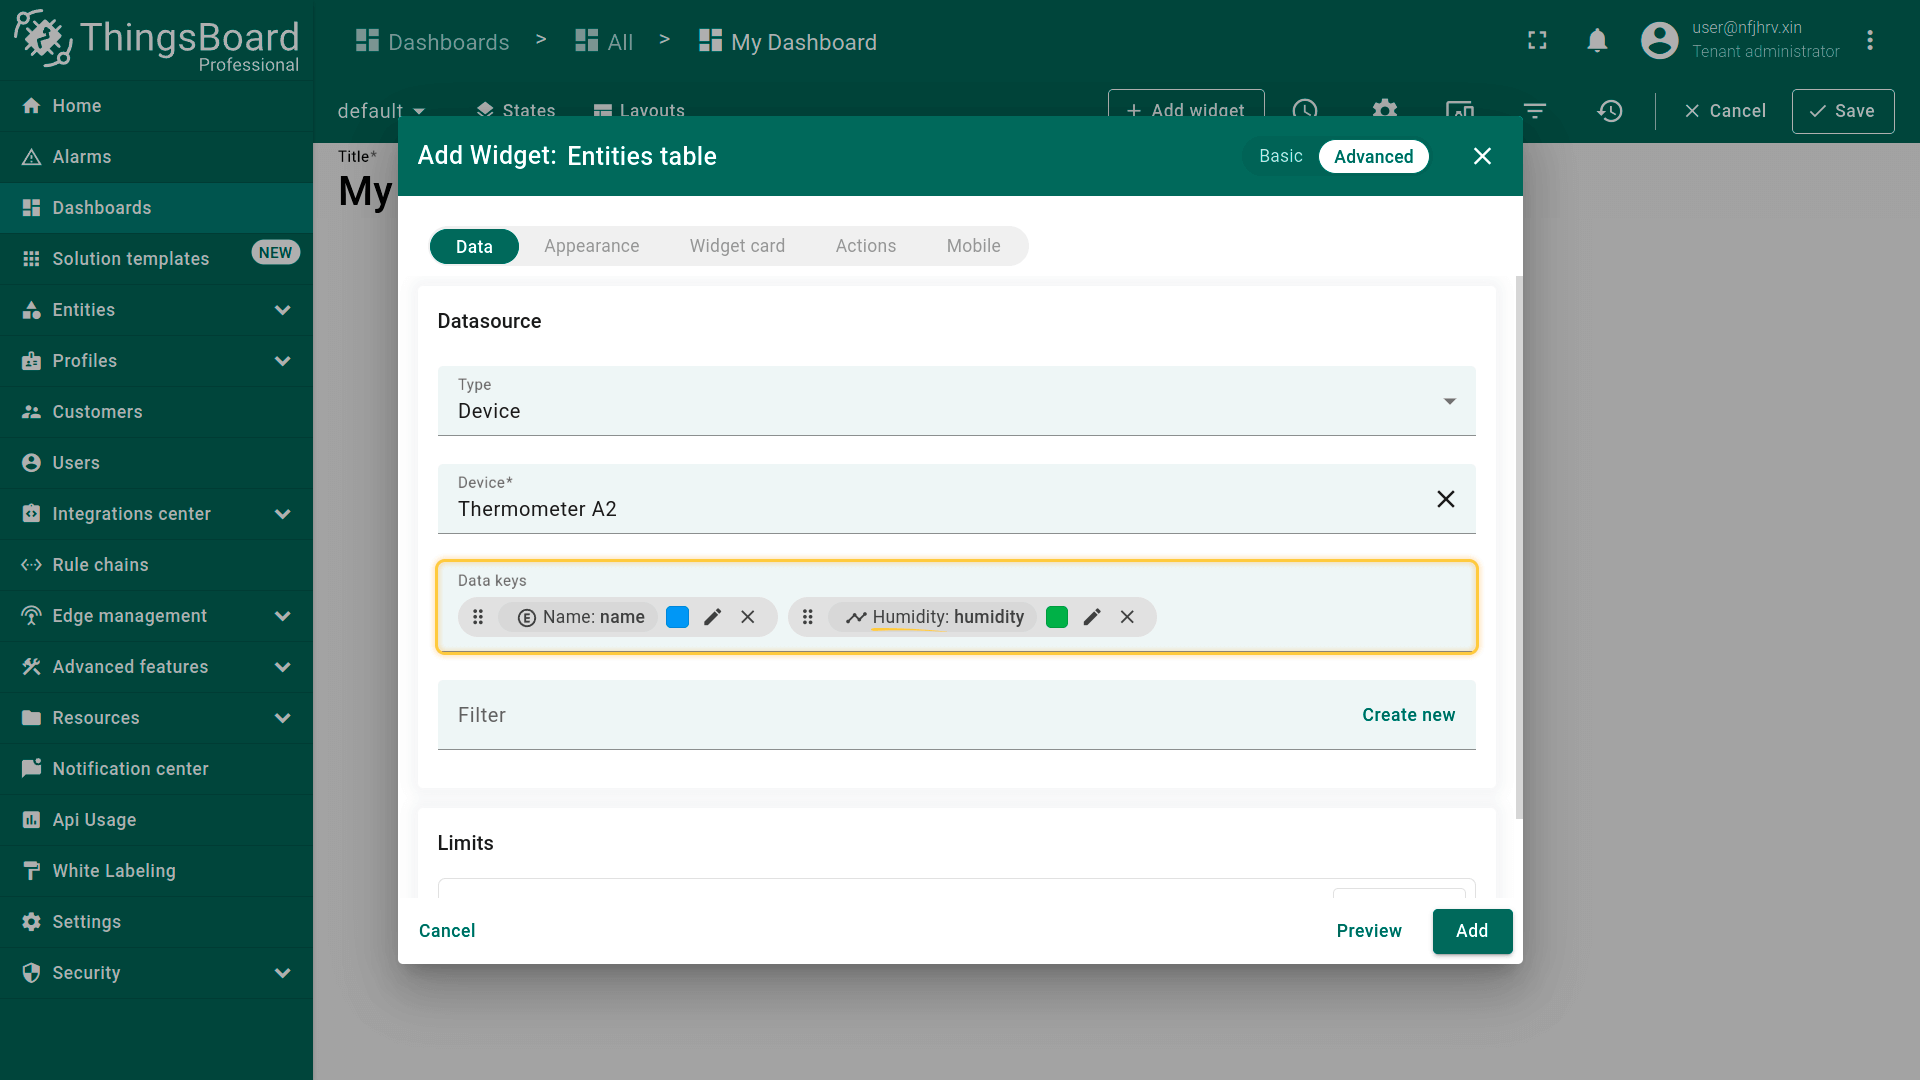
- Add data keys. Then click "Add" and save all changes;
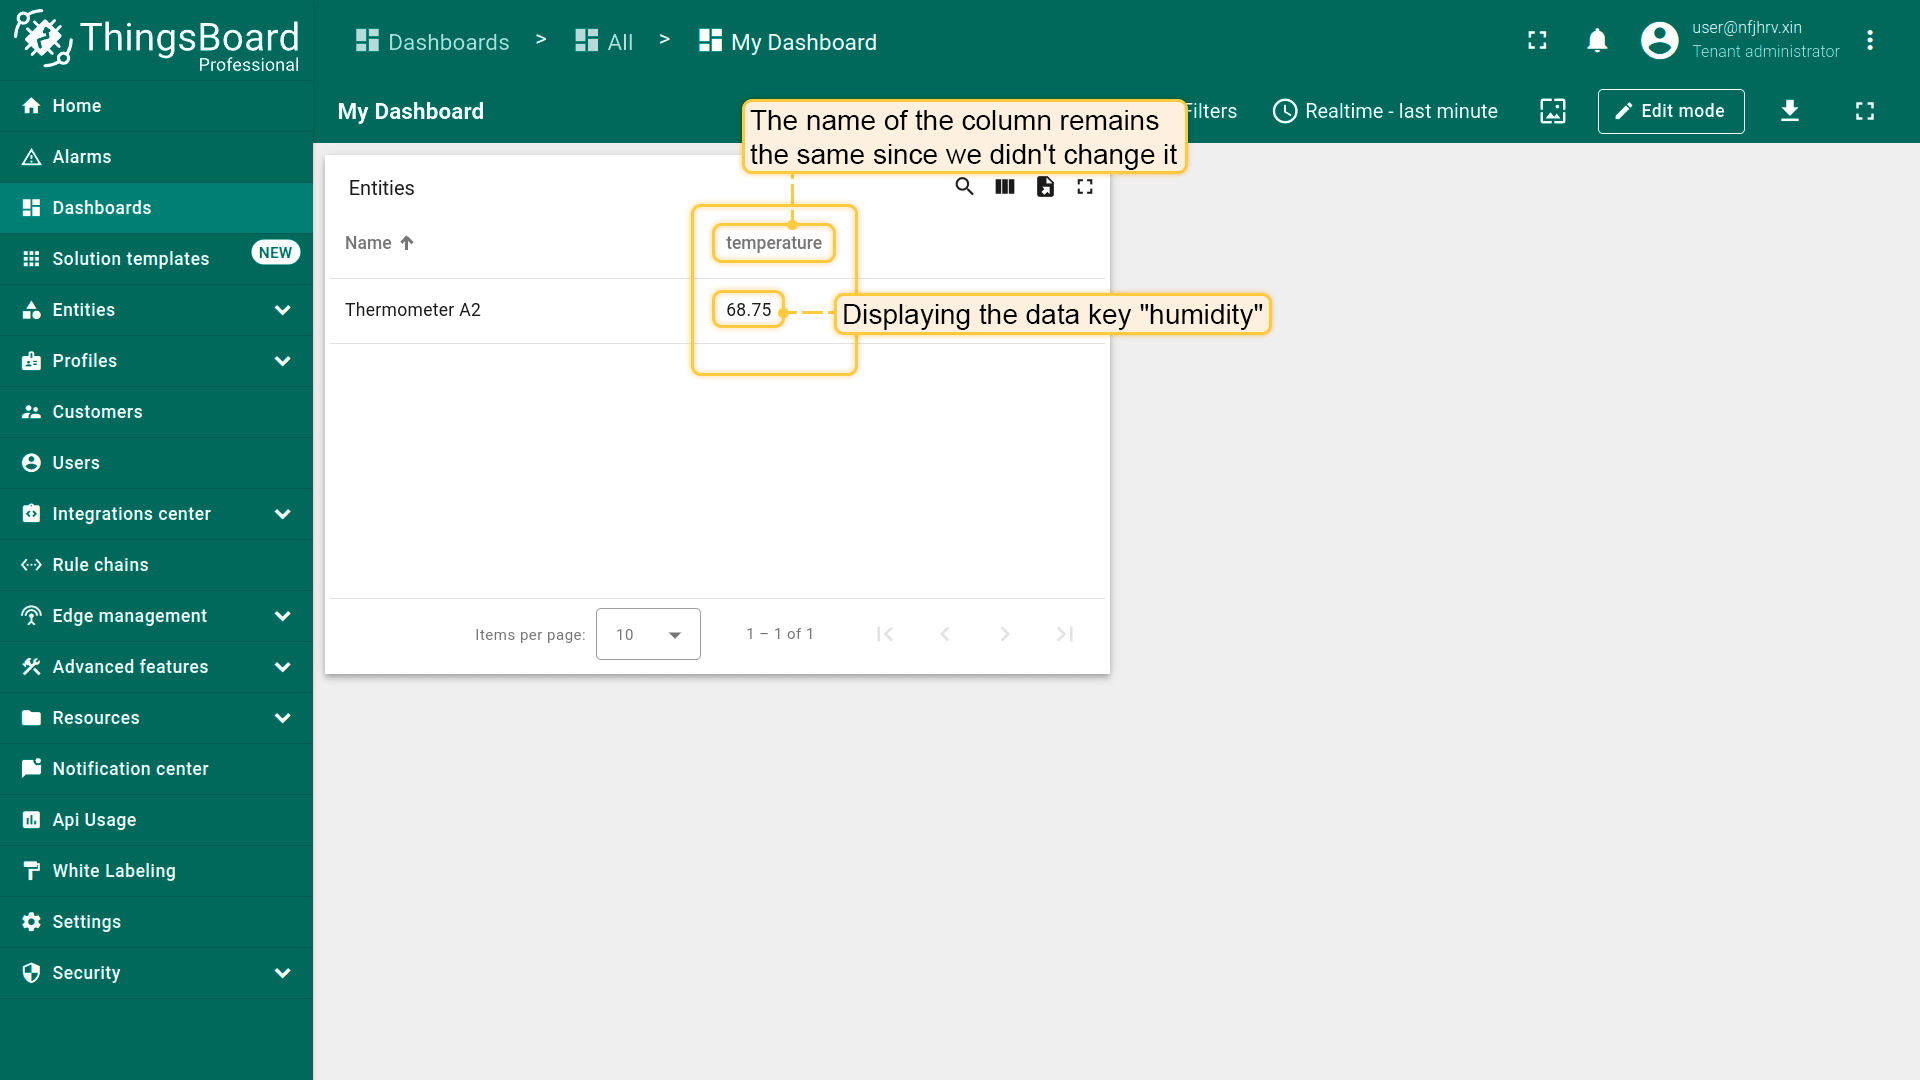
- A widget has been added that displays all devices using an entity alias as the datasource.


函数作为数据源
当尚无数据但需要测试部件可视化时可使用此类型。
示例:在数值卡片上显示随机值。
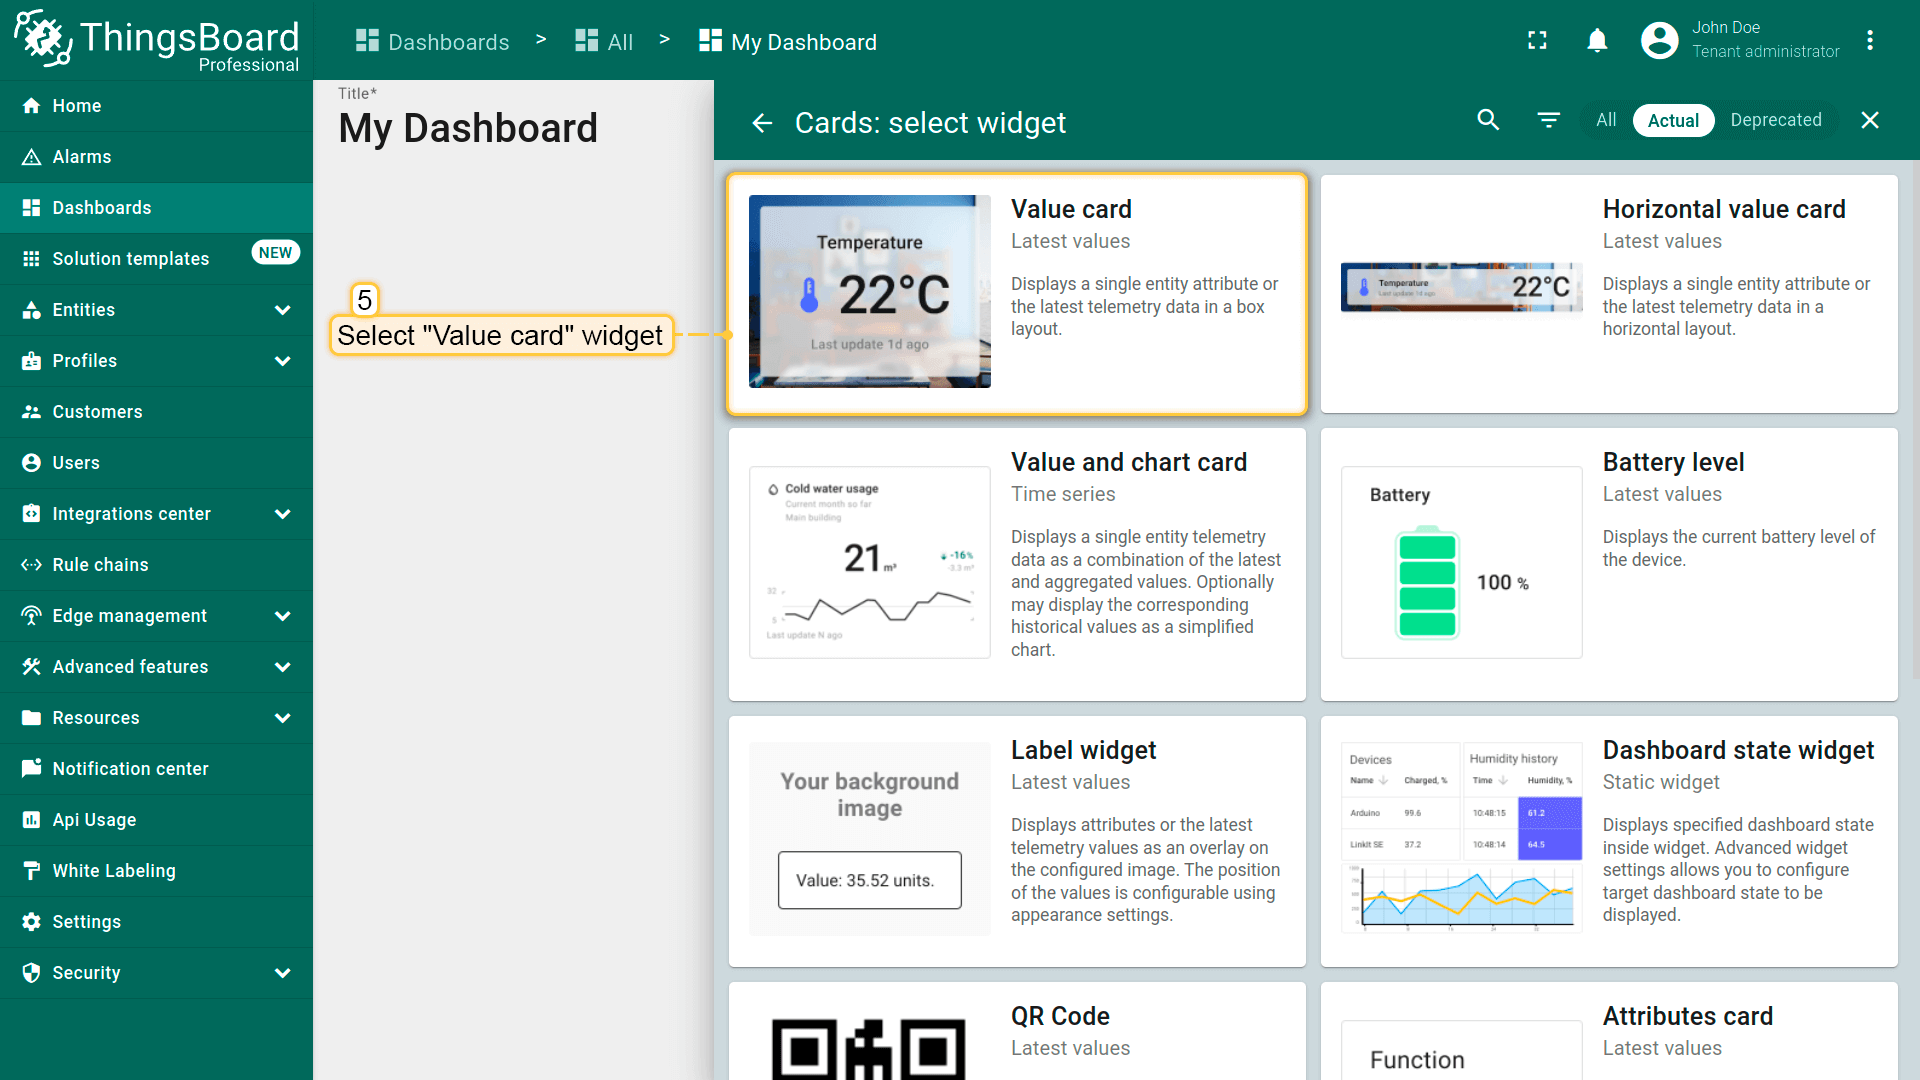
- Open your dashboard and enter edit mode. Then click the "+ Add widget" icon at the top of the screen, or (if this is your first widget on this dashboard) click a large "Add new widget" sign in the middle of the screen to open the "Widgets bundle” dialog window;
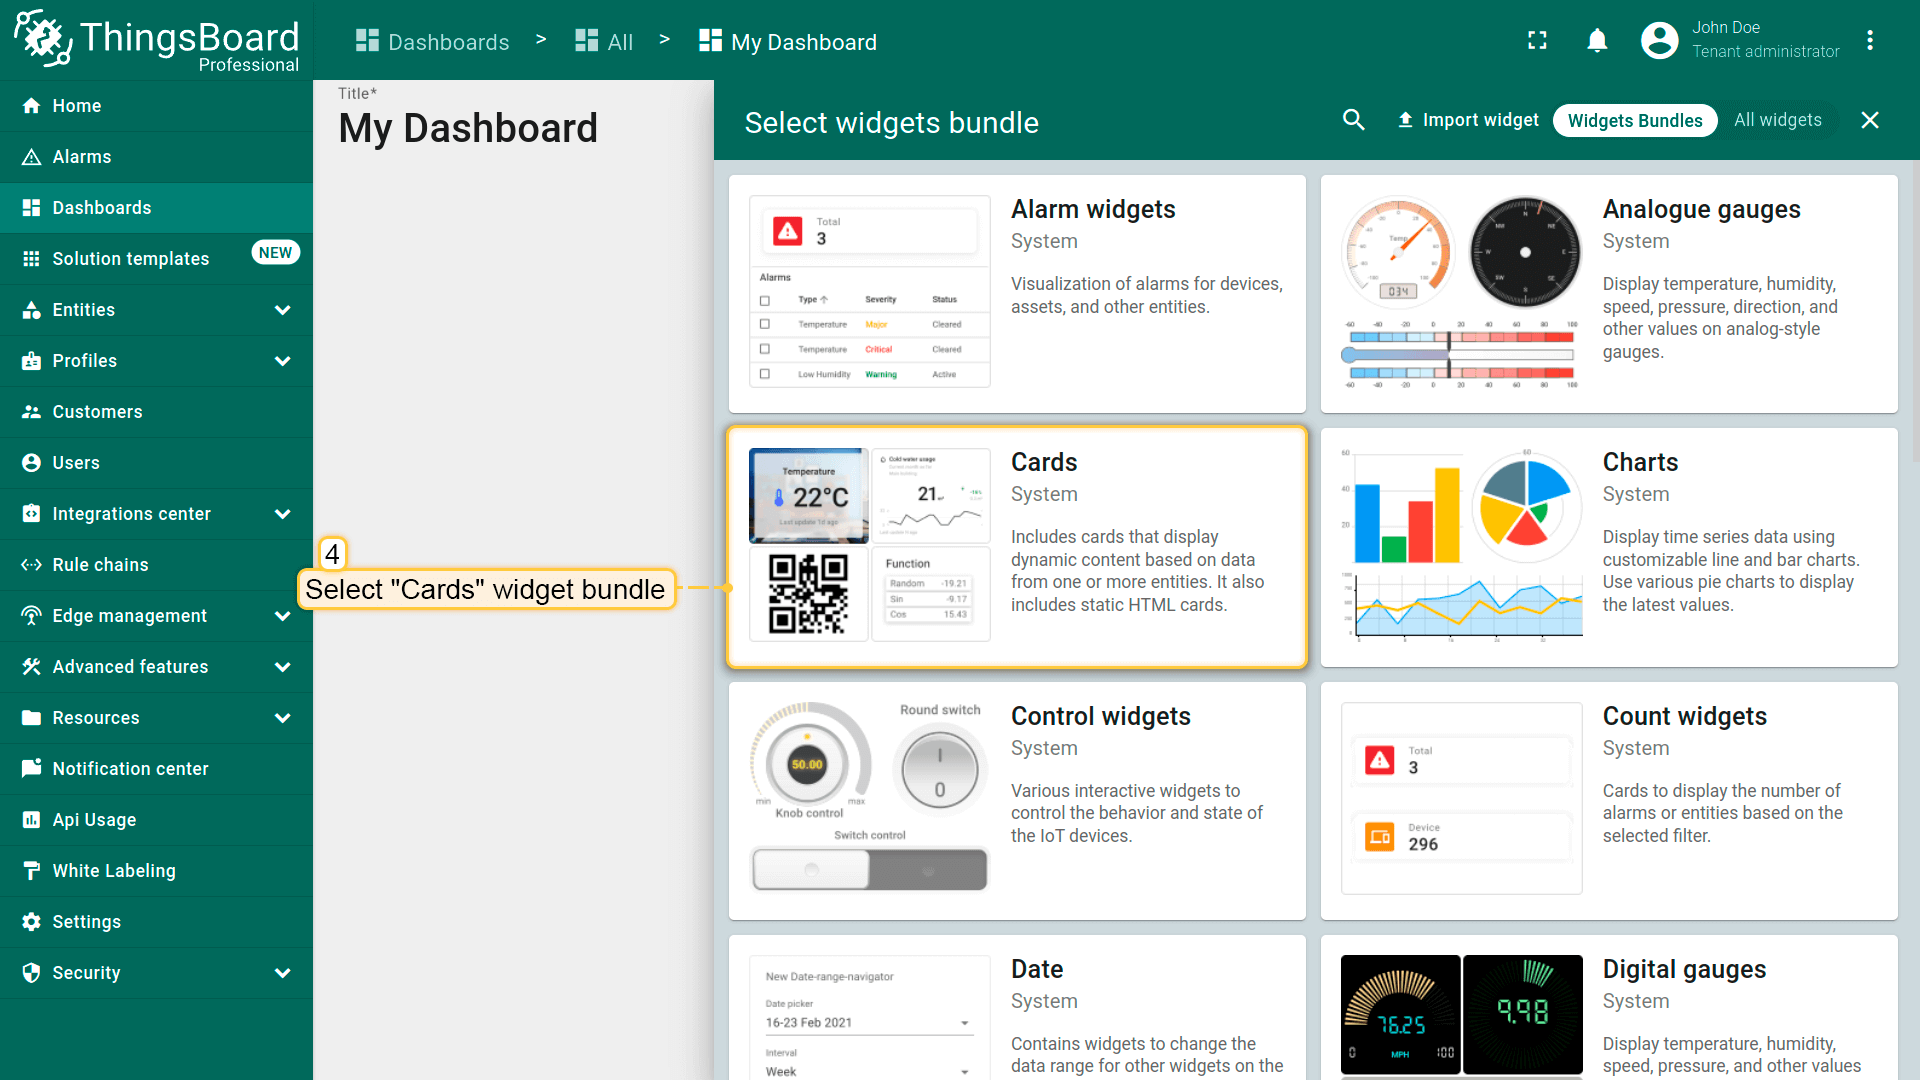
- Select a "Cards" widget bundle;
- Then select a "Value card" widget;
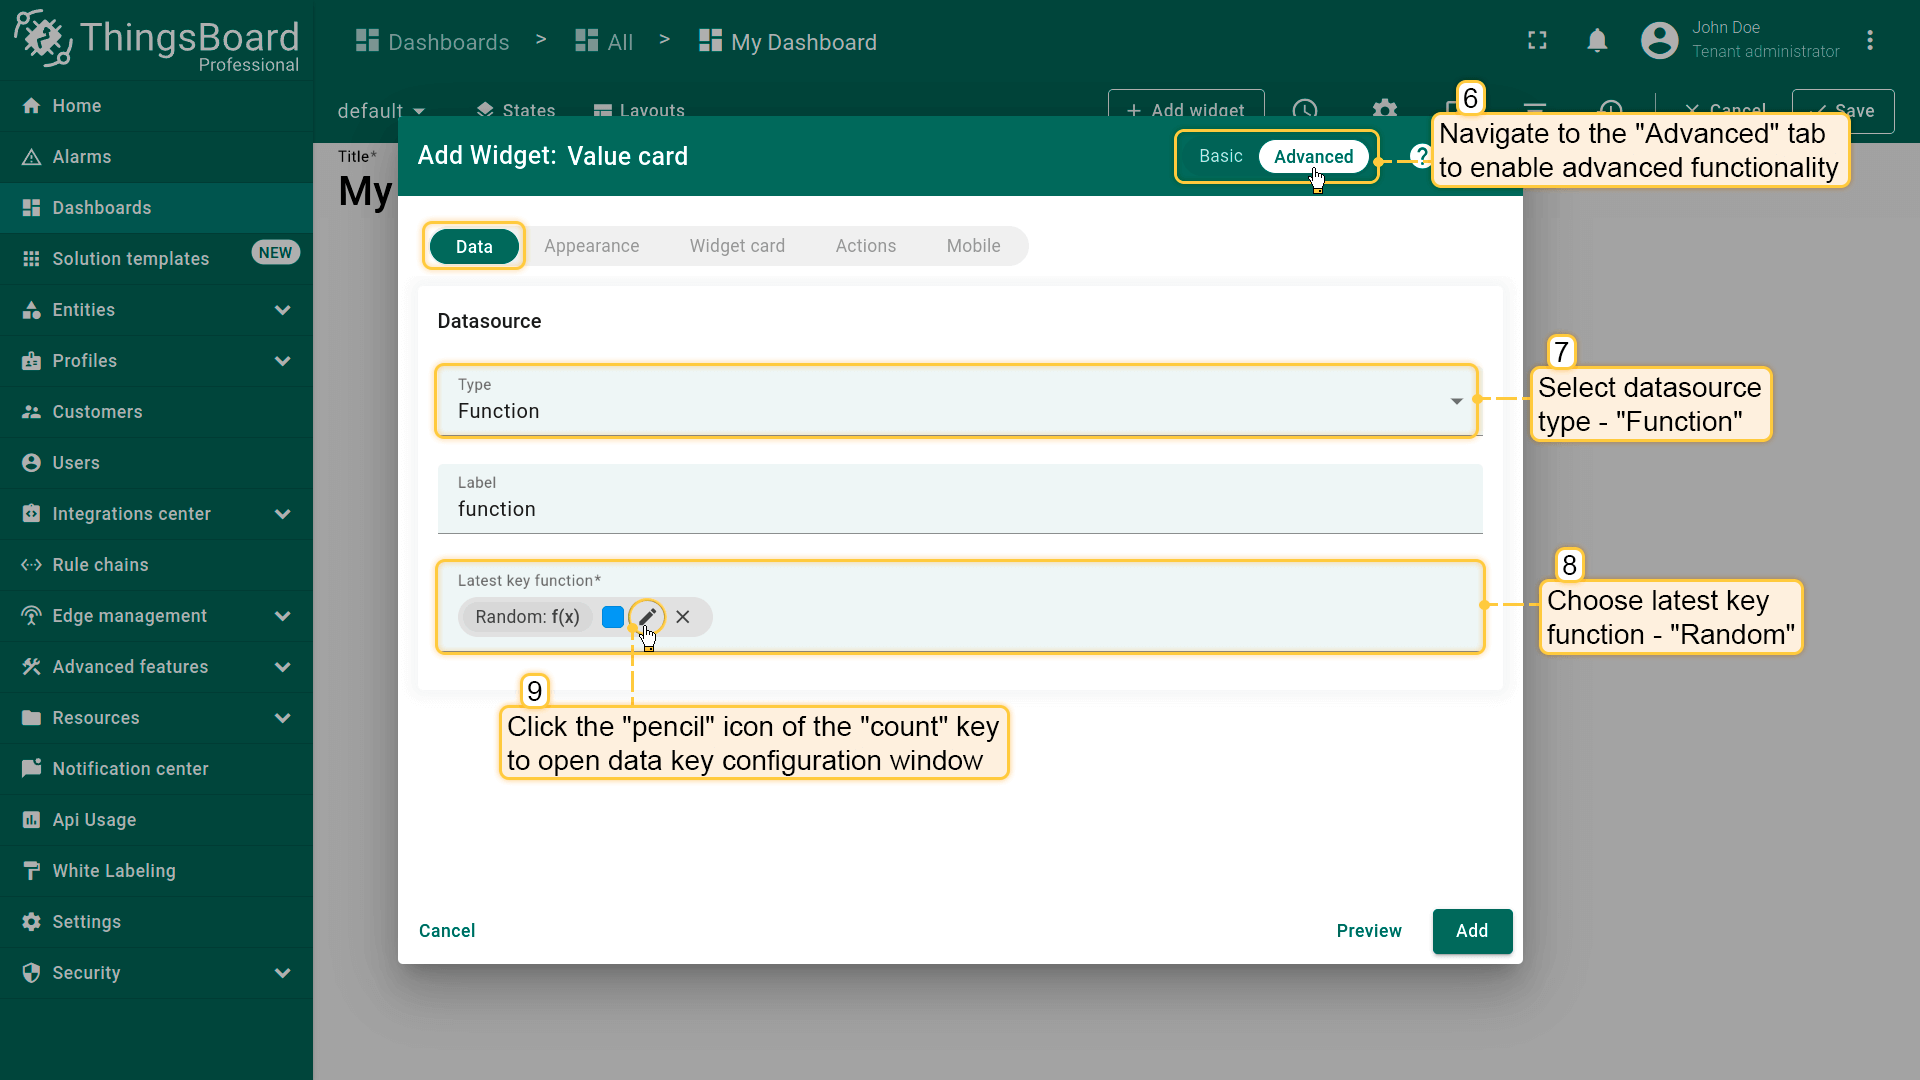
- The "Add Widget" dialog window will open. Navigate to the advanced functionality and select data source type - "Random". Then add a function - "Random" and click the "pencil" icon of the "Random" key to open data key configuration window;
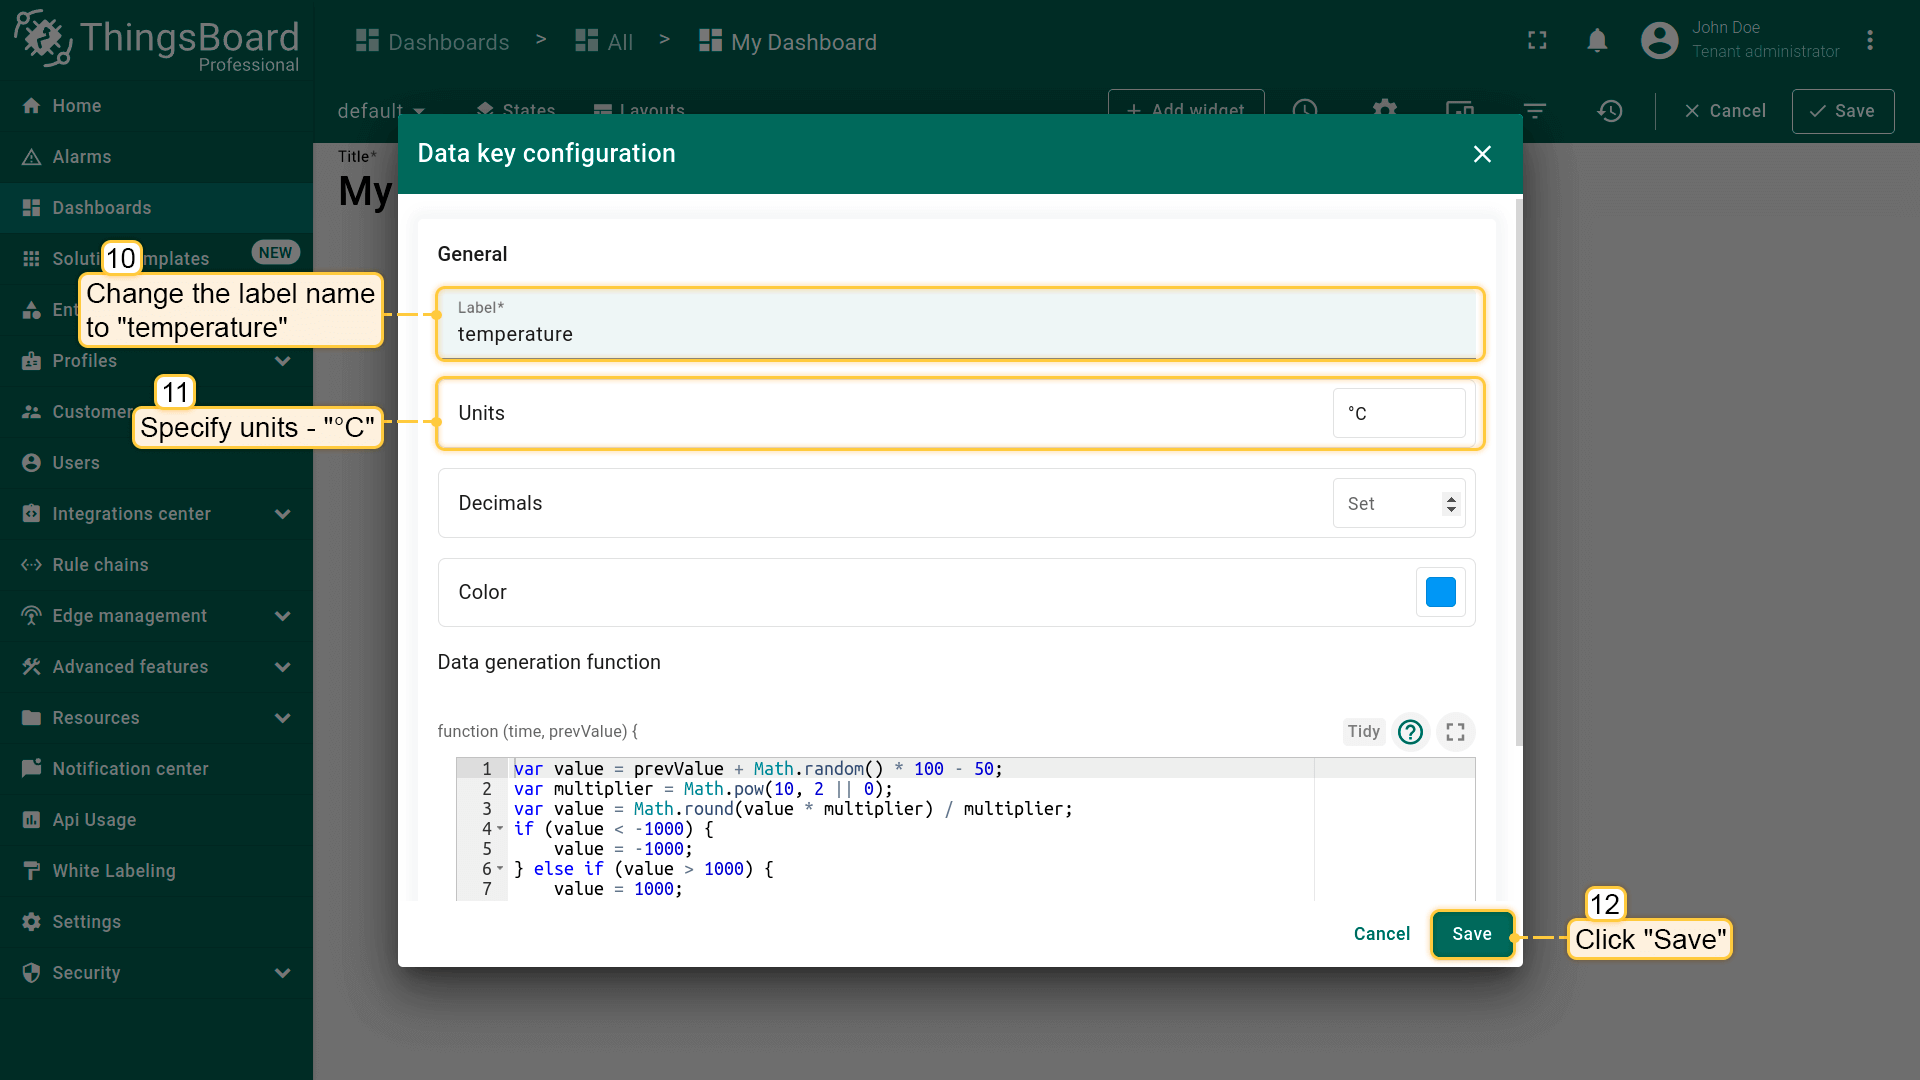
- Change the label name to "temperature" and specify units. Click "Save";
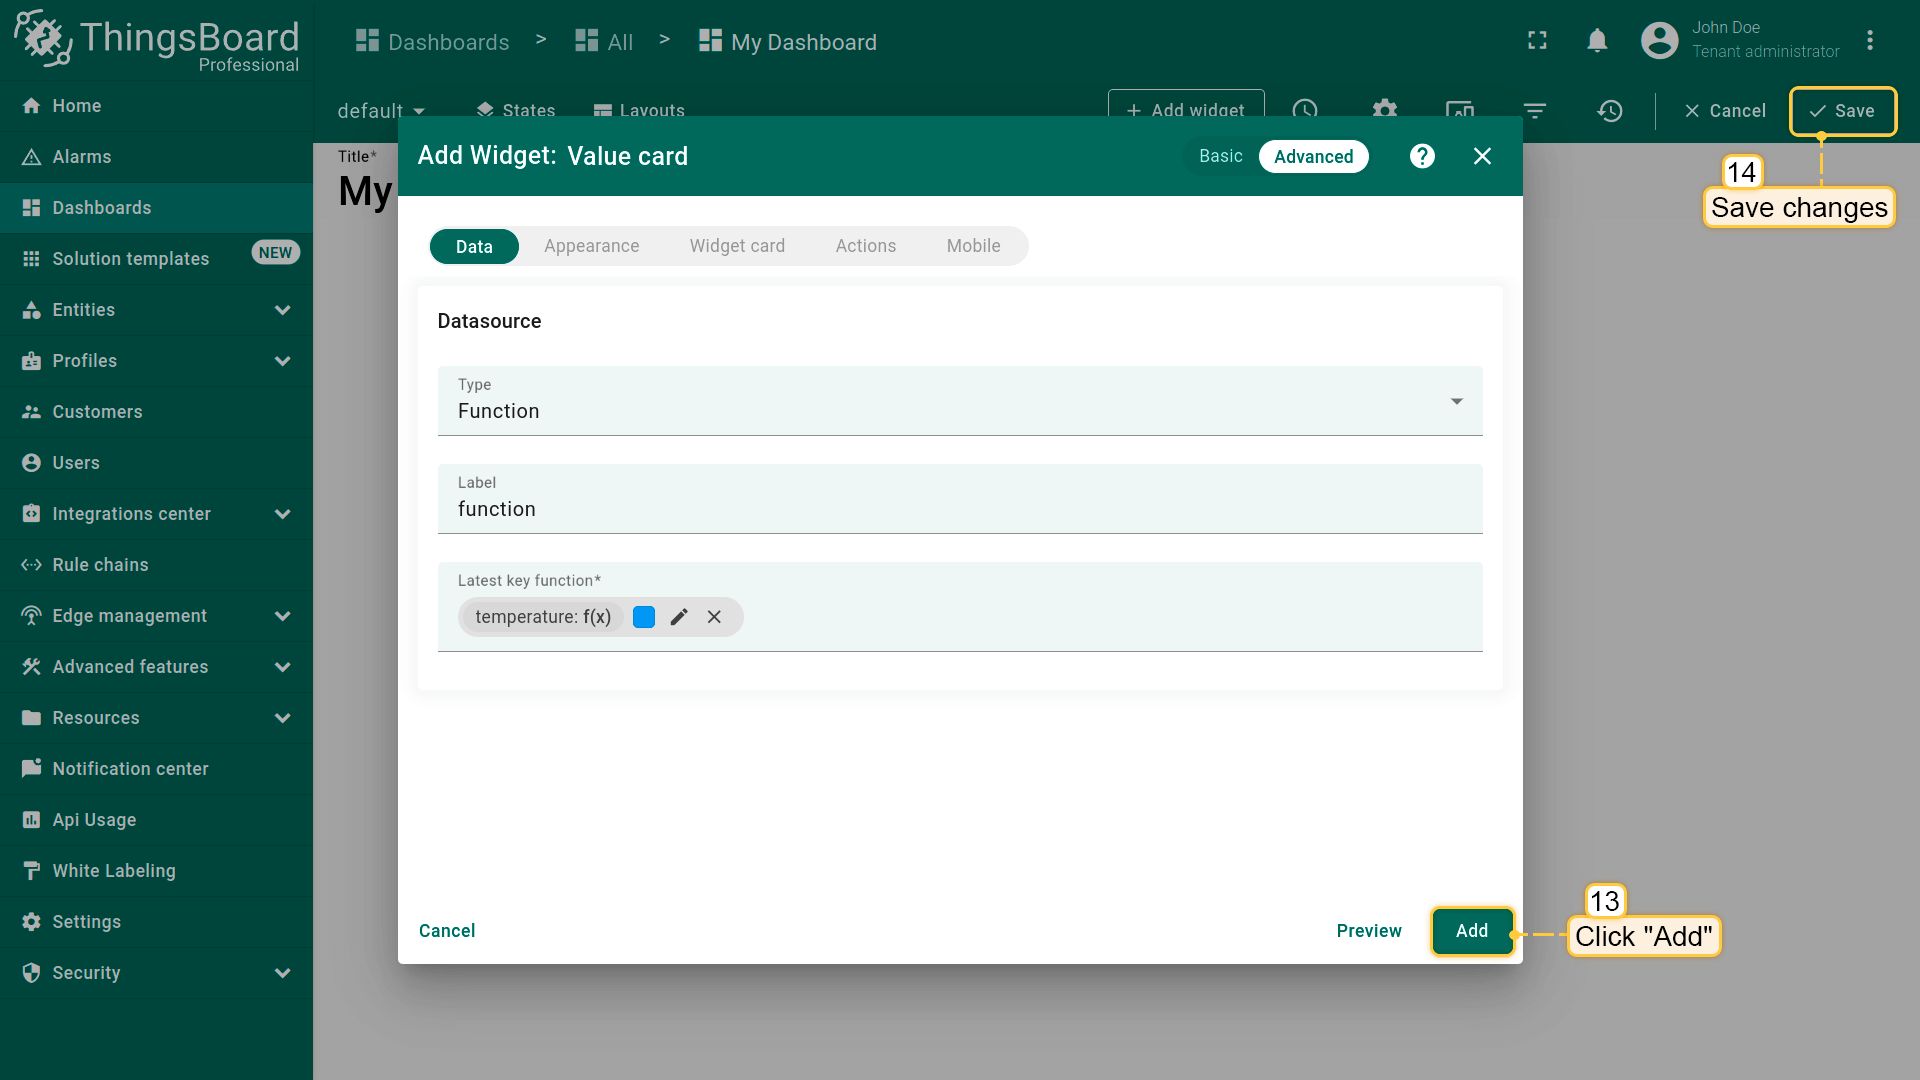
- Click "Add" and save all changes;
- Created the value card widget which displays random value.
实体数量
显示匹配别名/过滤器的实体数量(如设备总数)。
示例:在数值卡片上显示设备总数。
- Open your dashboard and enter edit mode. Then click the "+ Add widget" icon at the top of the screen, or (if this is your first widget on this dashboard) click a large "Add new widget" sign in the middle of the screen to open the "Widgets bundle” dialog window;
- Select a "Cards" widget bundle;
- Then select a "Value card" widget;
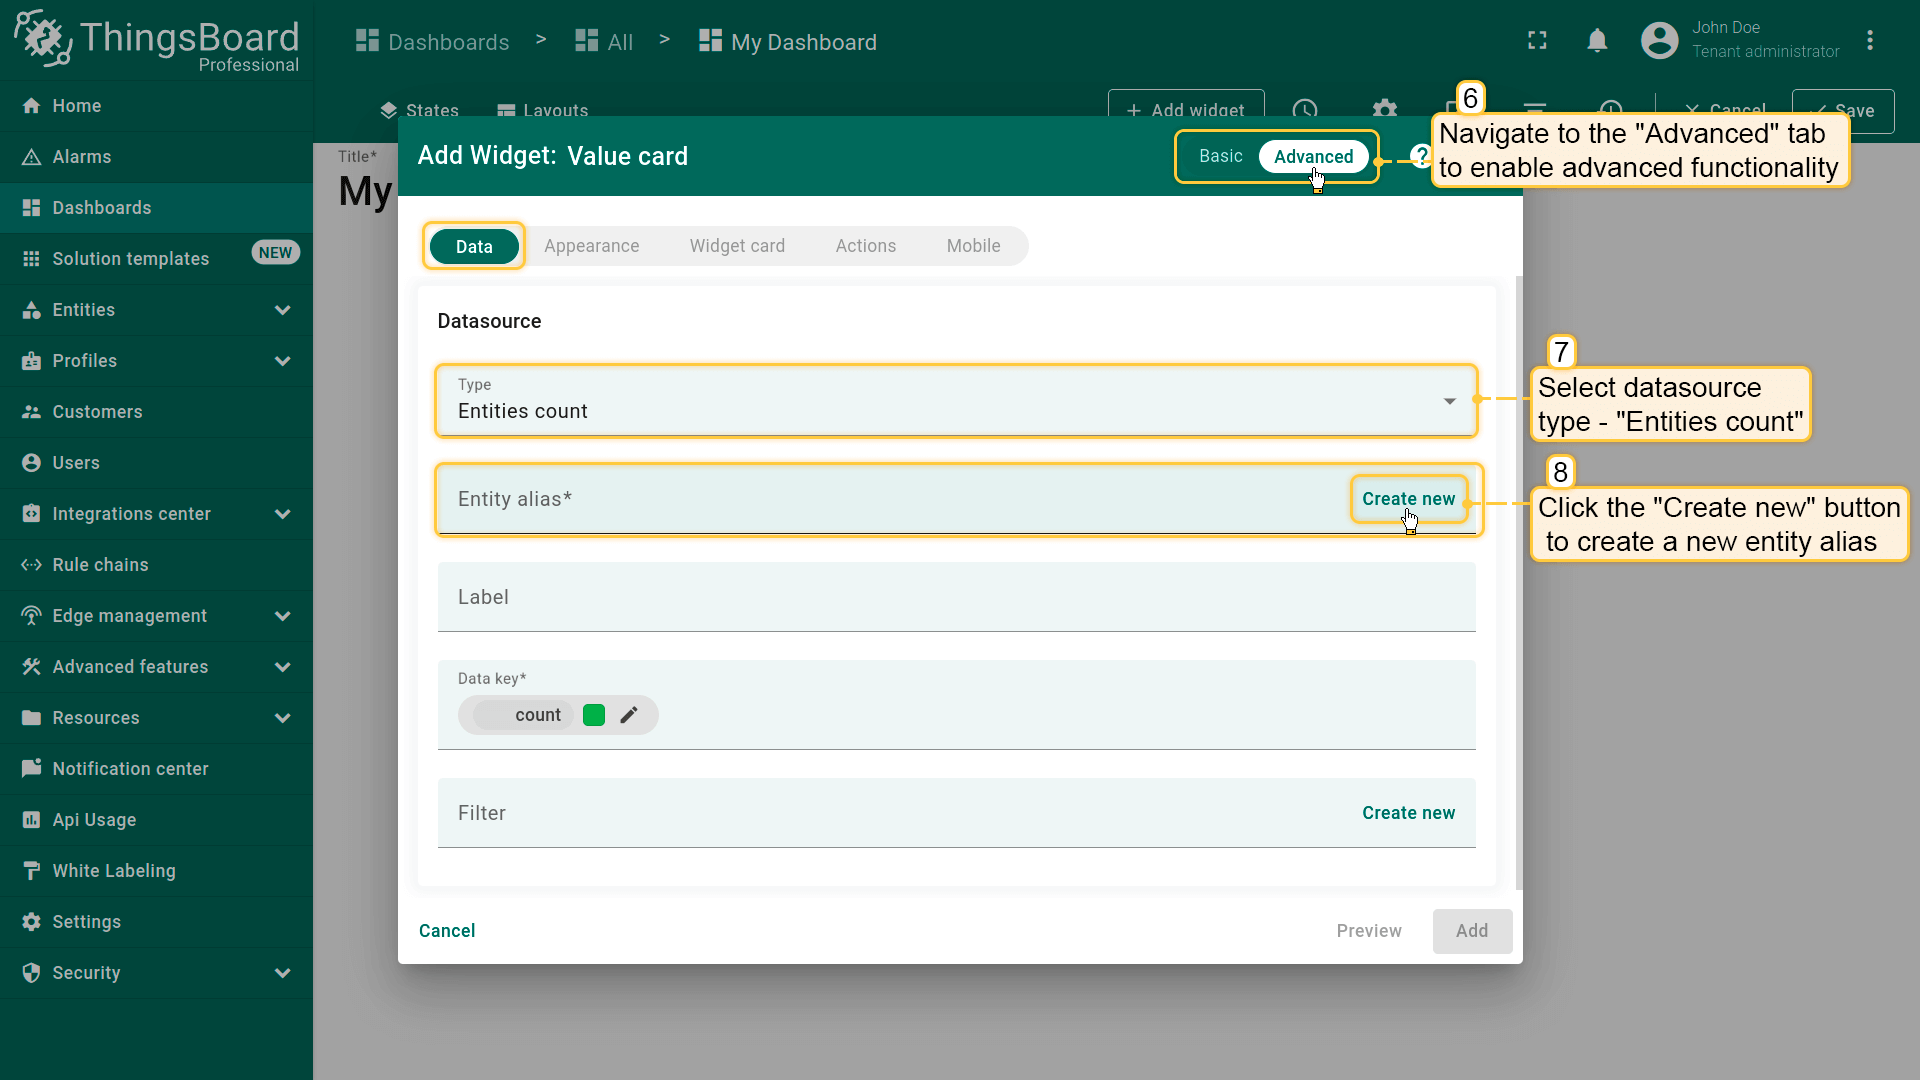
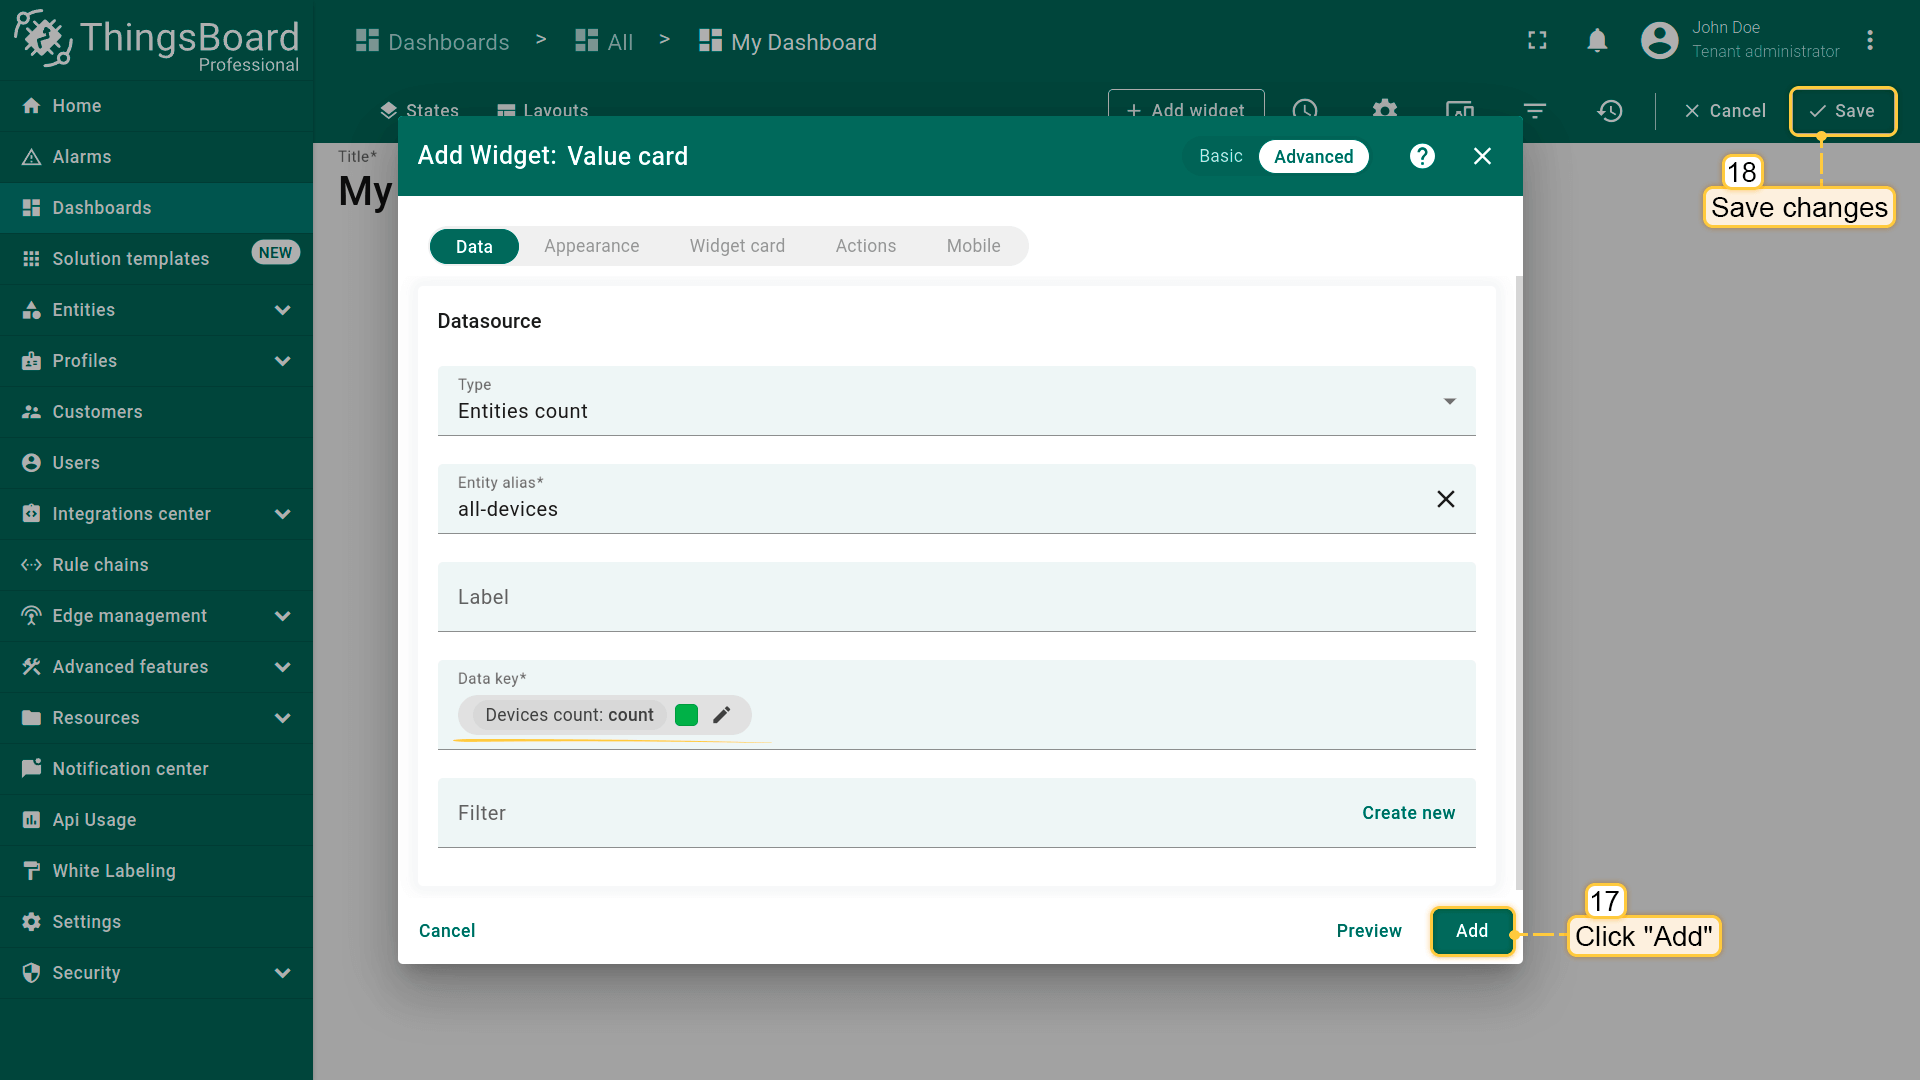
- The "Add Widget" dialog window will open. Go to the advanced functionality and select data source type - "Entities count". Now, we need create new entity alias. Click "Create new" button in the entity alias row;
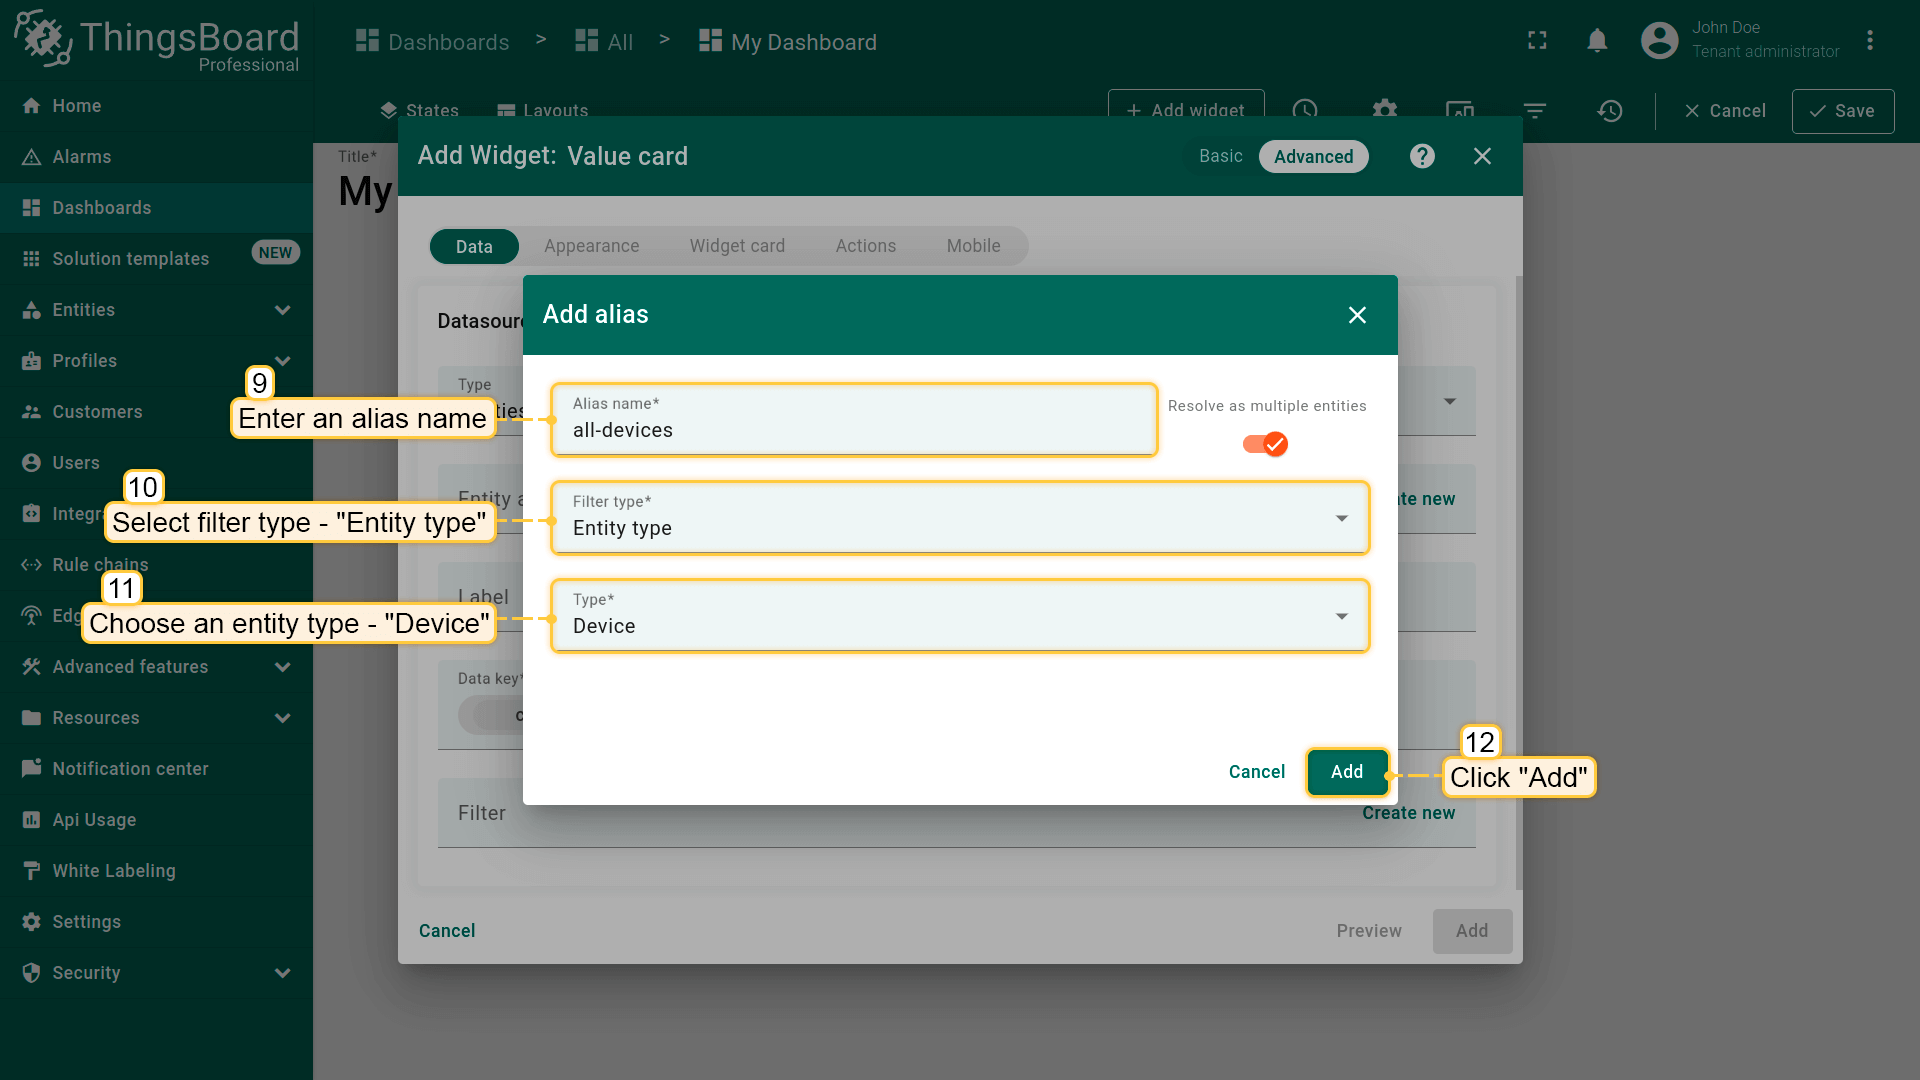
- In the opened Add alias dialog, enter an alias name, select filter type - "Entity type", and choose an entity type - "Device". Click "Add";
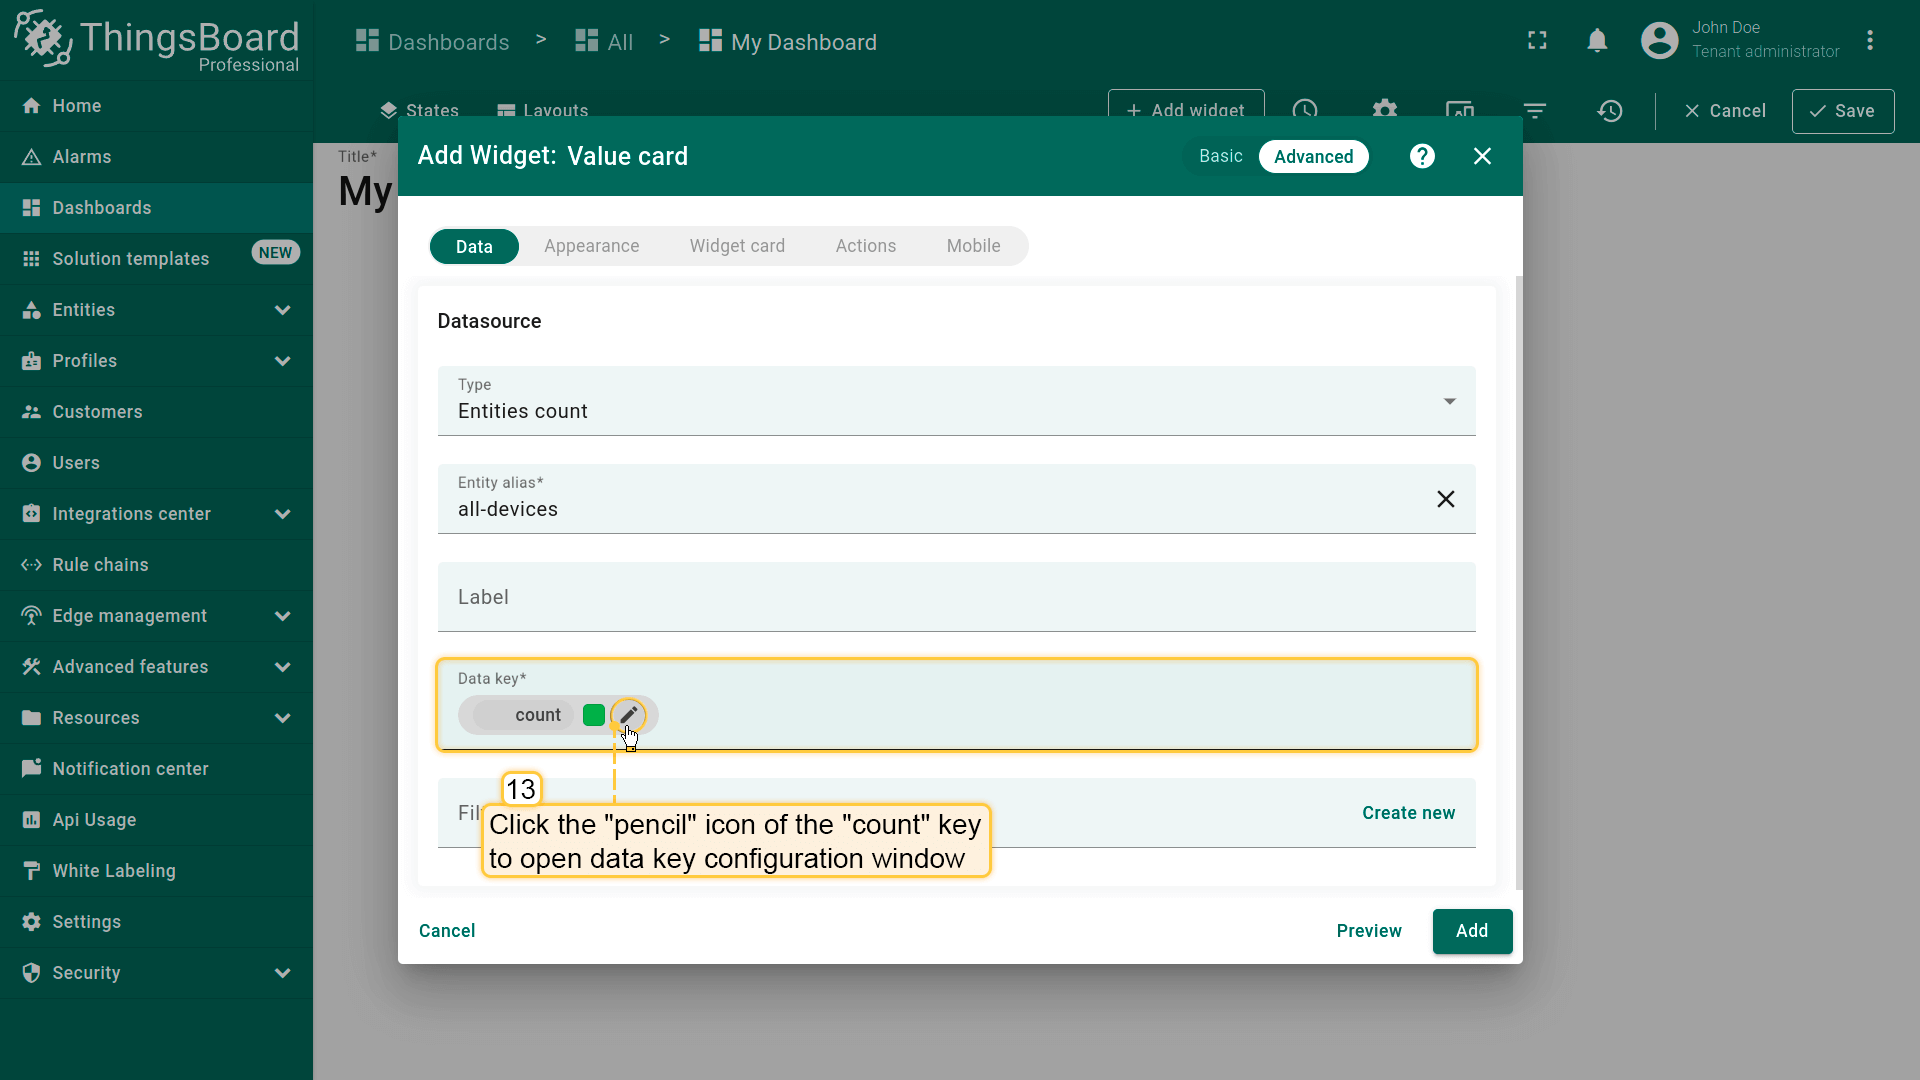
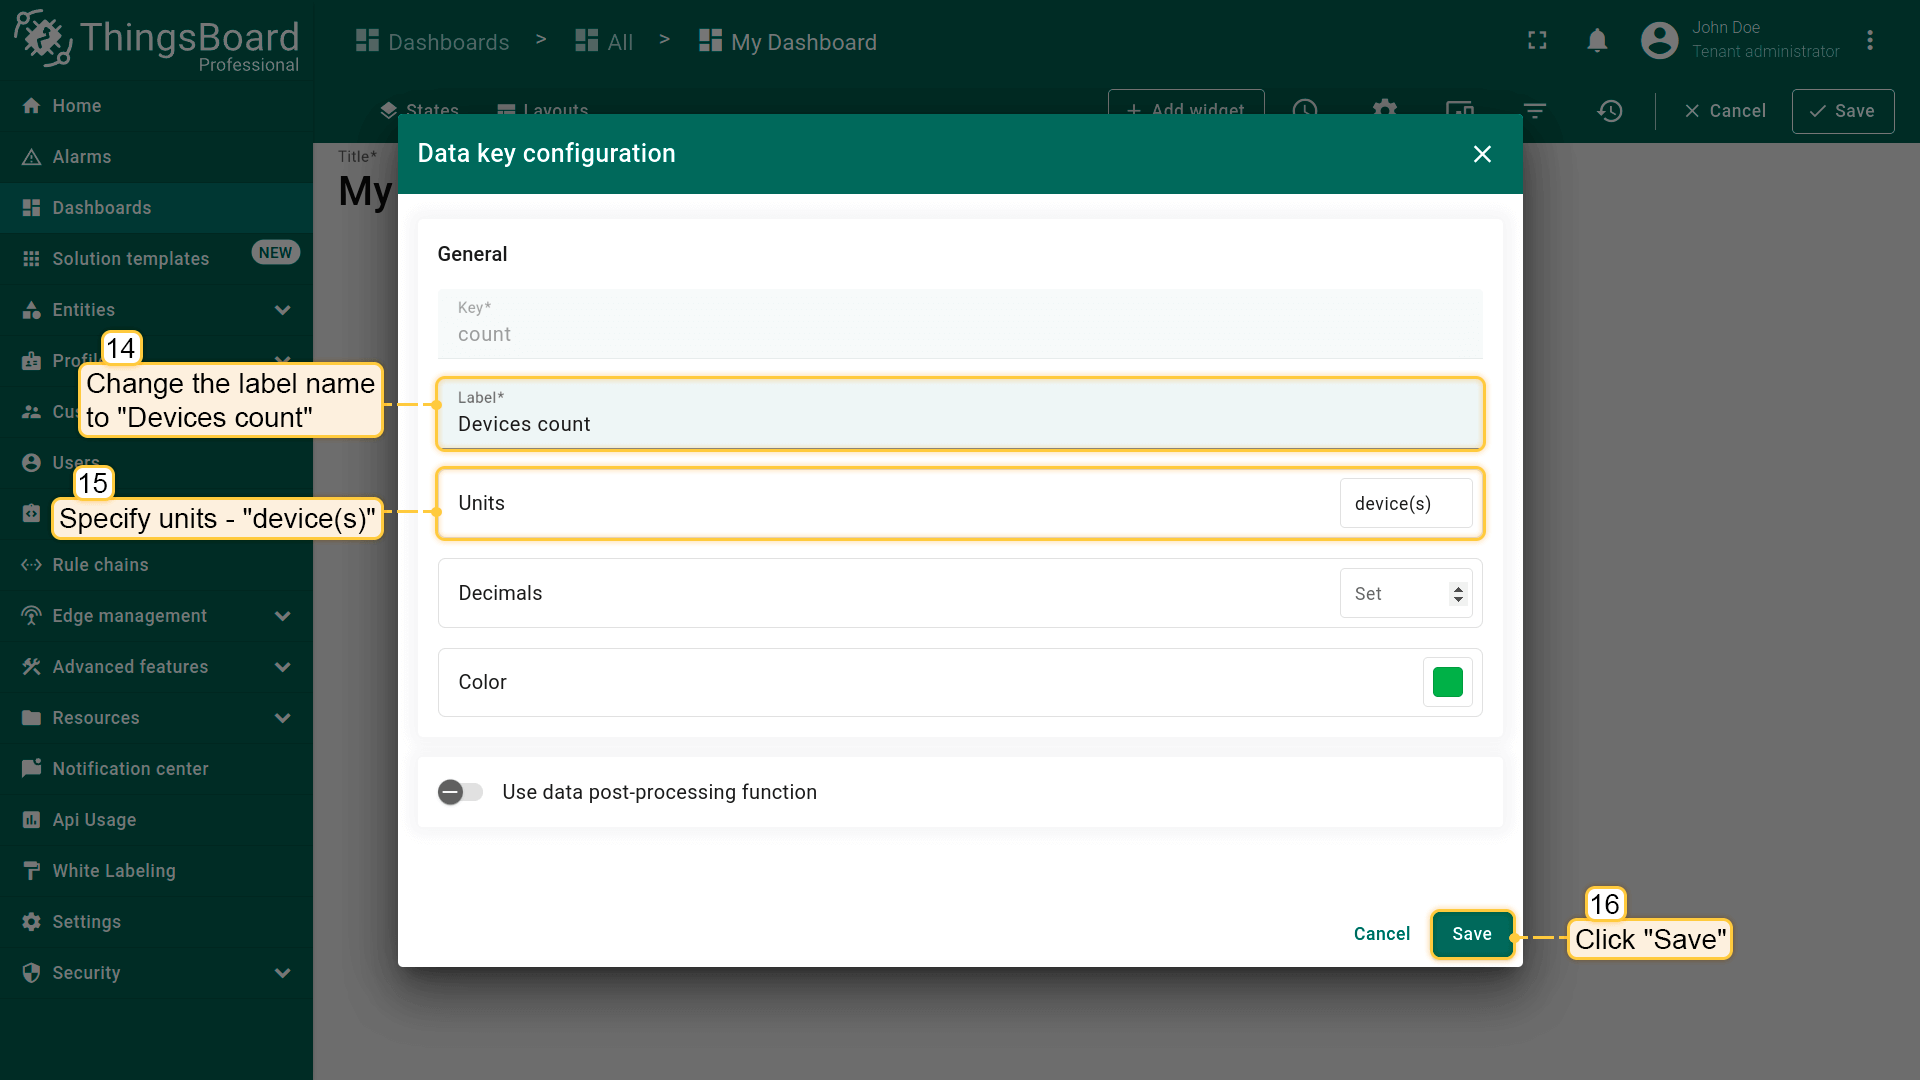
- In the Data key row click the "pencil" icon of the "count" key to open data key configuration window;
- Change label name to "Devices count" and specify units. Click "Save";
- Finally, click "Add" and save all changes;
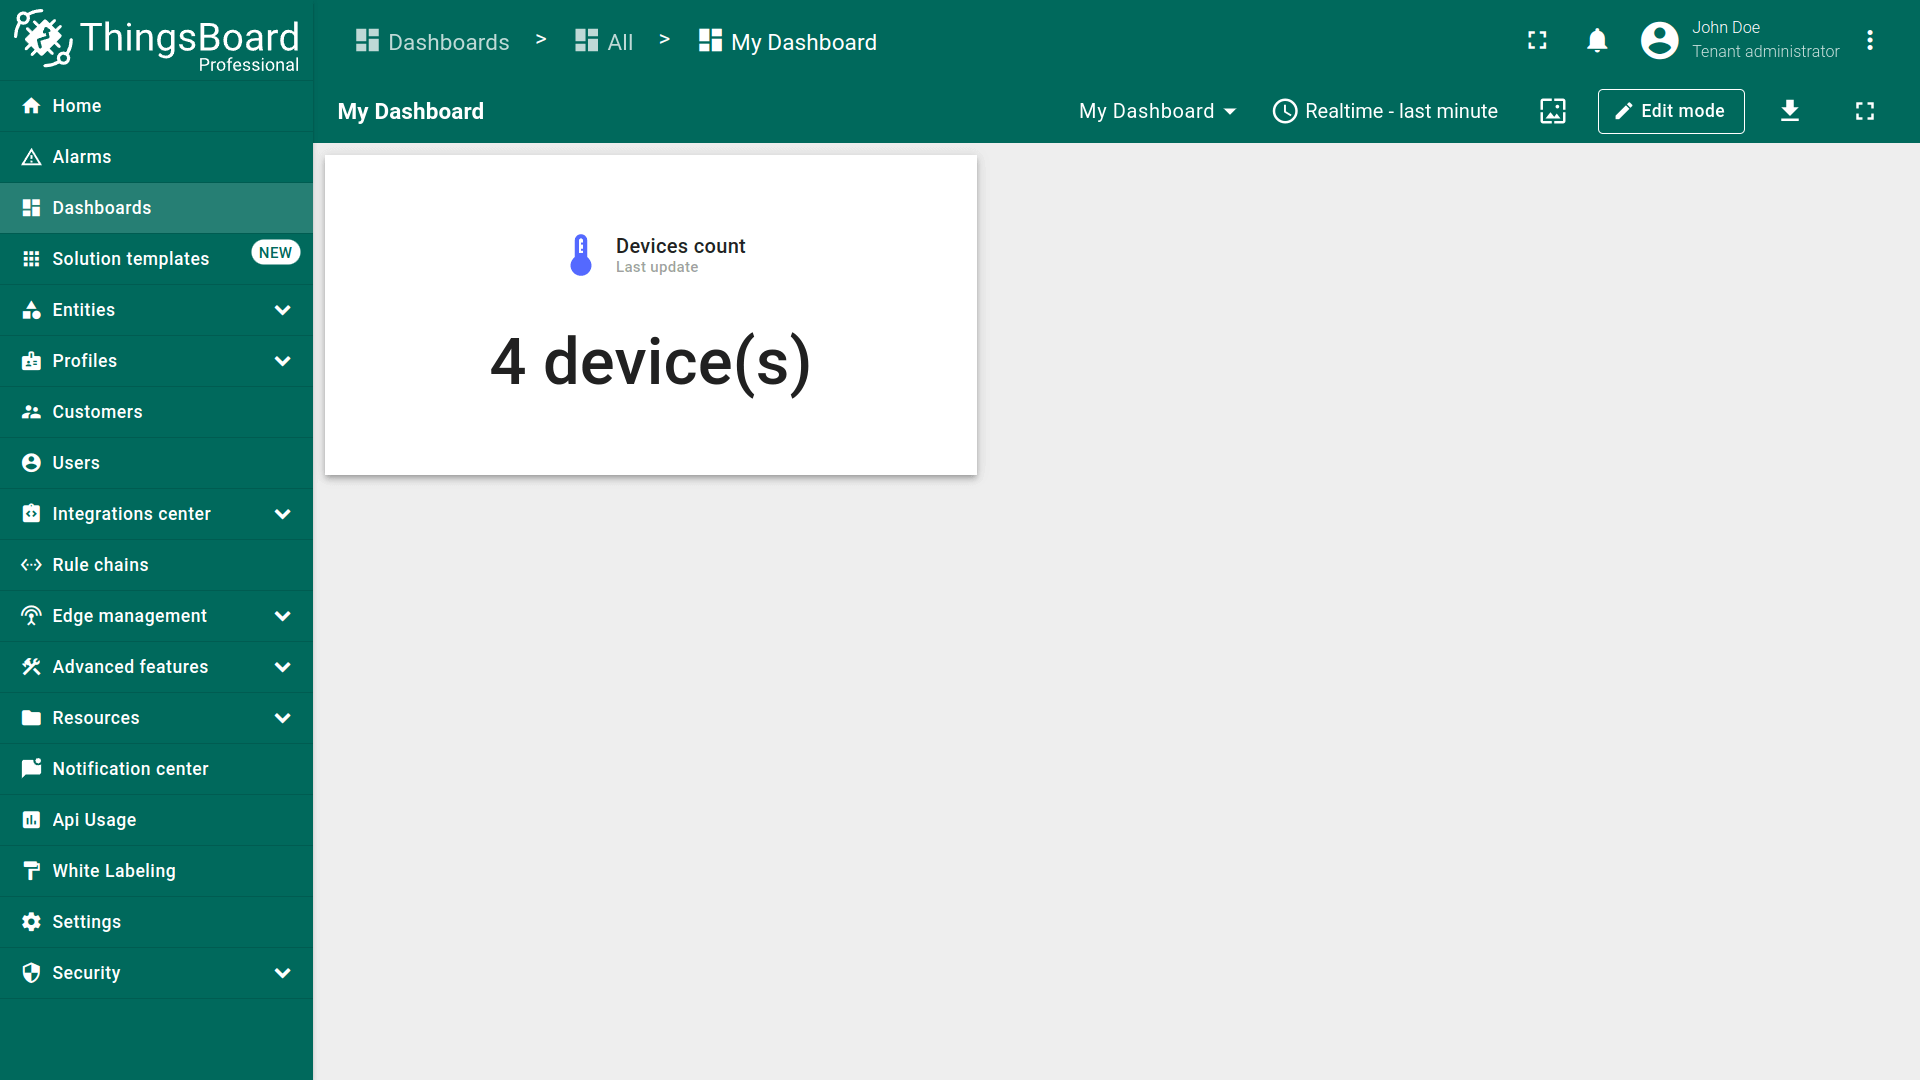
- Now we have a widget that displays the number of existing devices.
告警数量
显示匹配所选别名/过滤器的告警数量(如全部设备告警、严重程度、状态)。
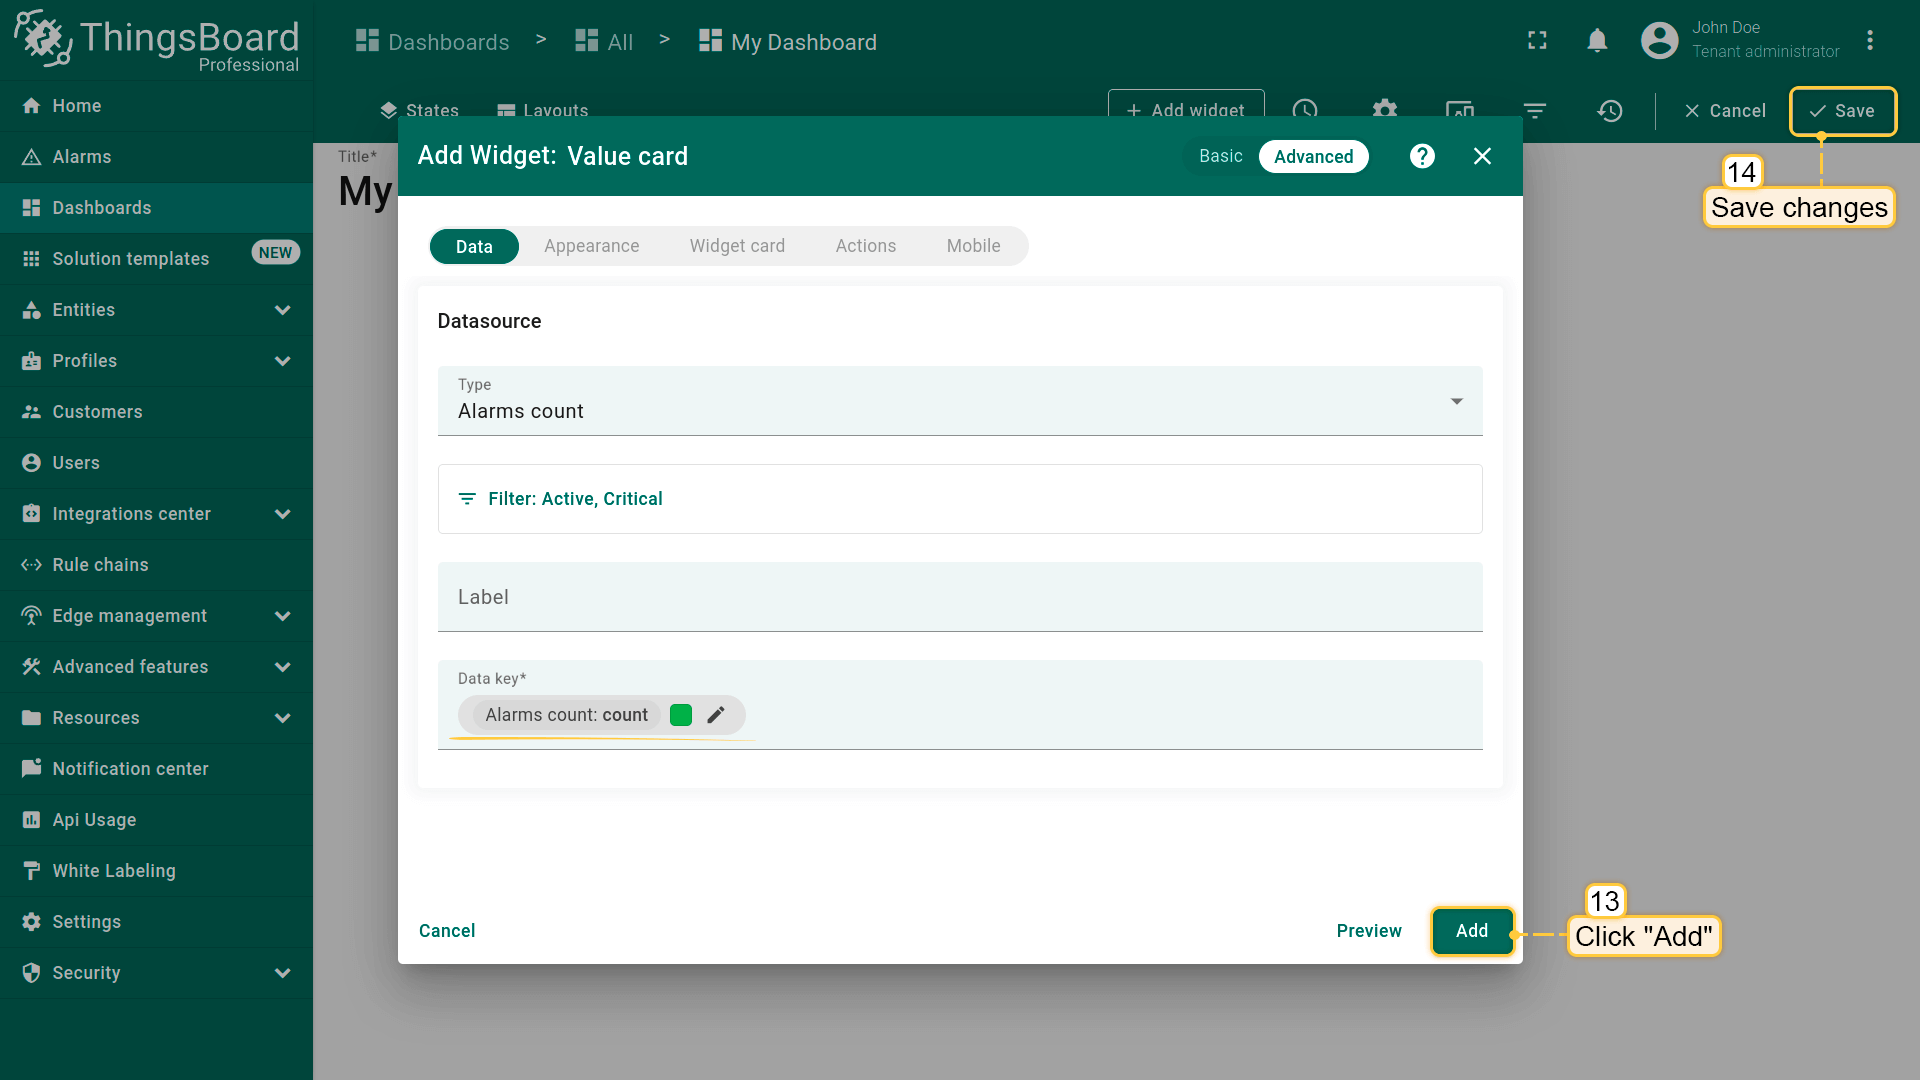
示例:在数值卡片上显示告警总数。
- Open your dashboard and enter edit mode. Then click the "+ Add widget" icon at the top of the screen, or (if this is your first widget on this dashboard) click a large "Add new widget" sign in the middle of the screen to open the "Widgets bundle” dialog window;
- Select "Cards" widget bundle;
- Then select a "Value card" widget;
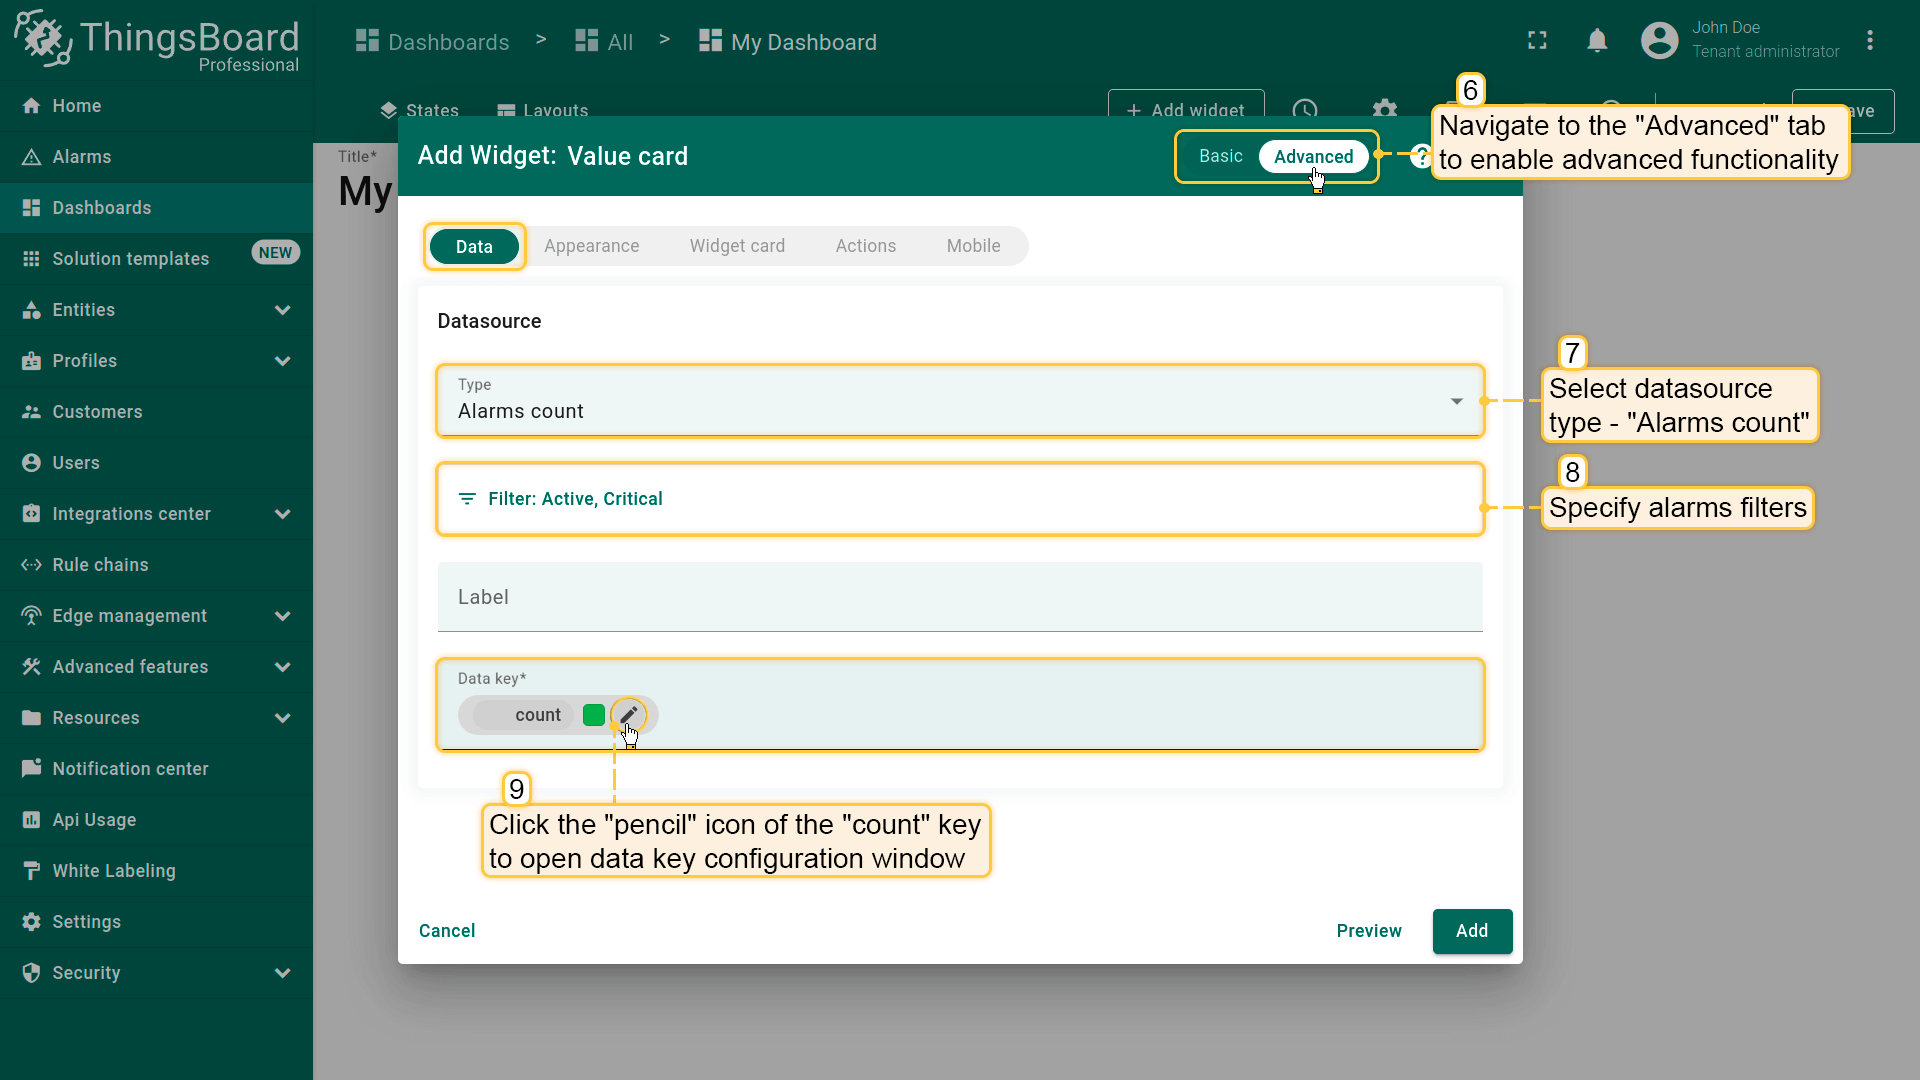
- The "Add Widget" dialog window will open. Go to the advanced functionality, select data source type - "Alarms count" and specify filters. In the Data key row click the "pencil" icon of the "count" key to open data key configuration window;
- Change label name to "Alarms count" and specify units. Click "Save";
- Finally, click "Add" and apply changes;
- Now we have a widget that displays all alarms of existing devices.


数据键(Data keys)
数据键用于标识部件应使用的遥测、属性或实体字段。
键的来源
- Attributes — 所选实体的Client、Server和Shared 属性的并集。若所需属性尚不存在,仍可添加该键;设备上报后部件将显示数据。
- Time series — 设备上报或由规则引擎 / REST API 写入的遥测键。
- Entity fields — 依赖实体类型且可能随版本变化的元数据字段(如created time、entity type、name、type、label)。
数据源的数据键列表取决于部件类型:
- 时序部件 可选择时序数据键;此外可配置时间窗口;
- 最新值部件 可选择时序、属性和实体字段;
- 静态部件与控制部件 不需要数据键;
- 告警部件 可选择全部数据键:时序、属性、实体字段和告警字段,此外可配置时间窗口和告警过滤。
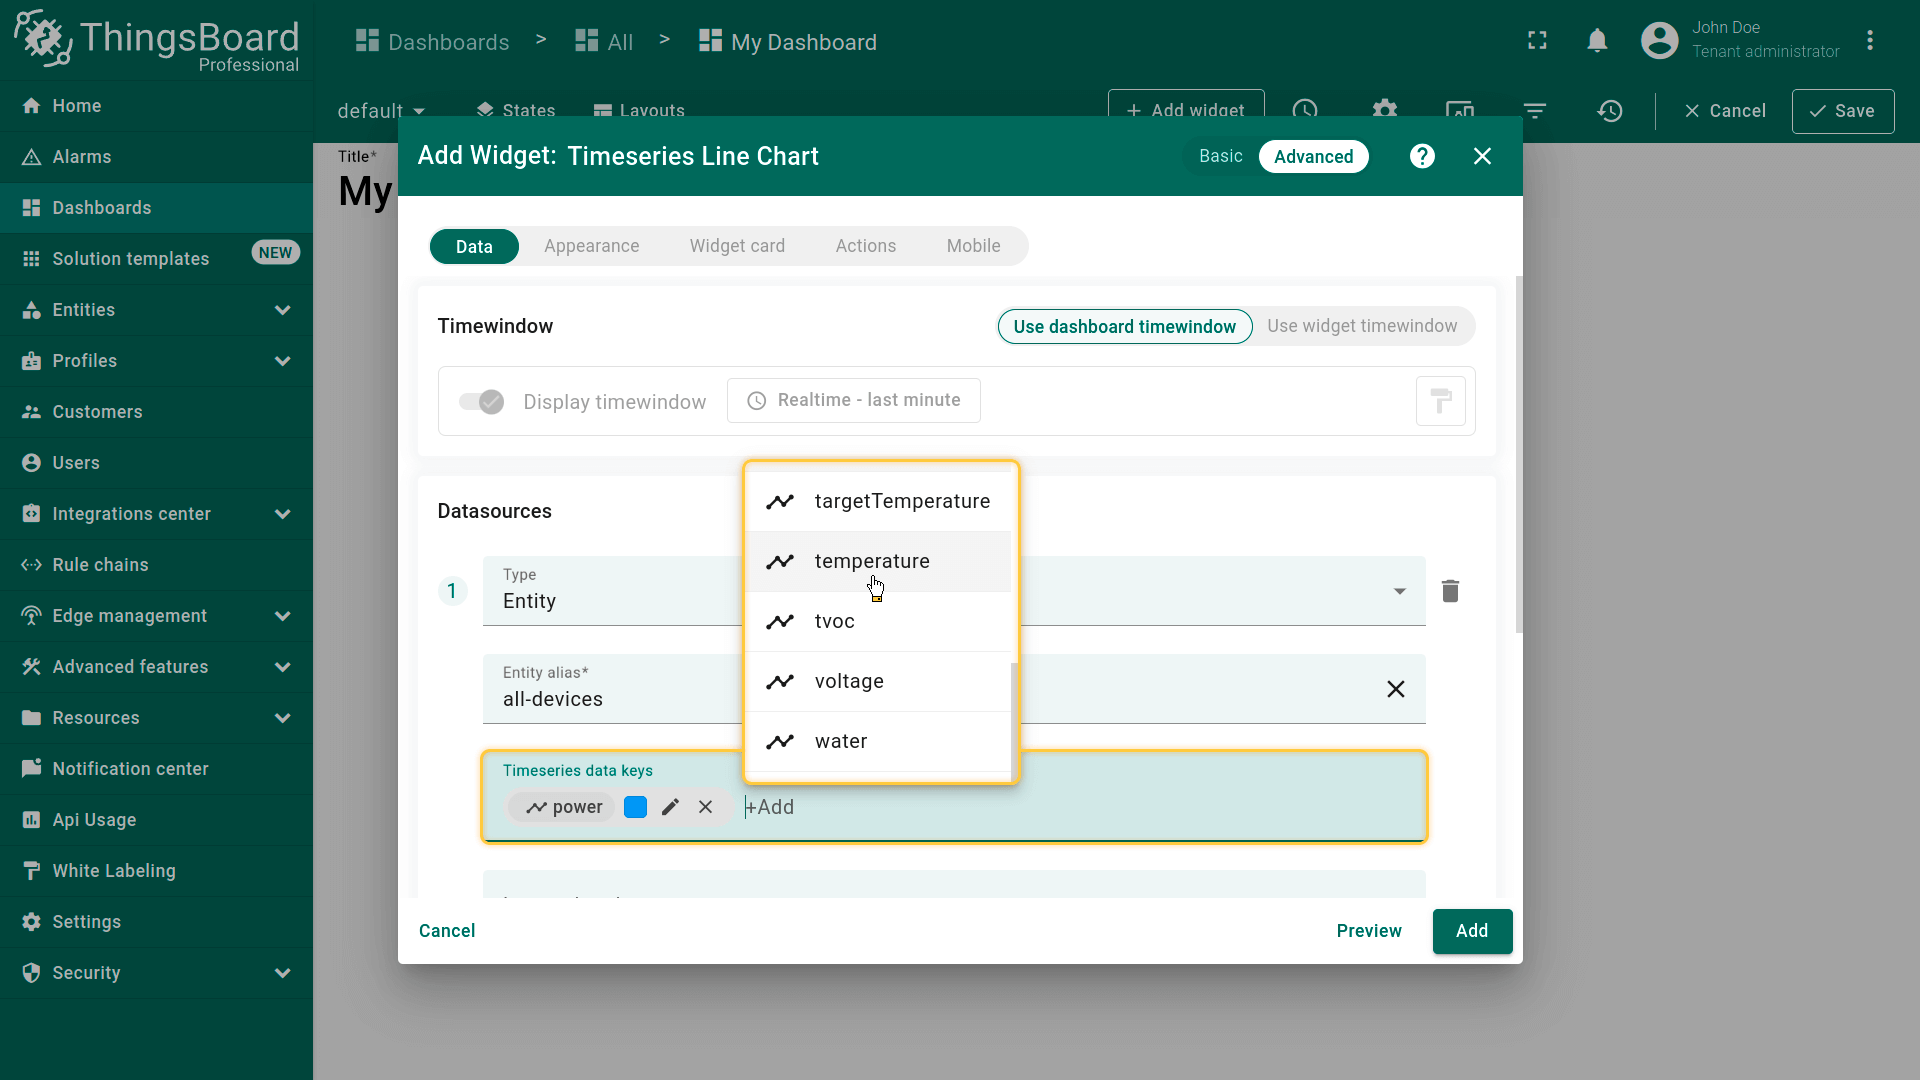
添加键
点击 Data keys 行并从下拉列表选择键。若键尚不存在于数据库中,可输入名称并选择类型(Attribute、Entity field 或 Time series)。数据可用后部件将显示对应值。
配置数据键
数据键可在两种模式下配置:
- General — 基础模式及部件创建时显示的常用选项。
- Advanced — 逐键完整控制;在高级部件设置中点击键旁的铅笔图标可打开。
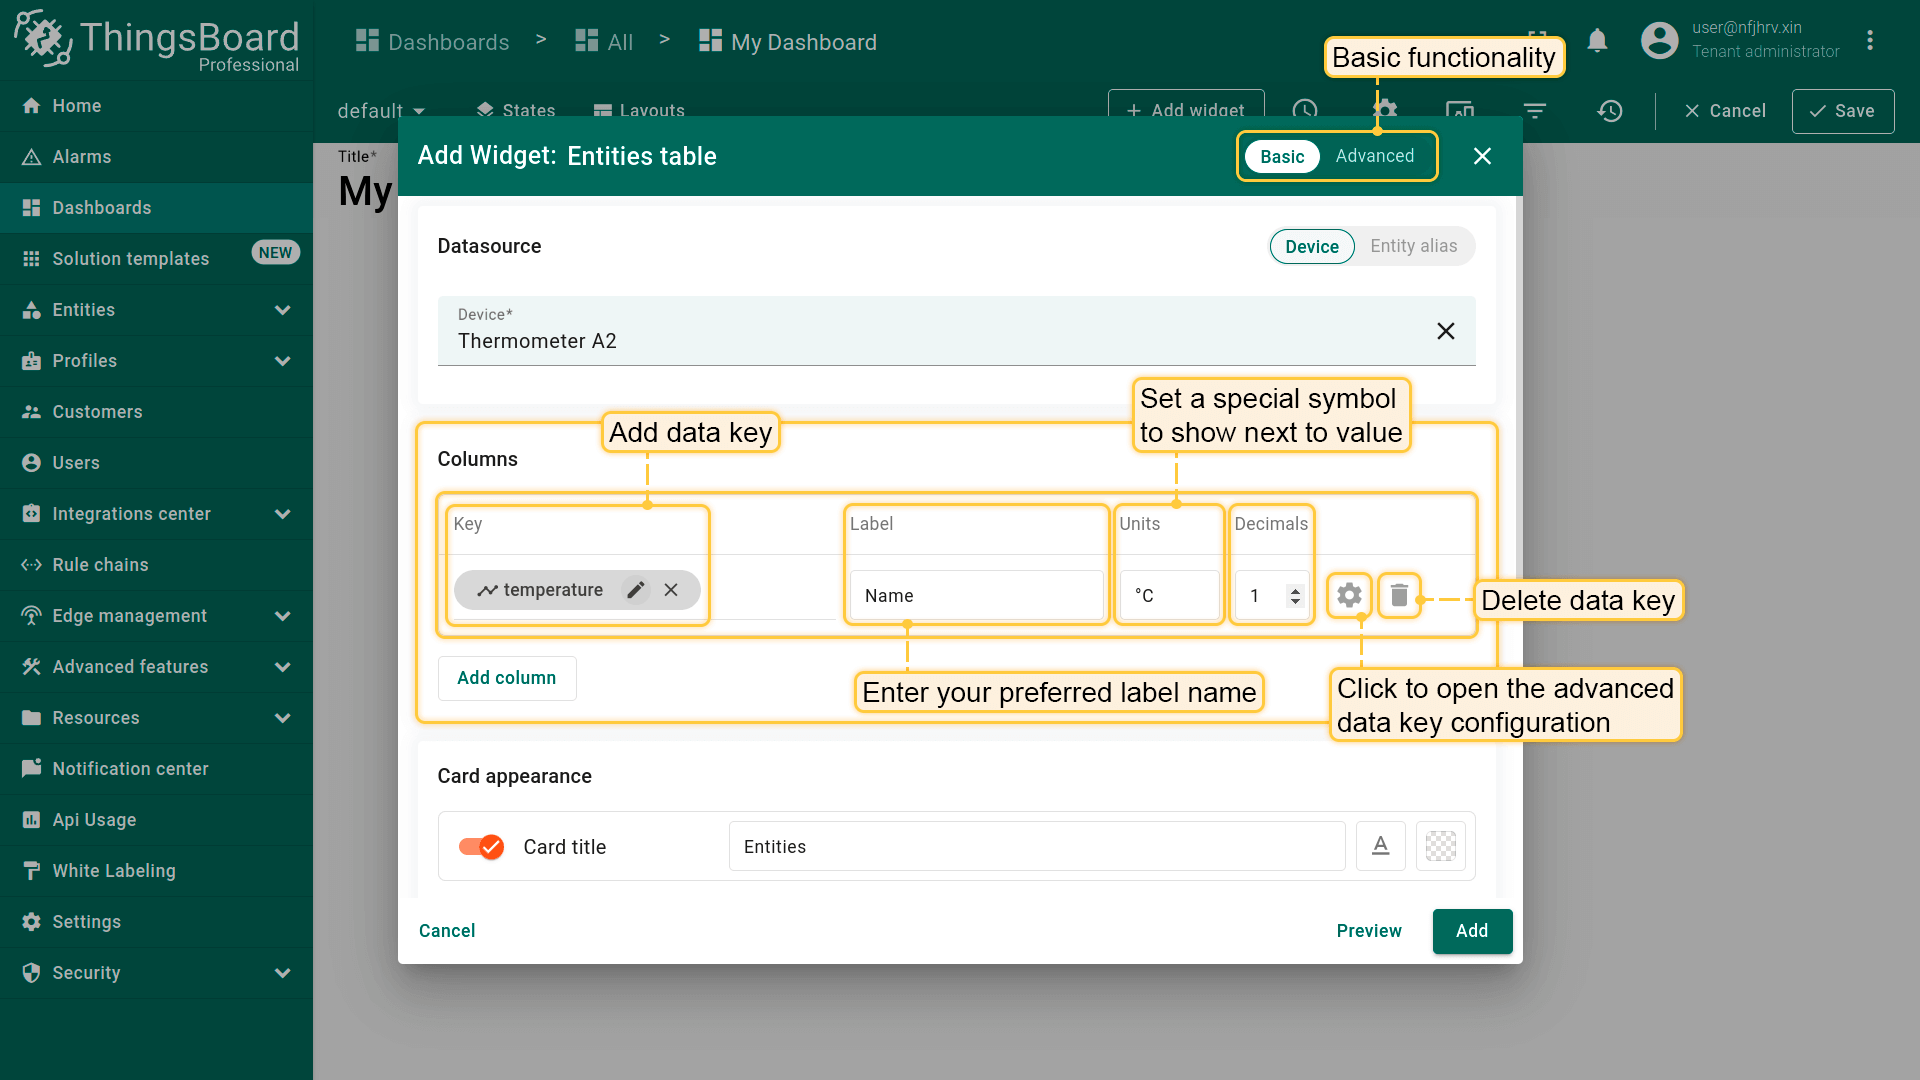
基础选项(因部件而异)
在 Basic 模式下,以下设置会出现在 Add widget 对话框中。
- Key — 指定要显示其数据的键。
- Label — 部件中显示的人类可读名称(如表列标题或图例项)。
- Units — 显示在数值旁的符号或单位。
注意:自ThingsBoard 4.1起,部件支持根据所选单位制进行自动数据转换和单位切换。 - Decimals — 小数点后的位数。
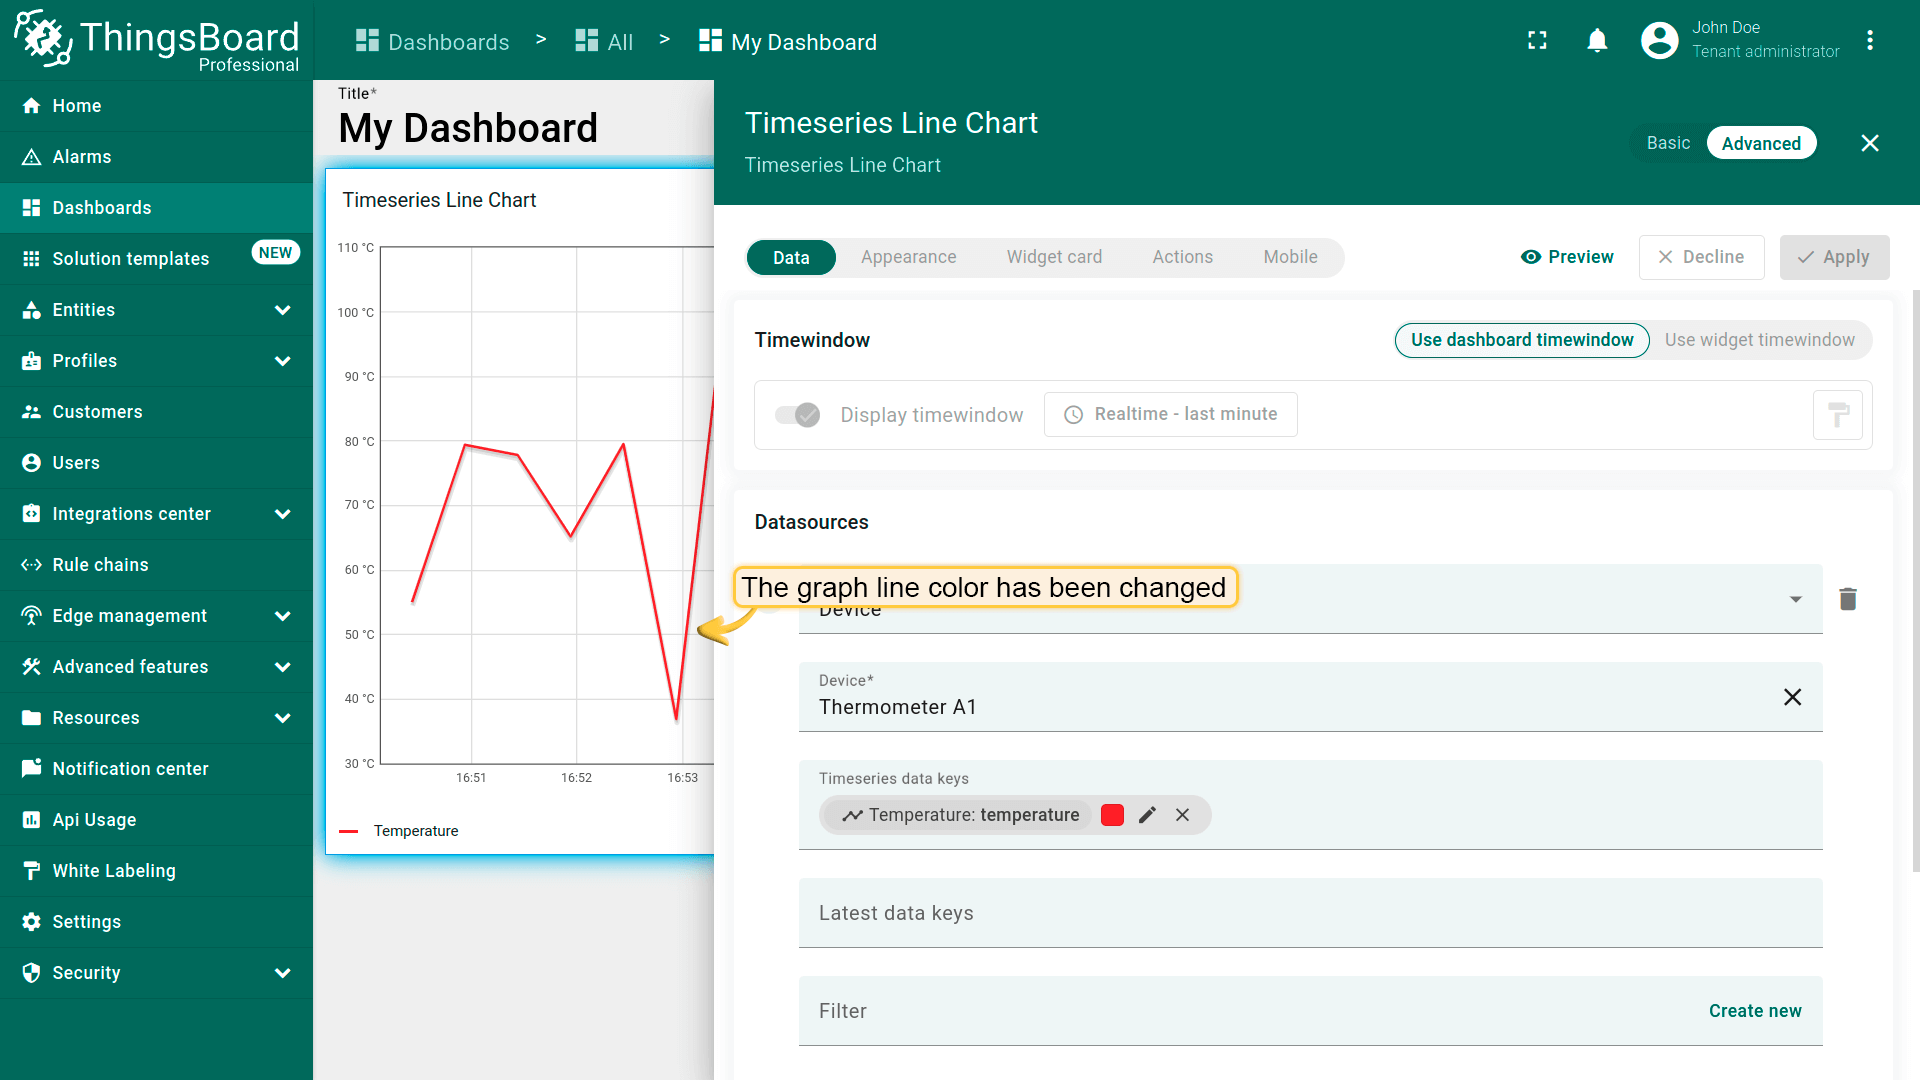
- Color — 多数图表部件用于系列样式。
高级选项
在高级模式中,通过数据键旁的铅笔图标打开设置。
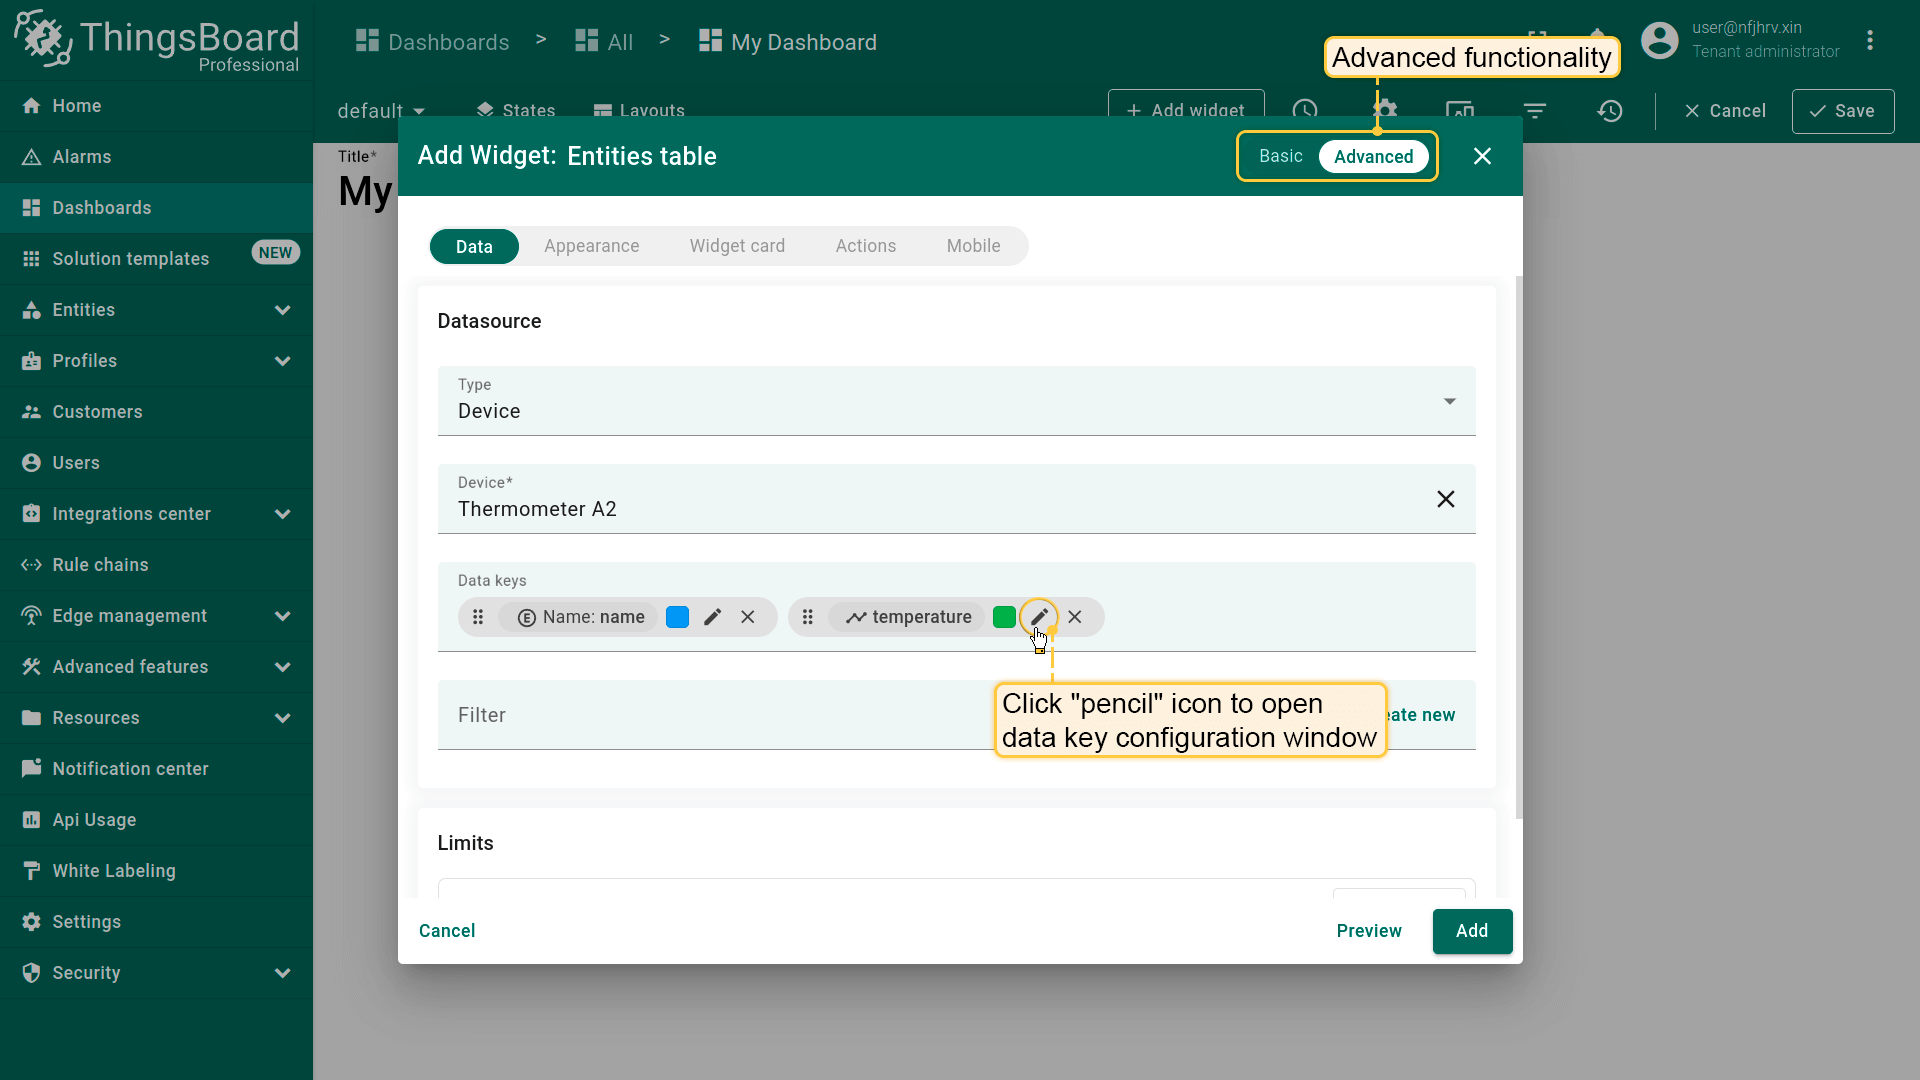
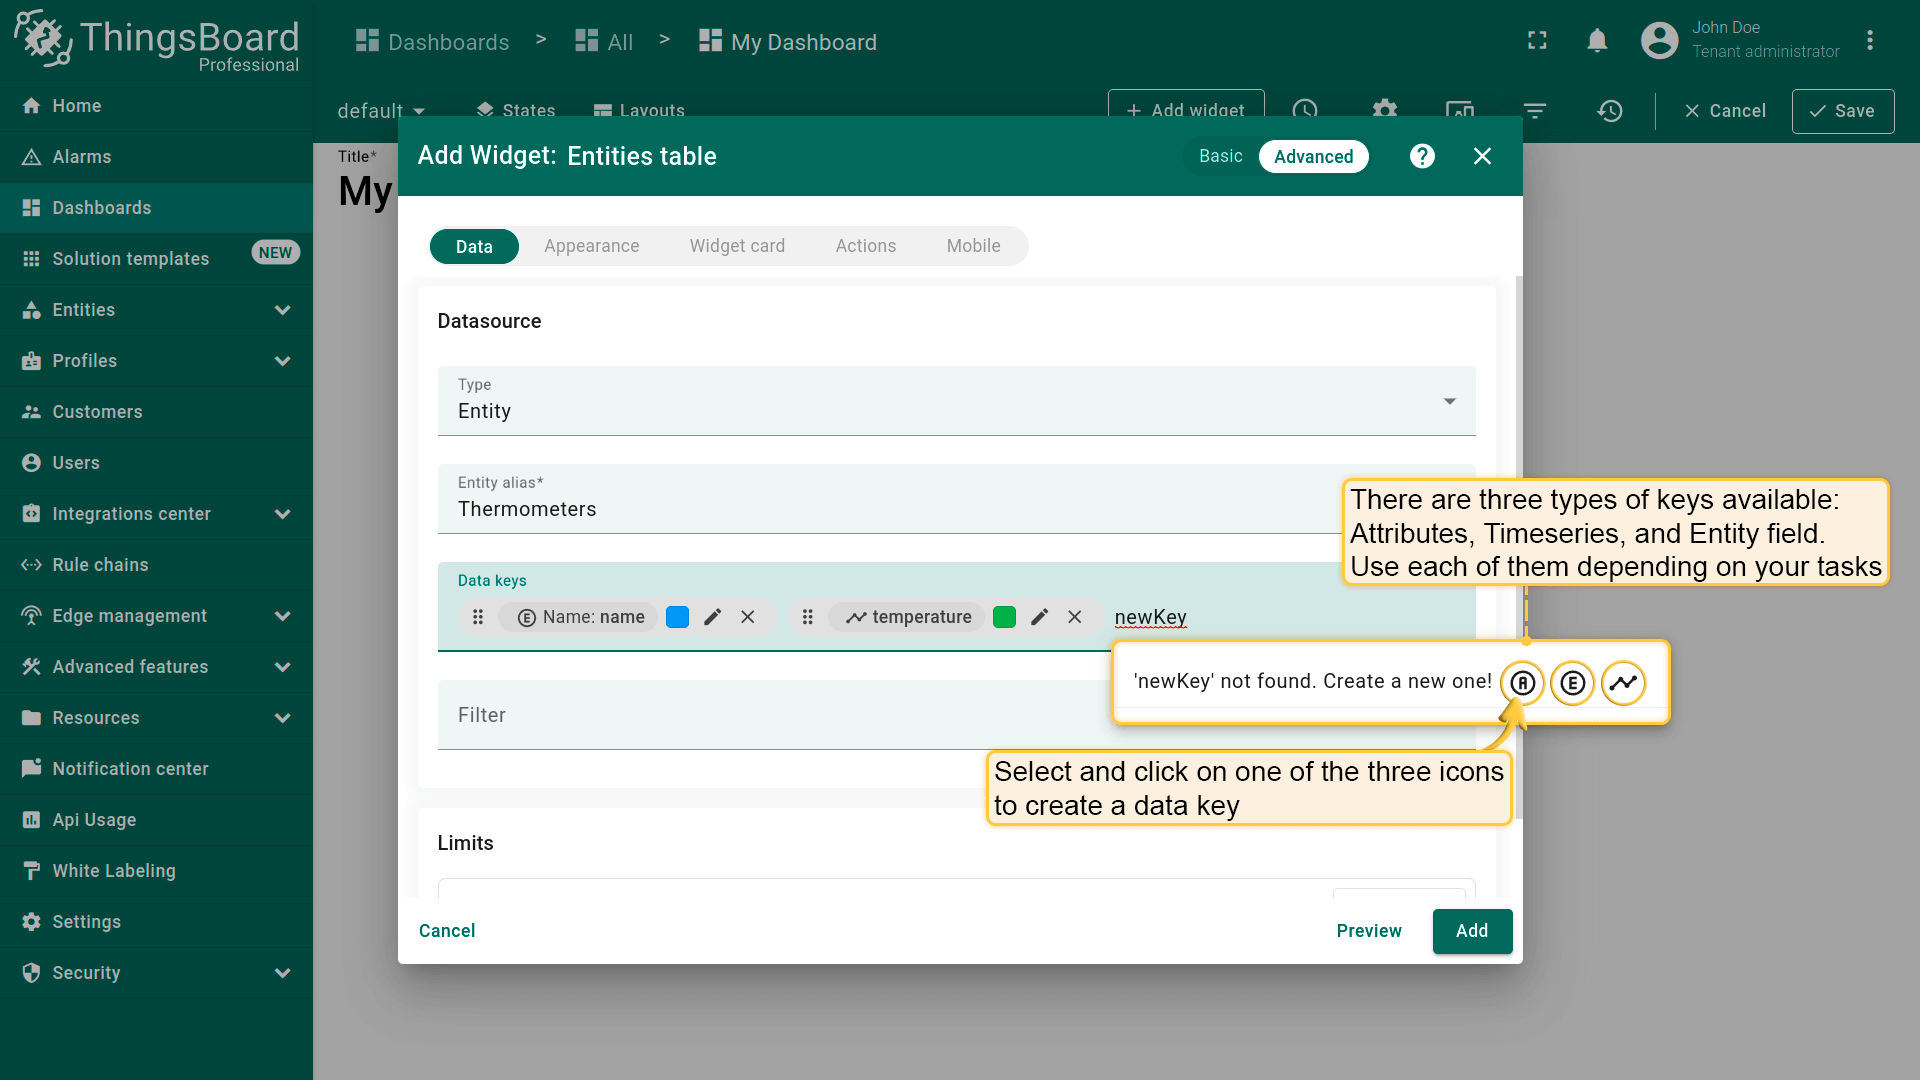
下面以\u201cTables\u201d捆绑包中的\u201cEntities table\u201d部件为例说明基本数据键设置:
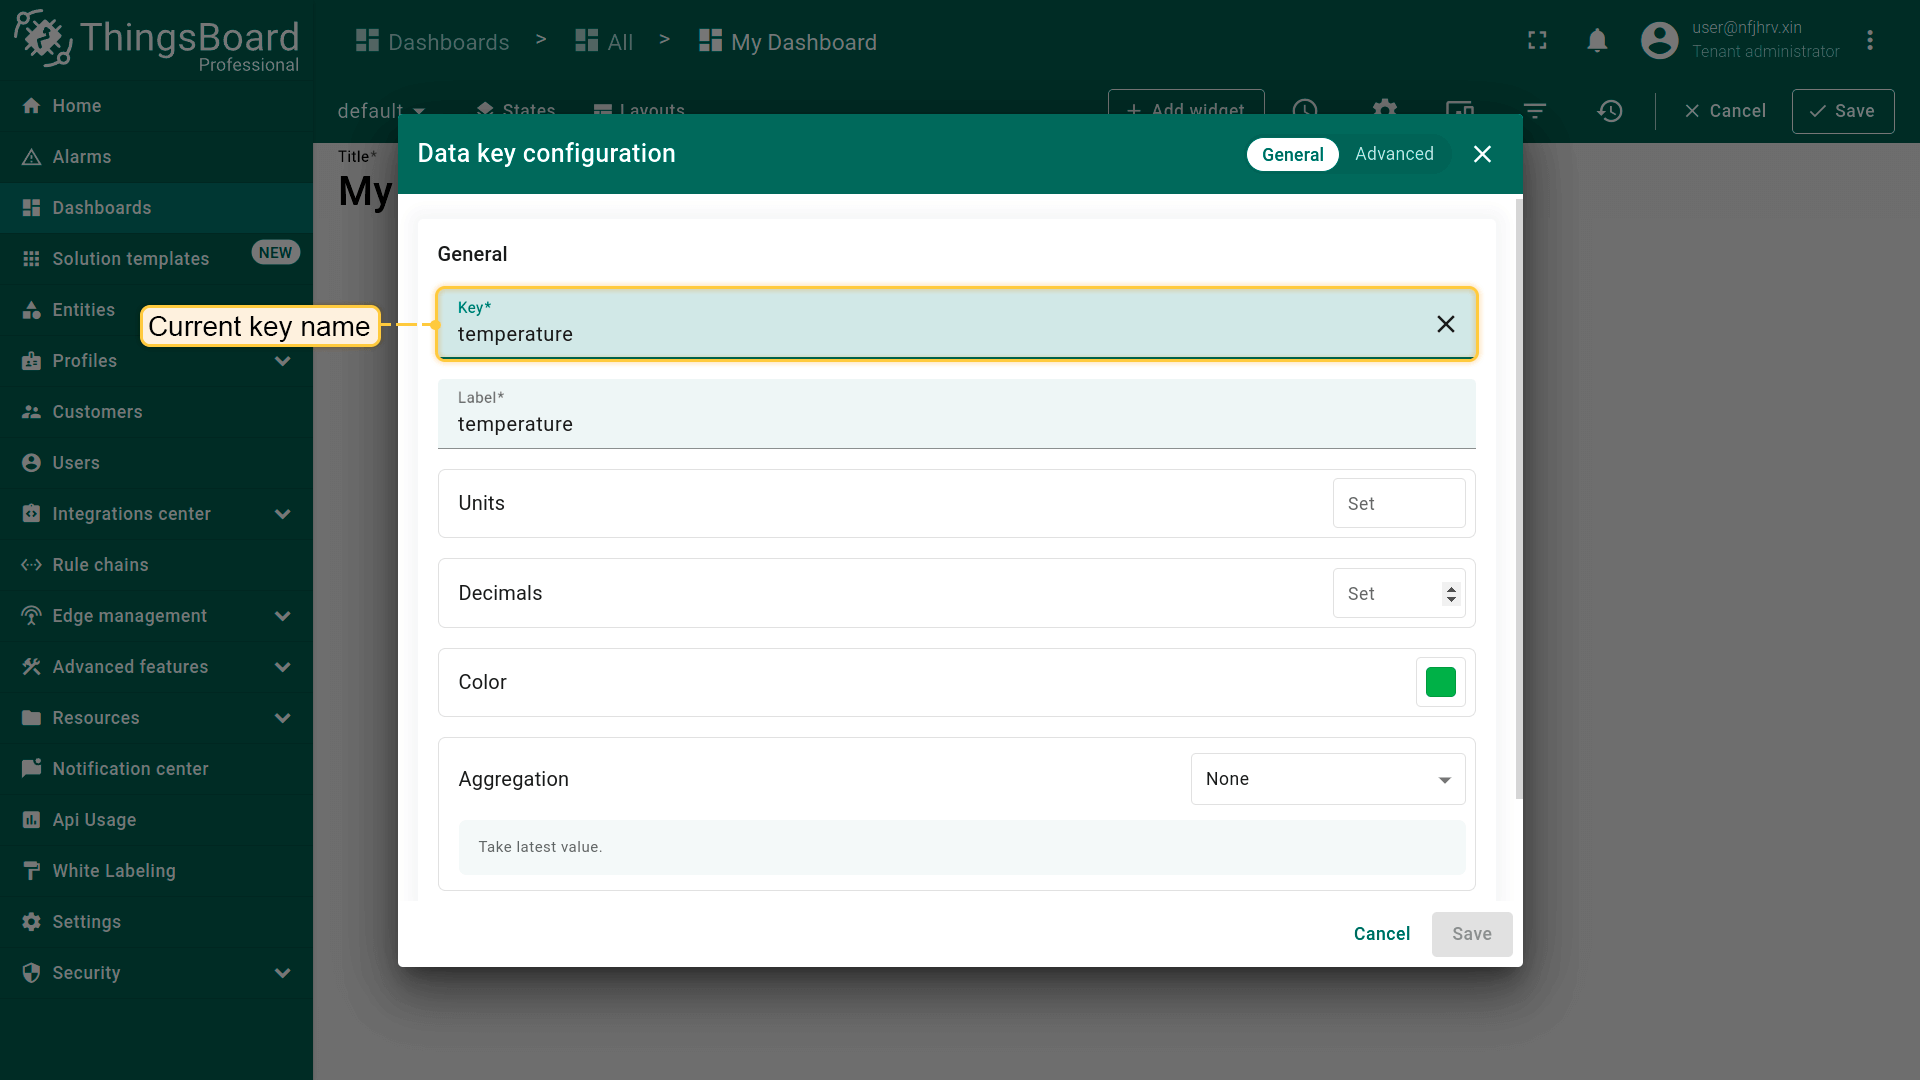
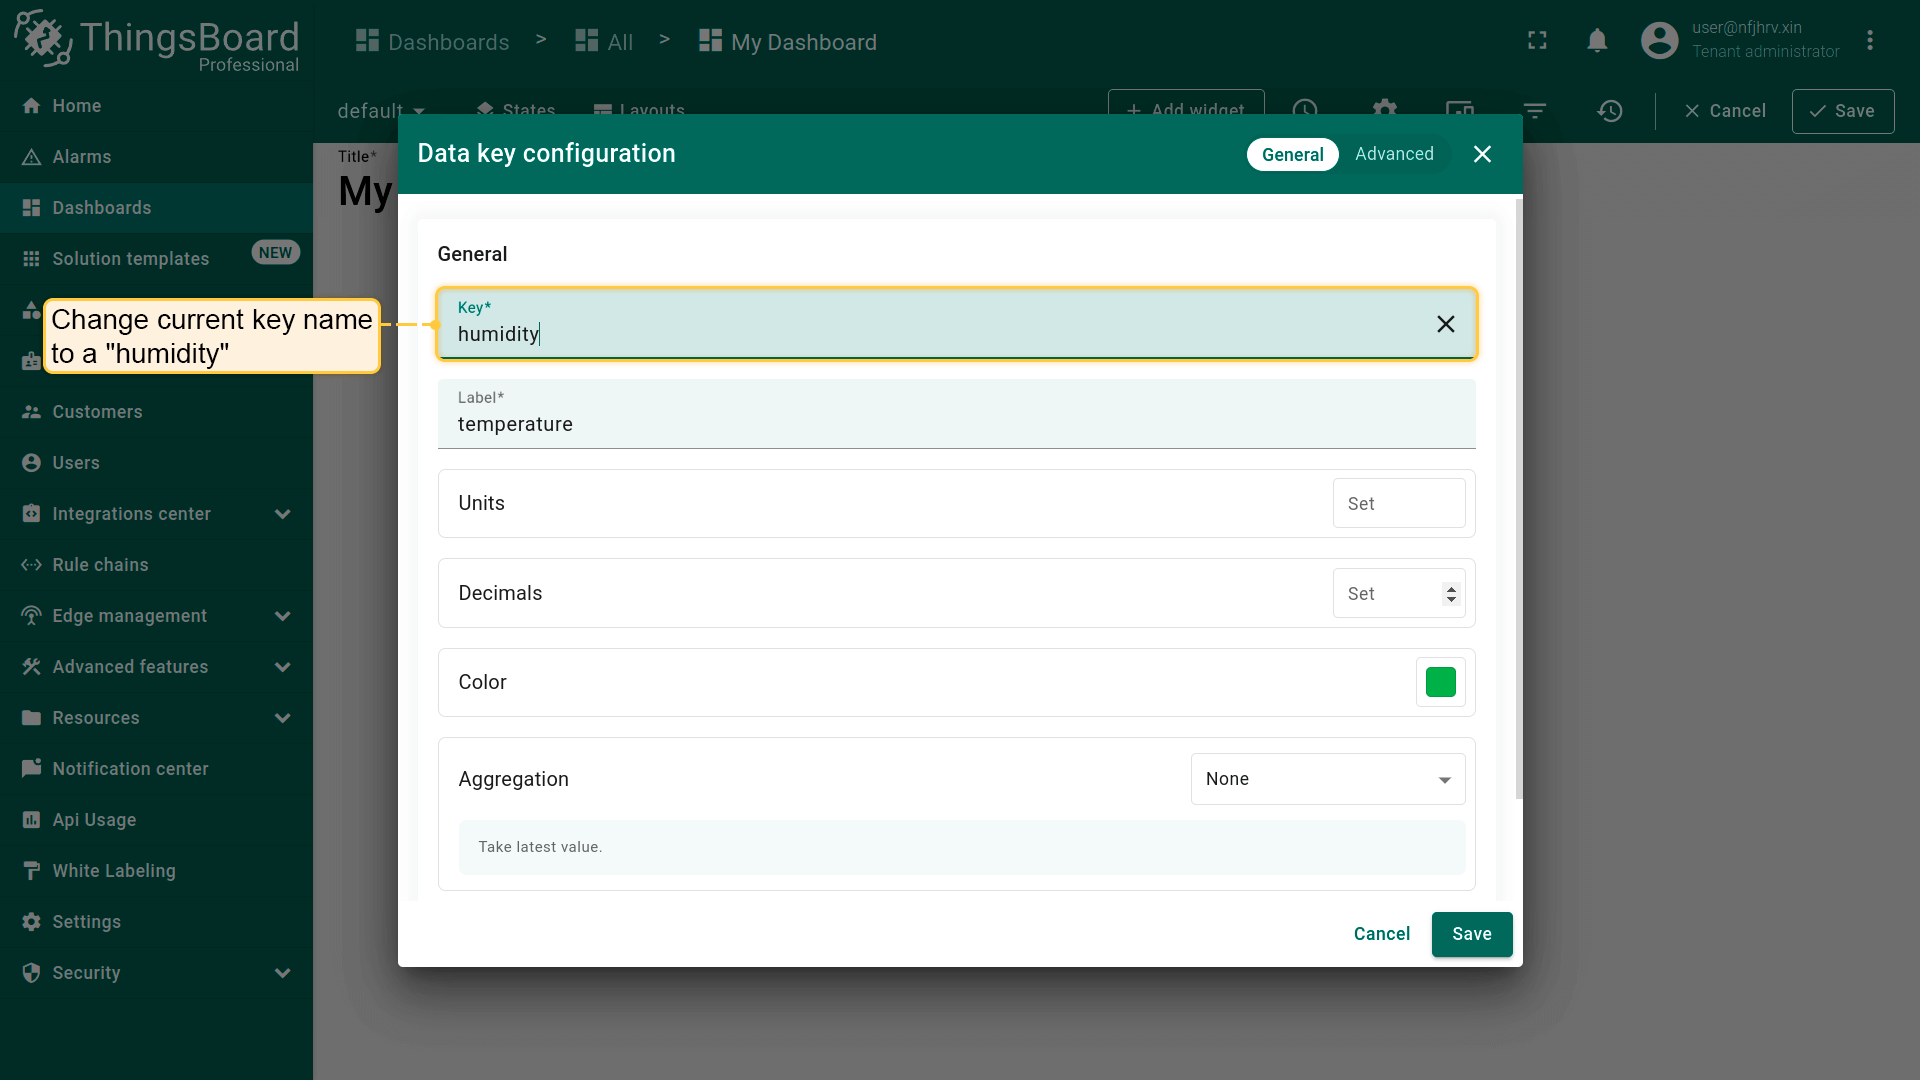
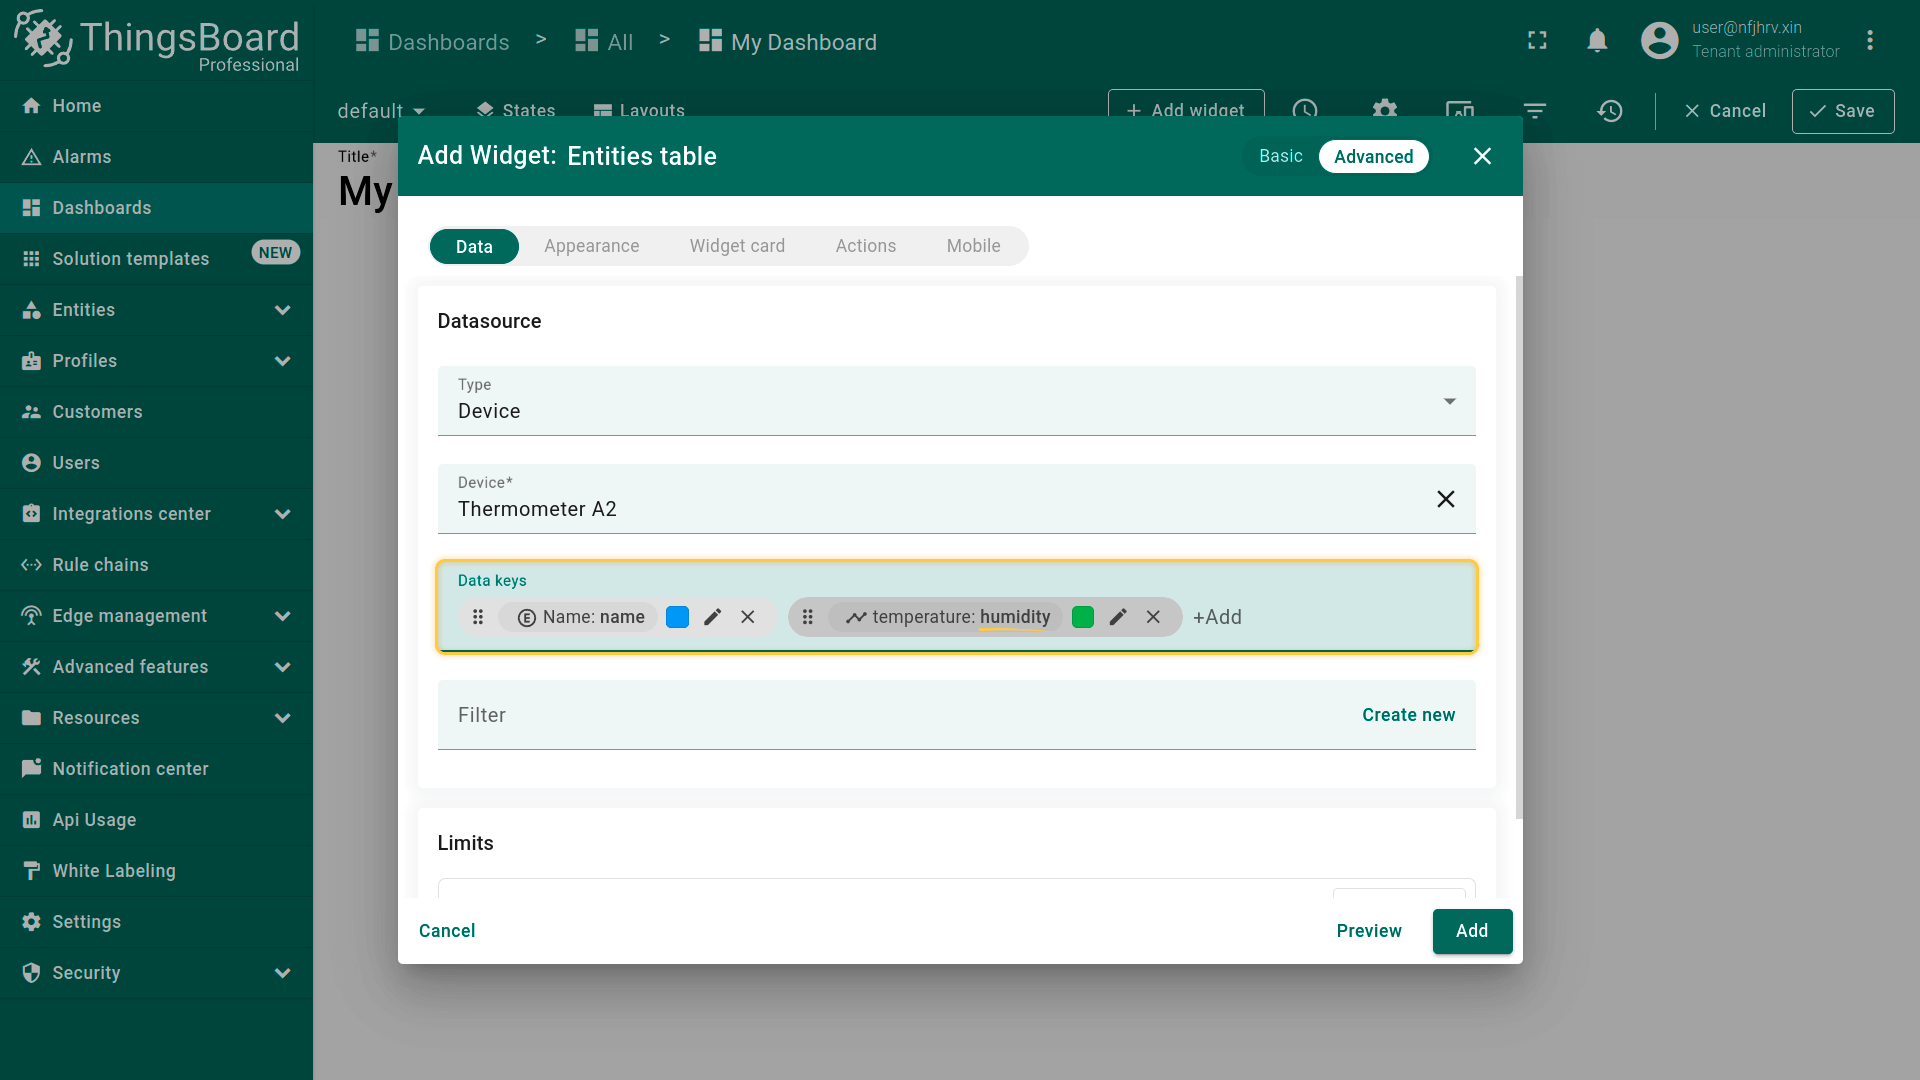
- Key。 可修改键的名称。此时将显示在\u201cKey\u201d行中指定键名所对应键的数据。修改键名后点击\u201cSave\u201d。
请注意:键共有四类:Attributes、Time Series、Entity Field和Alarm Field(仅告警部件)。要正确显示数据,需将键名改为同类型中已存在的键名。若数据库中尚无所需遥测或属性键,仍可向数据源添加该键;设备发送到ThingsBoard后部件即会显示数据。
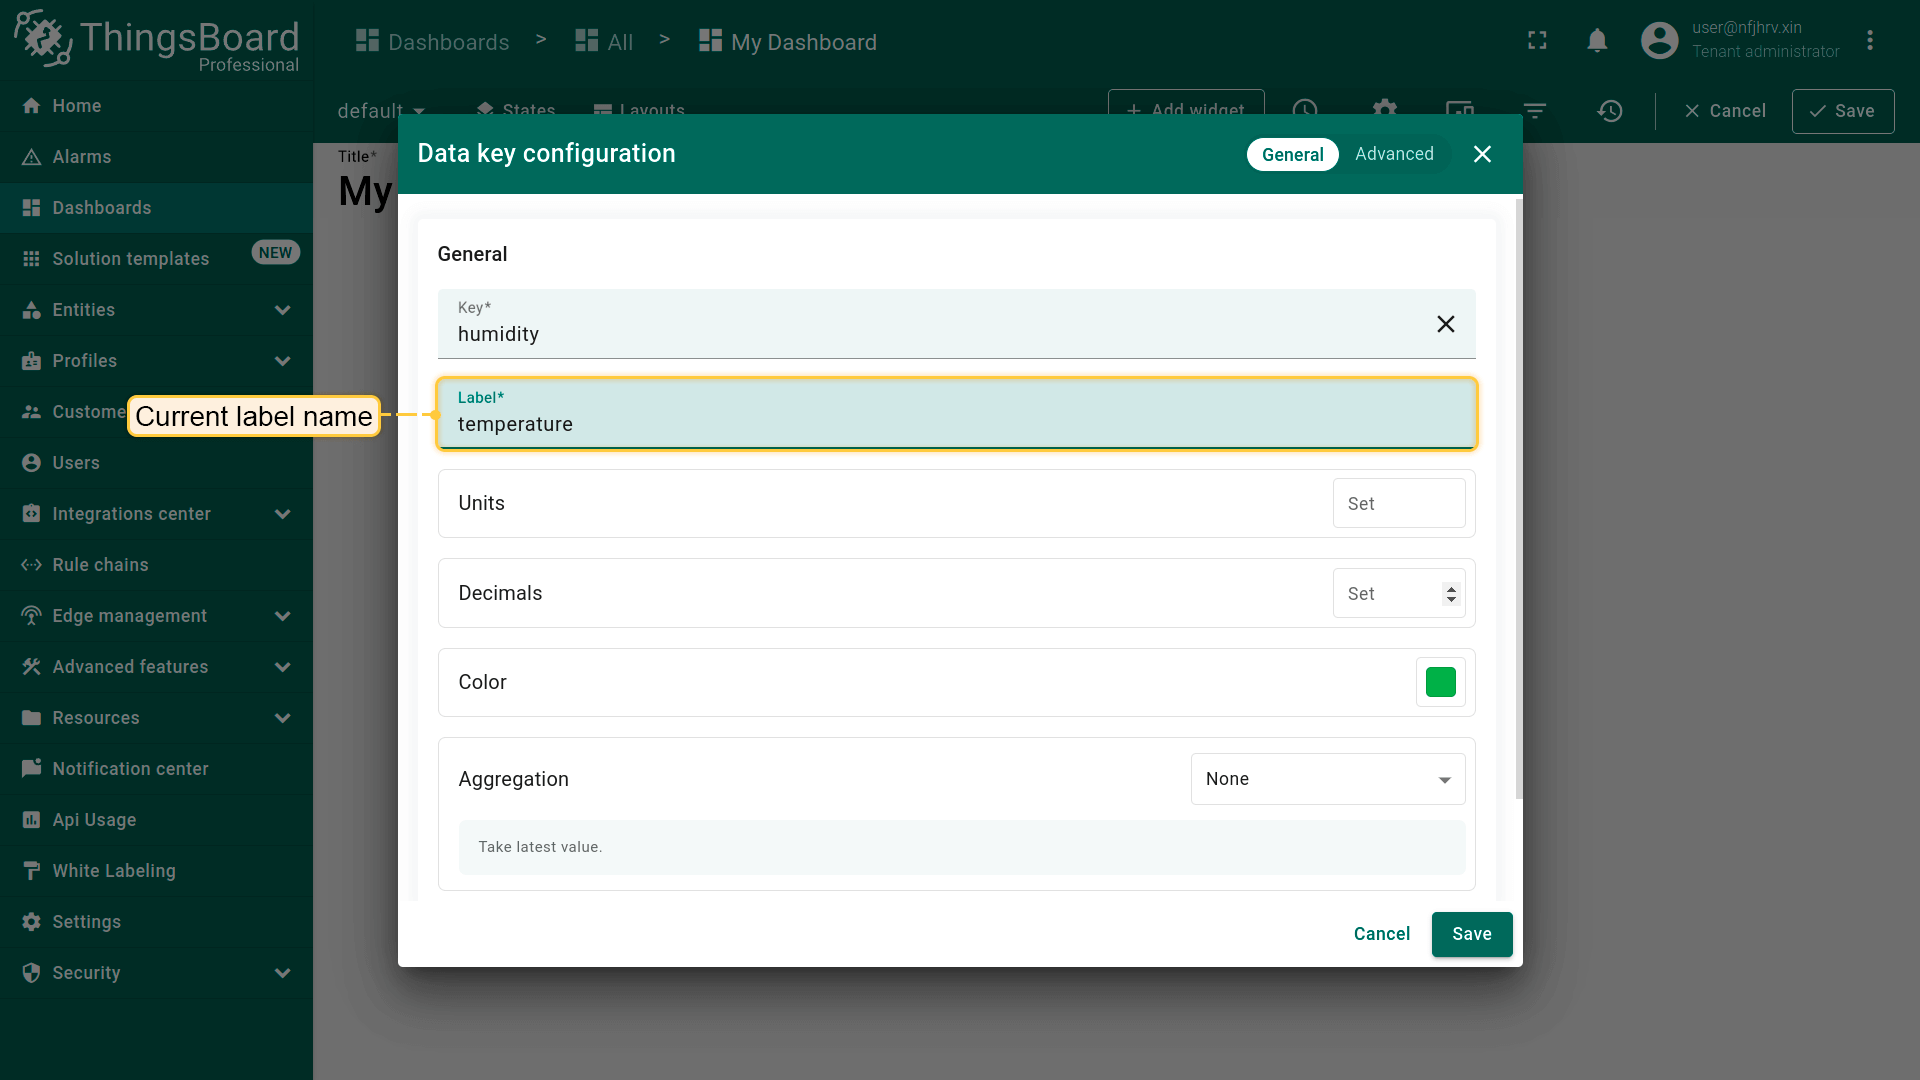
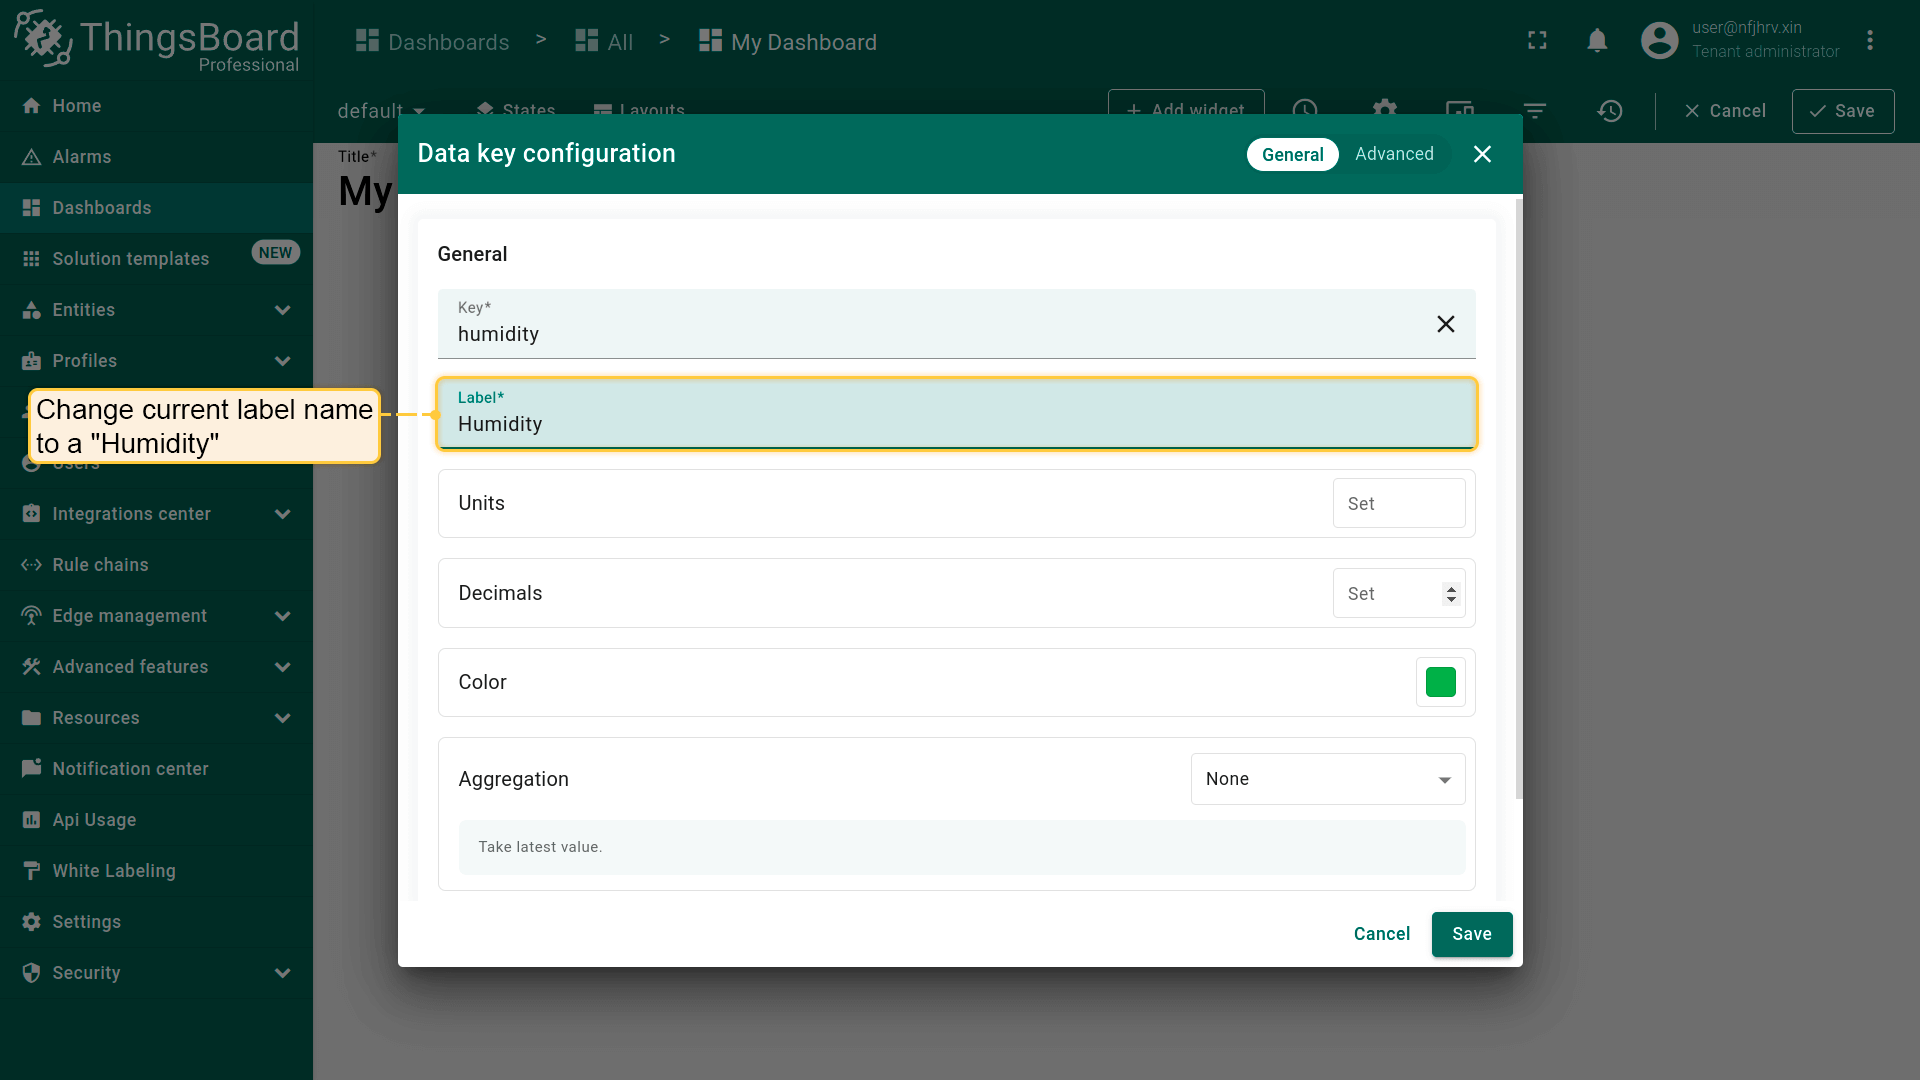
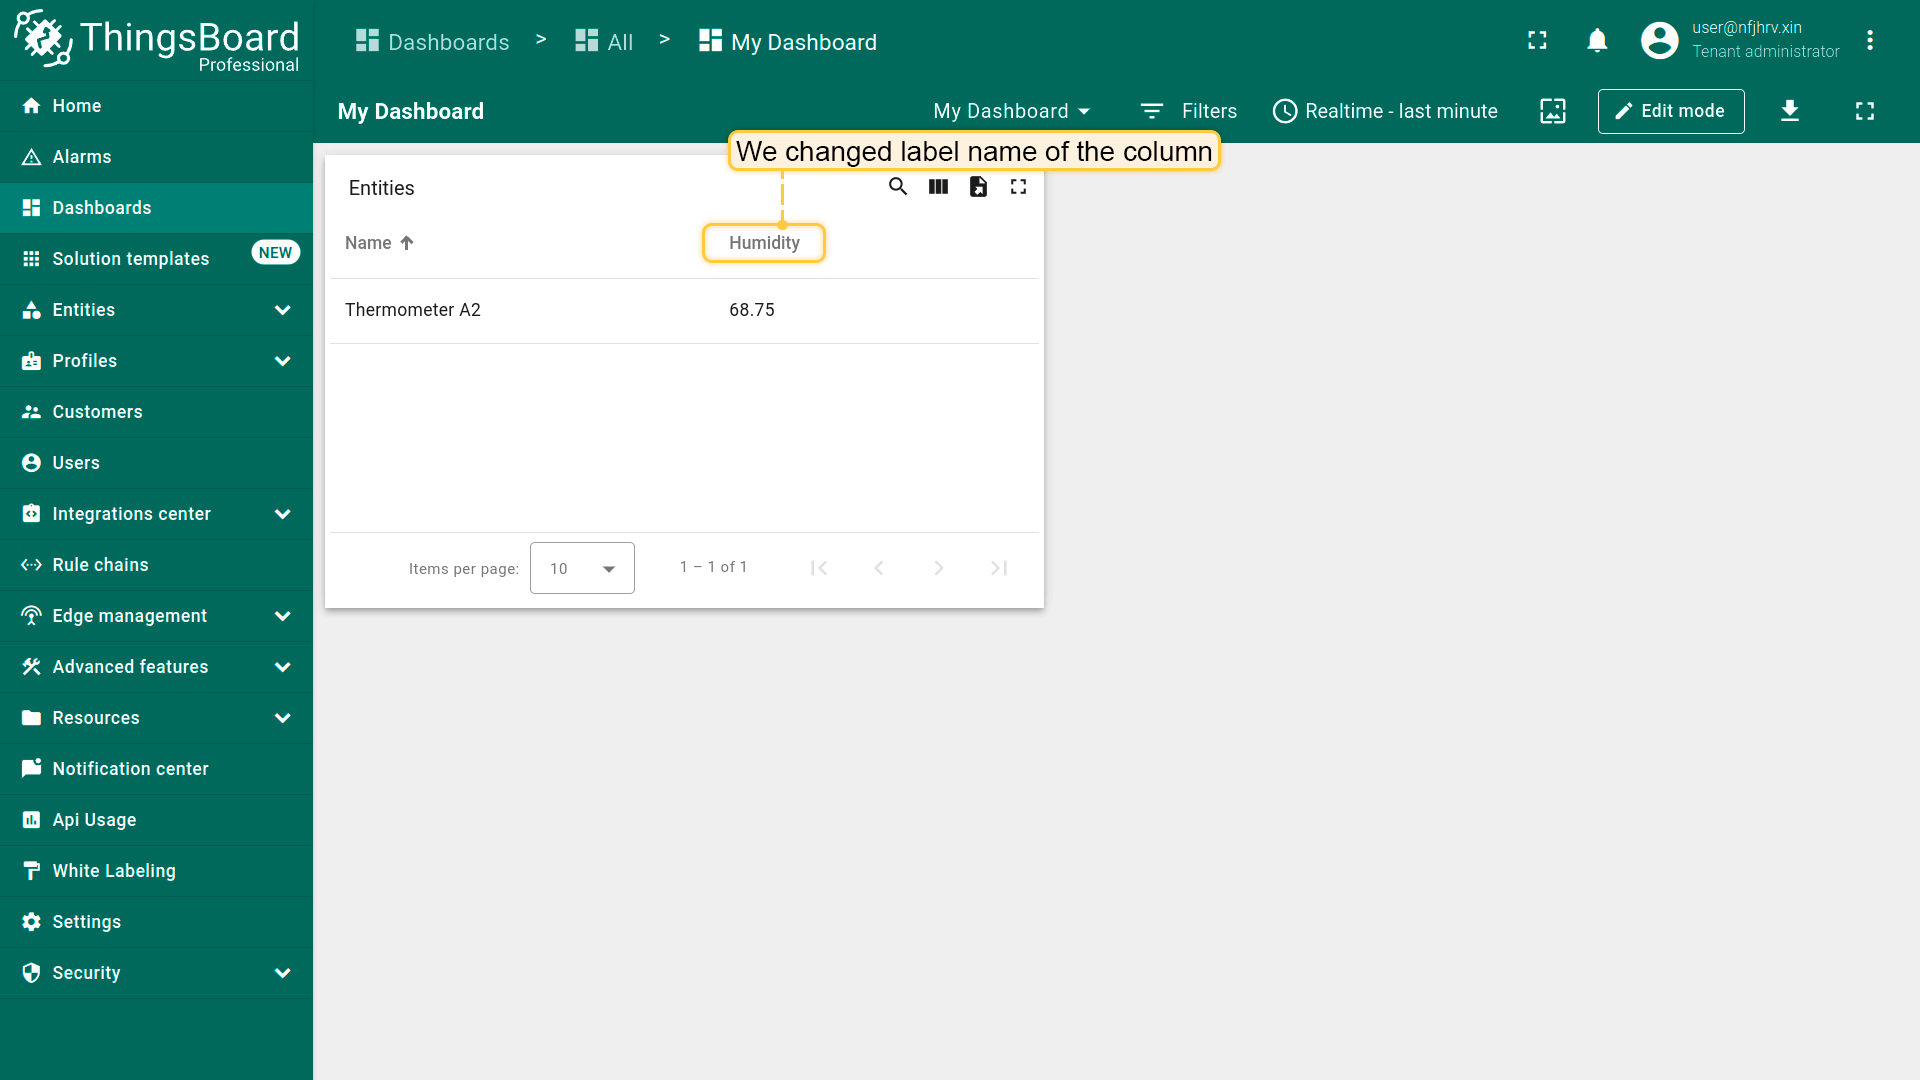
- Label。 数据列名称即为标签名。按需修改标签名,在对话框右下角点击\u201cSave\u201d。
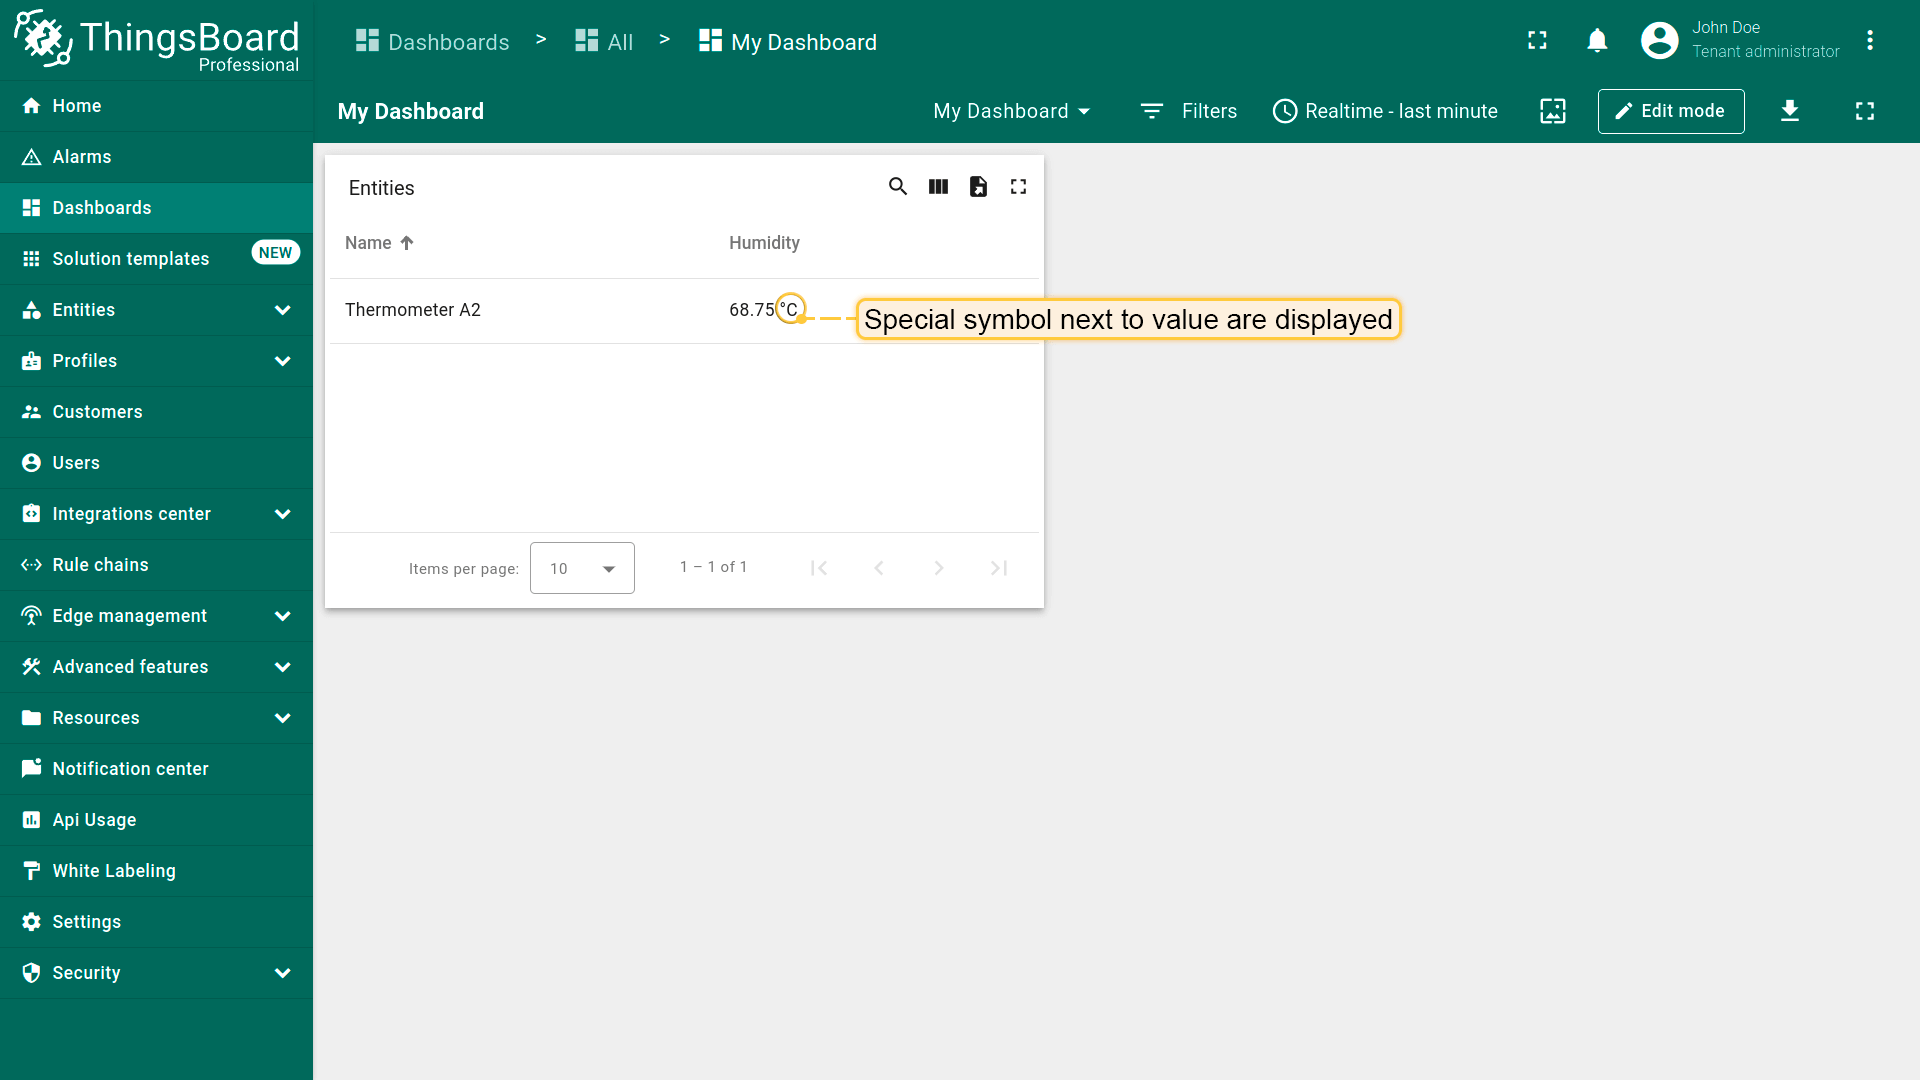
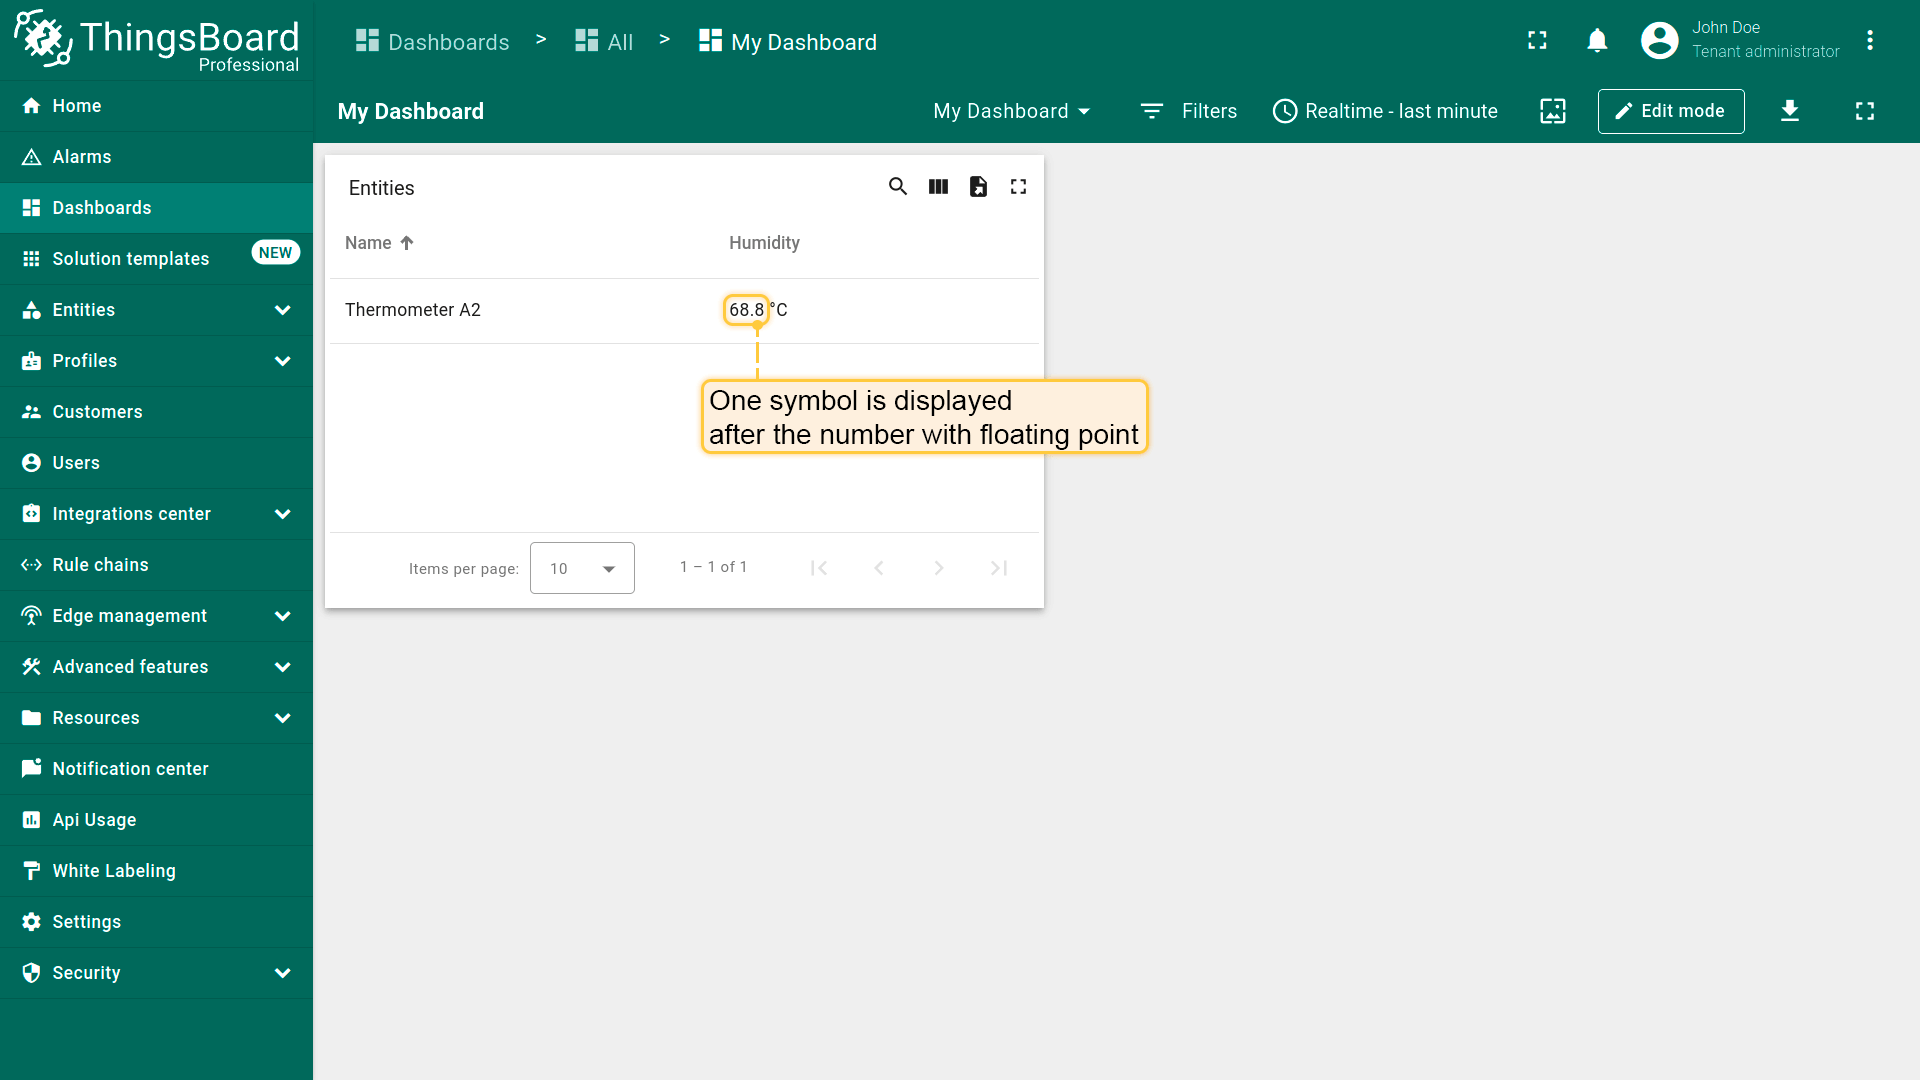
- Units。 可指定显示在数值旁的符号。在units字段输入所需字符后点击\u201cSave\u201d。
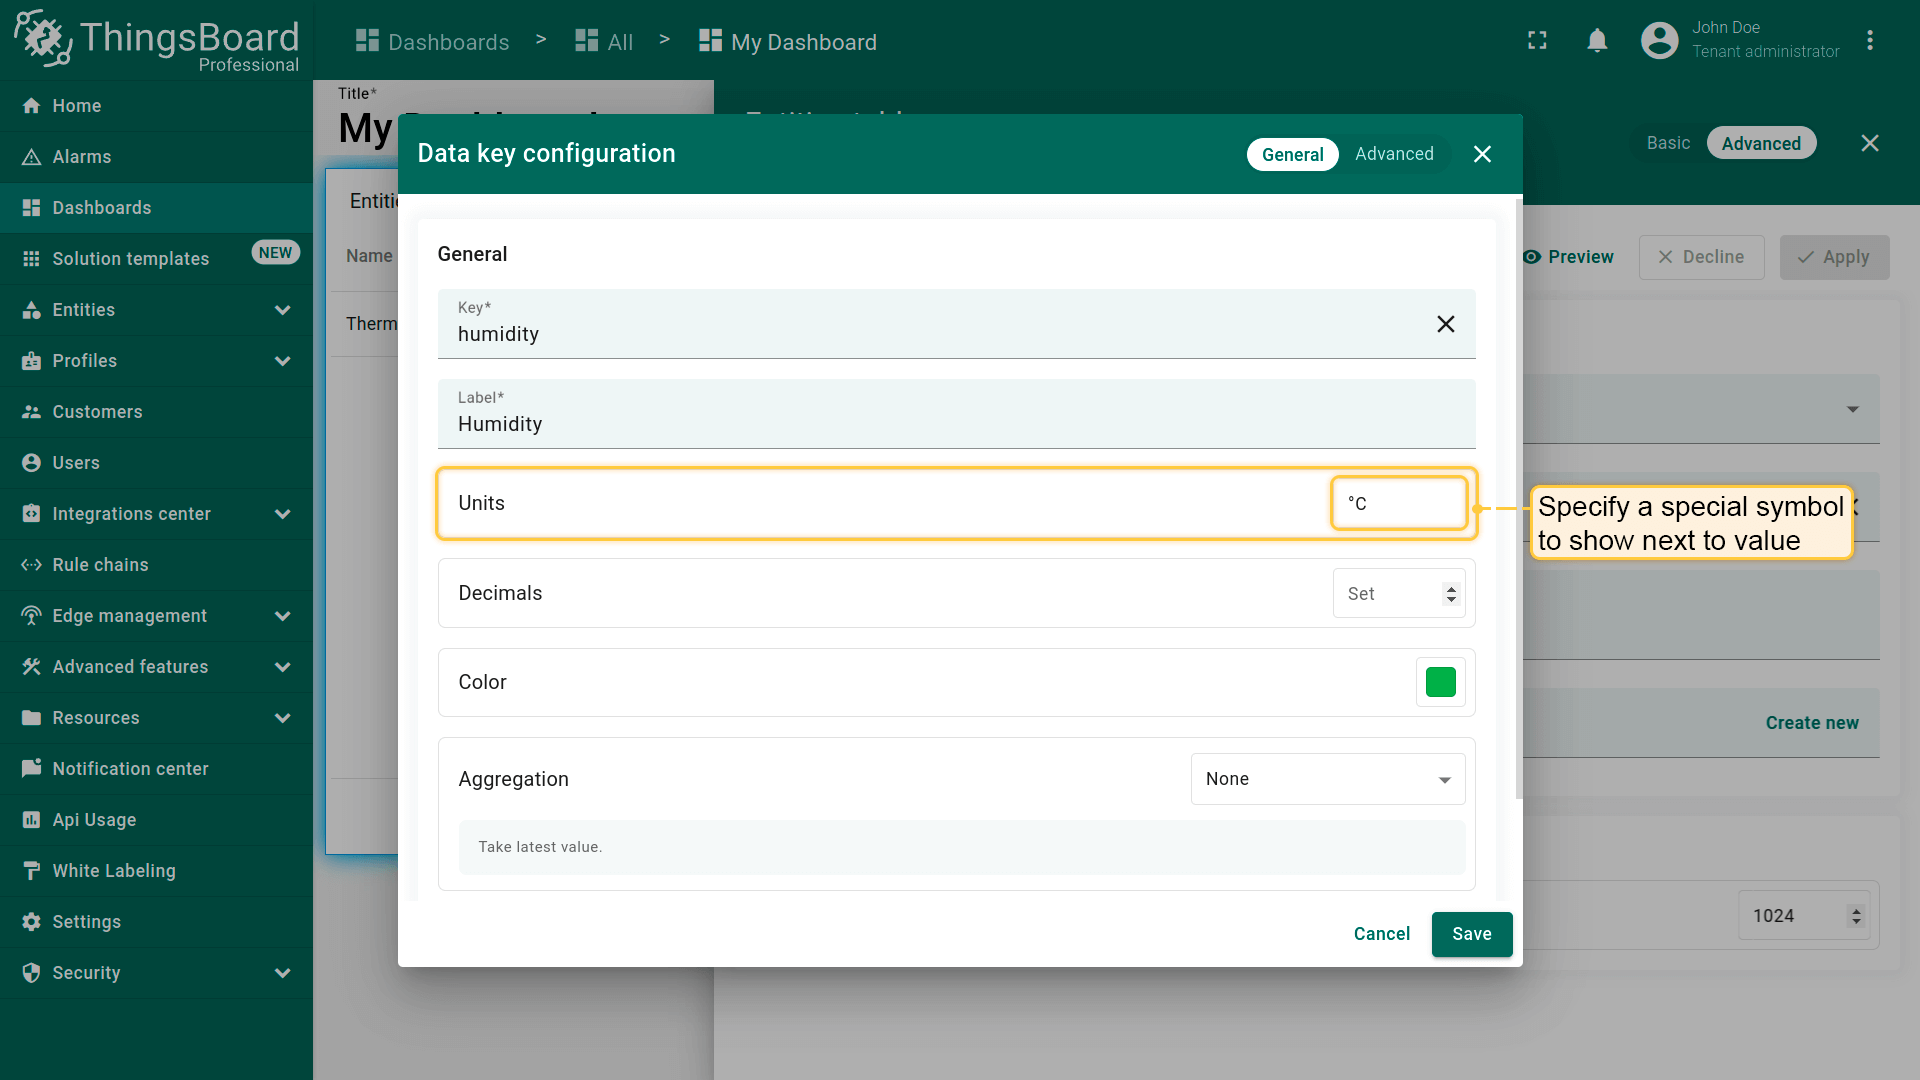
自ThingsBoard 4.1起,部件还支持根据所选单位制进行自动数据转换和单位切换。详见此处。
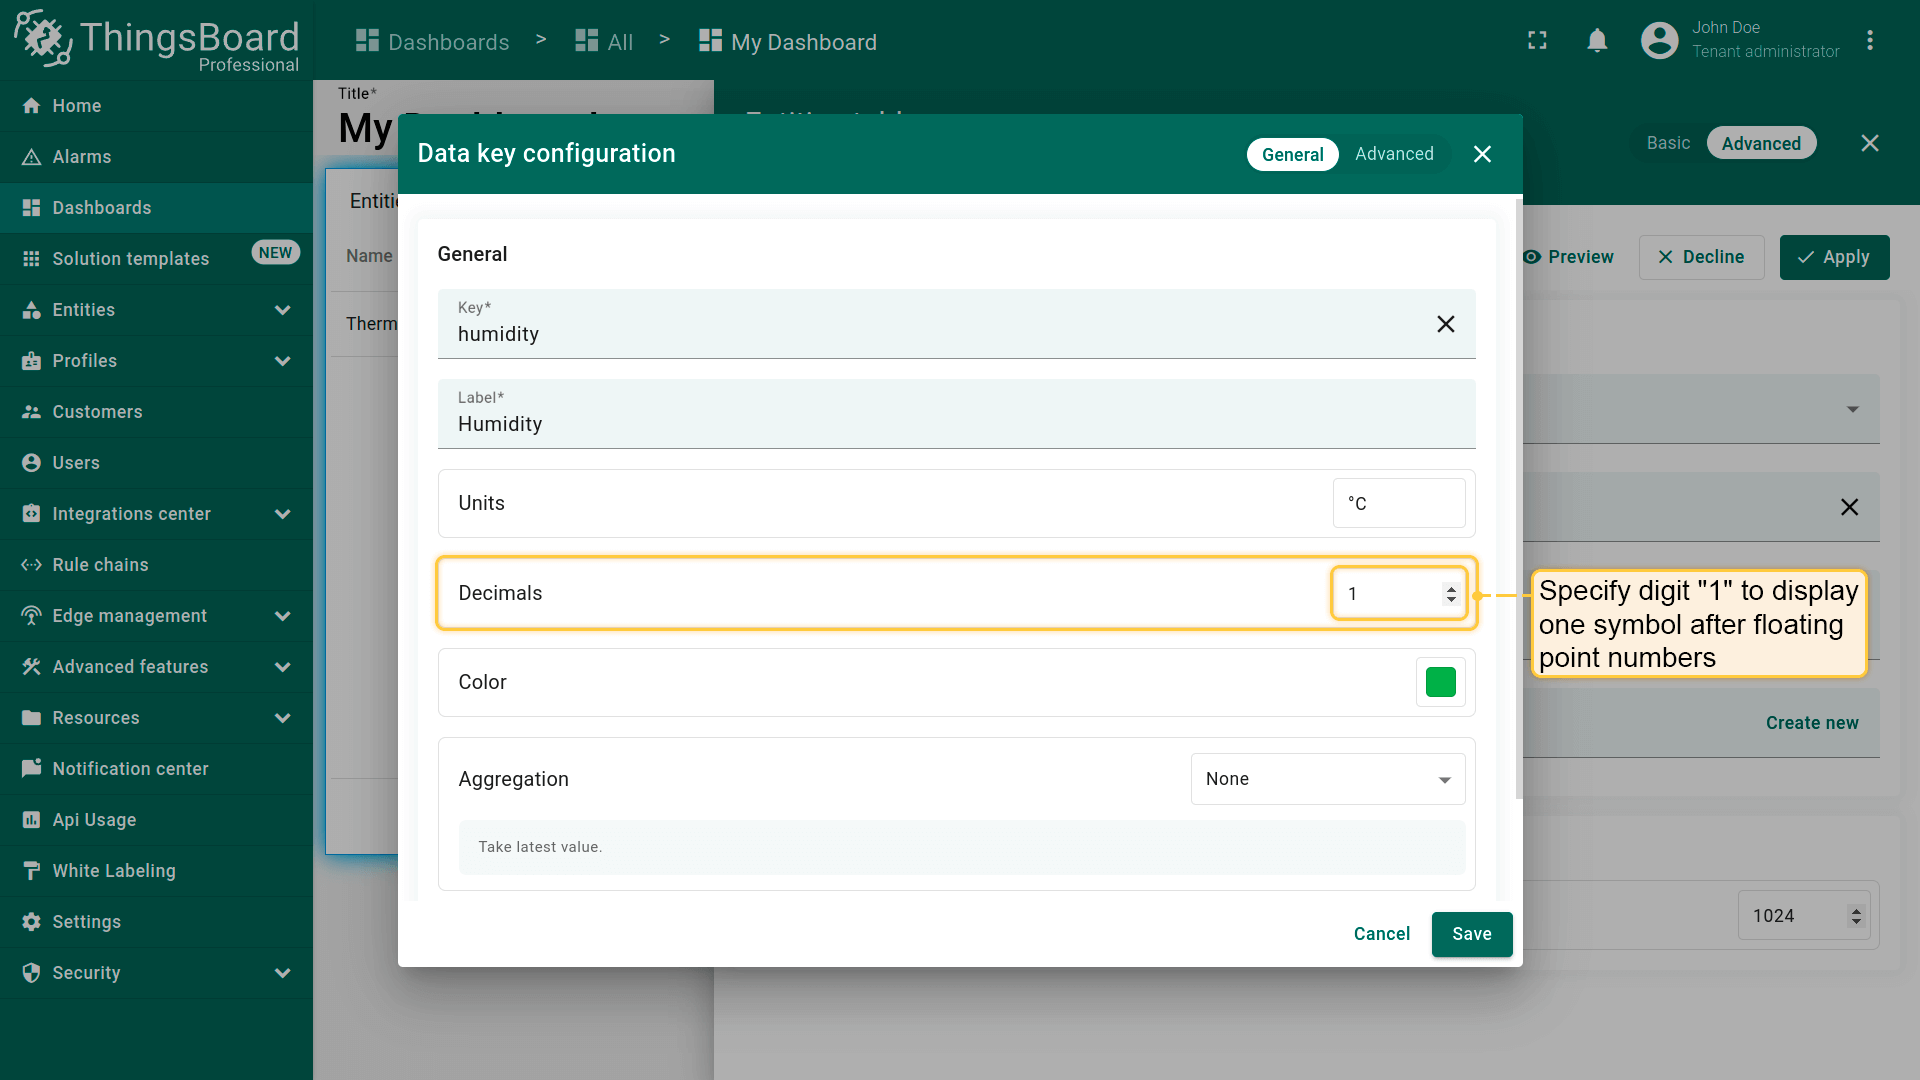
- Decimals。 指定浮点数后要显示的位数,然后点击\u201cSave\u201d。
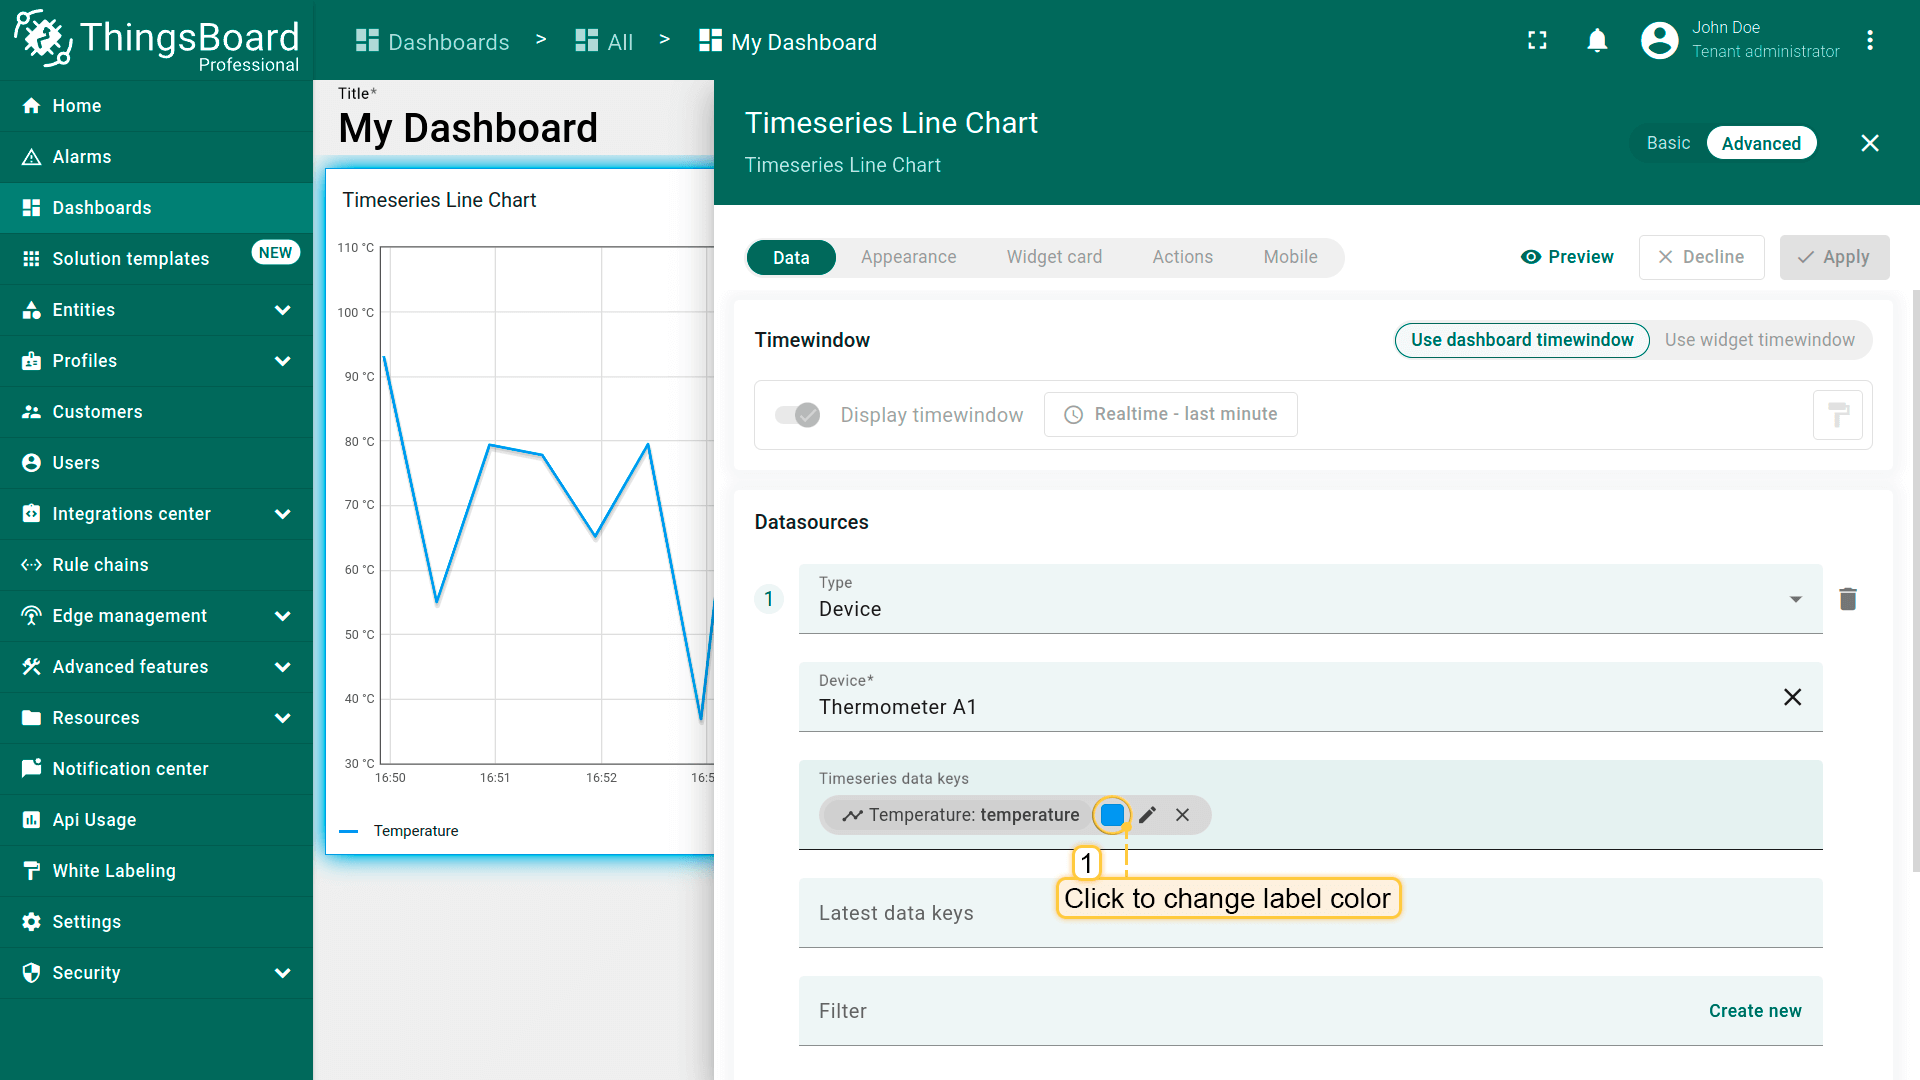
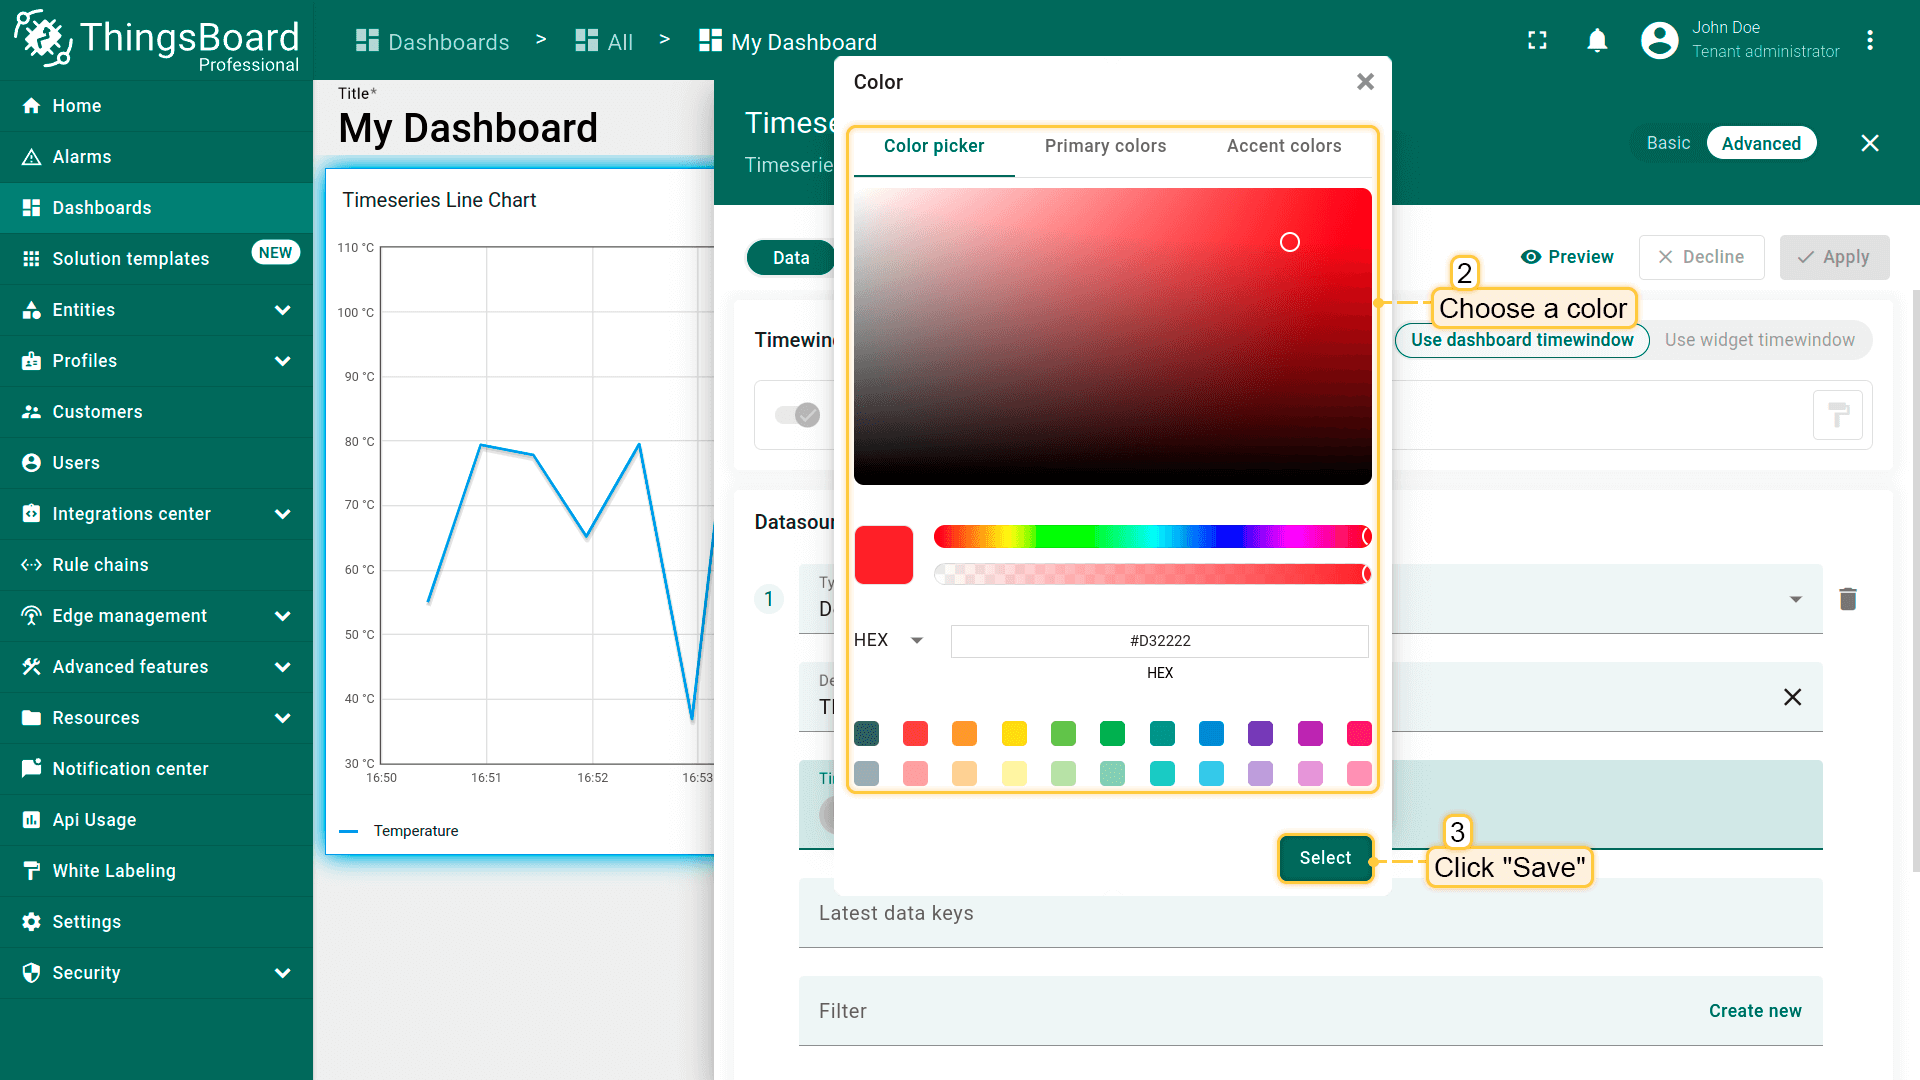
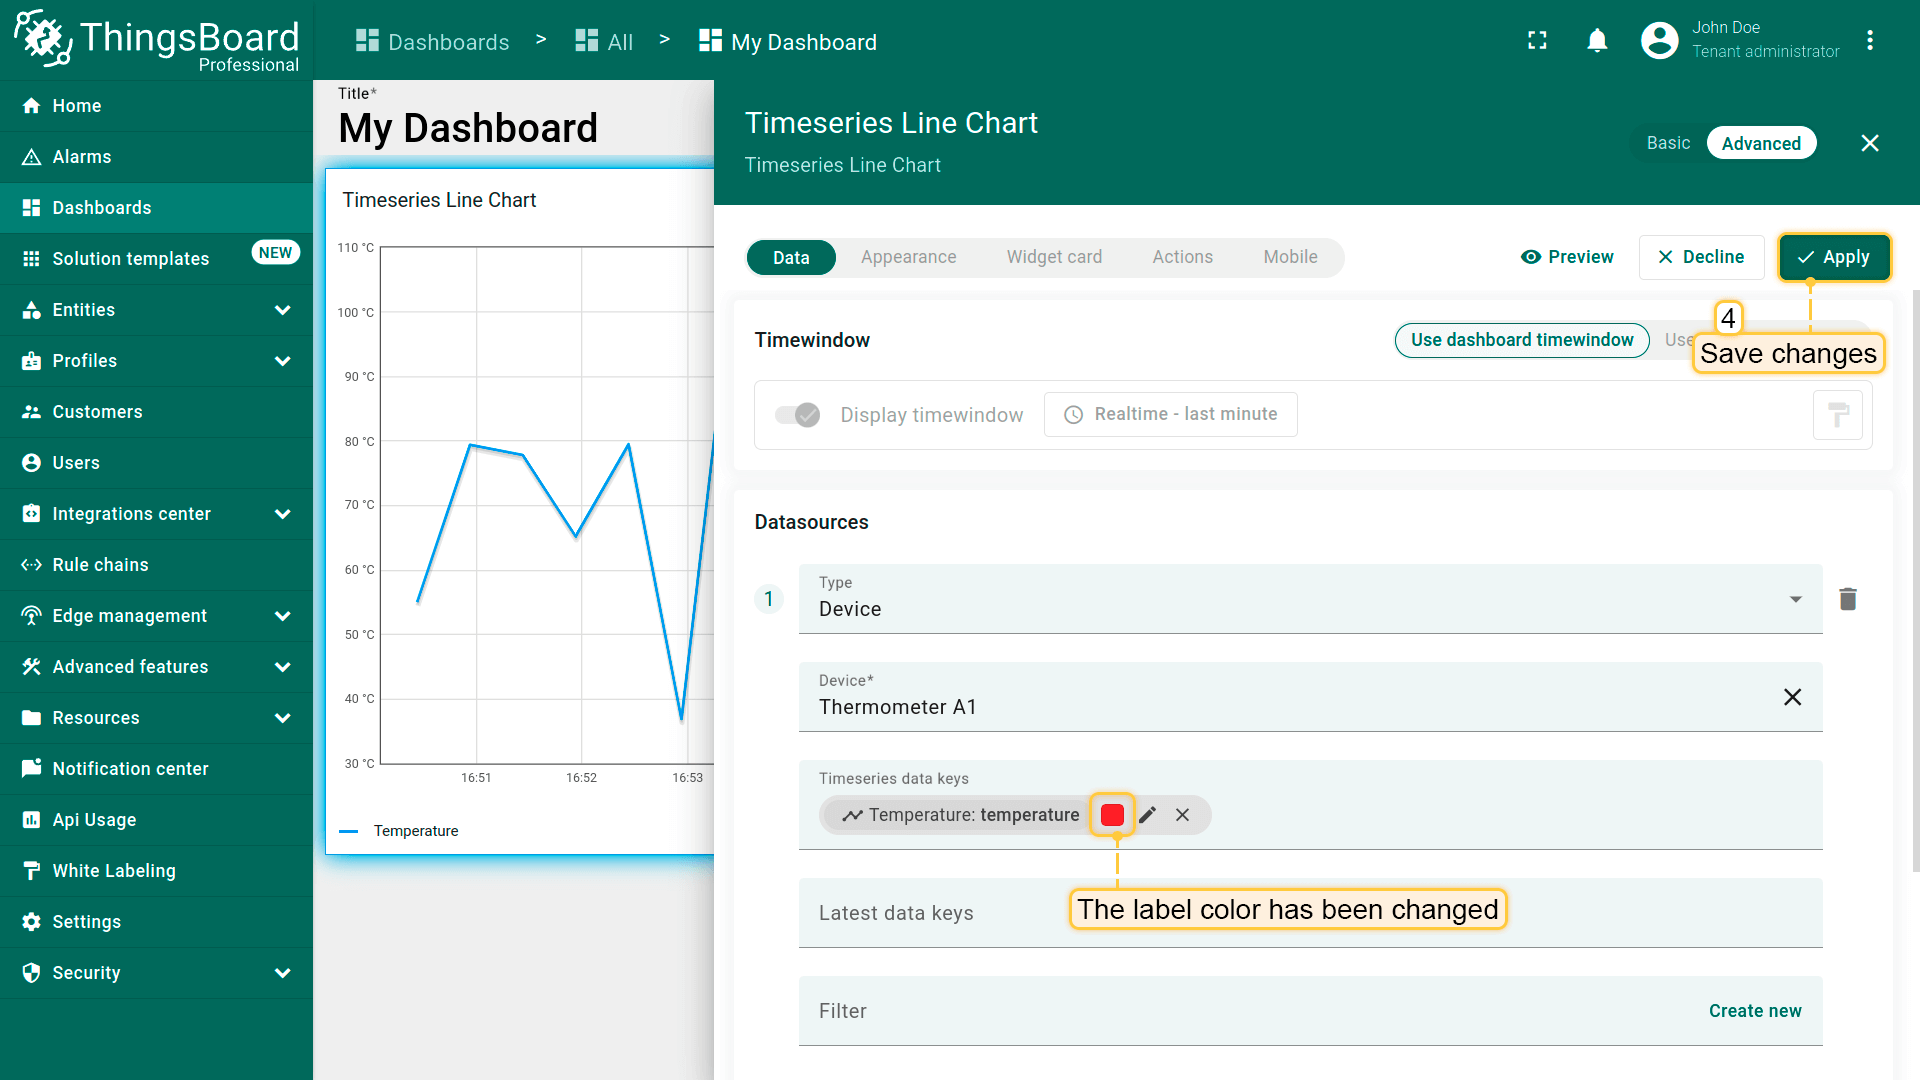
- Color。 每个键分配不同颜色。在部分部件(如图表)中,部件内图表线条的颜色即为该键的颜色。可修改键的颜色:点击彩色圆点,选择颜色并点击\u201cSelect\u201d。
- Use data post-processing function — 启用自定义函数,在显示前对原始值进行转换。
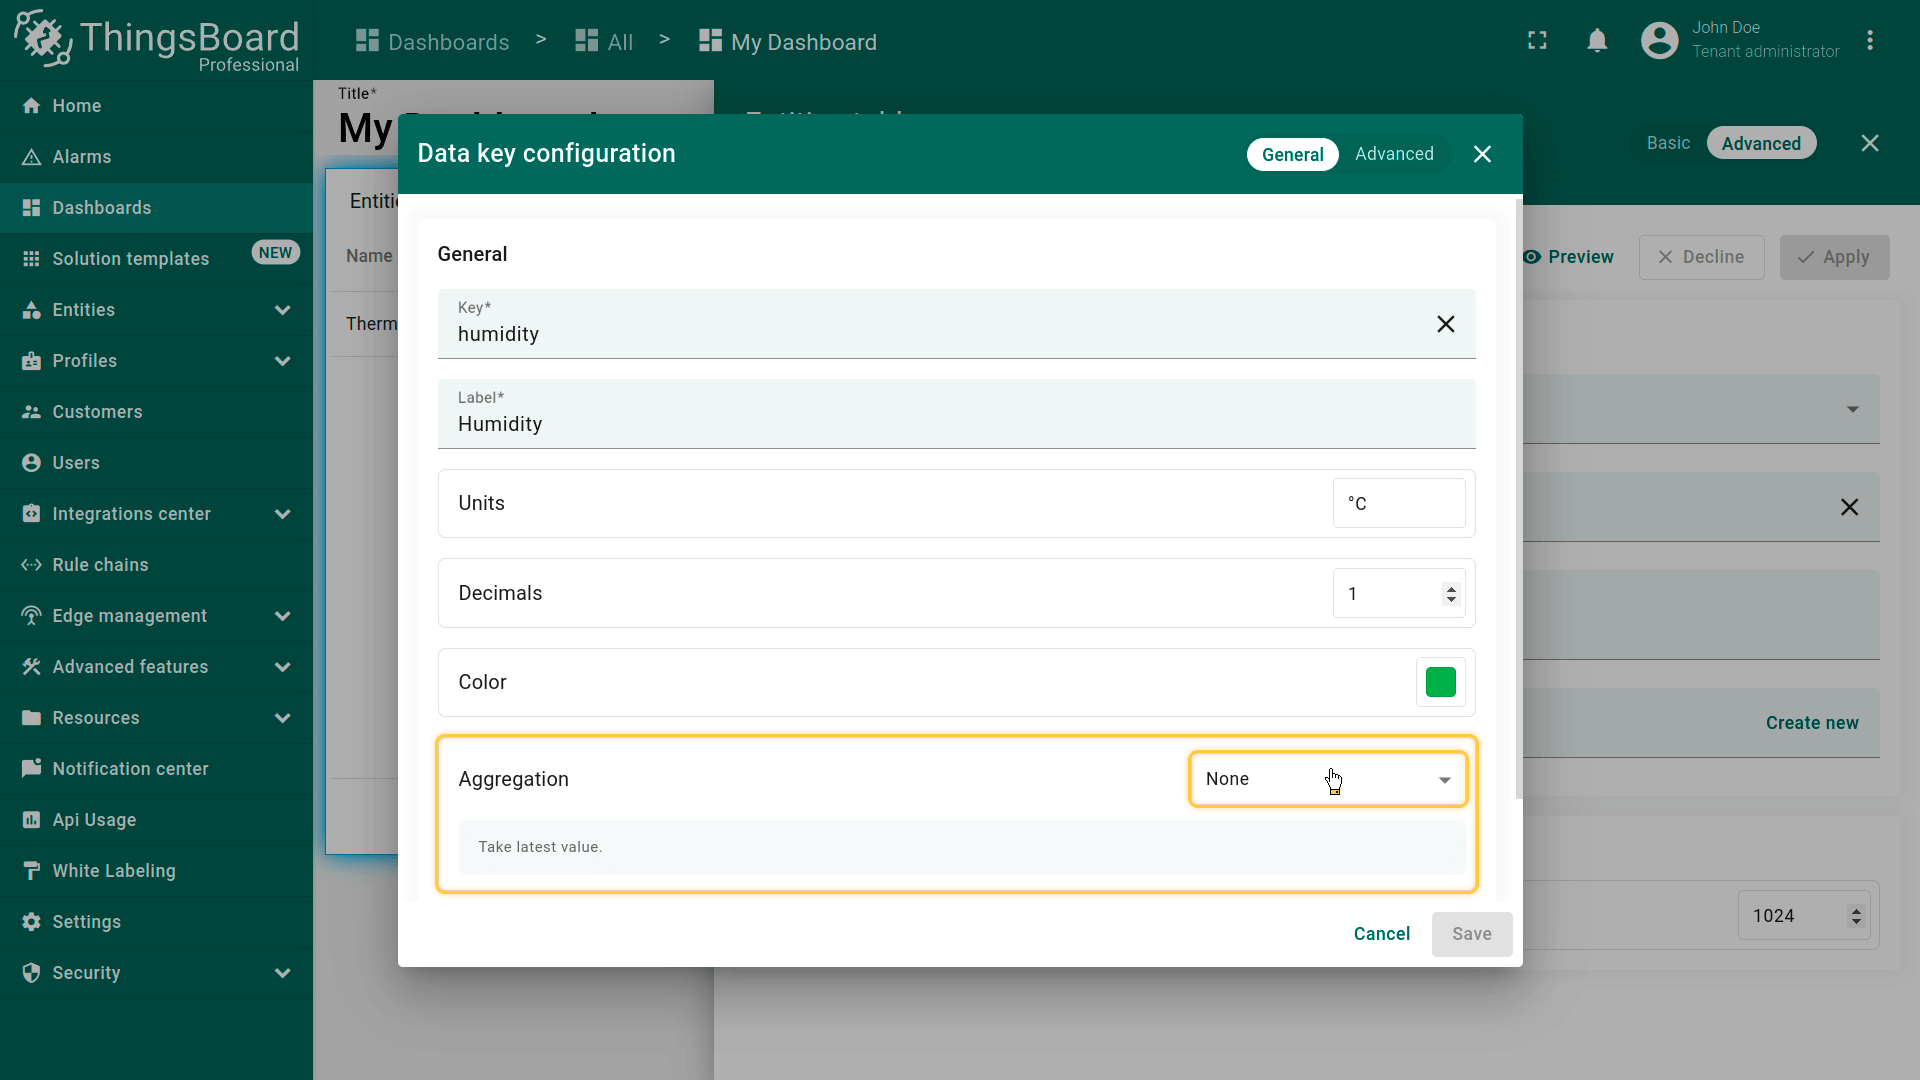
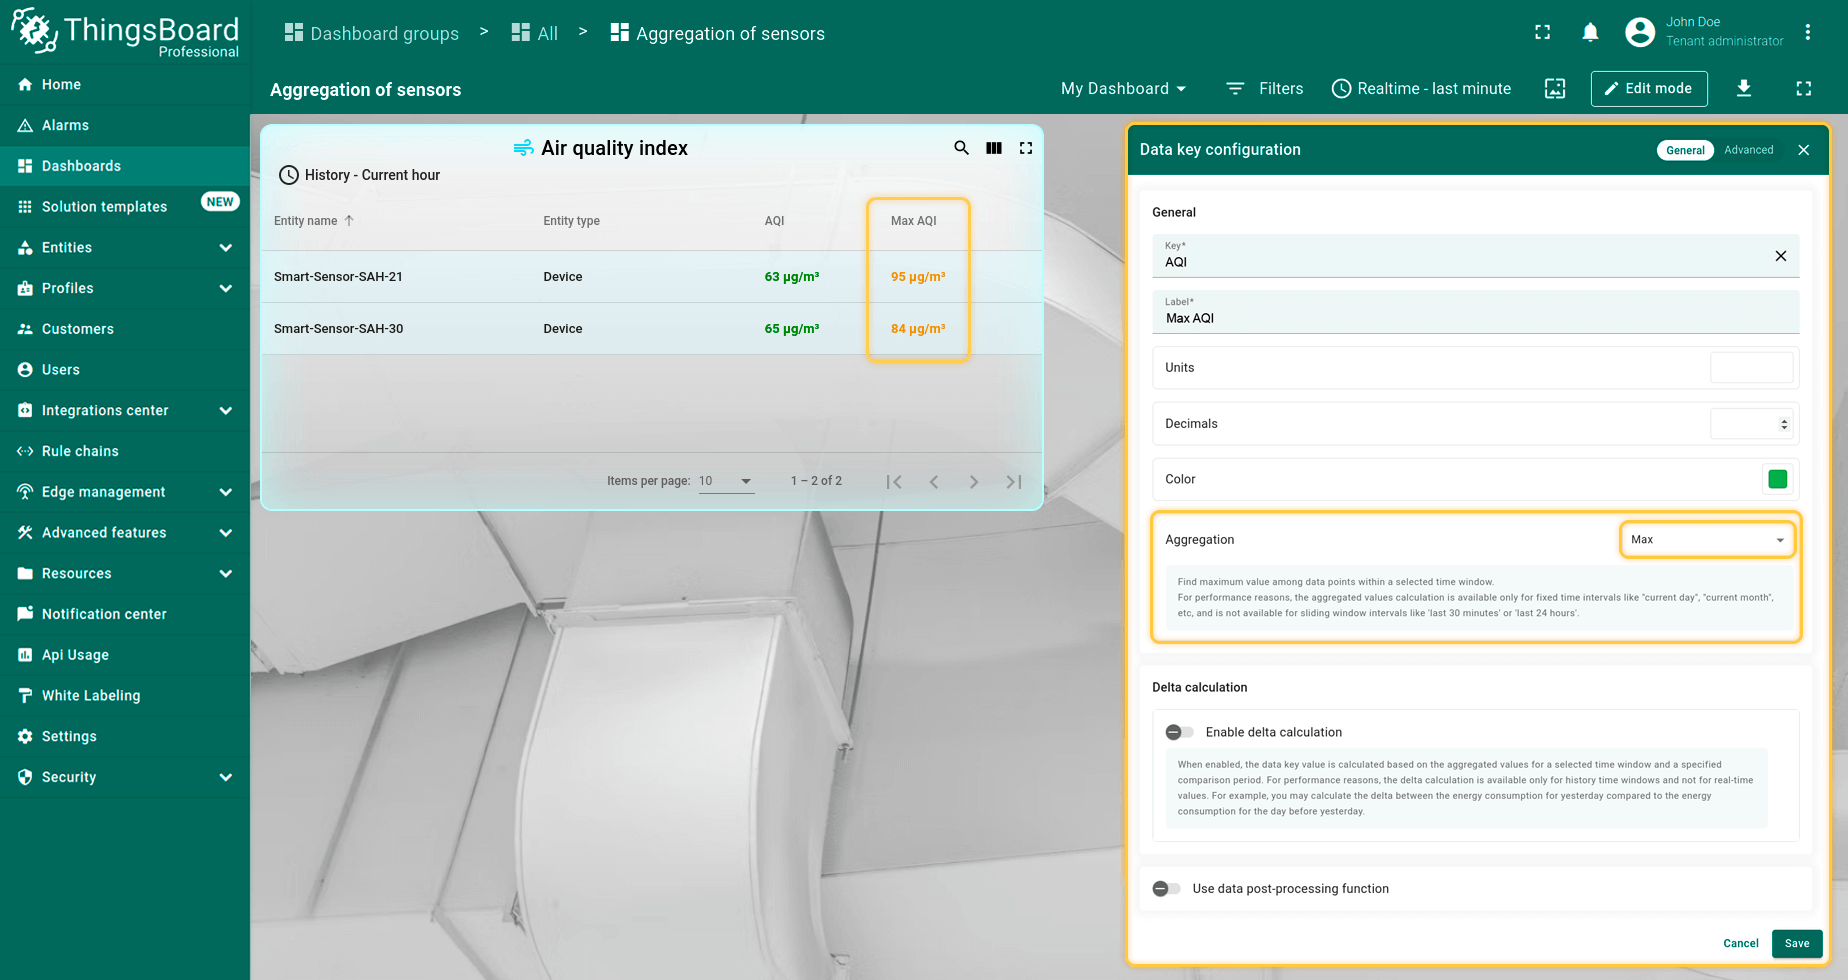
键的聚合
默认情况下,最新值部件没有时间窗口。若在 Latest values 部件中为任意数据键启用聚合,时间窗口控件将出现。可为每个遥测键单独设置聚合,用于显示而无需存入数据库。时间窗口配置仅限于实时区间(Current Hour/Day/Month)和 History 时间区间。出于性能考量,不支持如 last 30 minutes 或 last 24 hours 等实时区间。若需将聚合结果作为遥测存储,详见此处。
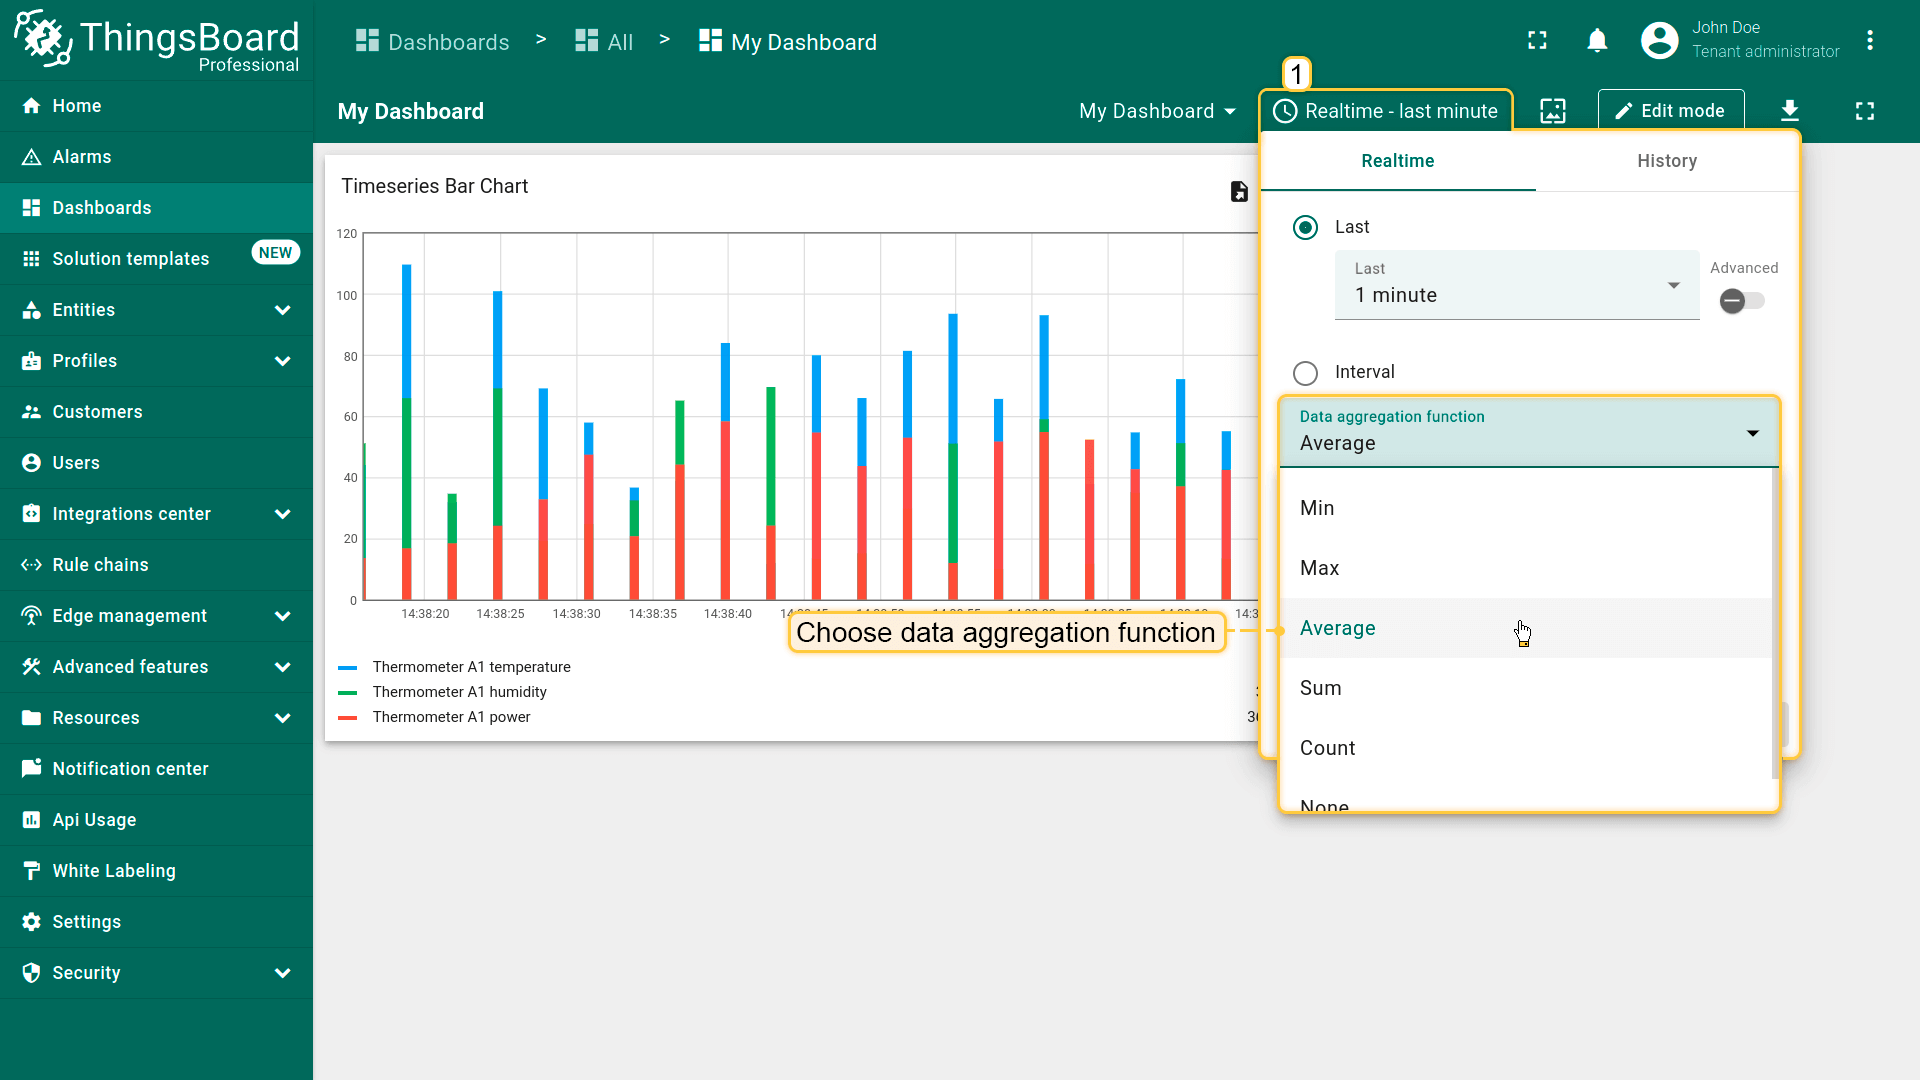
聚合选项:
- Min 或 Max:
从给定区间选取最小或最大值,用于检测负向或正向峰值。例如:电缆功率surges、空气污染、设备负载等。
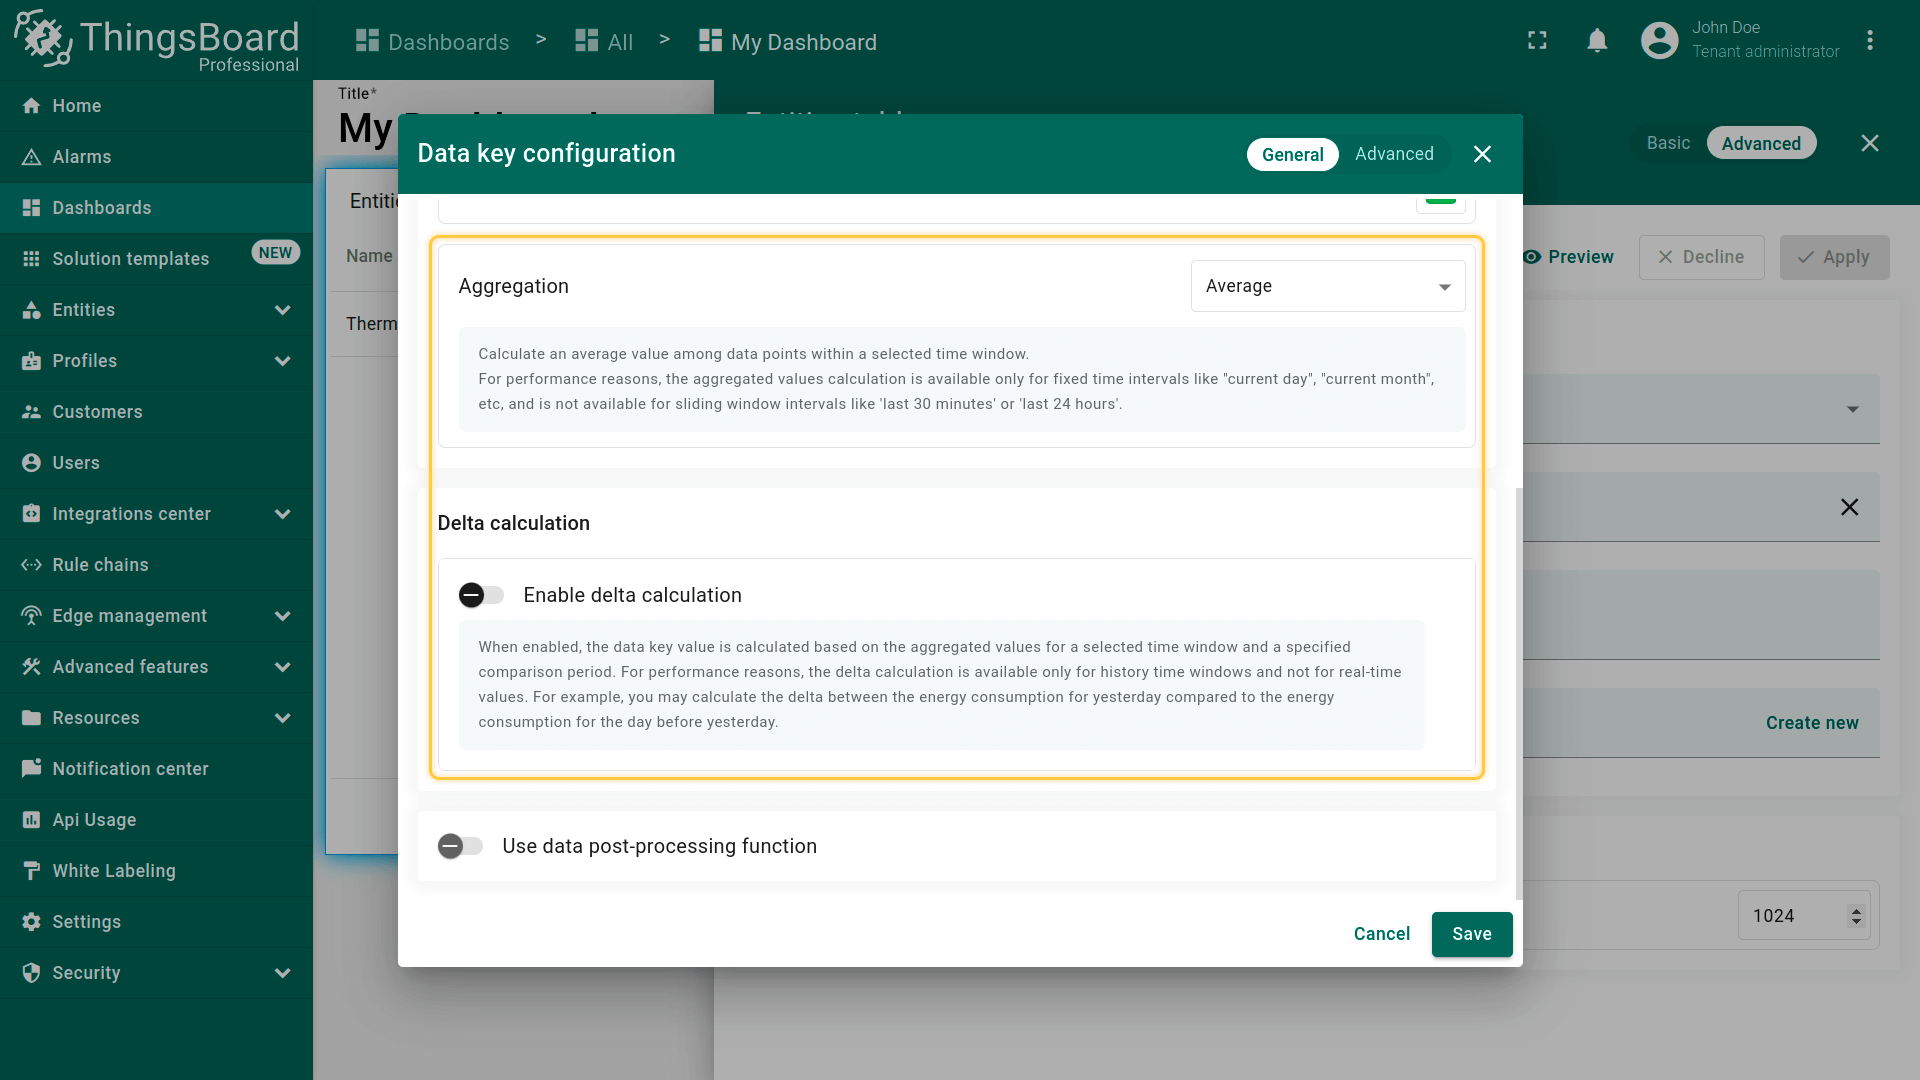
- Average:
计算所选区间的平均值(先求和,再除以区间内遥测条数)。例如:周油耗、dB声噪、风扇转速、信号质量等。

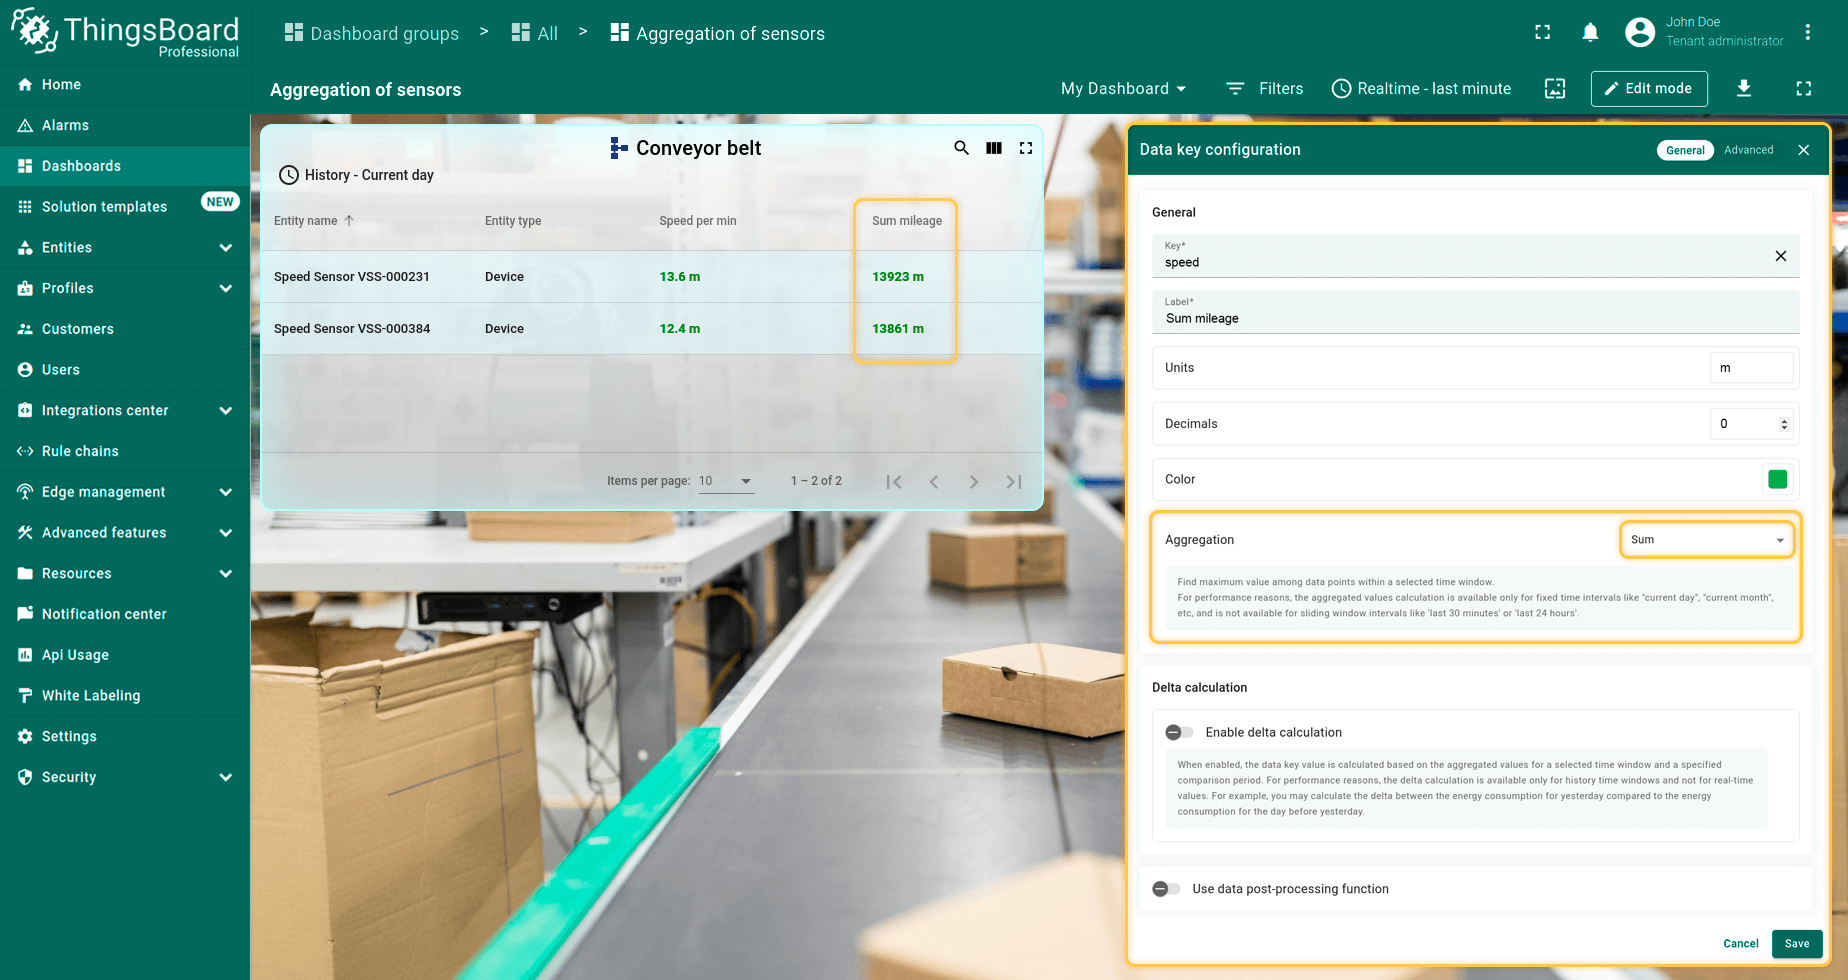
- Sum:
对指定时段内的全部遥测求和。例如:里程(km)、用水量、空闲时间等。
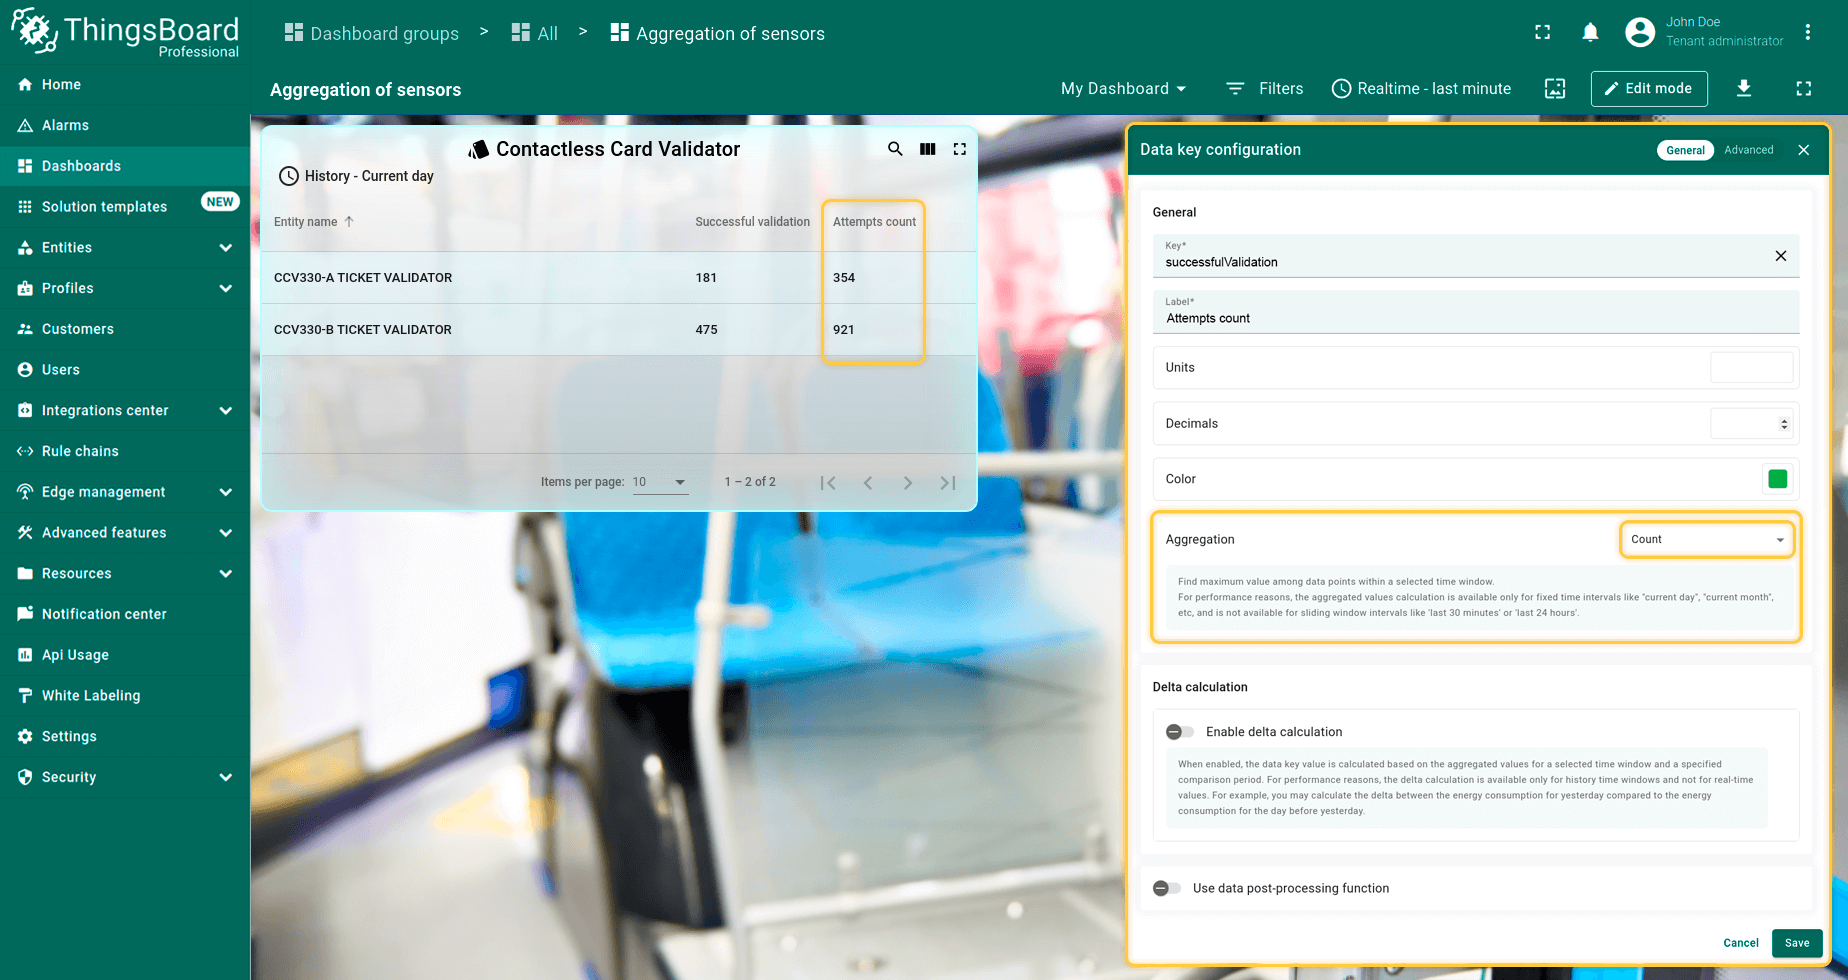
- Count:
计算所选时段内传输消息的总数。适用于电池供电设备调优或评估传感器激活灵敏度等场景。
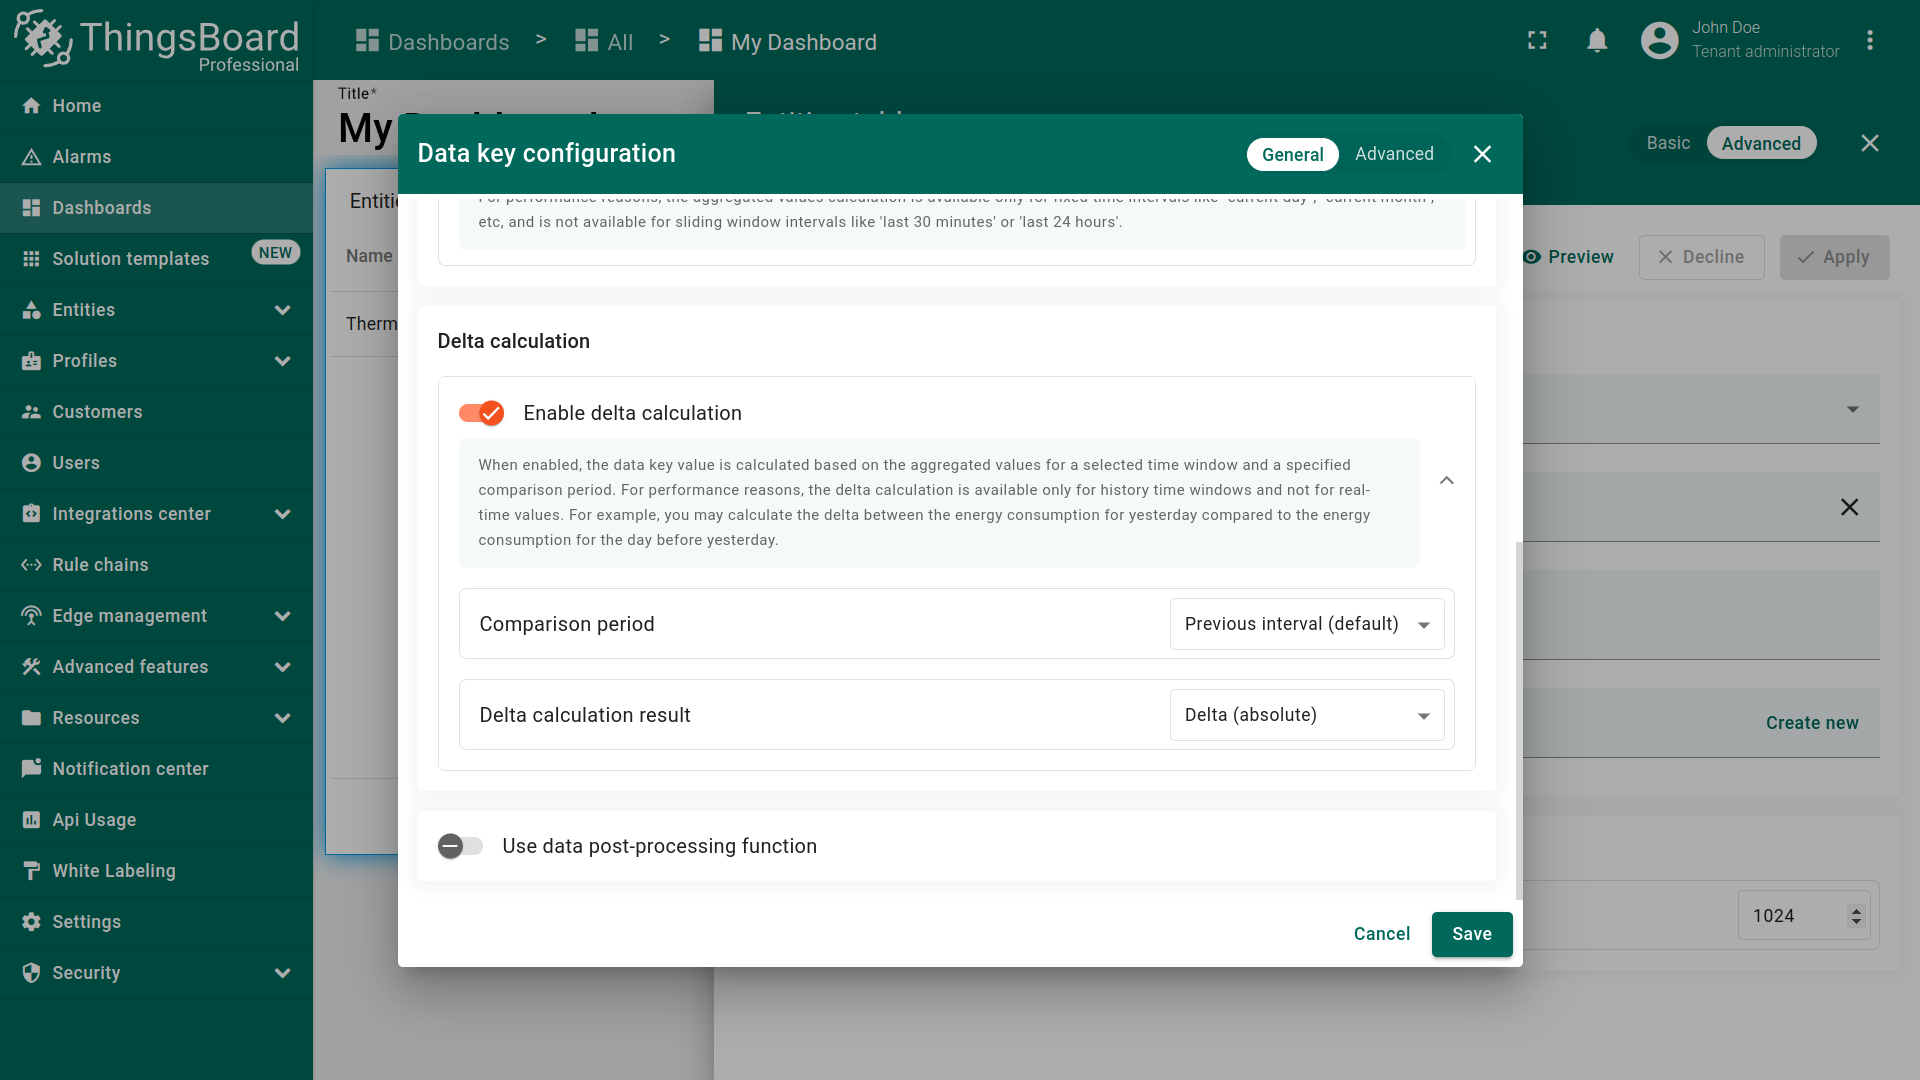
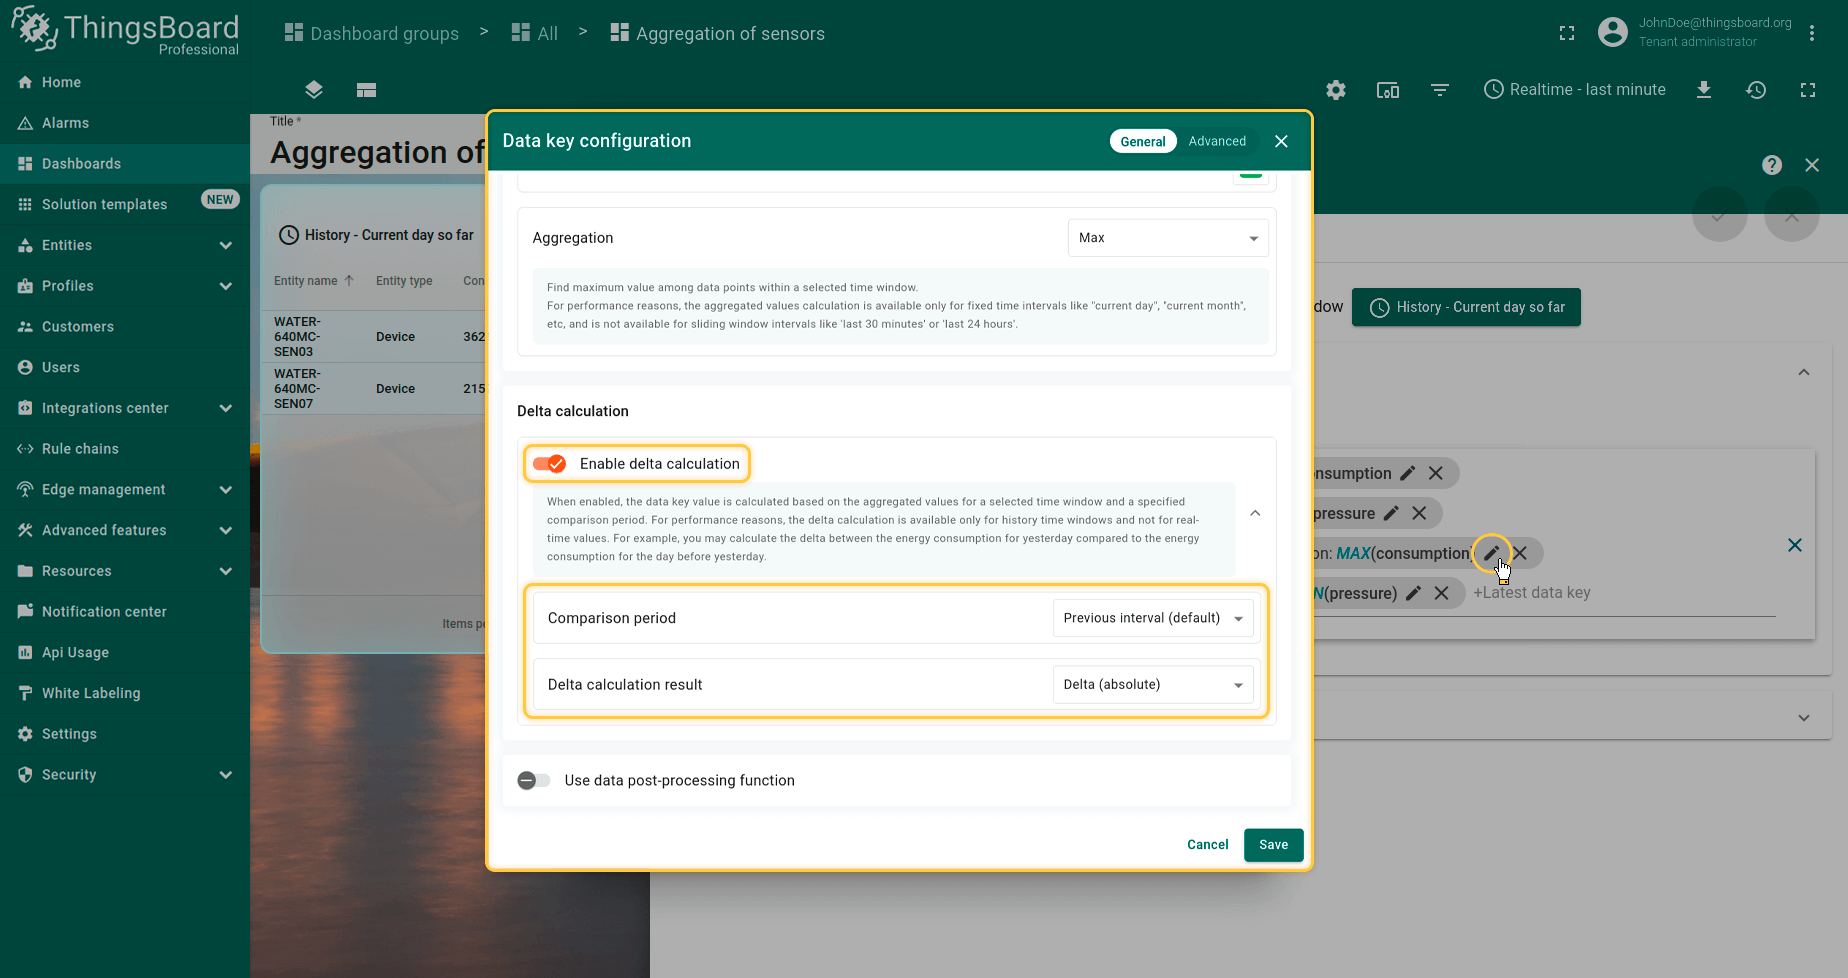
Delta function:
用于计算当前时间窗口与相对时间窗口聚合值之间的差值。
Comparison period — 以历史区间为基准,并根据所选选项进行换算的参数。可选值如下。
- Previous interval(默认)— 计算时不仅考虑时间,还考虑区间类型(Current day 或 Current day so far 等)。
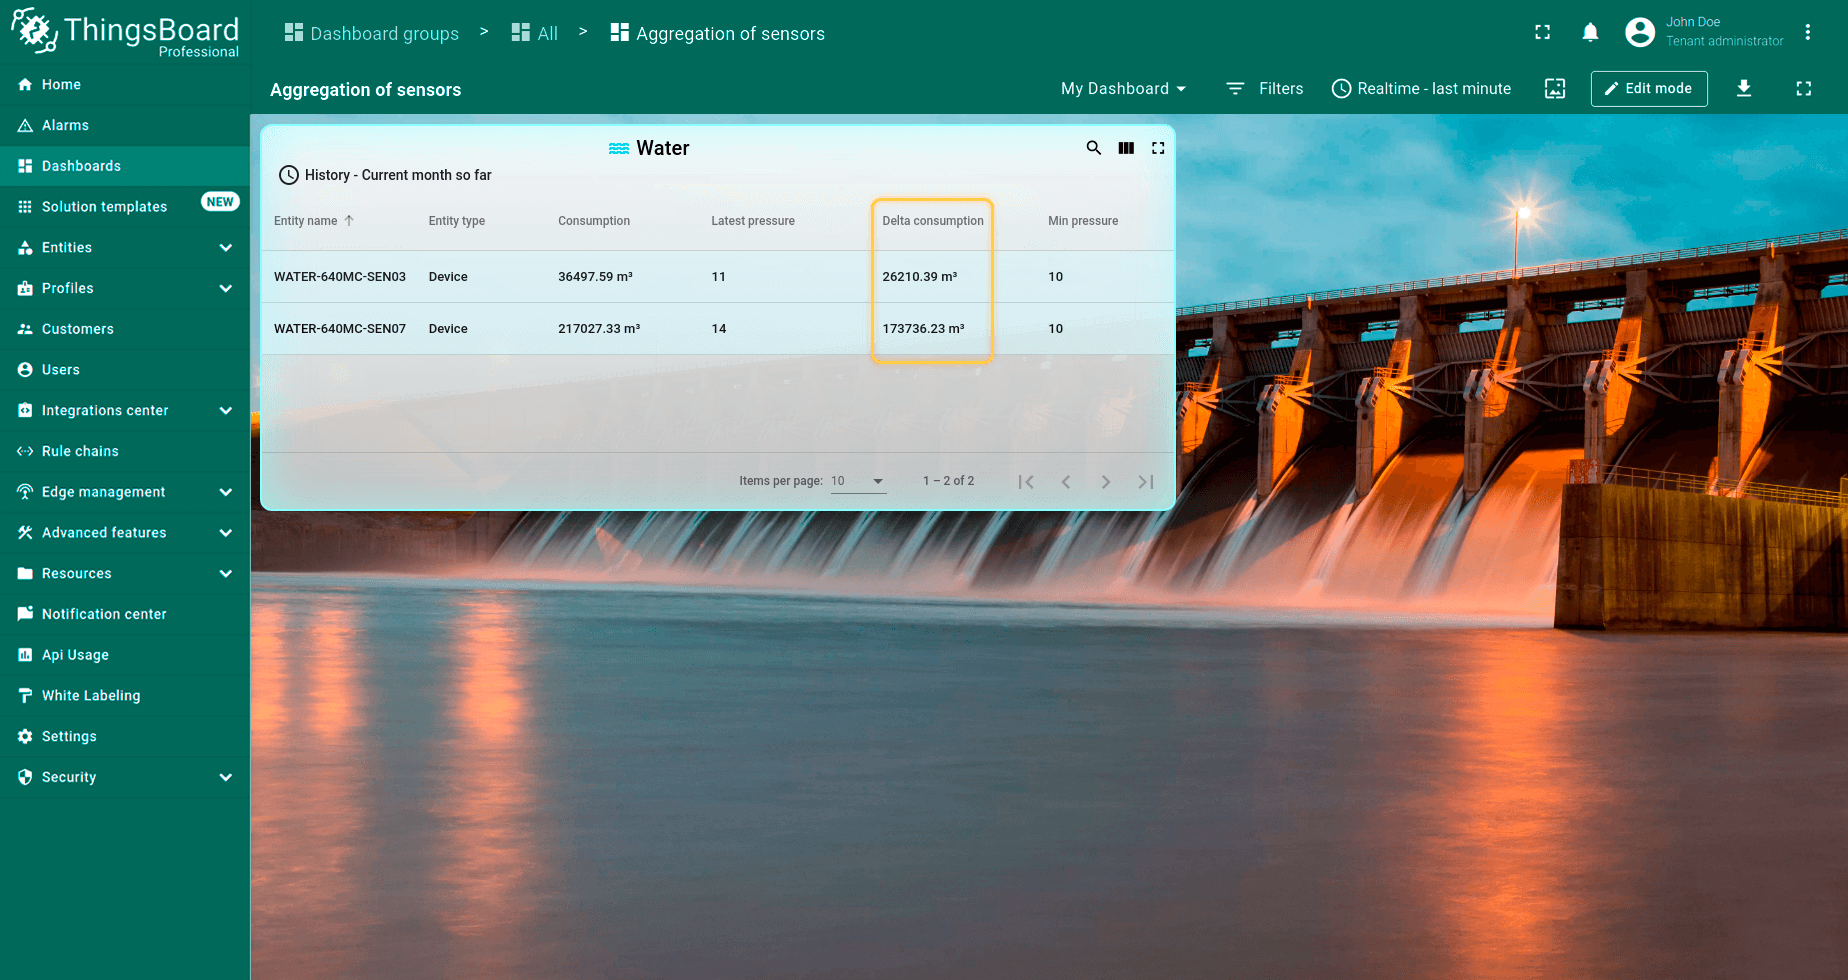
示例:History - Current month so far 若为1.09.22至25.09.22,则前一区间为1.08.22至25.08.22。
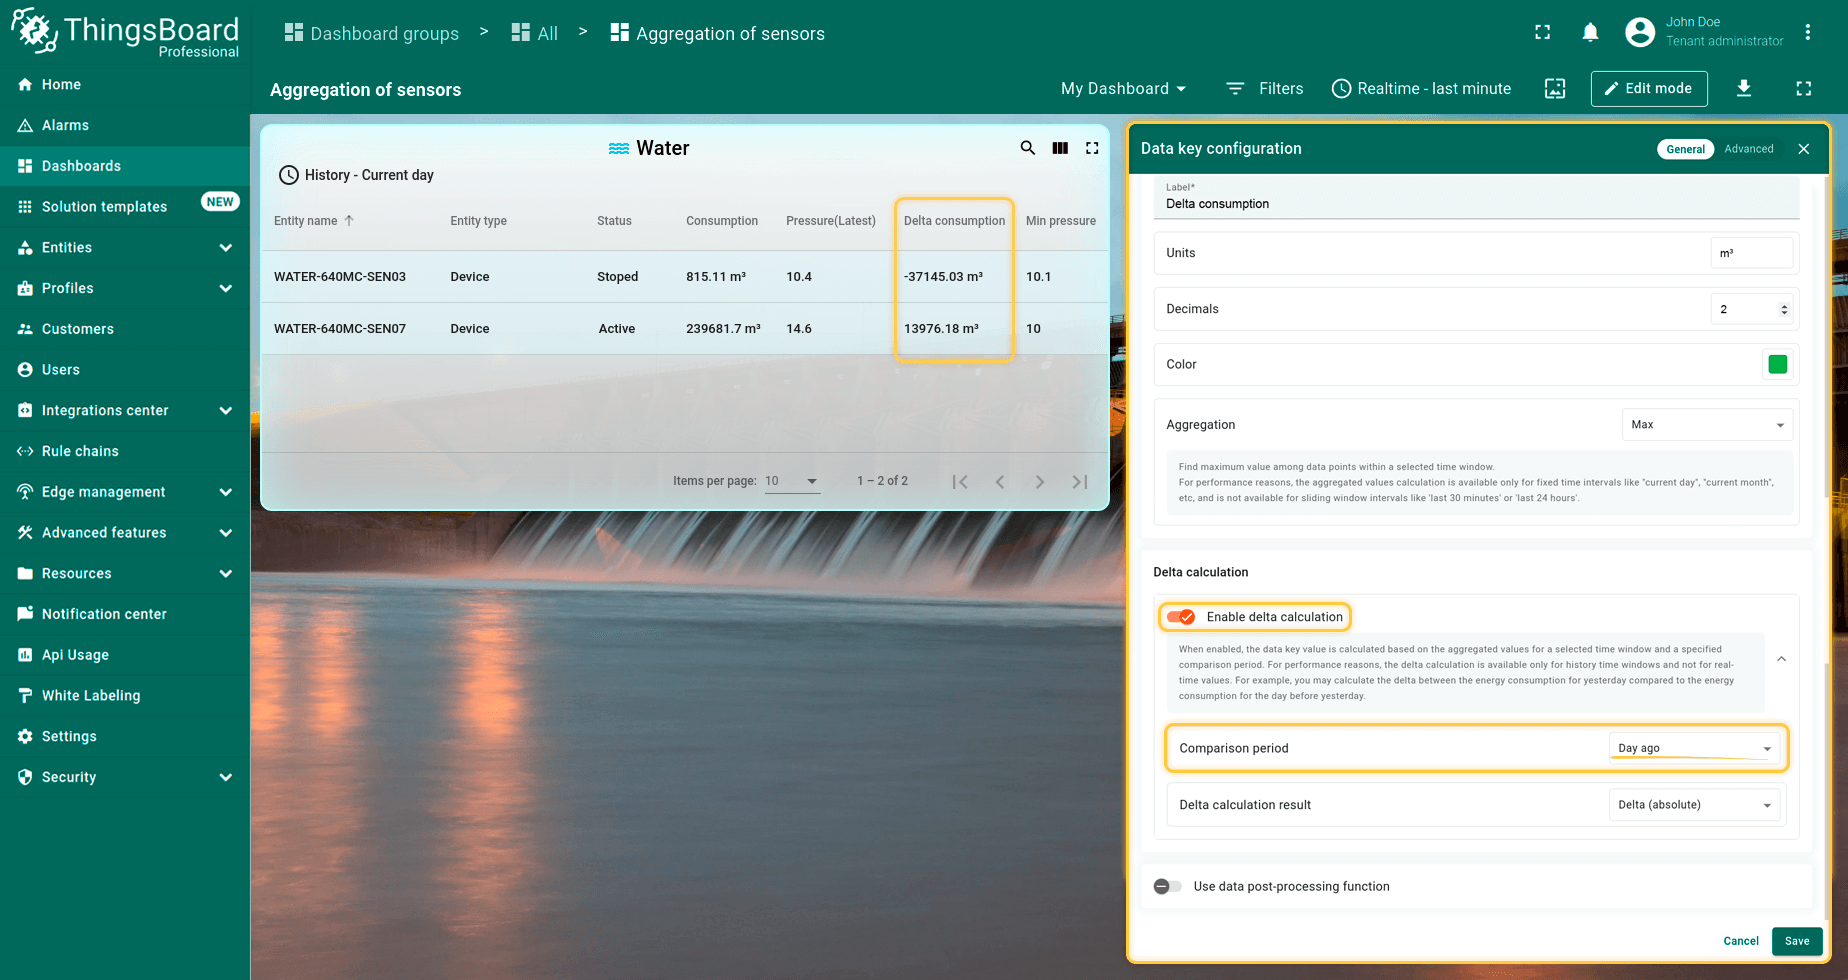
- Day ago — 以历史区间起止时间为基准,减去24小时。
例如:用水量 Current day 与 Delta - Day ago:
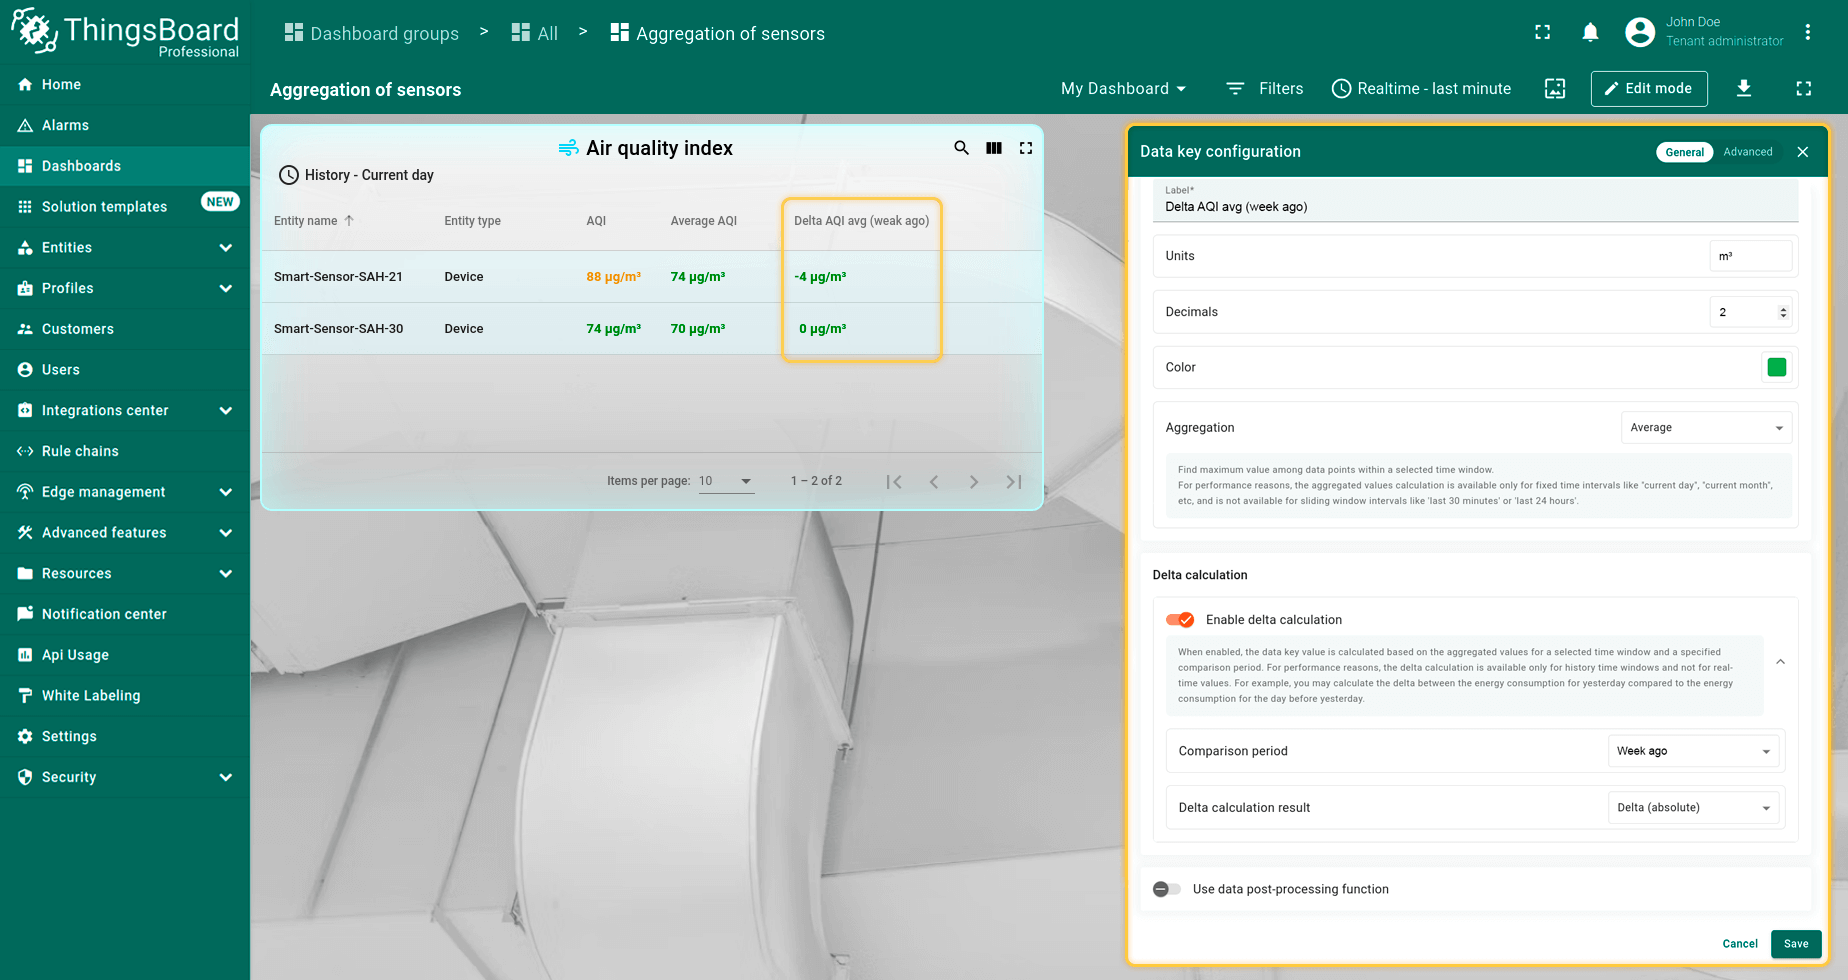
- Week ago — 历史区间前移一周(168小时)。
示例:平均值,历史区间 Current day,Delta Week ago:
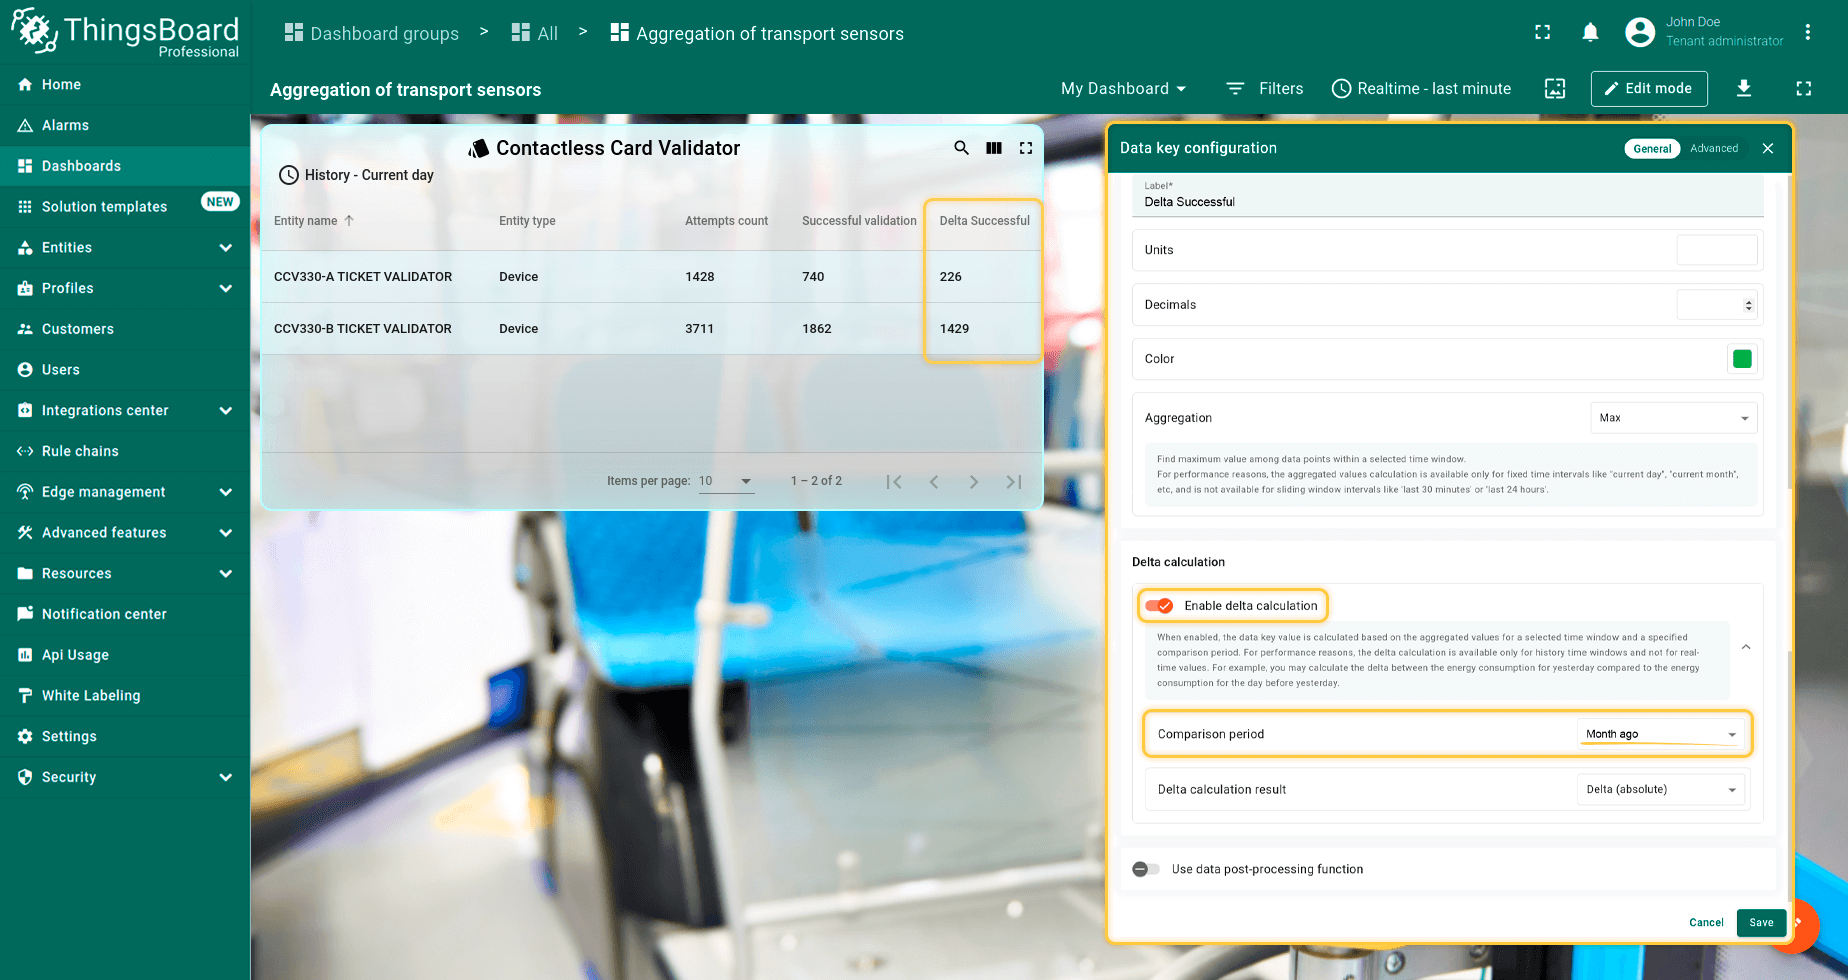
- Month ago — 与历史区间天数相同,从当前历史区间前移。例如当前为2月(28天),则 Month ago 为前28天,而非整月。
示例:用水量总和,历史 Current day,Delta - Month ago:
- Year ago — 当前历史区间前365天的区间。
若需对比上月与去年同月的聚合。

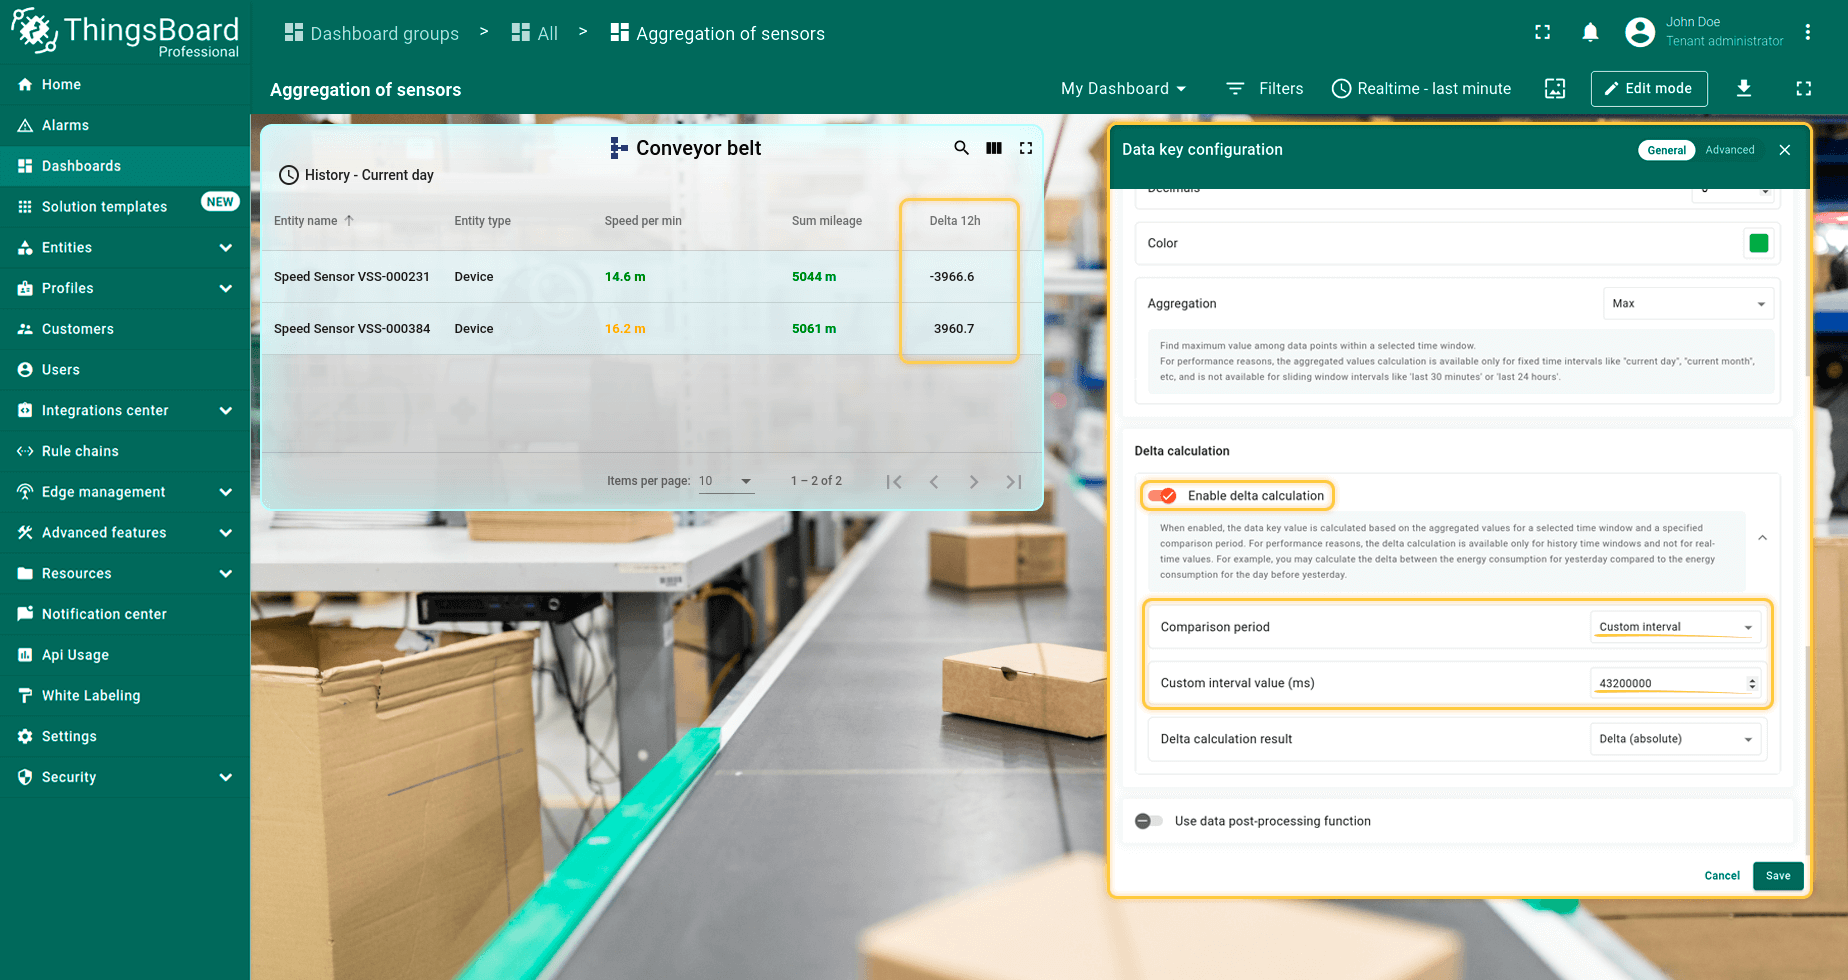
- Custom interval — 设置自定义区间。最大允许值受 int 类型限制。示例:43200000 = 12小时。
Delta calculation result:
用于指定结果的显示方式:
-
Previous Value — 显示对比区间(非当前历史区间)的聚合值。
-
Delta (absolute) — 显示两区间的差值(默认)。
-
Delta (percent) — 以相对前一区间的百分比显示
公式:(IntervalValue - prevIntervalValue)/prevIntervalValue*100
Data post-processing function(数据后处理函数)
数据后处理函数可在遥测值于部件中显示前对其进行实时转换。可通过自定义JavaScript逻辑处理每个数据点,如单位转换、异常过滤或衍生指标计算,而无需修改上游数据源。
使用方法:
- 在部件中 → 进入 Data keys 区域 → 点击目标数据键旁的 Pencil 图标。
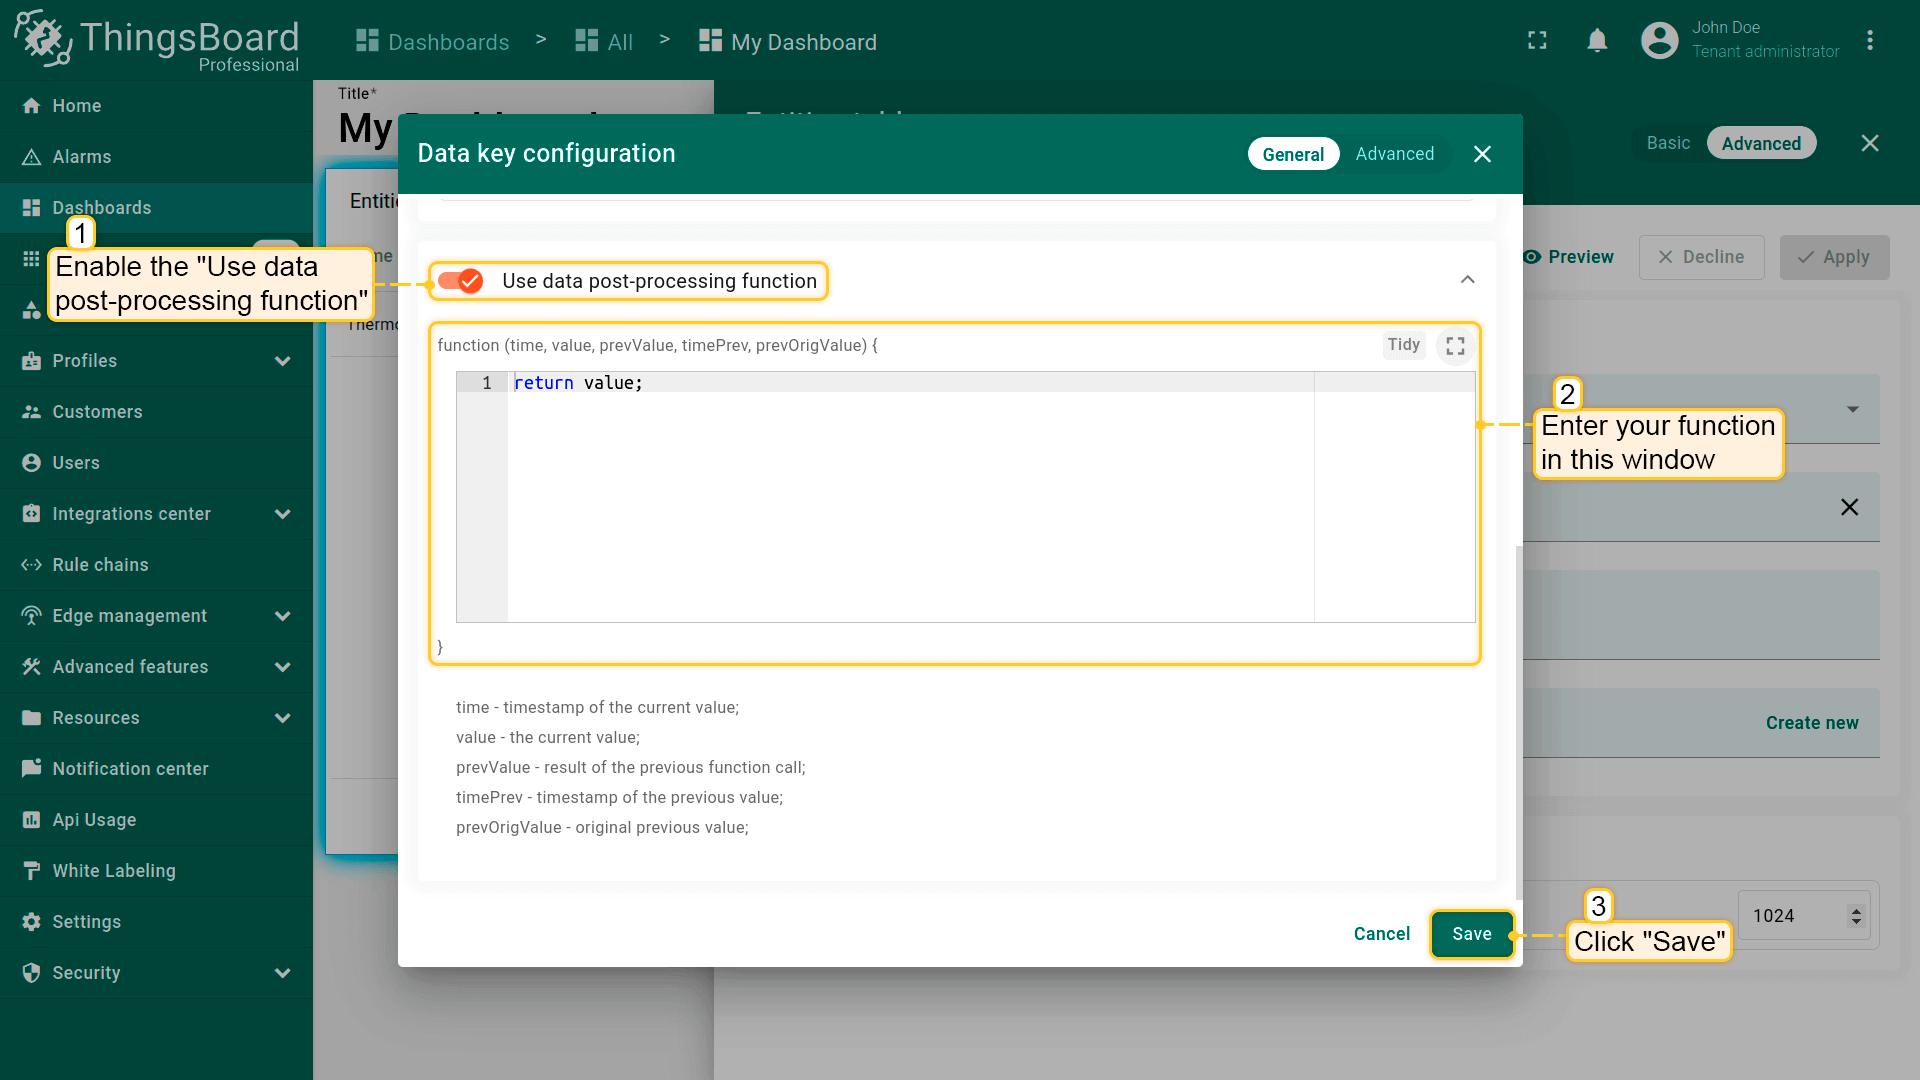
- 启用 Use data post-processing function 开关。
- 在函数体中输入代码。平台会自动注入函数头:
function (time, value, prevValue, timePrev, prevOrigValue) {
YOUR_JS_CODE
} - 点击 Save 按钮。
启用后,函数可访问以下参数:
- time — 当前值的时间戳;
- value — 当前值;
- prevValue — 上次函数调用的返回值;
- timePrev — 前一值的时间戳;
- prevOrigValue — 原始前一值。
函数须 return 一个值(number | string | boolean | null)。 返回 null 会将该数据点排除在可视化之外。
高级数据键设置
高级数据键配置用于控制部件中特定数据键列的可见性、样式和外观。 实体表部件、告警表部件和实体管理部件捆绑包共用同一套高级数据键配置。 图表部件捆绑包有独立的高级数据键配置。其他部件捆绑包仅提供基础数据键配置。
更多详见此处。
Filters
Filters 用于限定部件从数据源获取的数据范围。通过添加键并为这些键定义条件来构建过滤器,支持组合多个键和条件。
键类型:
添加过滤器时,可选择下列键类型之一:
- Entity field.实体内置字段 (如 device name、type、label、createdTime 等),适用于按元数据而非遥测筛选实体。
- Attribute。通用属性键,无需区分属性存储位置时使用。
- Client attribute。由设备/Edge客户端设置或上报的属性(通常经MQTT/HTTP/CoAP)。示例:设备运行时上报的固件 build。
- Server attribute。平台存储且通常由用户或服务配置的属性。示例:targetTemperature、threshold。
- Shared attribute。常用于从服务器向设备下发配置(如 displayUnits)。
- Time series。表示随时间变化的遥测键(如 temperature、humidity、voltage),适用于基于近期或历史读数的条件。
Operations
使用运算定义键与值的比较方式:equal、not equal、greater than、less than、greater or equal、less or equal。
比较值可使用固定字面量或 Dynamic source type。动态源使过滤器在运行时从上下文获取值,例如:”temperature greater or equal than targetTemperature(server attribute)”或”voltage less than 用户在 control widget 中选择的值”。
提示: 对于可能变化的阈值,优先使用 Dynamic source,以免每次值更新时都需修改过滤器。
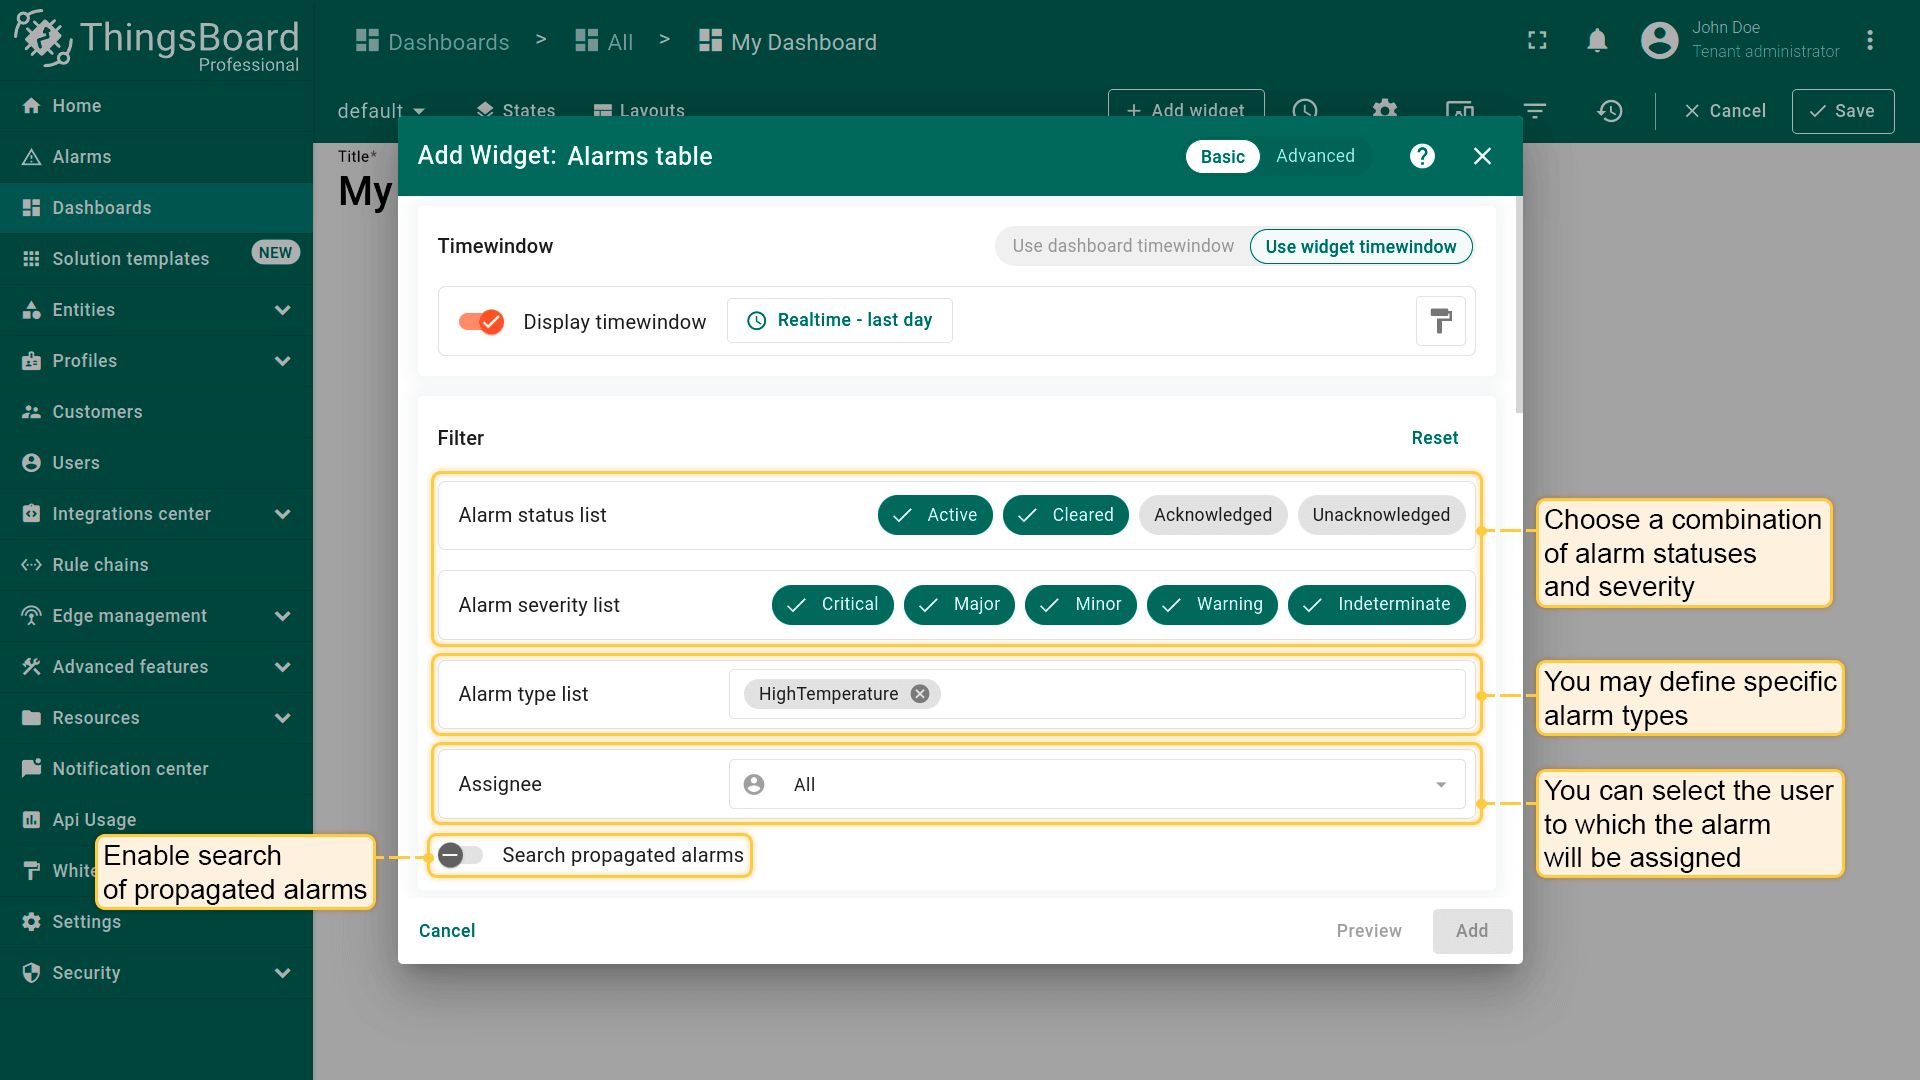
告警过滤(Alarm filter)
告警部件可按状态、严重程度和类型筛选告警。 可组合选择告警状态和严重程度,也可指定告警类型并启用传播告警的搜索。
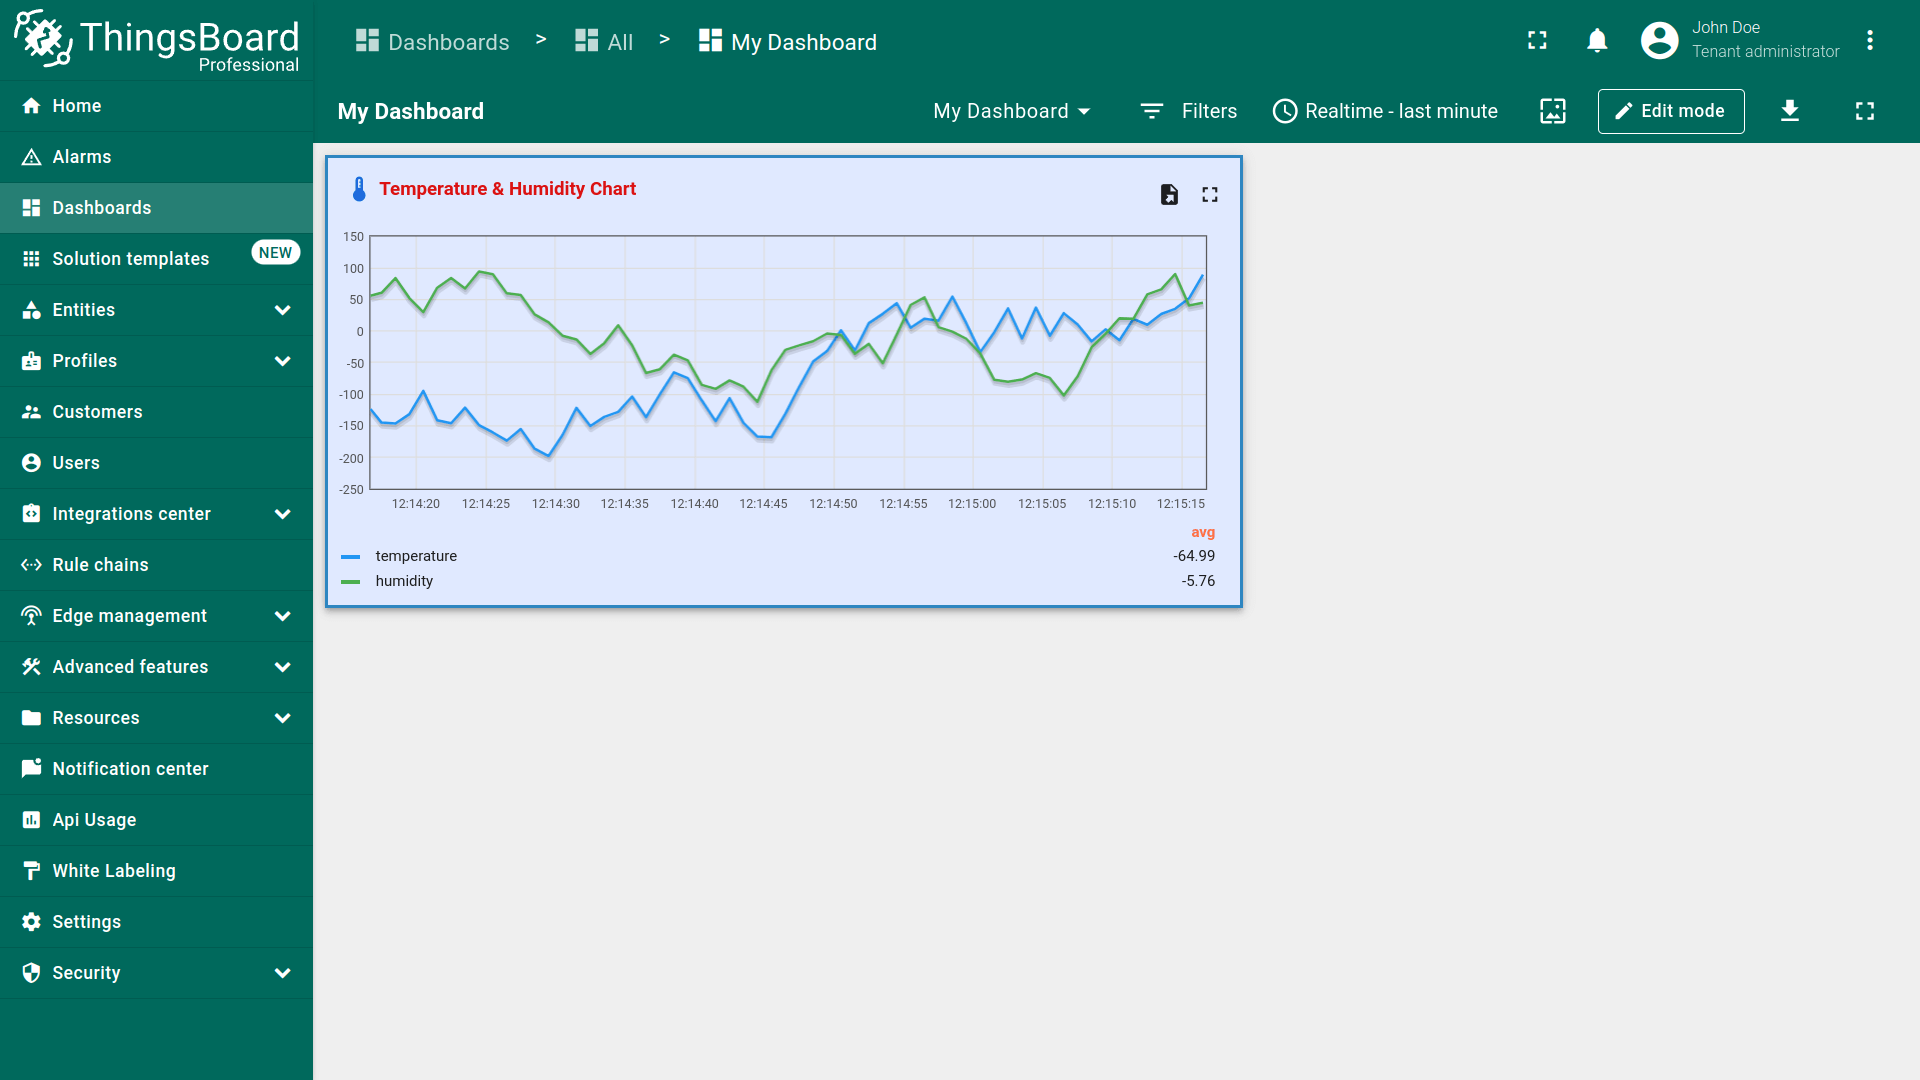
外观(Appearance)
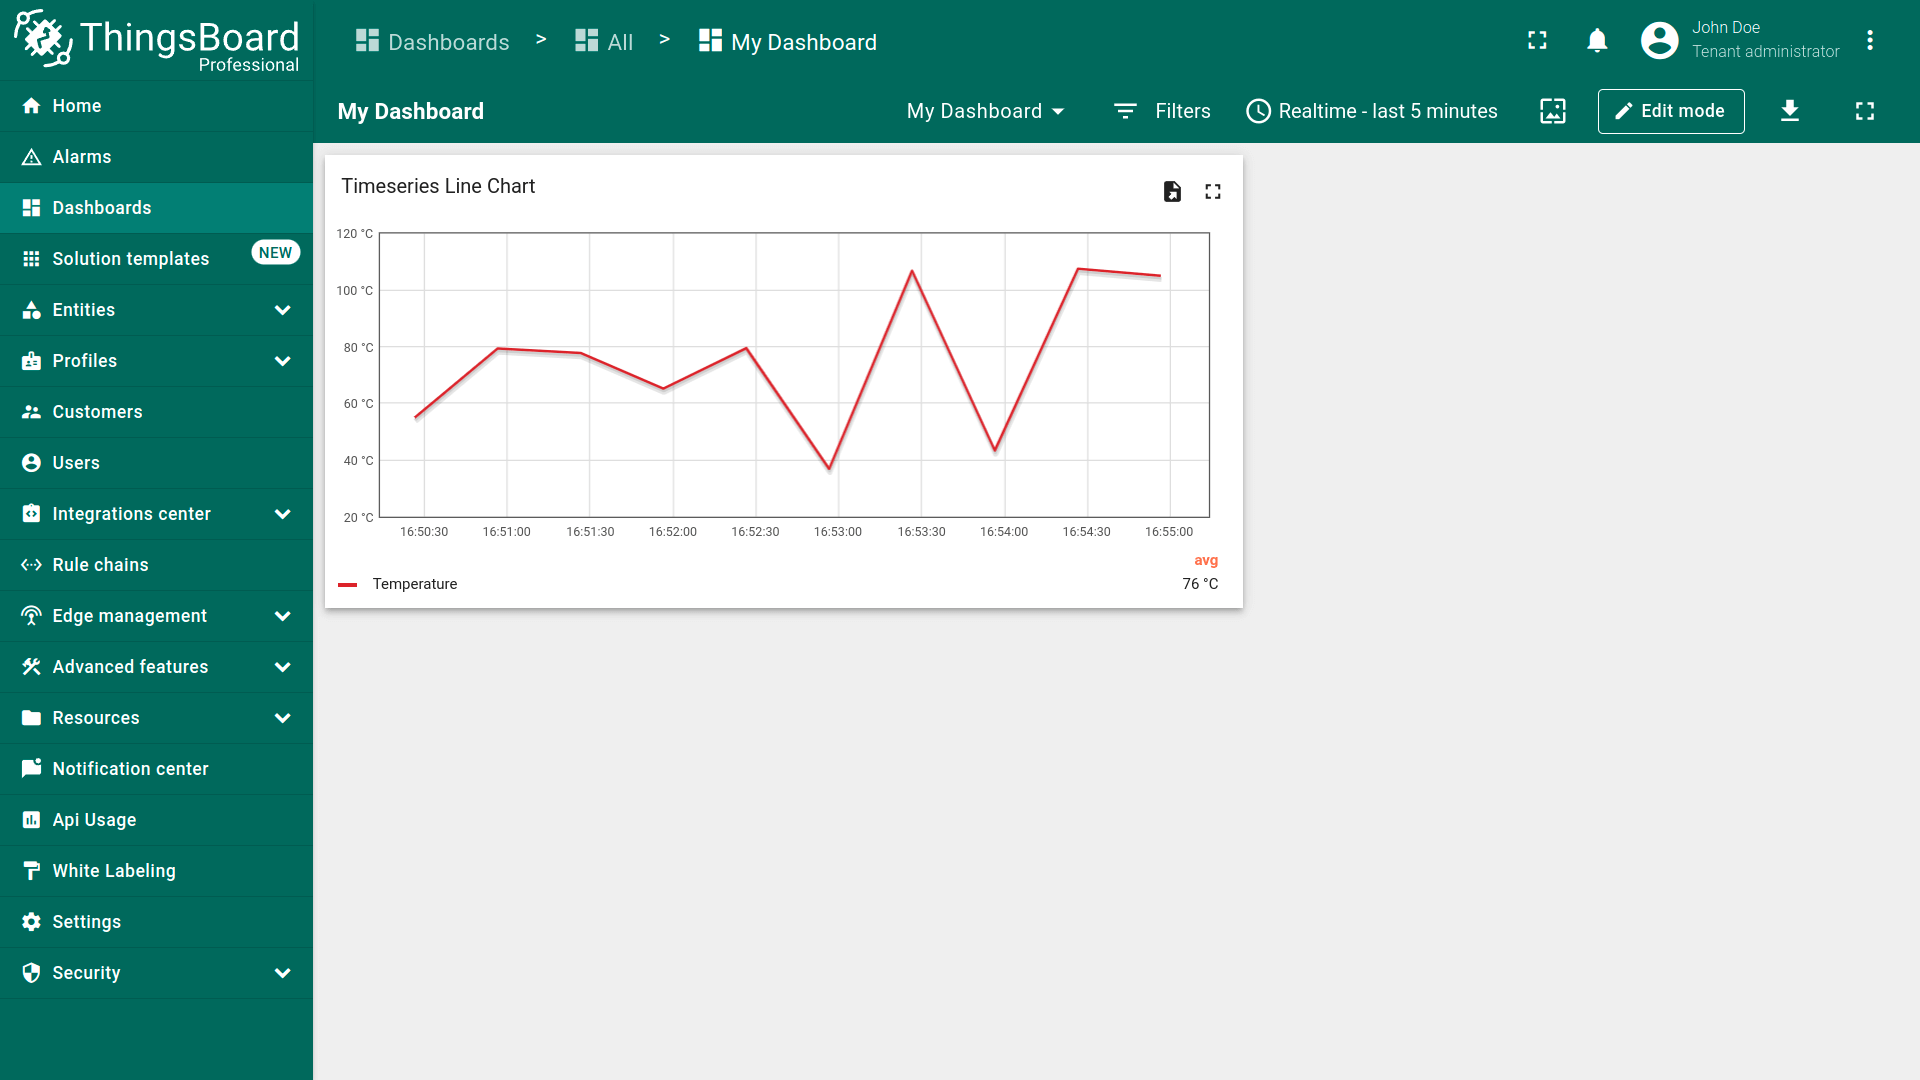
假设已添加\u201cTimeseries Line Chart\u201d部件,仅通过数据配置步骤展示温度计数据。 应能看到类似部件(需发送或模拟数据才能看到图表中的实际线条):
下面使用基础部件设置定制部件,并说明每项设置对部件的影响。
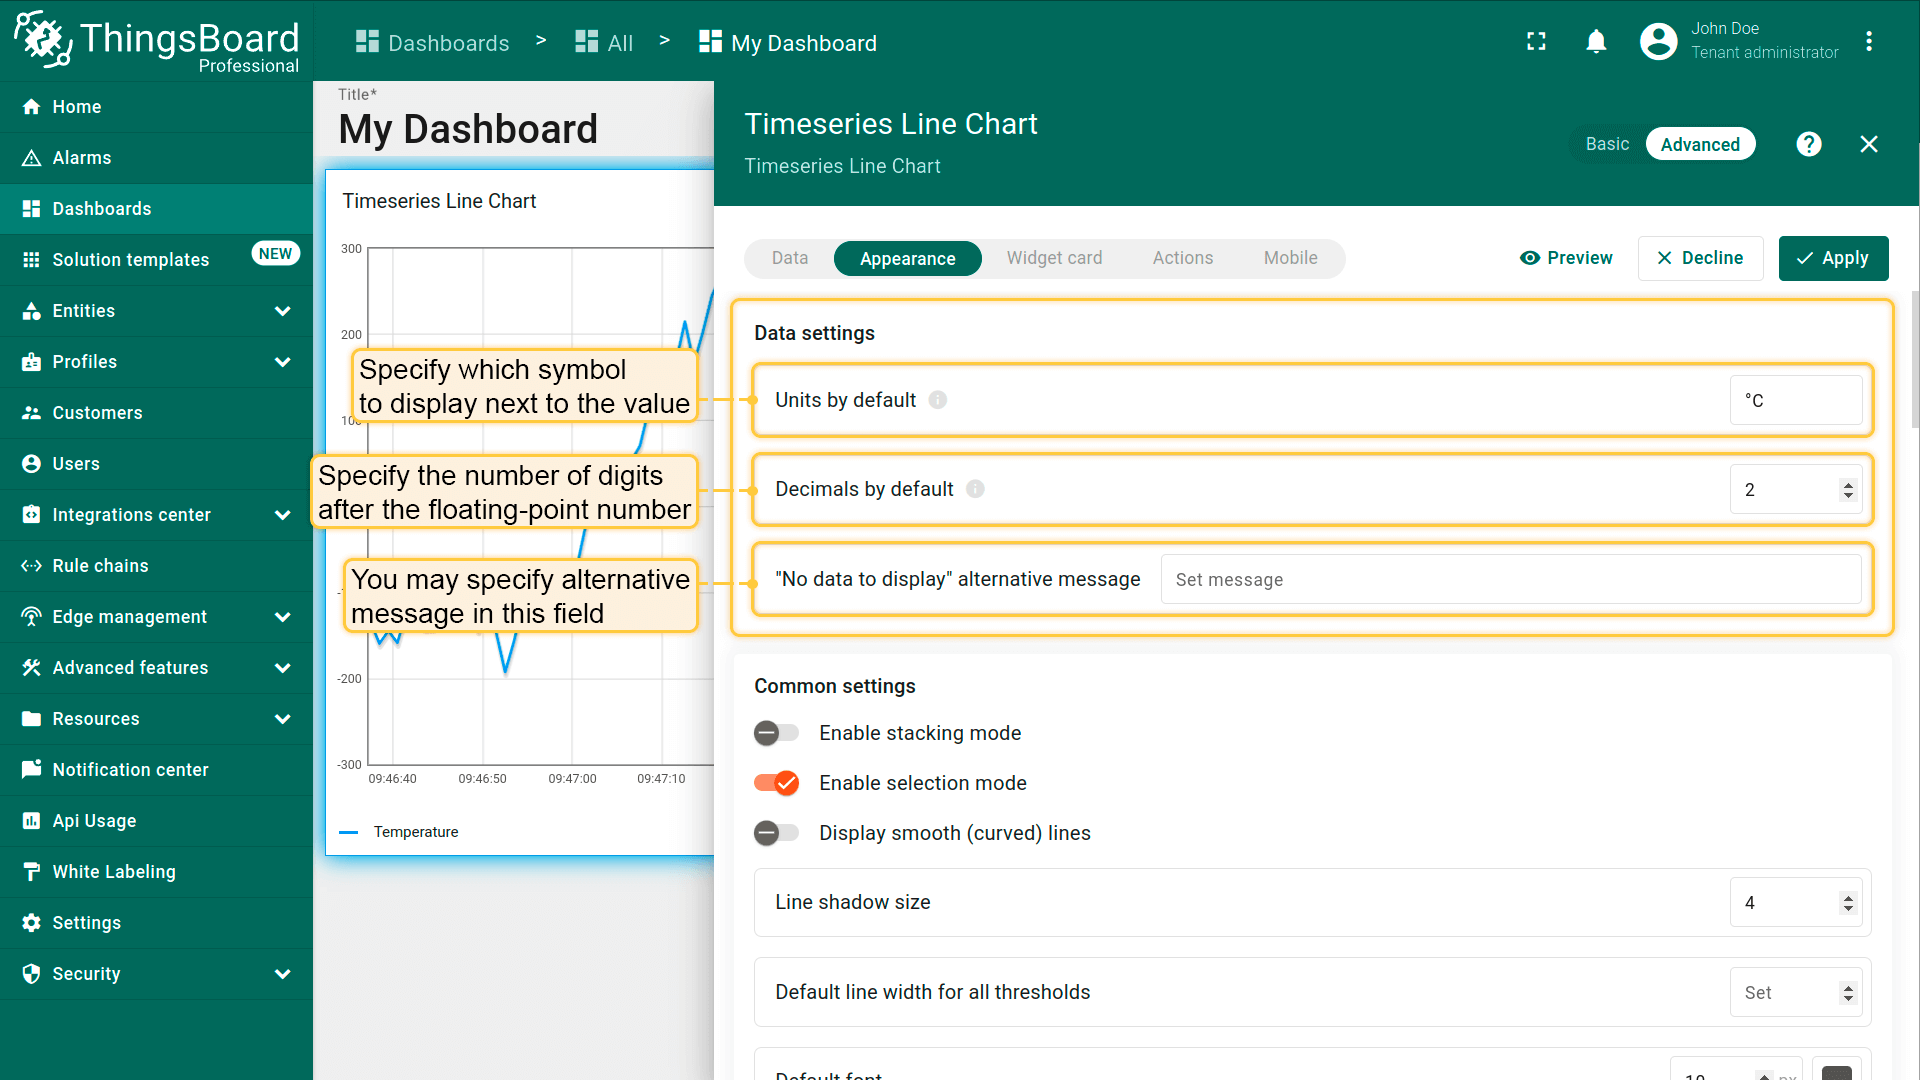
数据设置
可设置显示在数值旁的符号及浮点数的小数位数。若要为所有坐标轴应用相同设置,可使用此处配置。
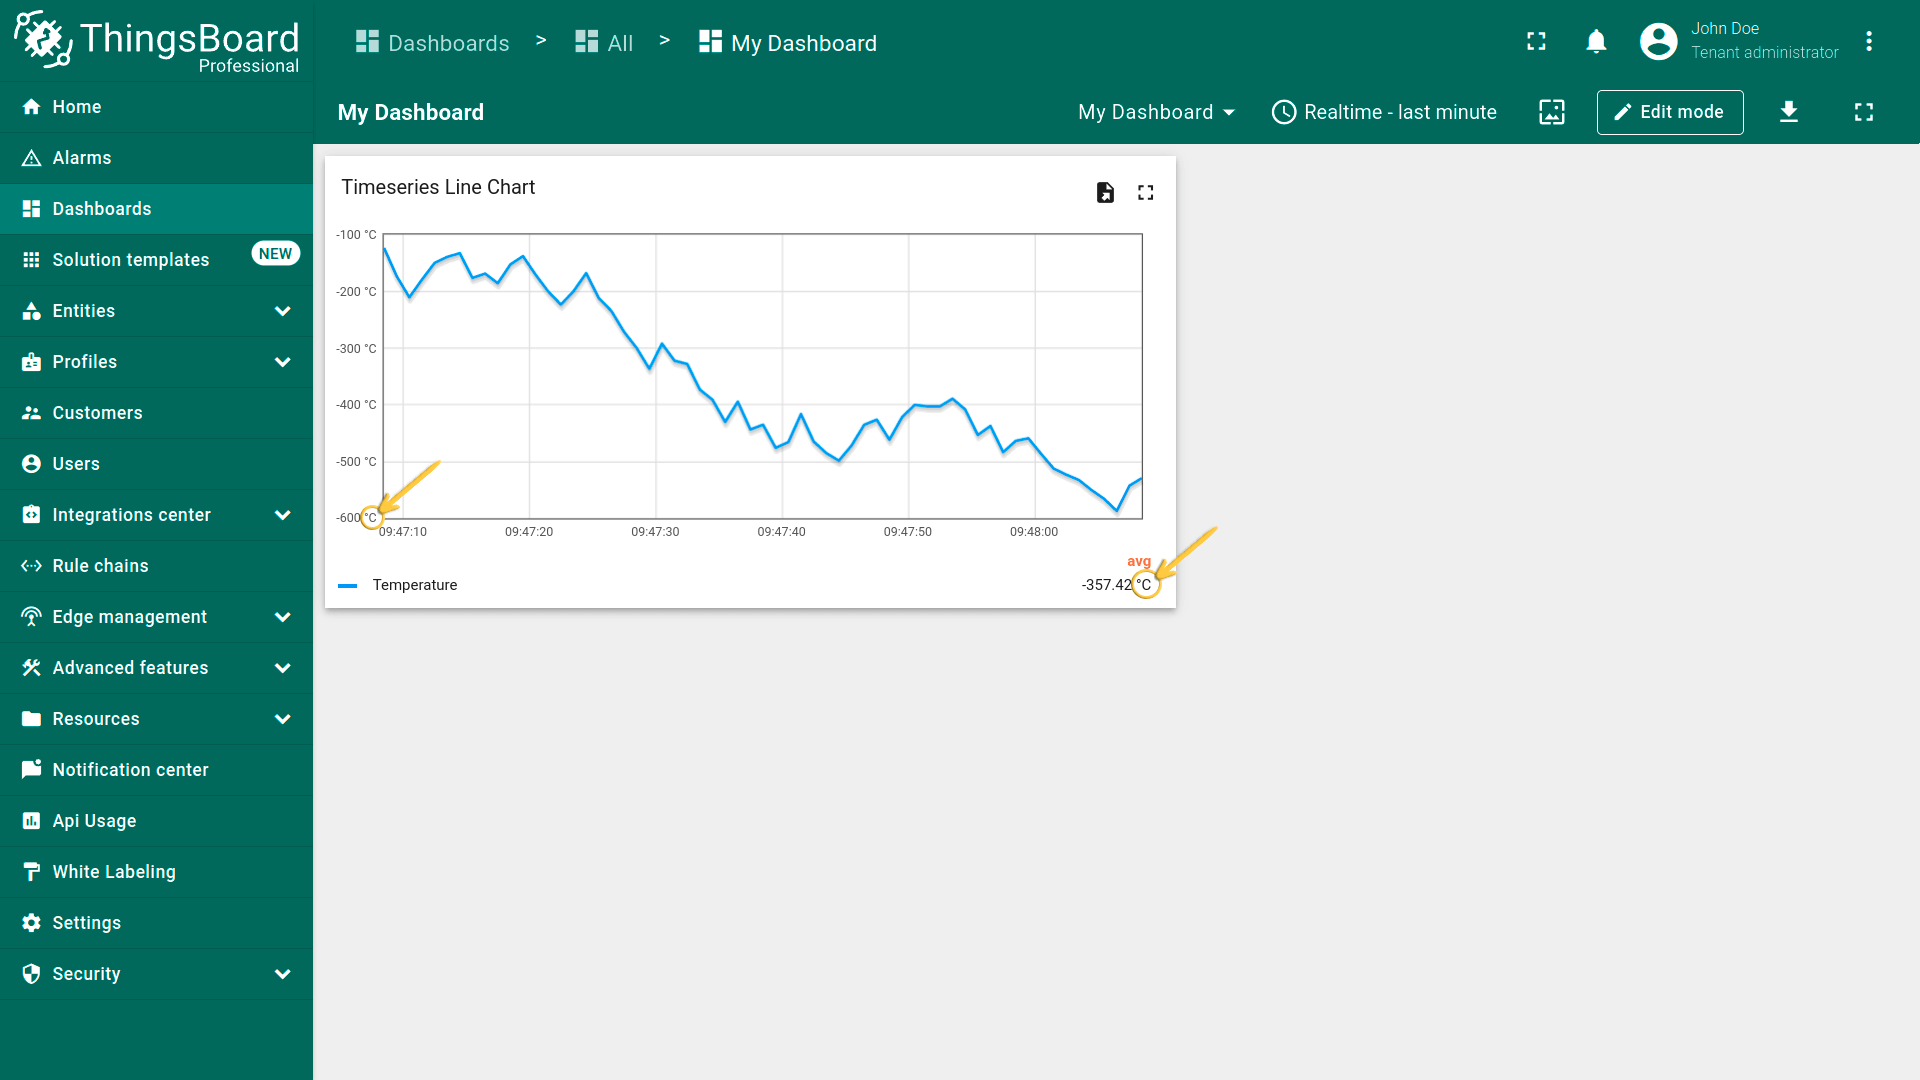
-
Units by default。若为多台设备展示温度读数,可添加符号(如 °C或 °F)。若同时展示温度和湿度,需在数据键设置中分别配置。
-
Decimals by default。当数据键无自定义格式时,控制显示的小数位数。
-
“No data to display” message。当部件在所选时间窗口内无数据或无法渲染(如缺少键)时显示的自定义提示,用于引导下一步操作。
示例:
• “No data to display”
• “未找到所选时间范围内的数据” • “未接收到遭遇数据—不验查设备连接或时间范围”
通用设置
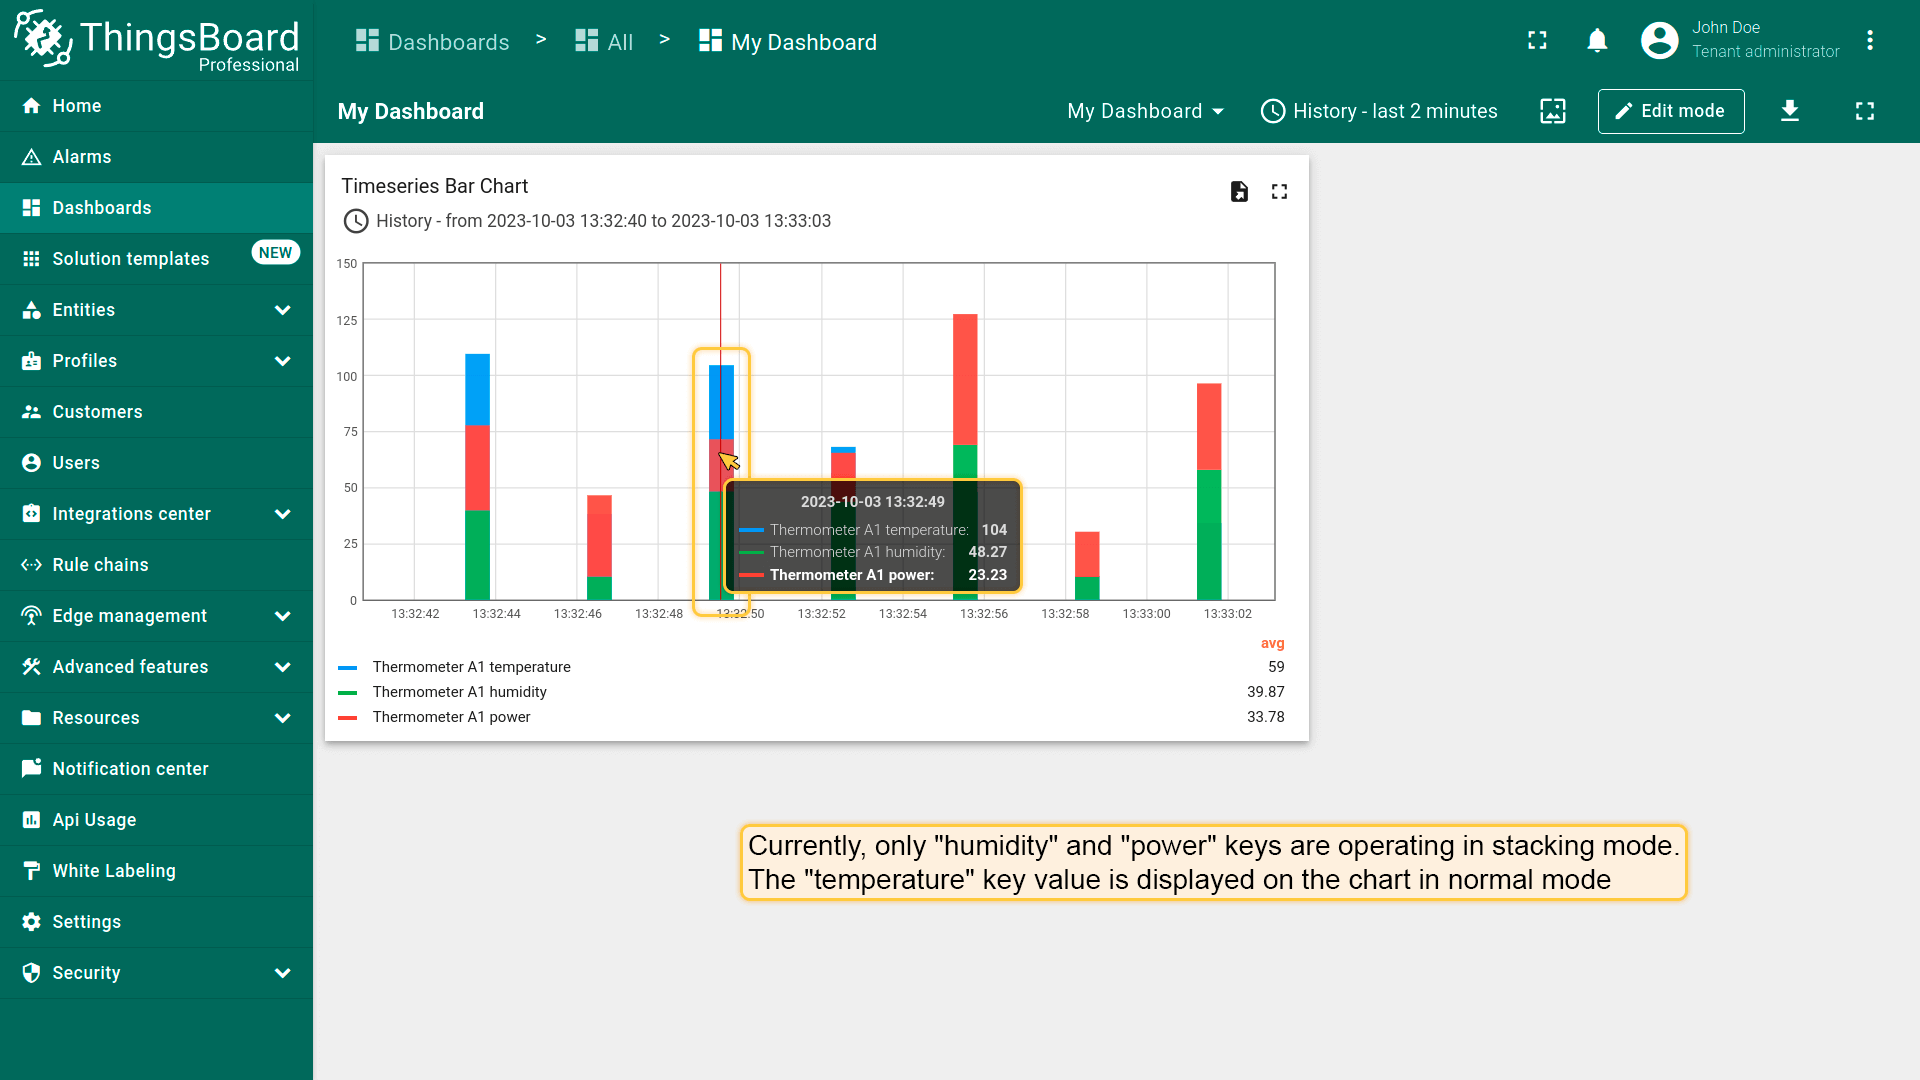
堆叠模式(Stacking mode)
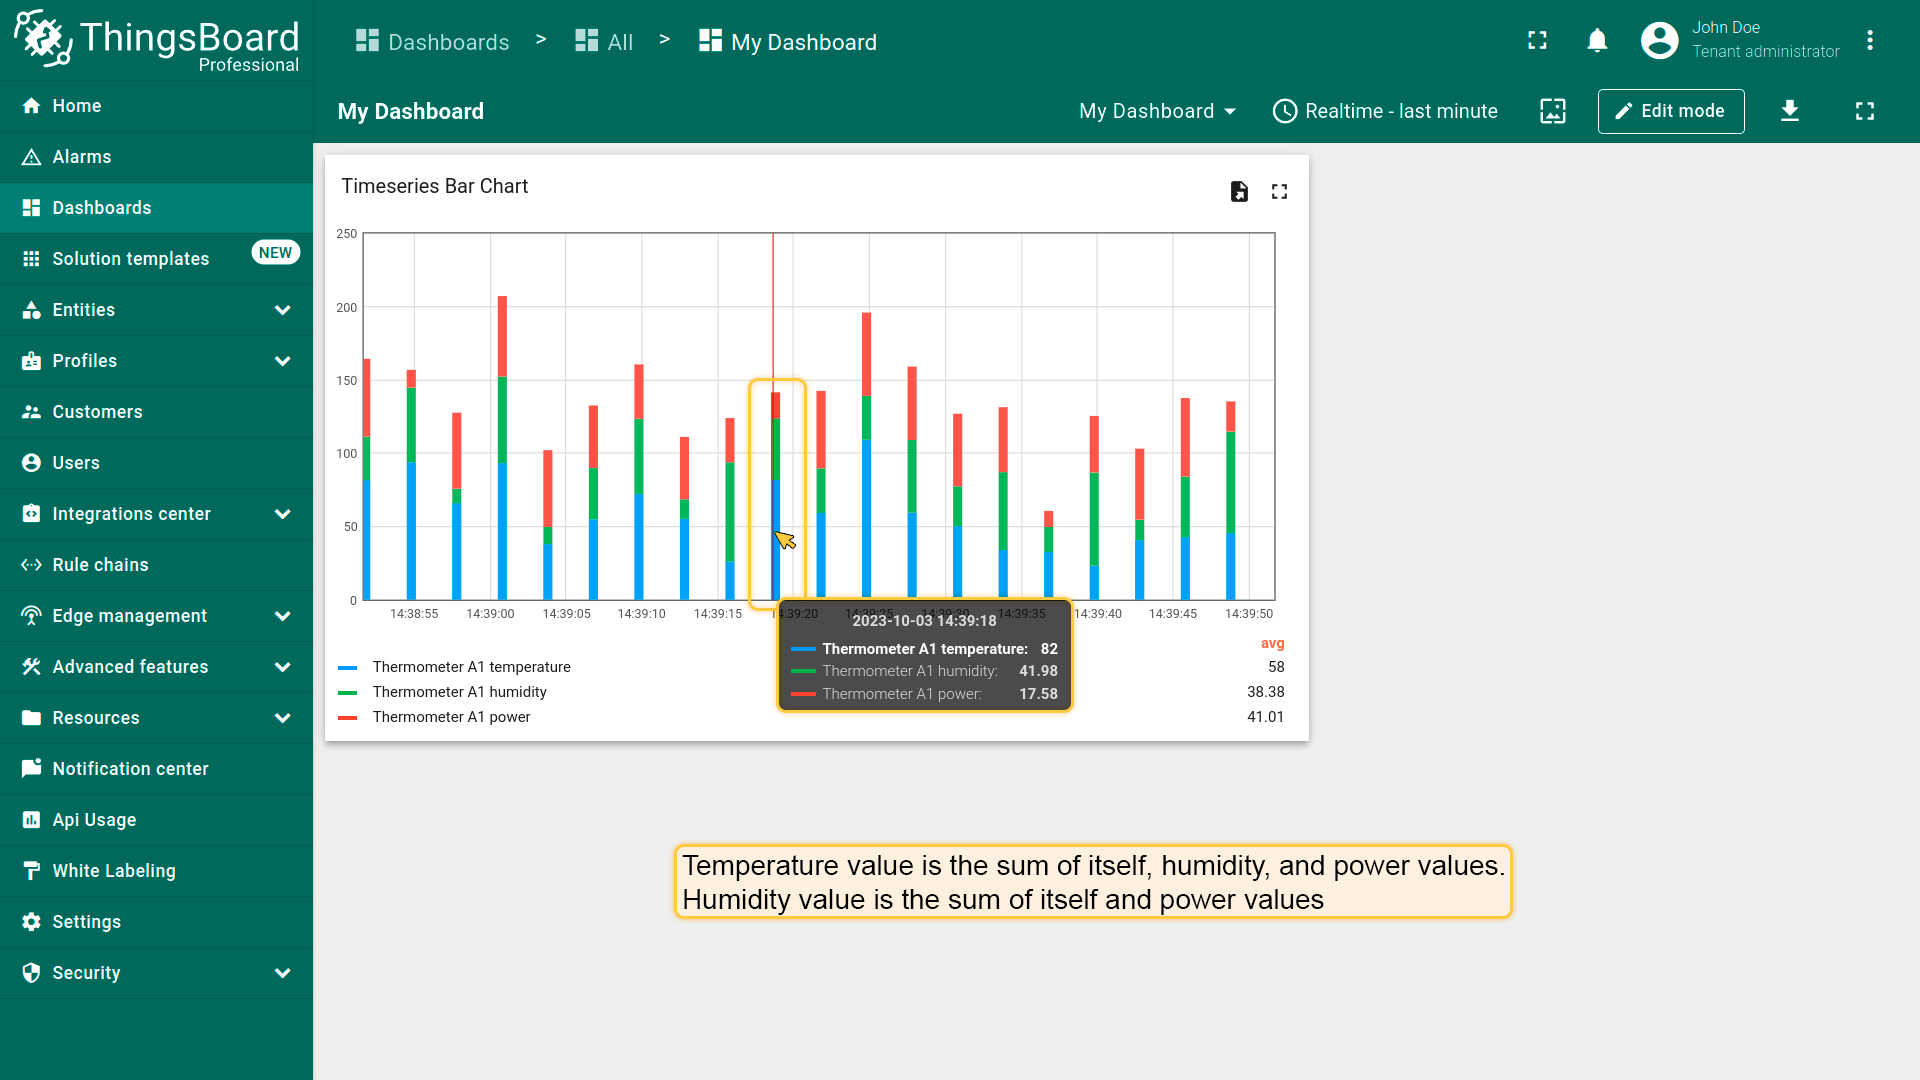
此选项适用于\u201cTimeseries Bar Chart\u201d部件。 Stacking mode将实体值求和显示以避免重叠,不同值以不同颜色区分。 仅当数据聚合函数未设为None时可用。 未启用\u201cEnable stacking mode\u201d时,柱状图将按各实体值拆分显示。 需将鼠标悬停在柱子上才能查看所有实体的值。
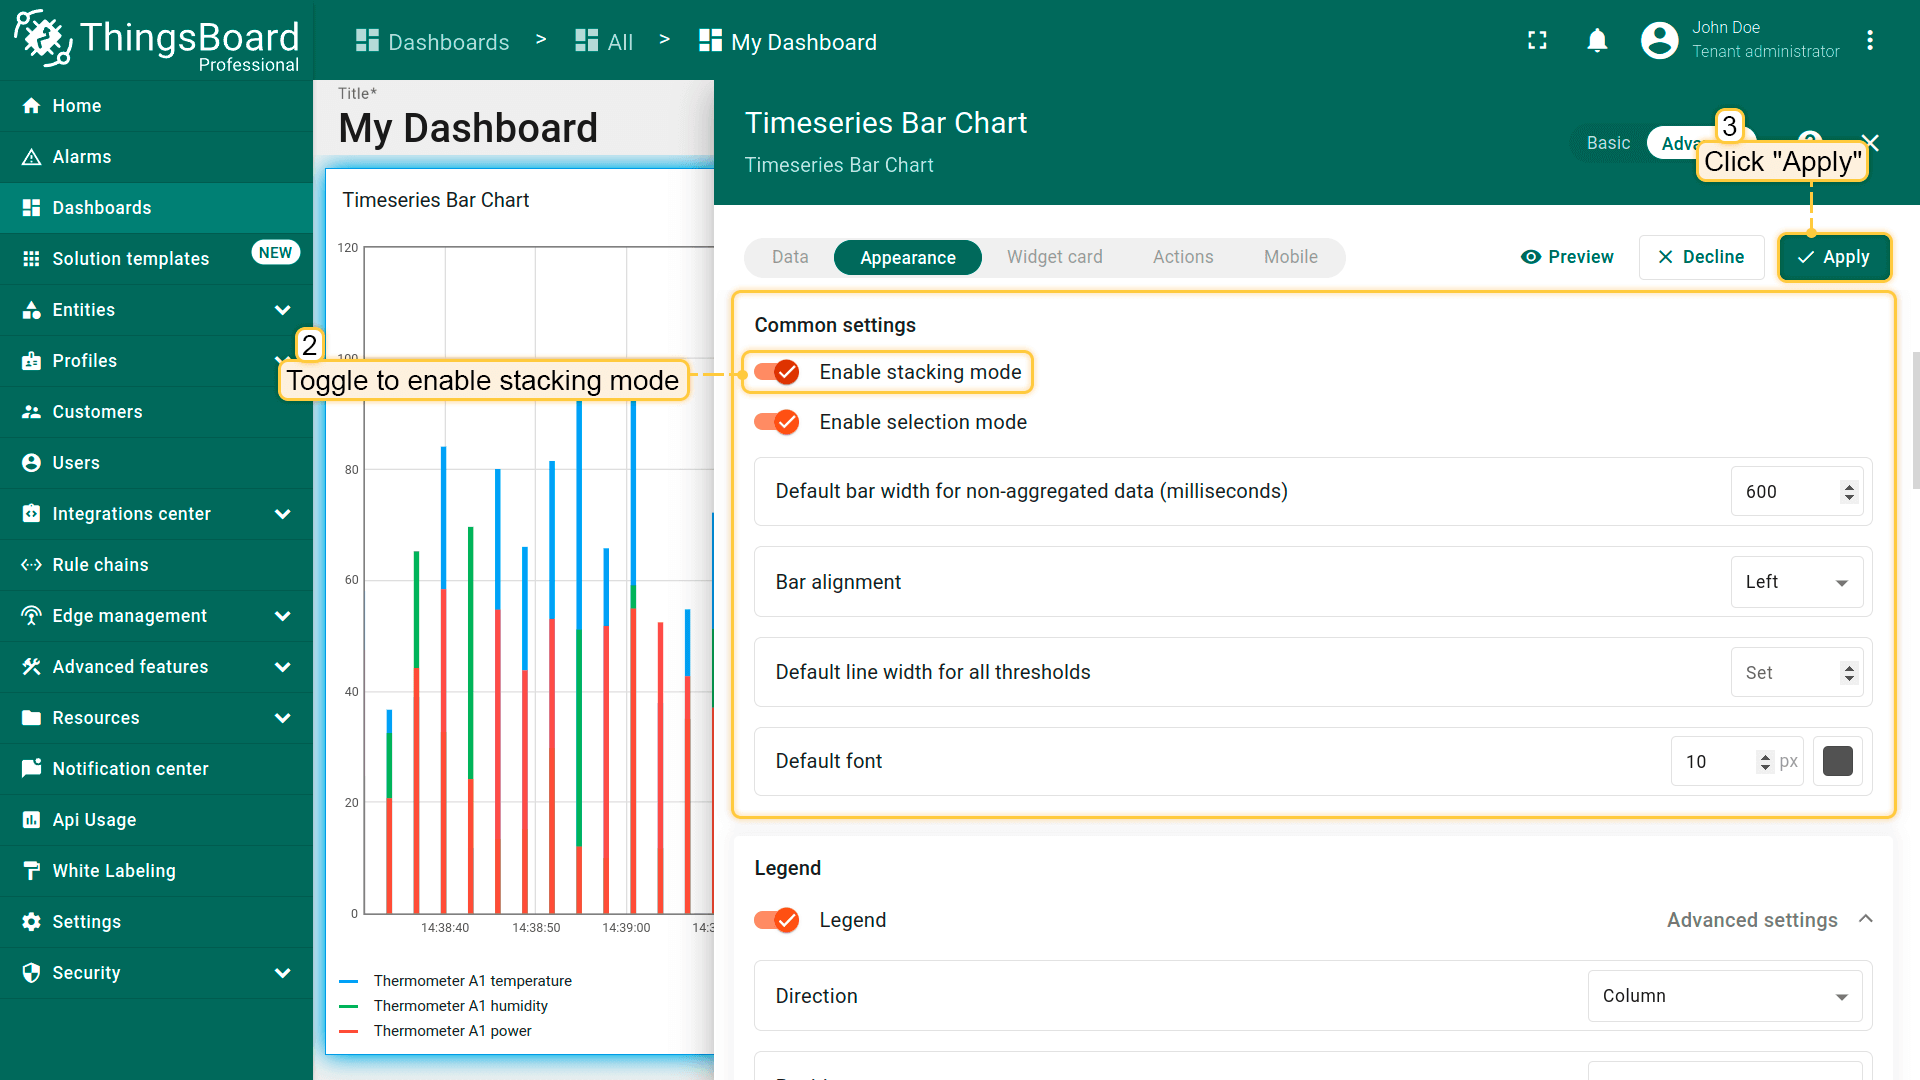
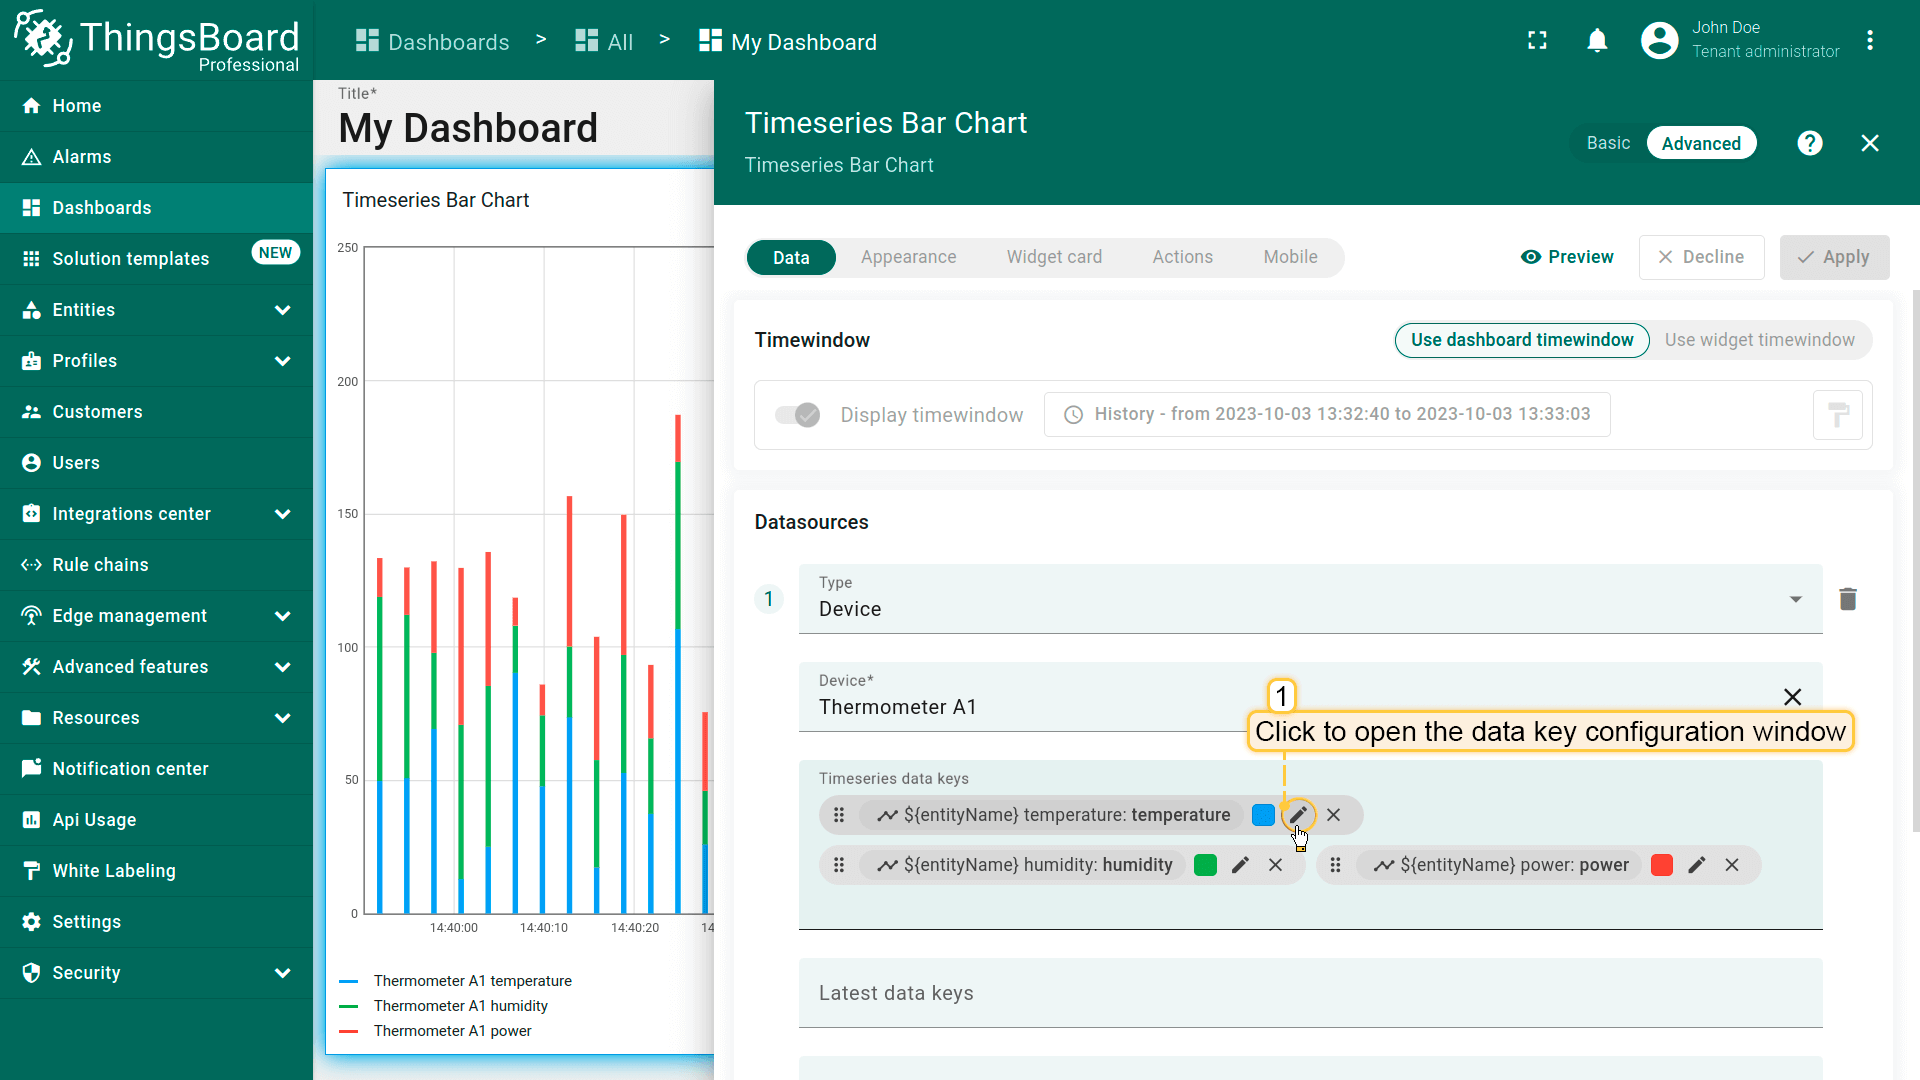
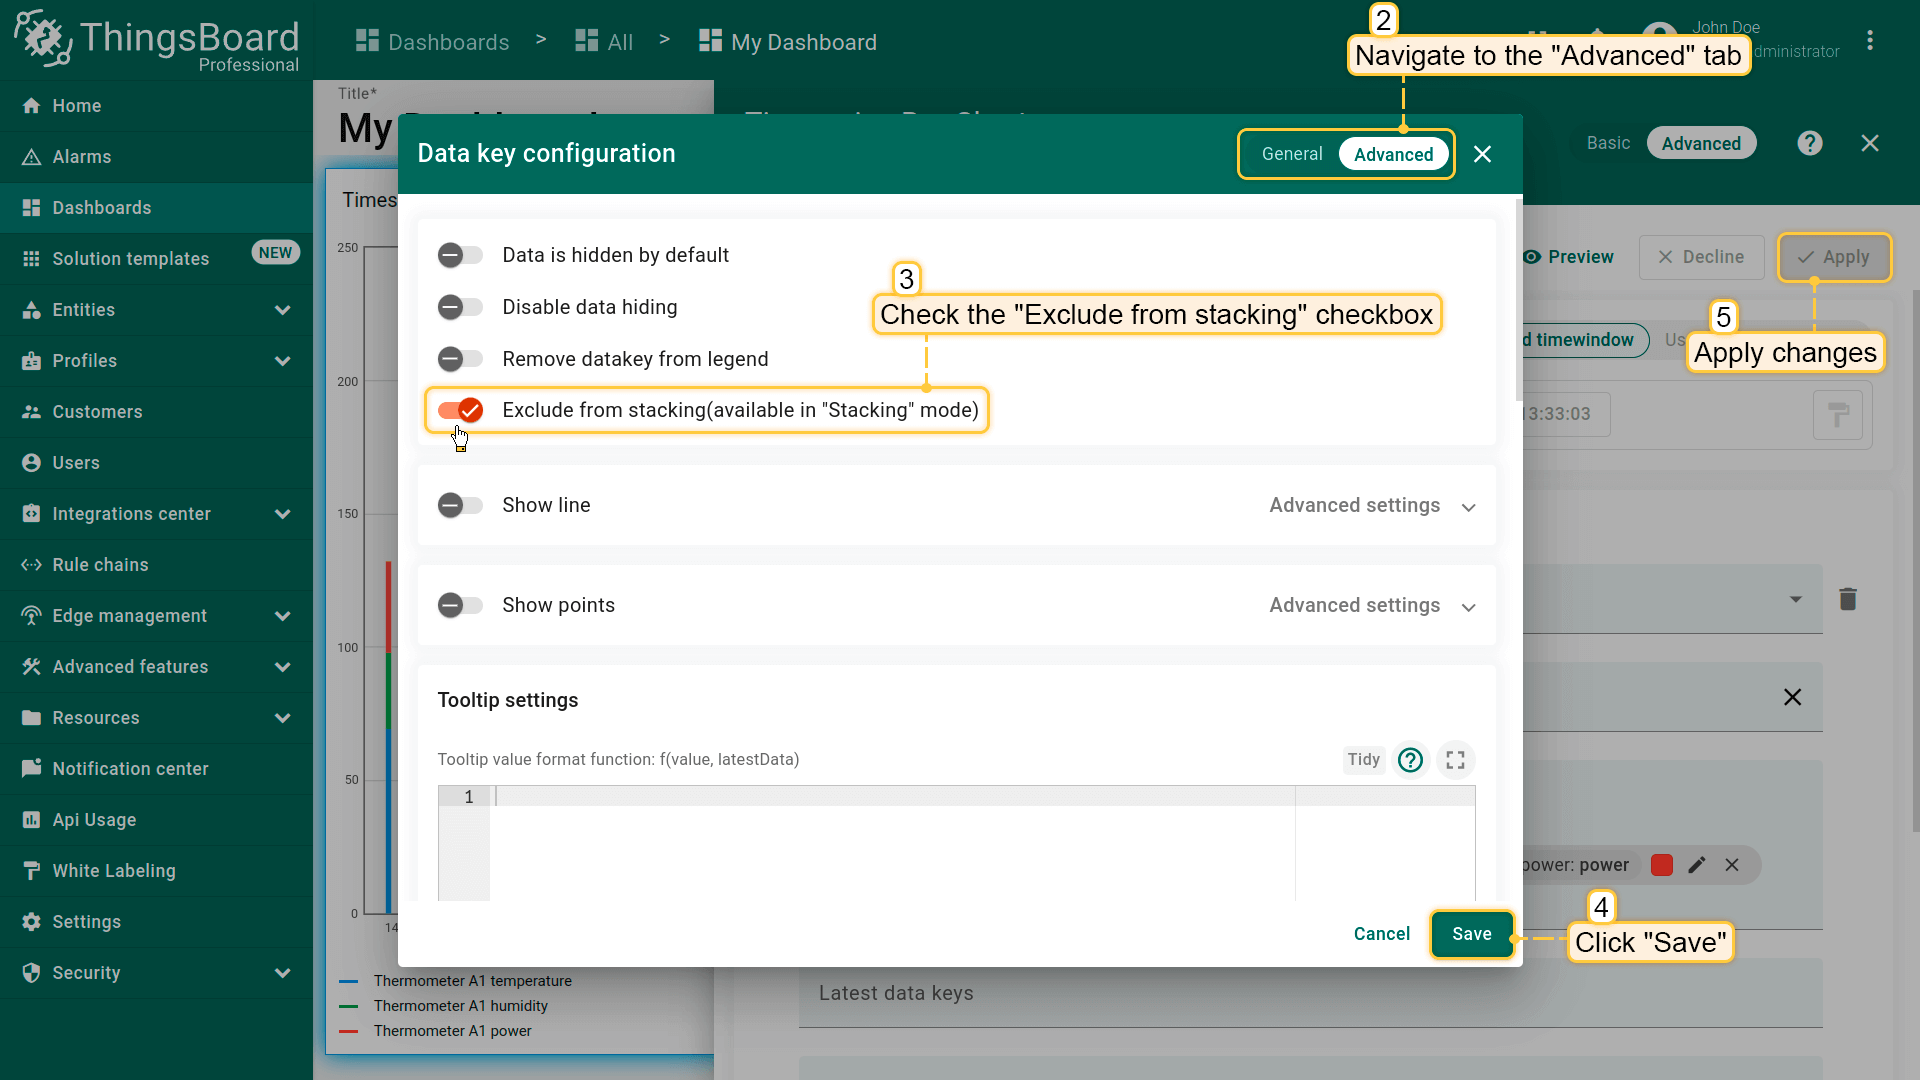
若需将某键排除出堆叠,请前往高级数据键配置,勾选\u201cExclude from stacking\u201d。
图例设置(Legend settings)
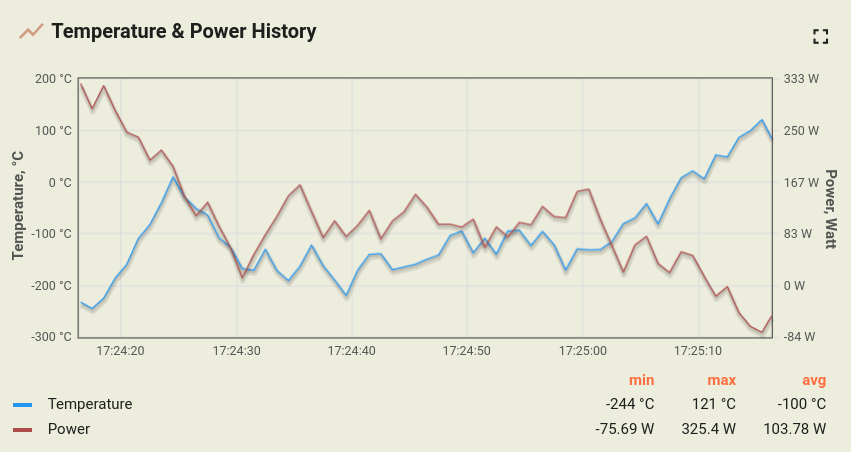
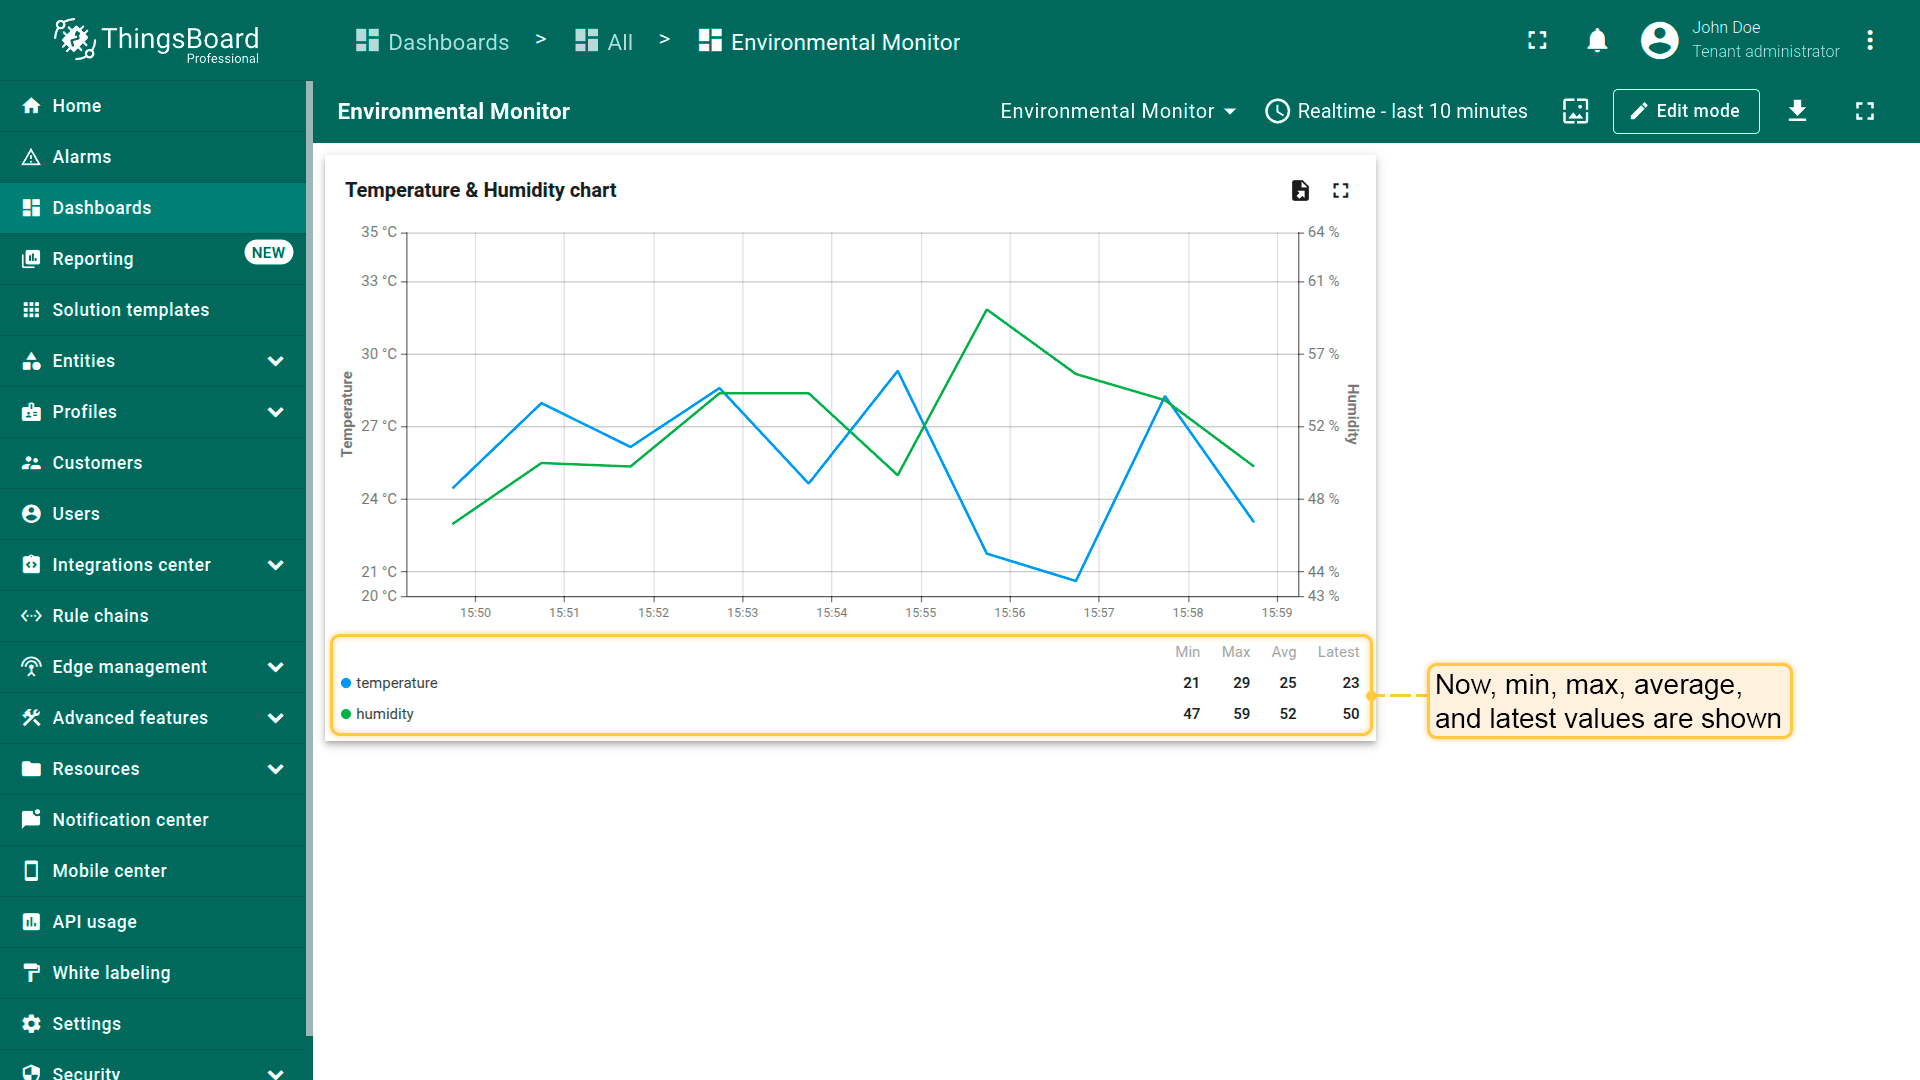
legend 显示统计值,包括 minimum、maximum、average、total 和 latest。
默认仅图表部件启用 show legend。其他部件可于部件设置中切换 Legend 开关以启用。
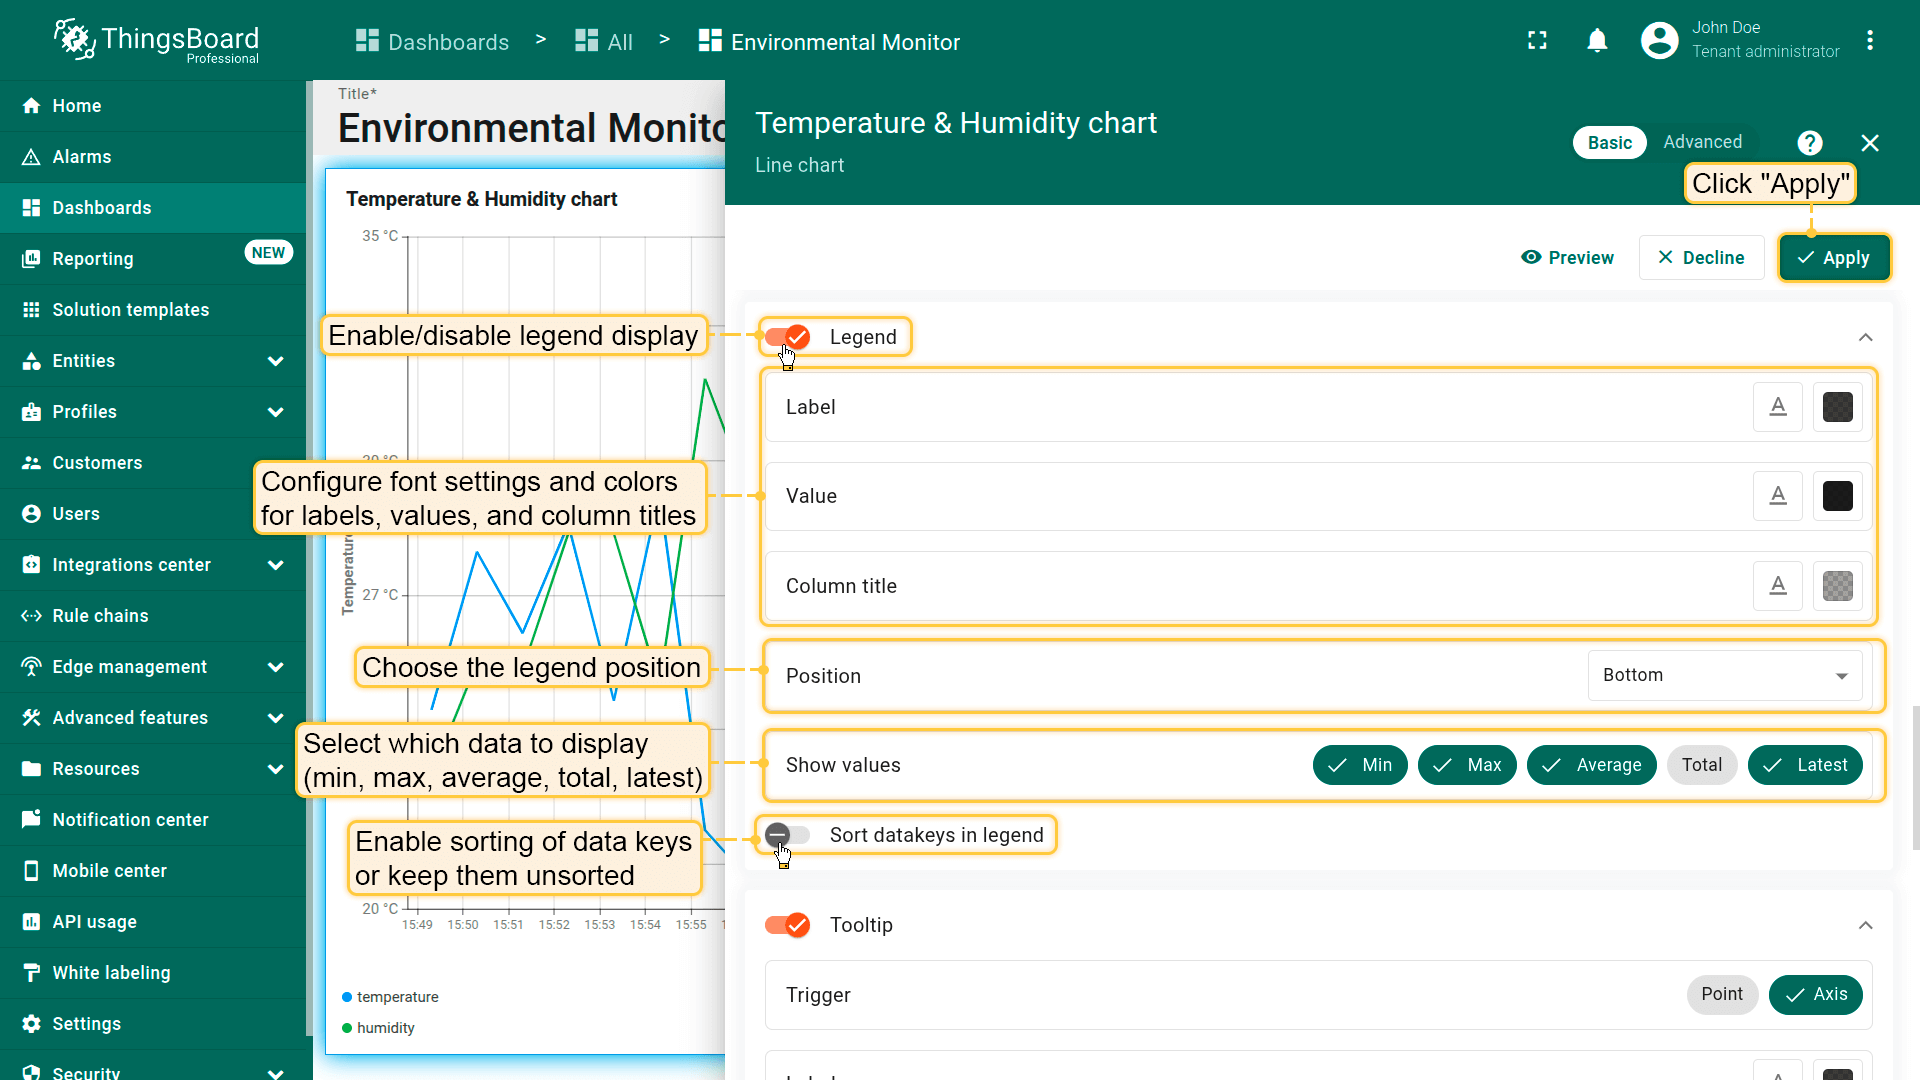
在图例设置中可:
- 配置标签、数值和列标题的字体和颜色。
- 选择图例位置。
- 选择要显示的统计值(minimum、maximum、average、total、latest)。
- 启用数据键排序或保持无序。
- Configure font settings and colors for labels, values, and column headers.
- Choose the legend position.
- Select which statistical values to display (minimum, maximum, average, total, latest).
- Enable sorting of data keys or keep them unsorted.
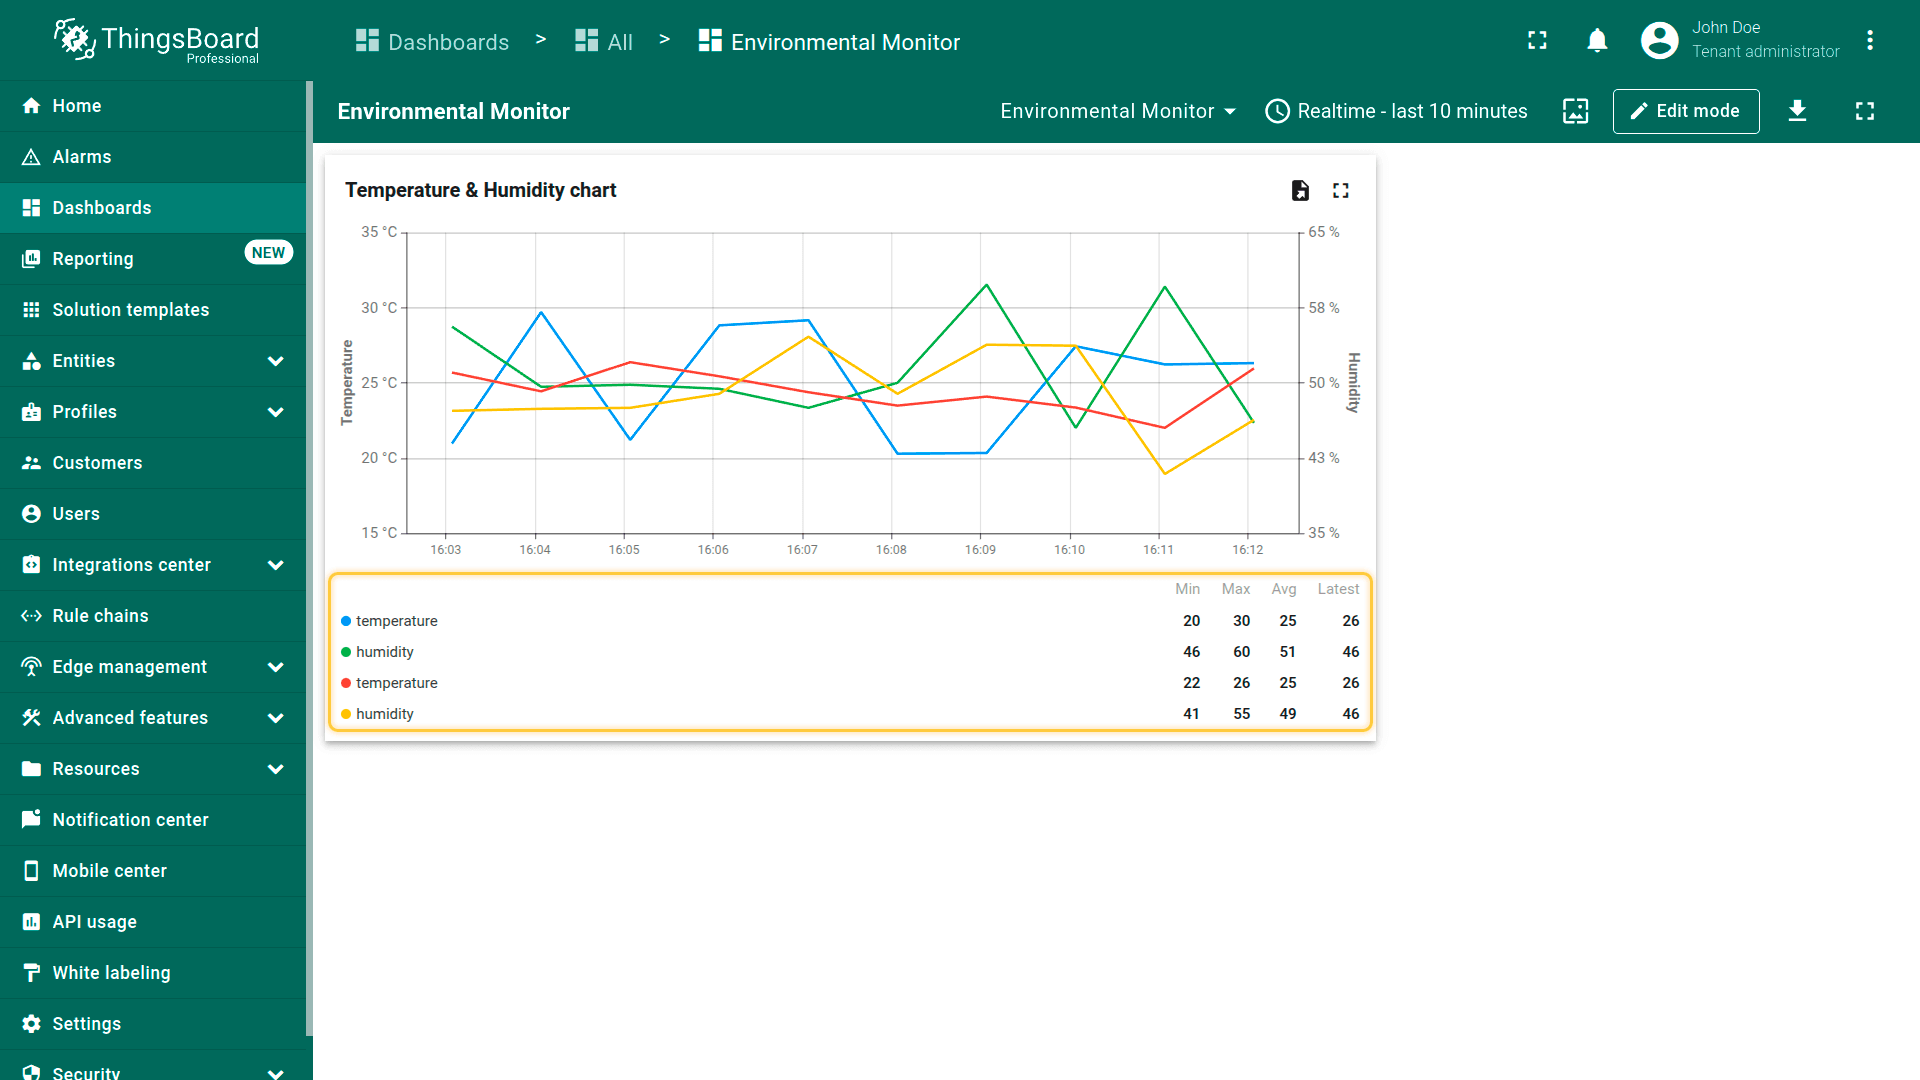
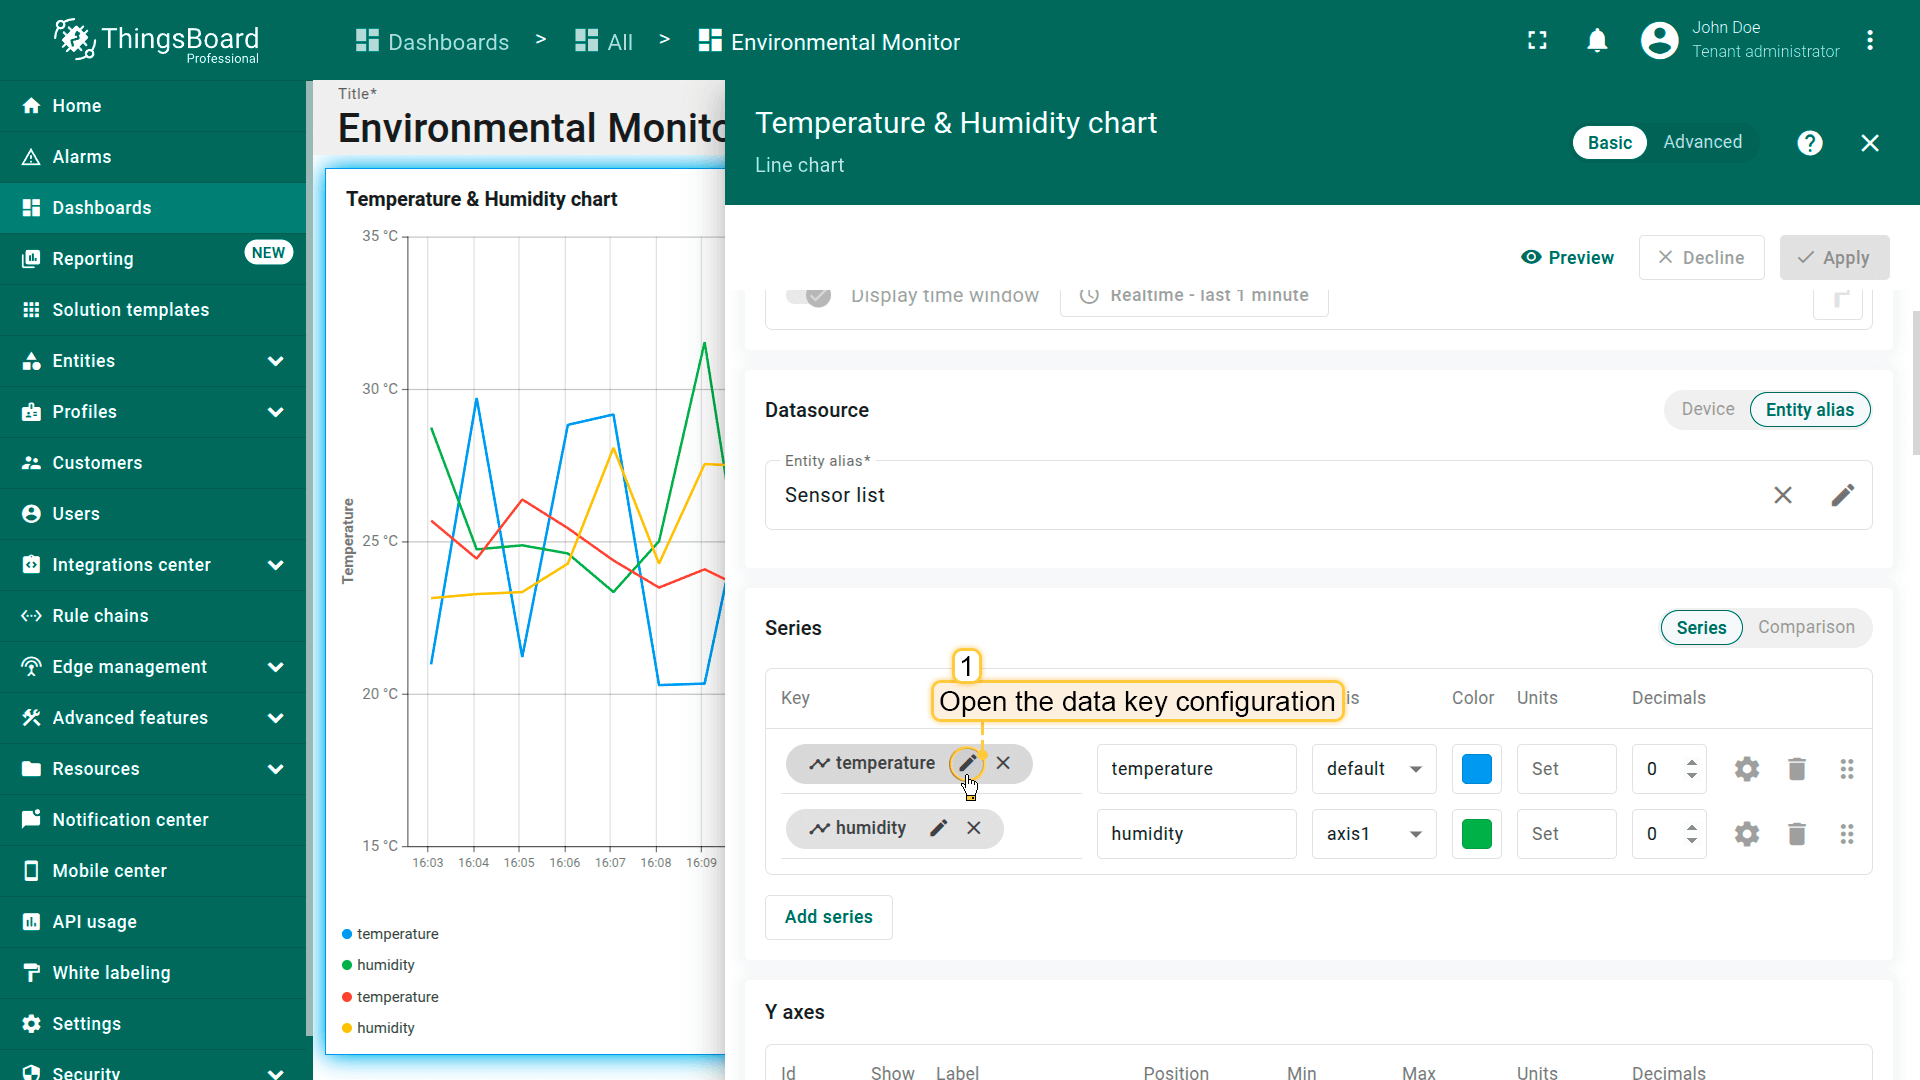
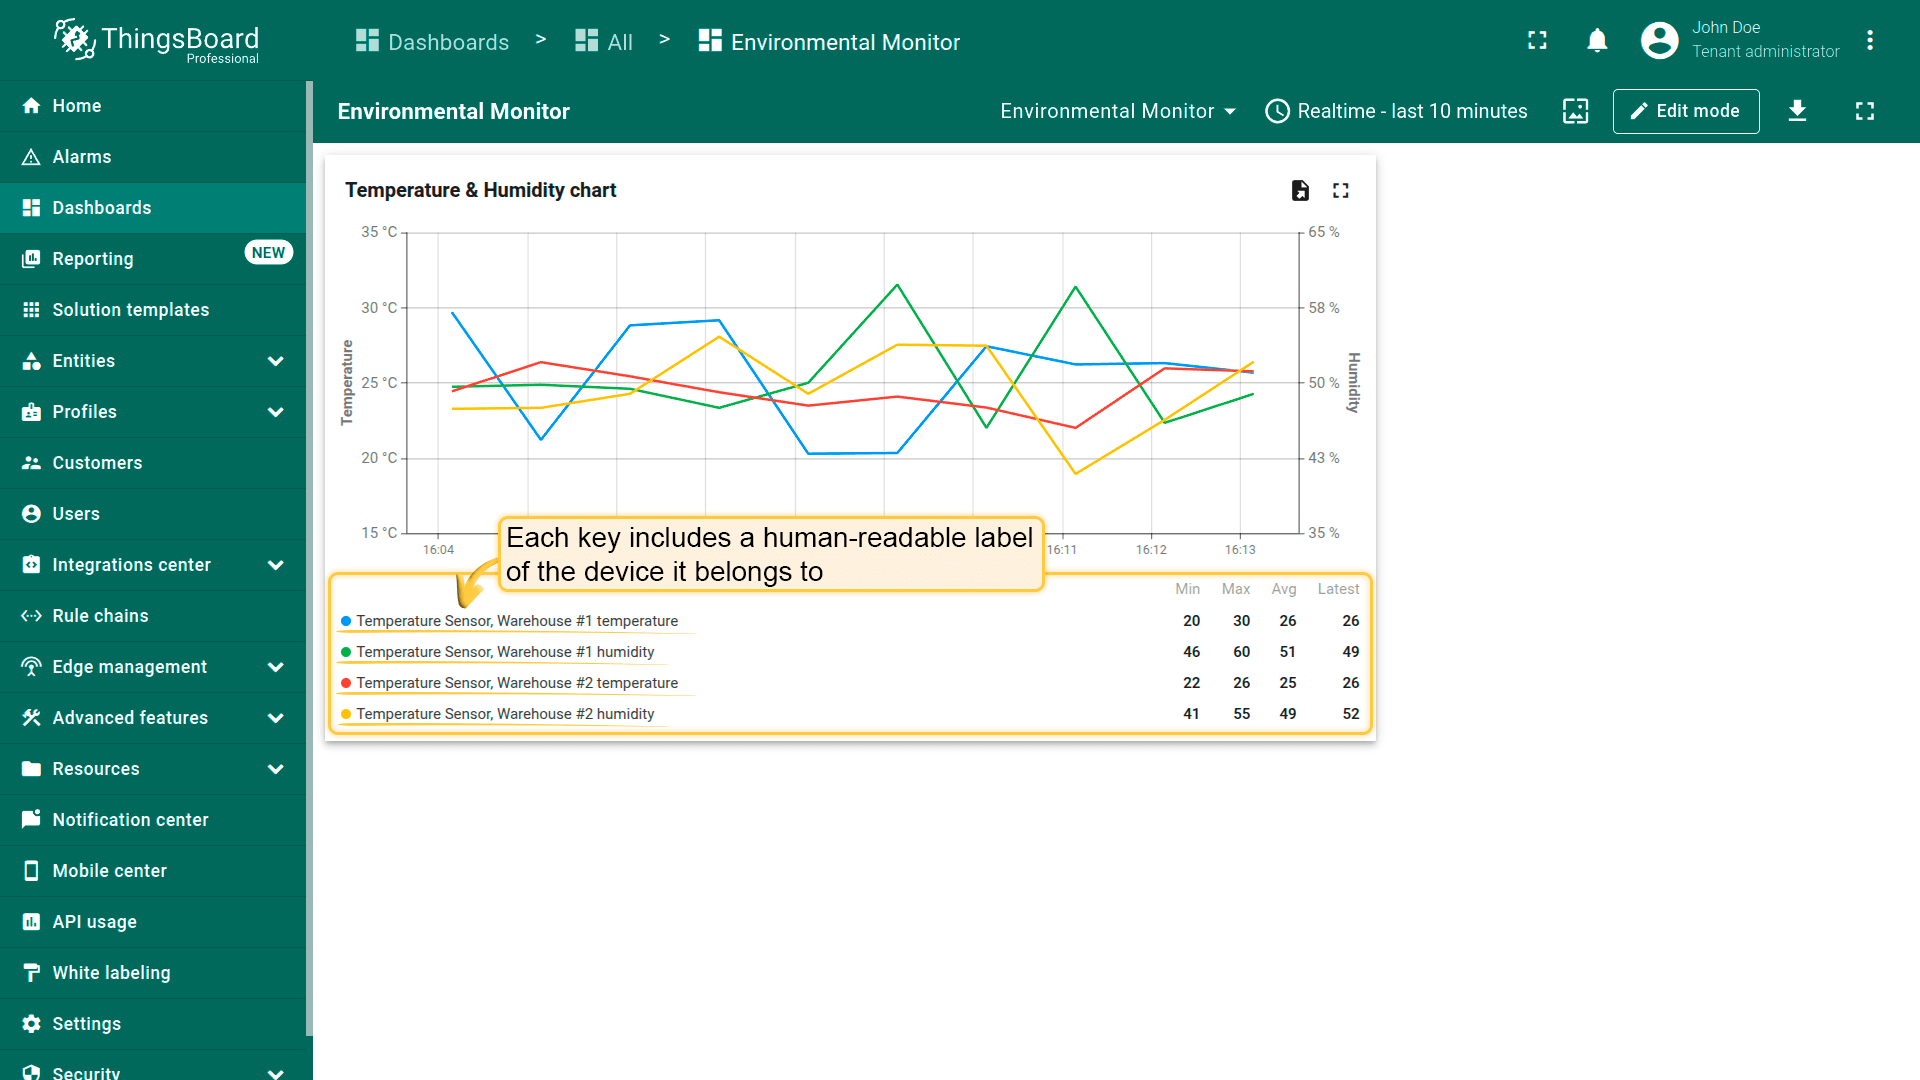
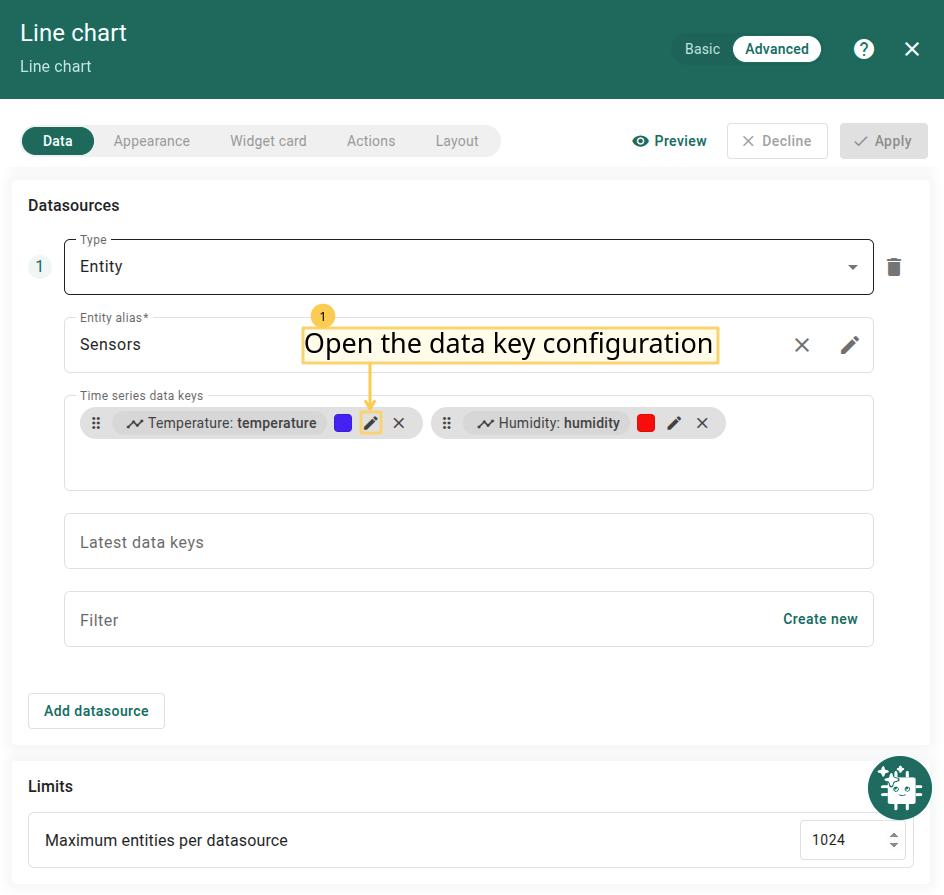
图例为每个数据键显示标签。当部件包含多台设备数据或多个设备共用同一数据键名(如temperature)时,图例或提示中难以区分各键值对应的设备。
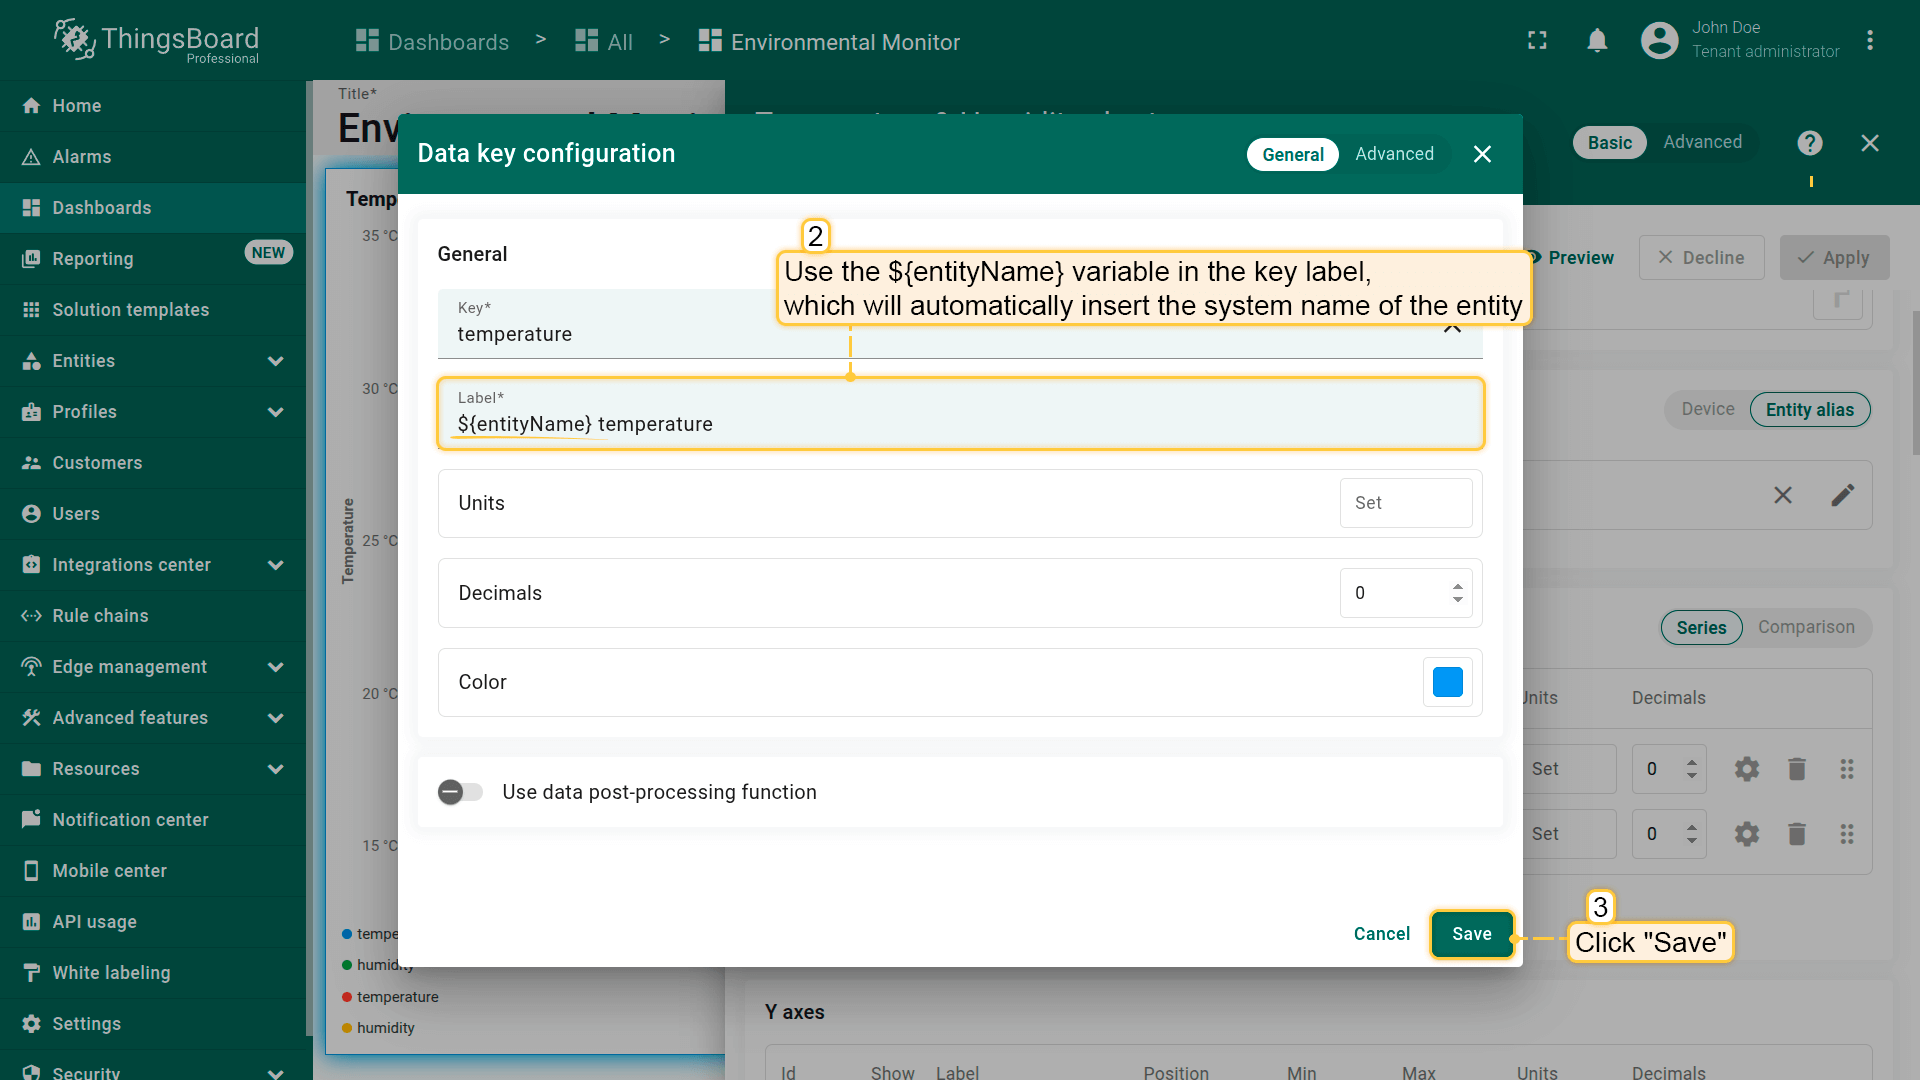
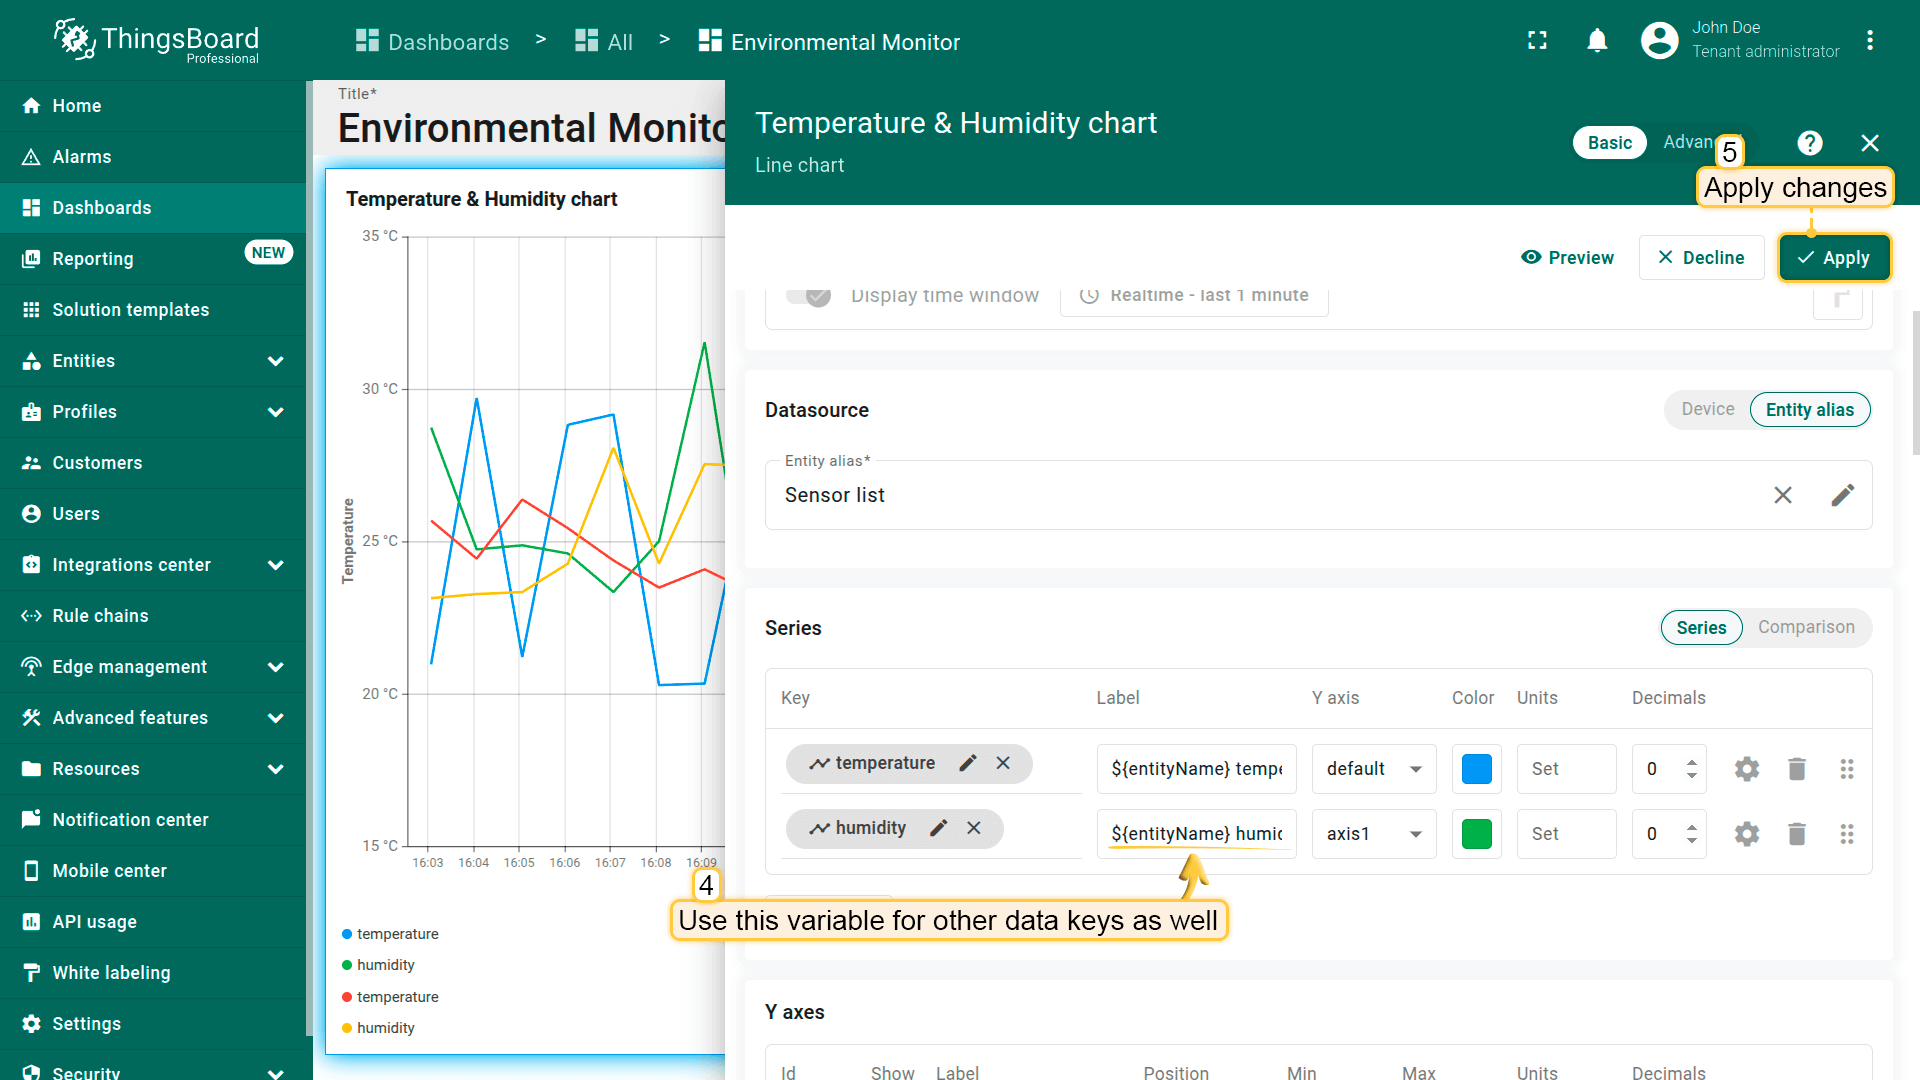
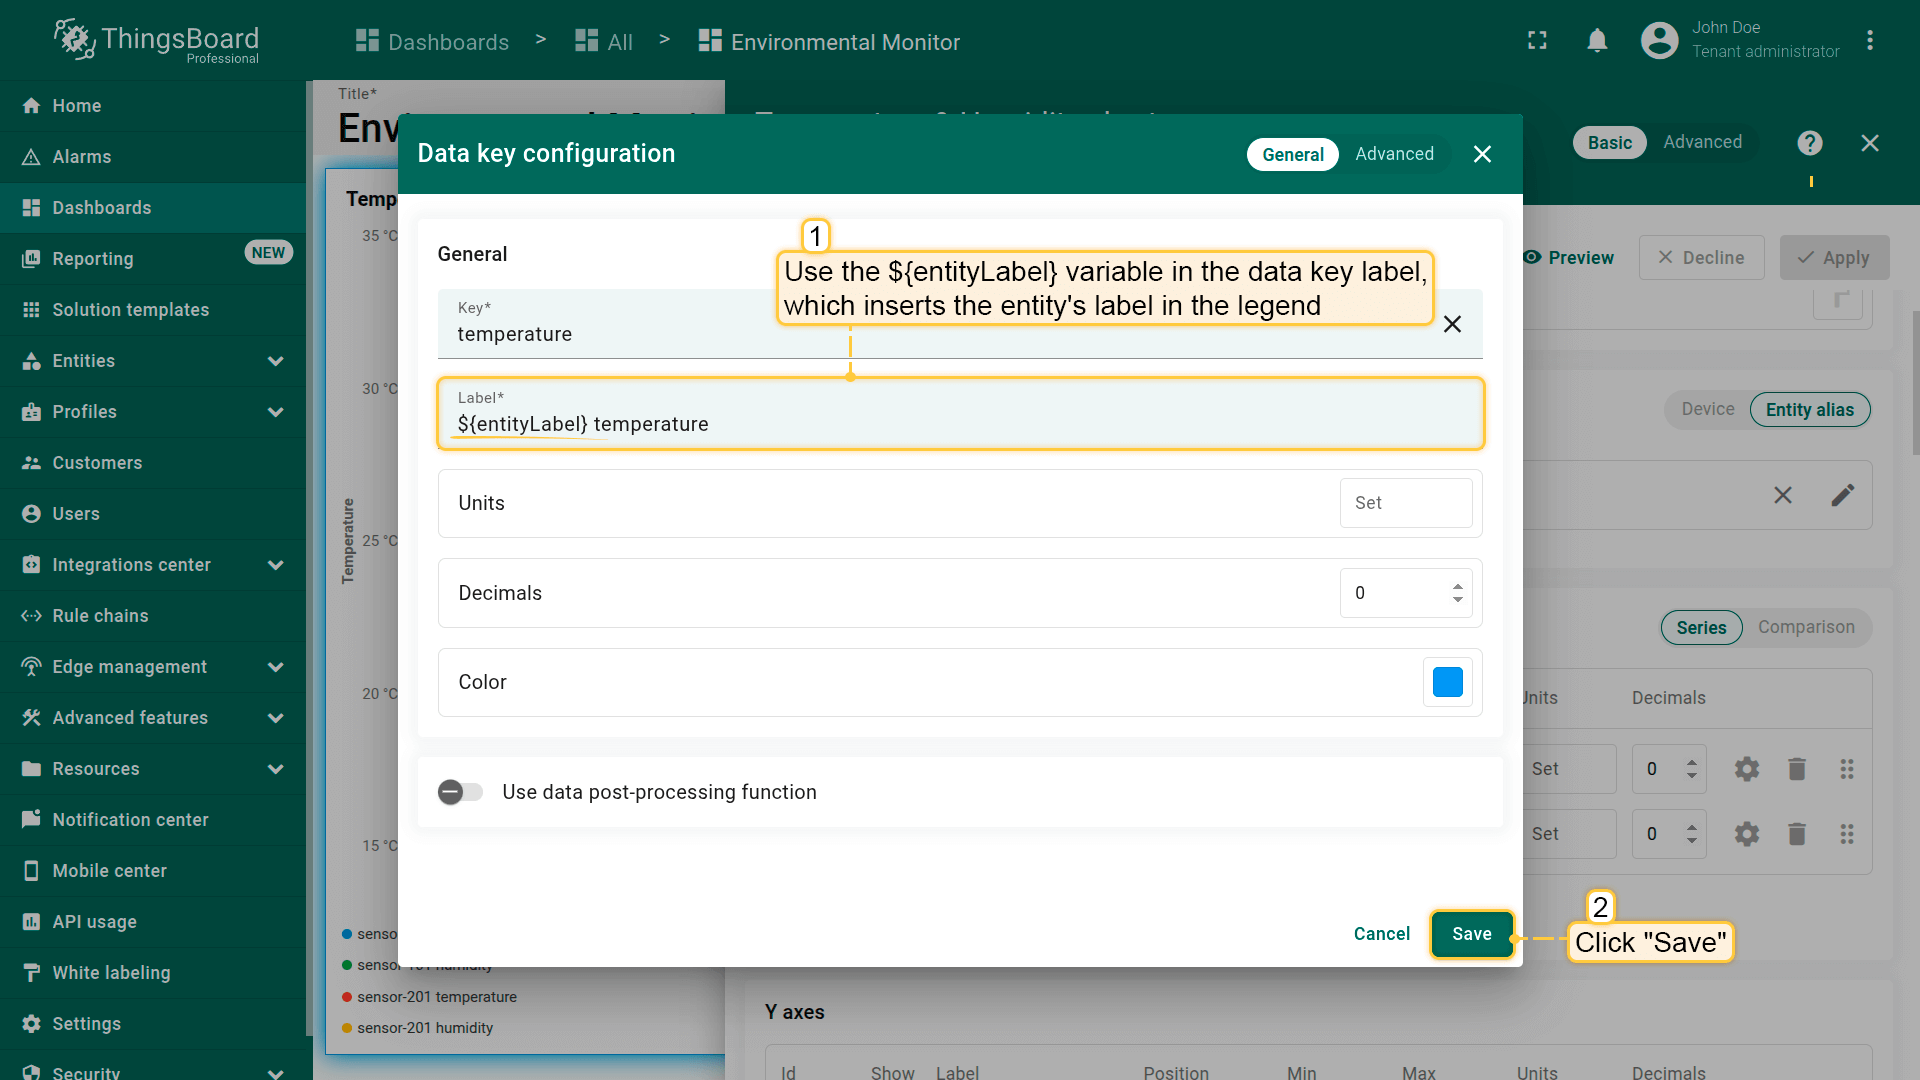
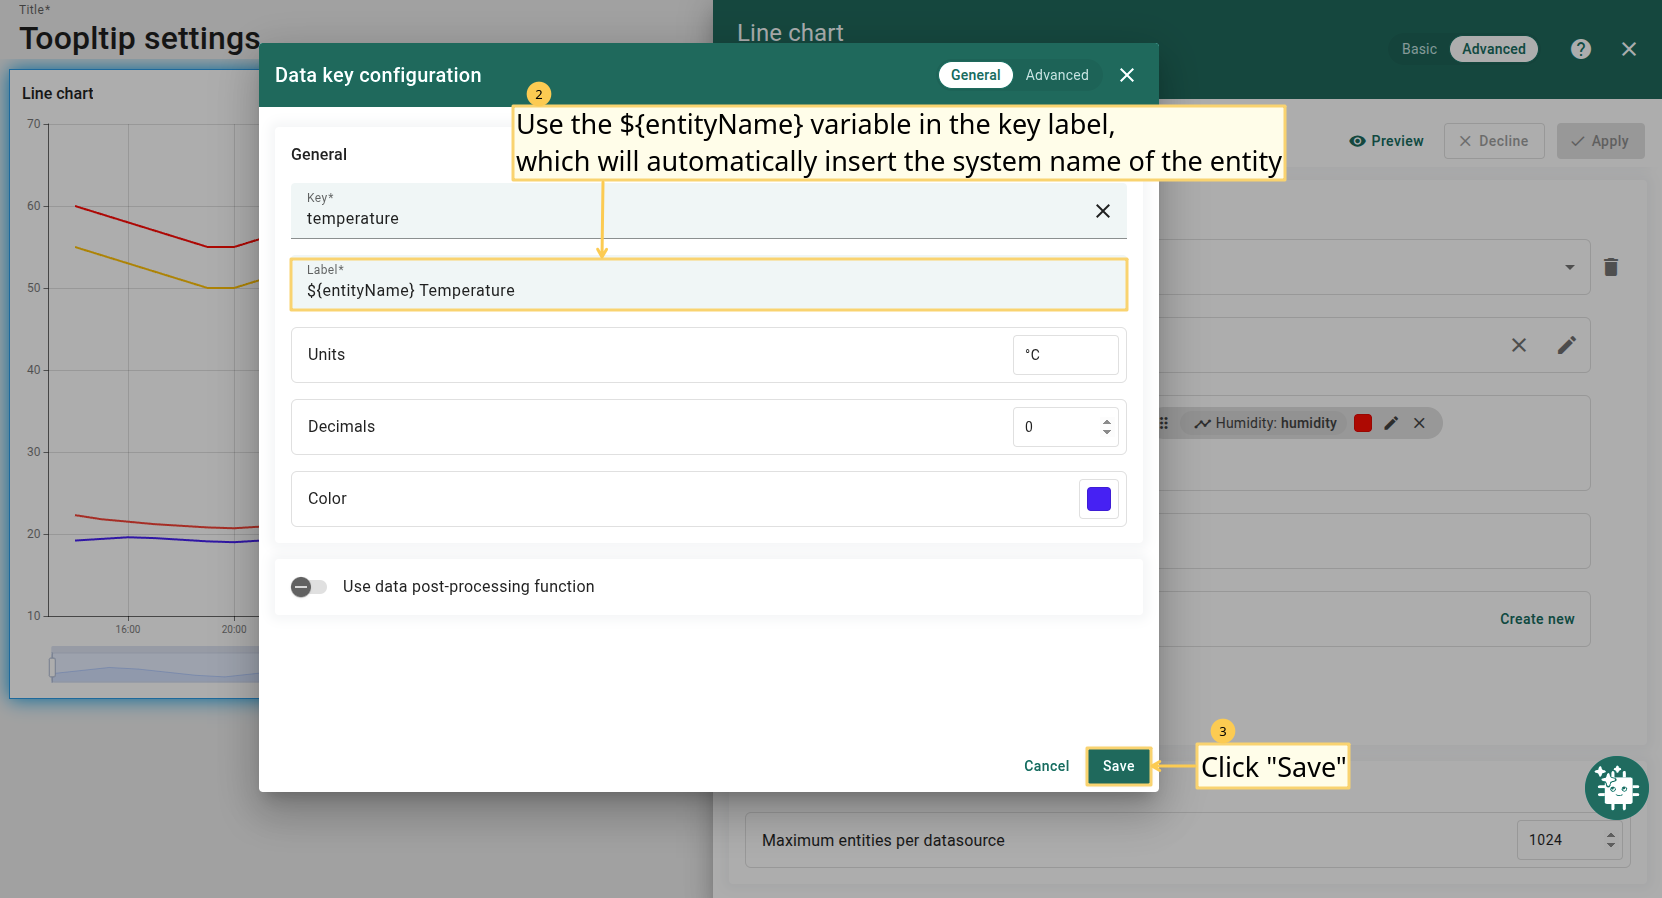
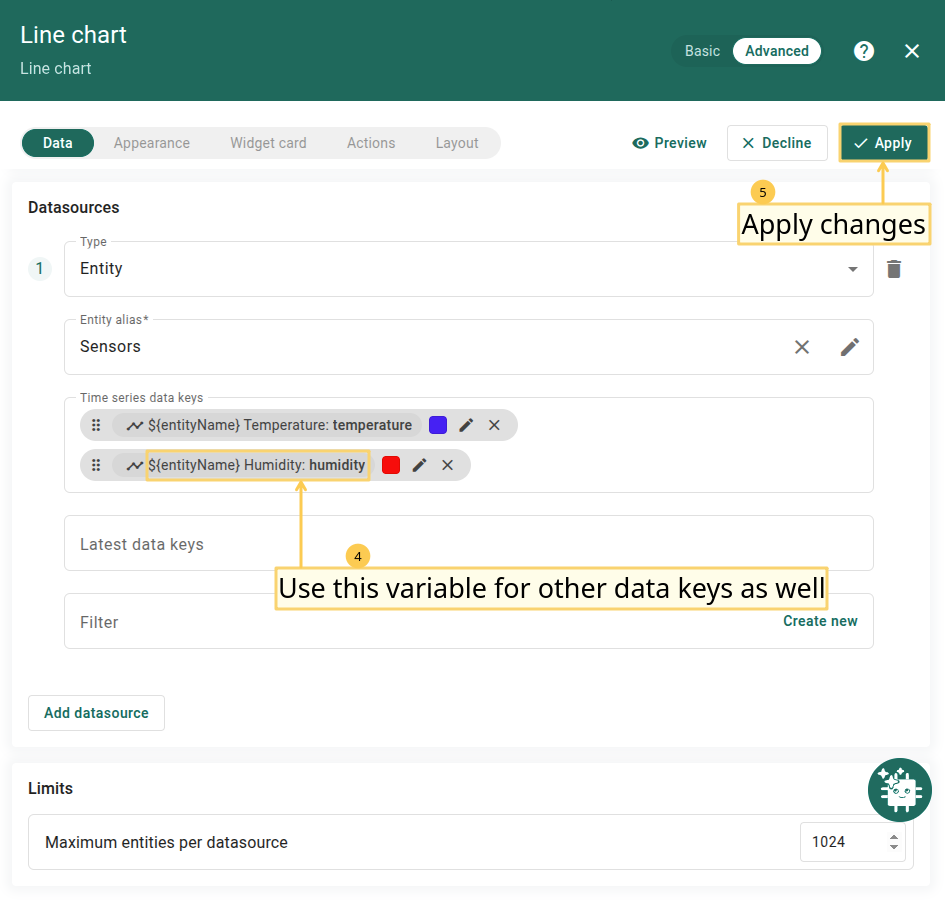
为使图例更清晰,可在数据键配置的 Label 字段使用 ${entityName} 或 ${entityLabel}。
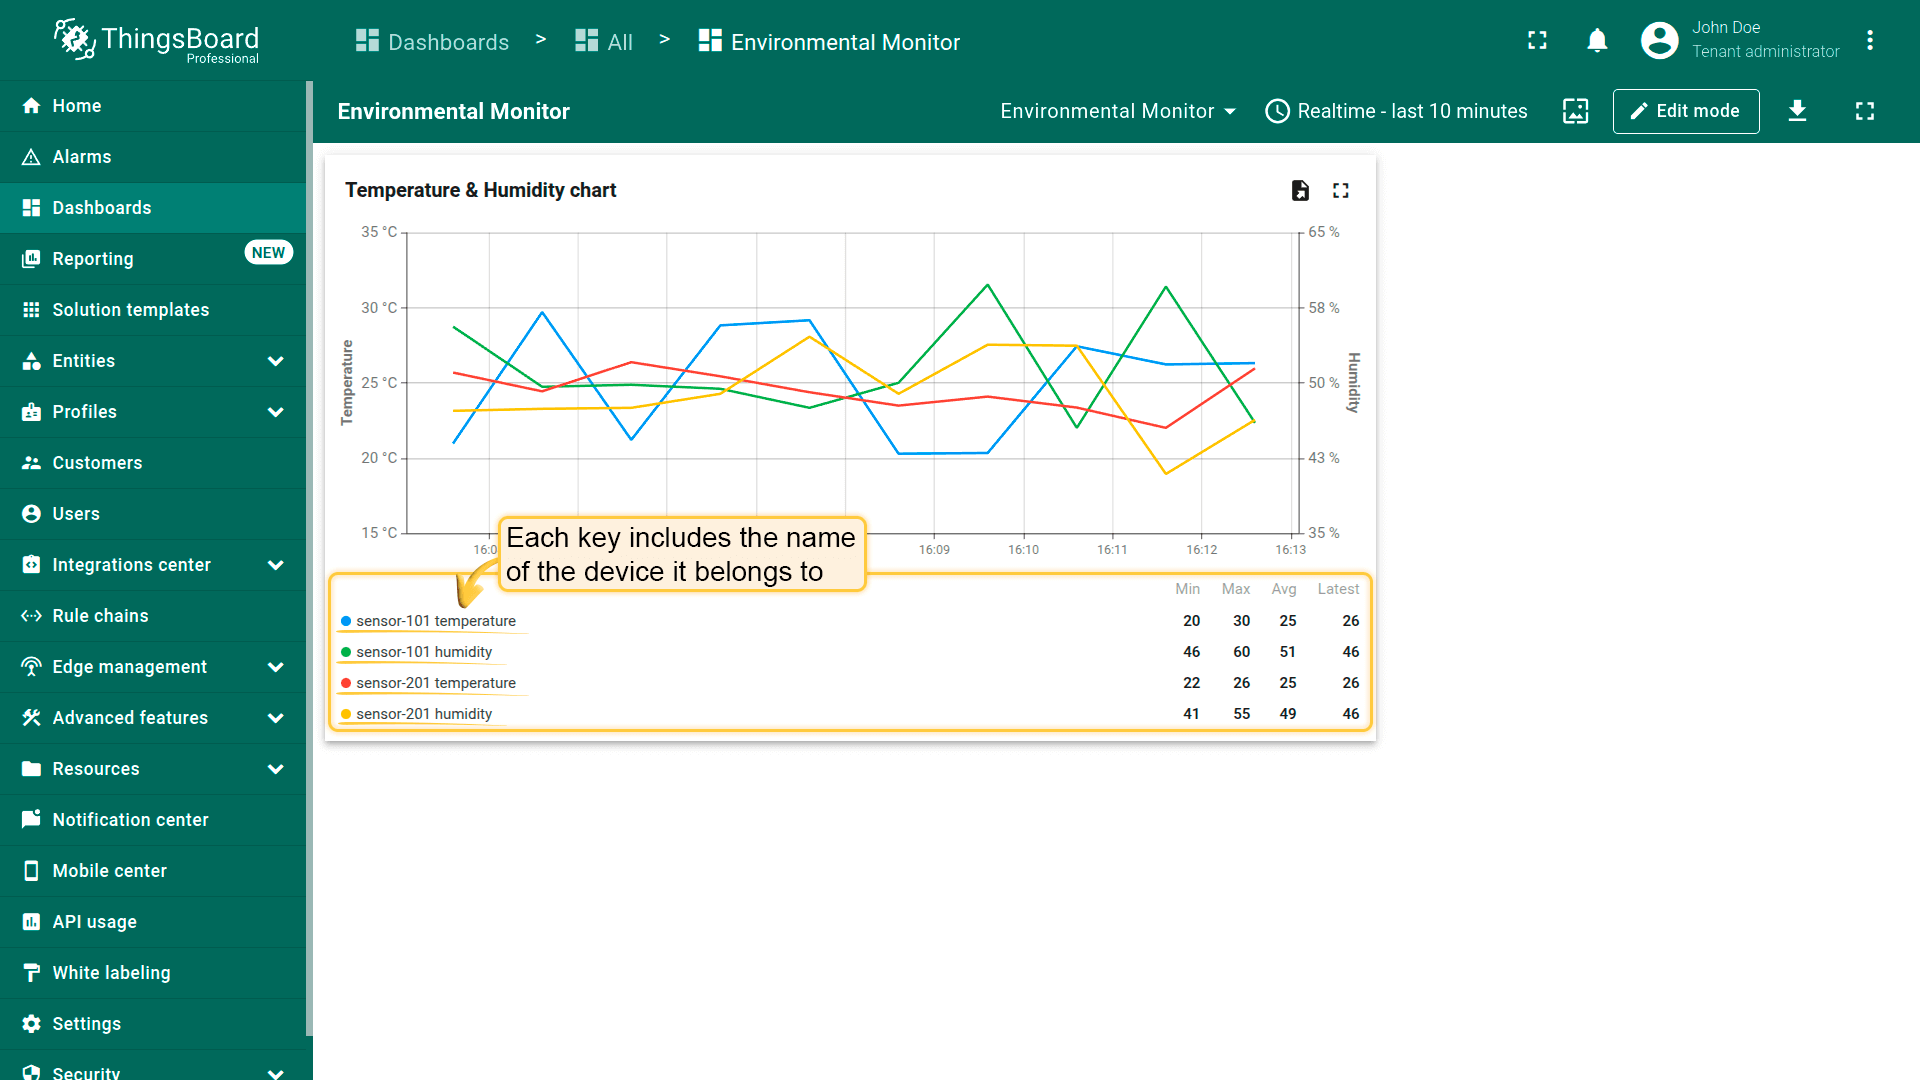
- ${entityName} — 在图例中自动插入实体系统名称的变量,便于标识对象,尤其当技术名称或唯一标识重要时。
示例:设备名称为 sensor-101 时,在 ${entityName} 处将显示 sensor-101。
- ${entityLabel} — 在图例中插入实体标签的变量,常用于显示人类可读的设备或实体名称。
示例:设备具有:- Name = sensor-101
- Label = Temperature Sensor, Warehouse #1
在 ${entityLabel} 处将显示更易读的 Temperature Sensor, Warehouse #1。

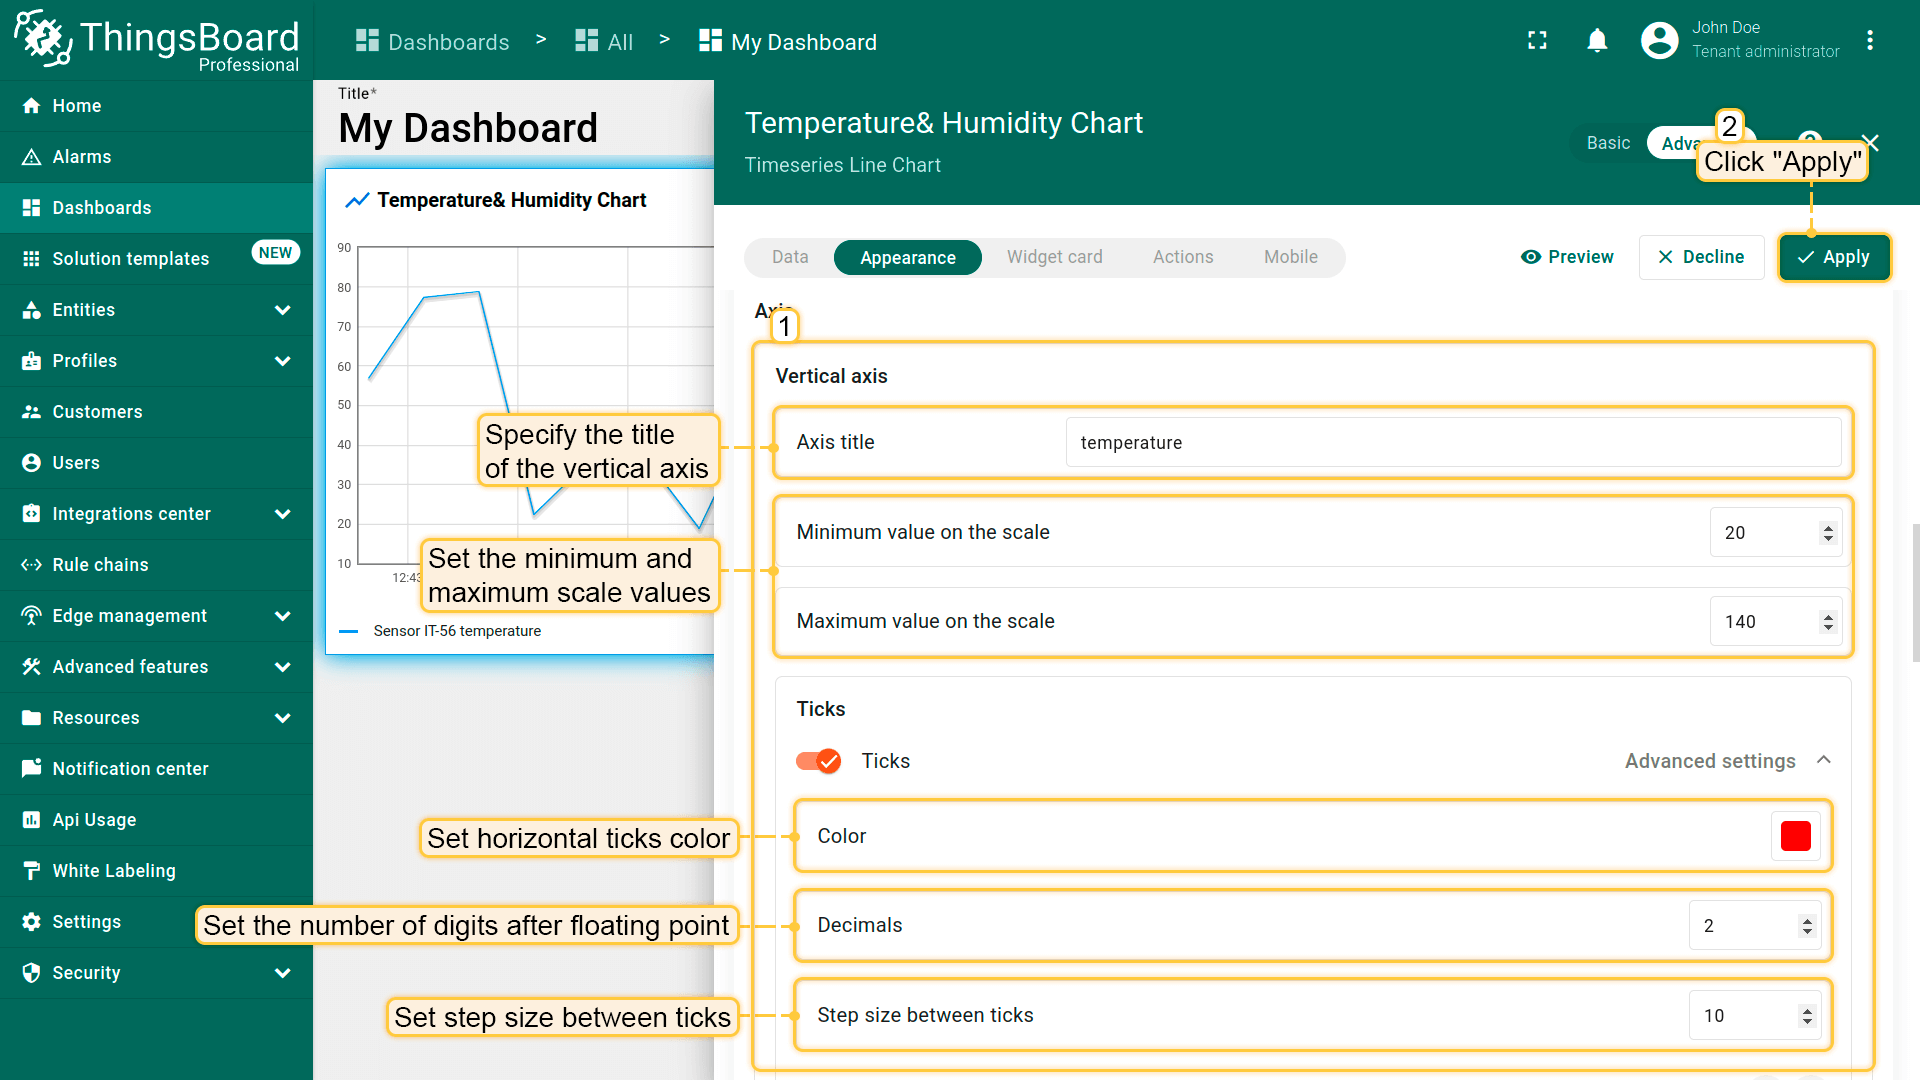
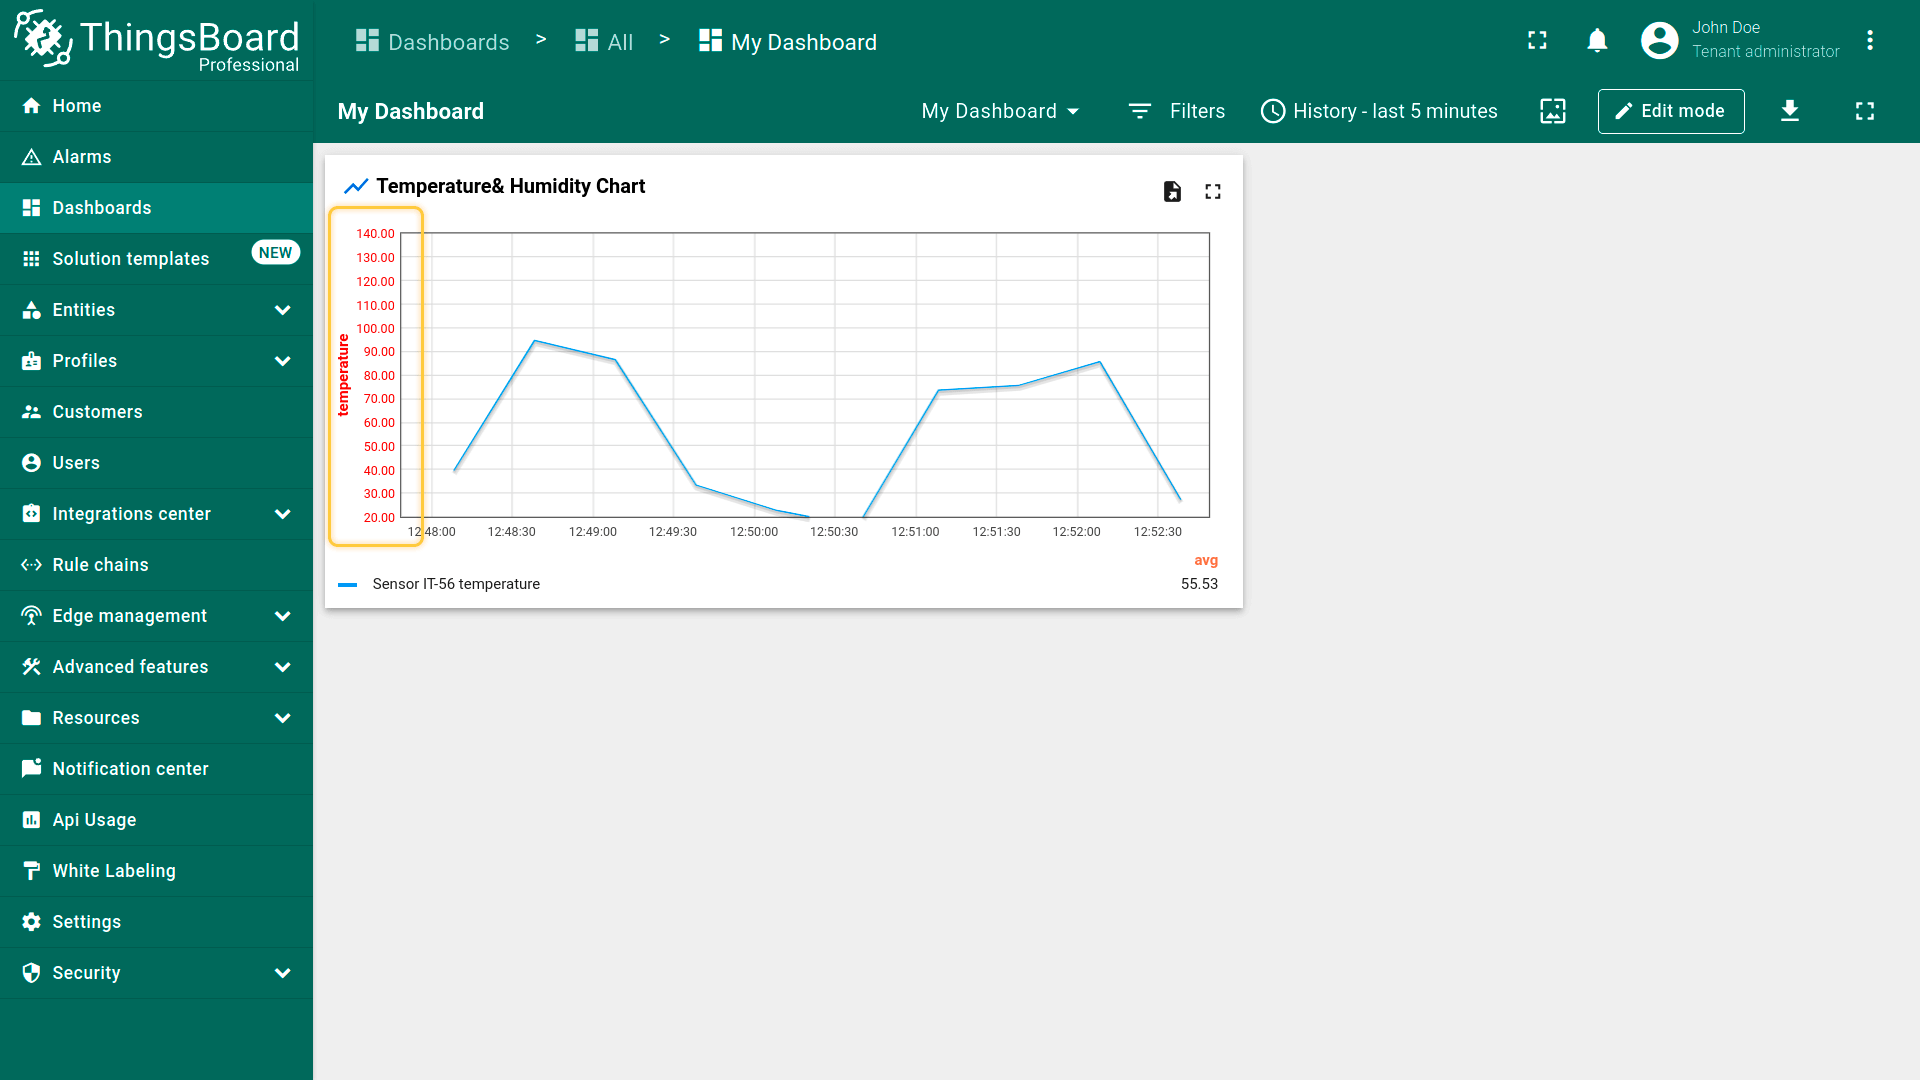
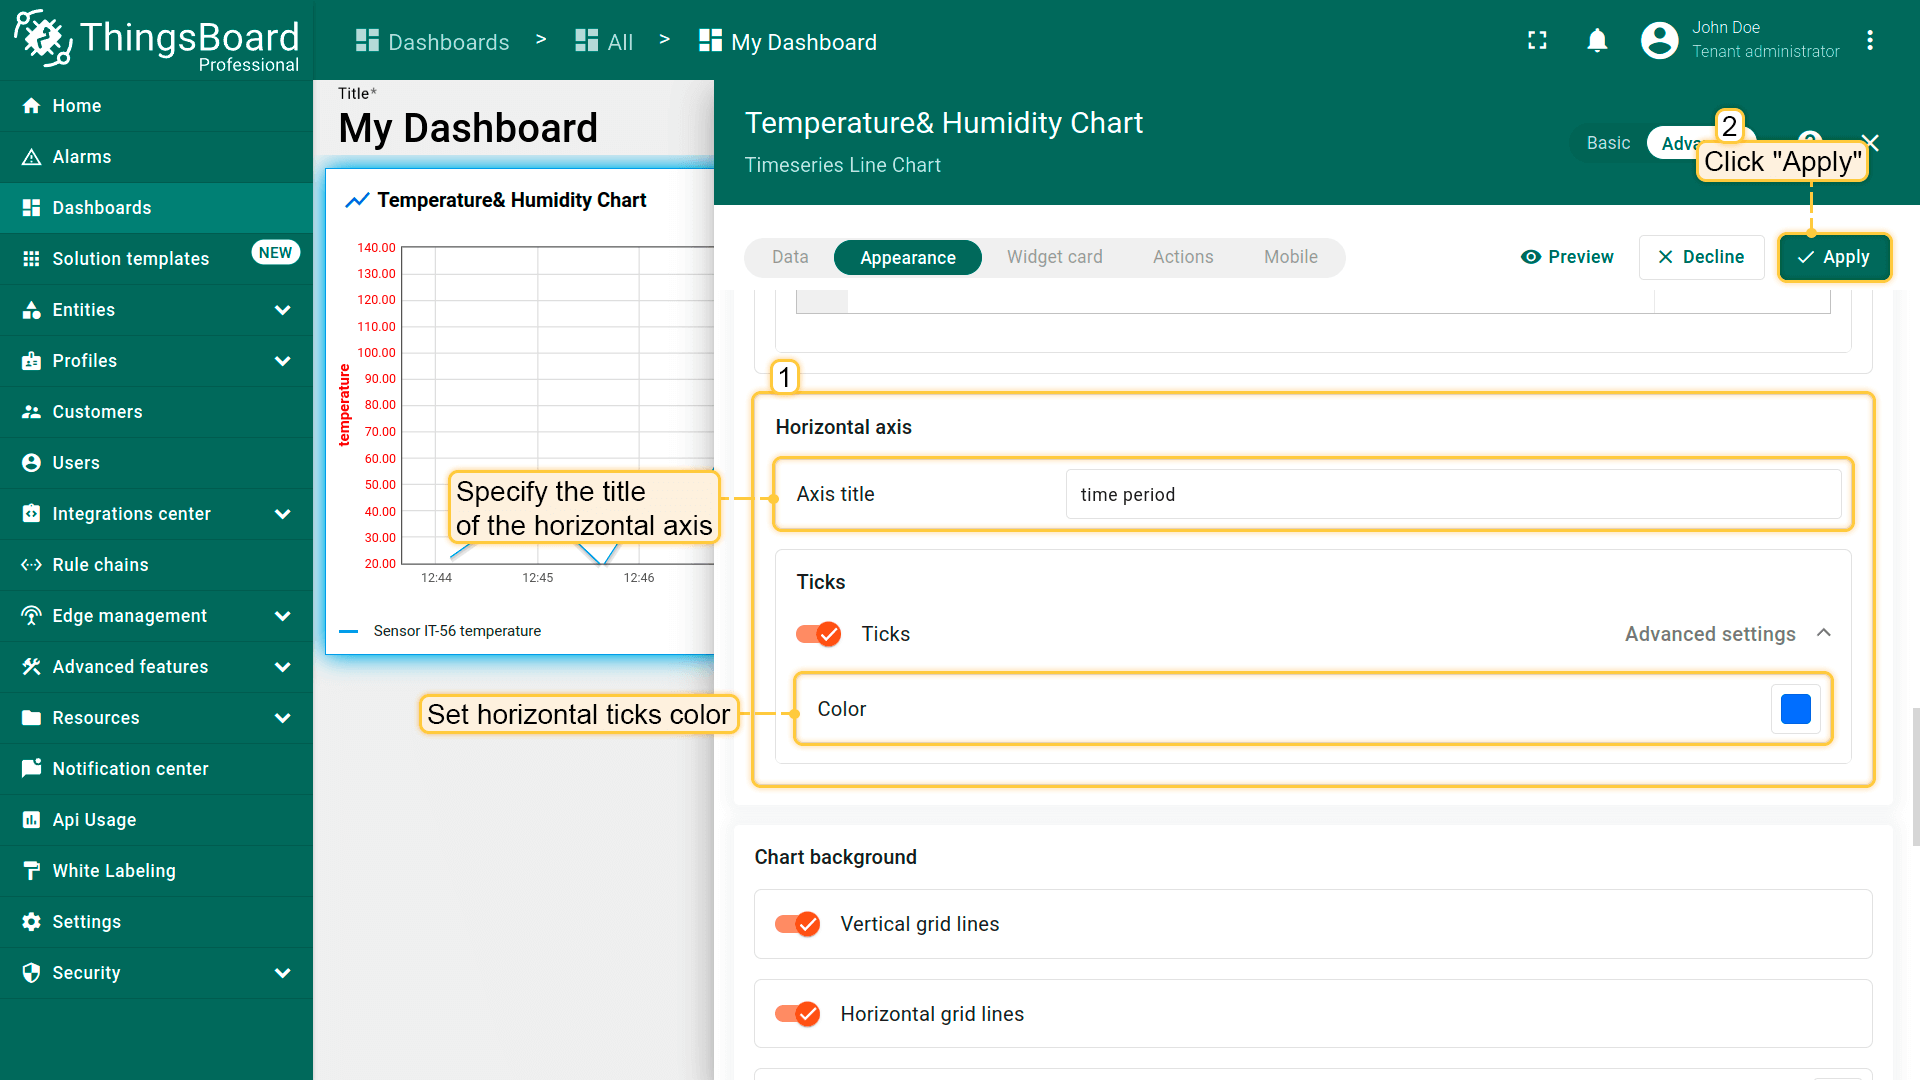
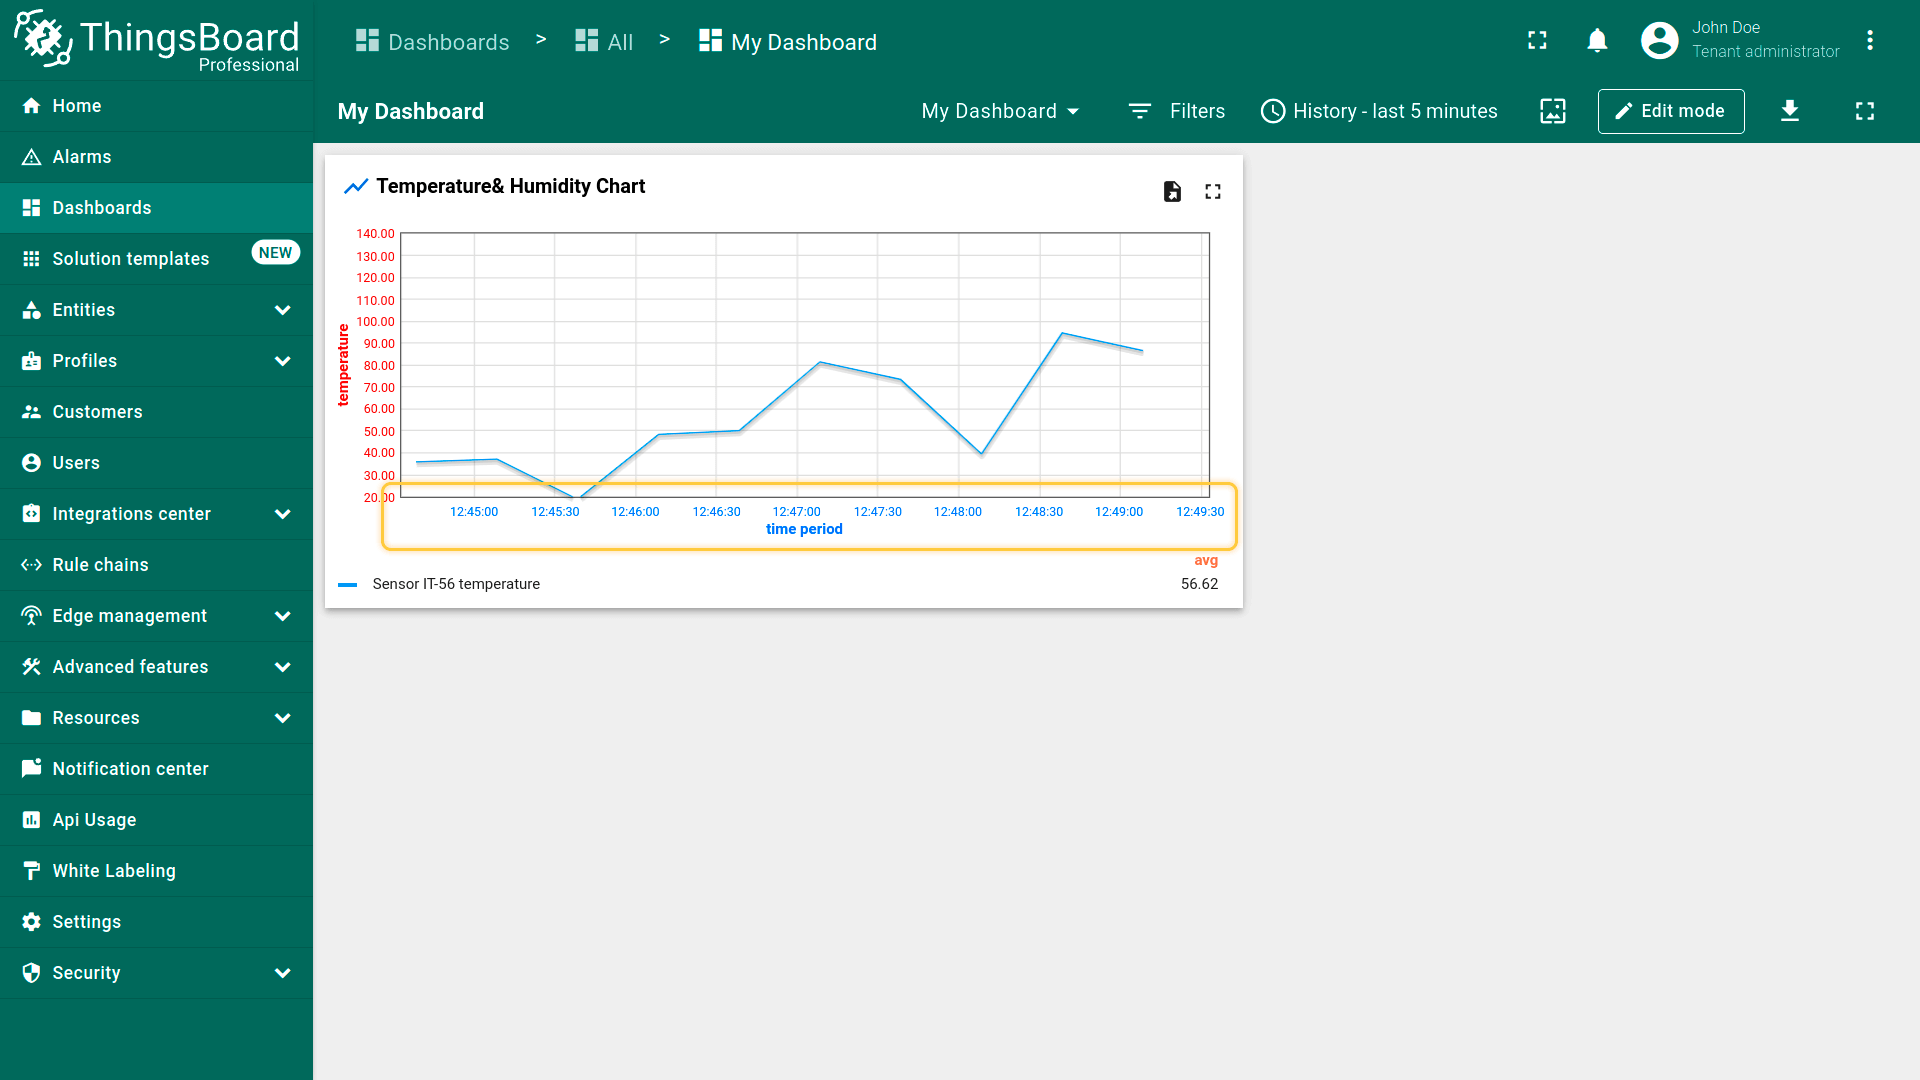
坐标轴设置(Axis settings)
配置坐标轴参数。
可设置垂直轴和水平轴标题、最小/最大刻度值,以及刻度颜色、小数位数和刻度间距。
垂直轴设置:
水平轴设置:
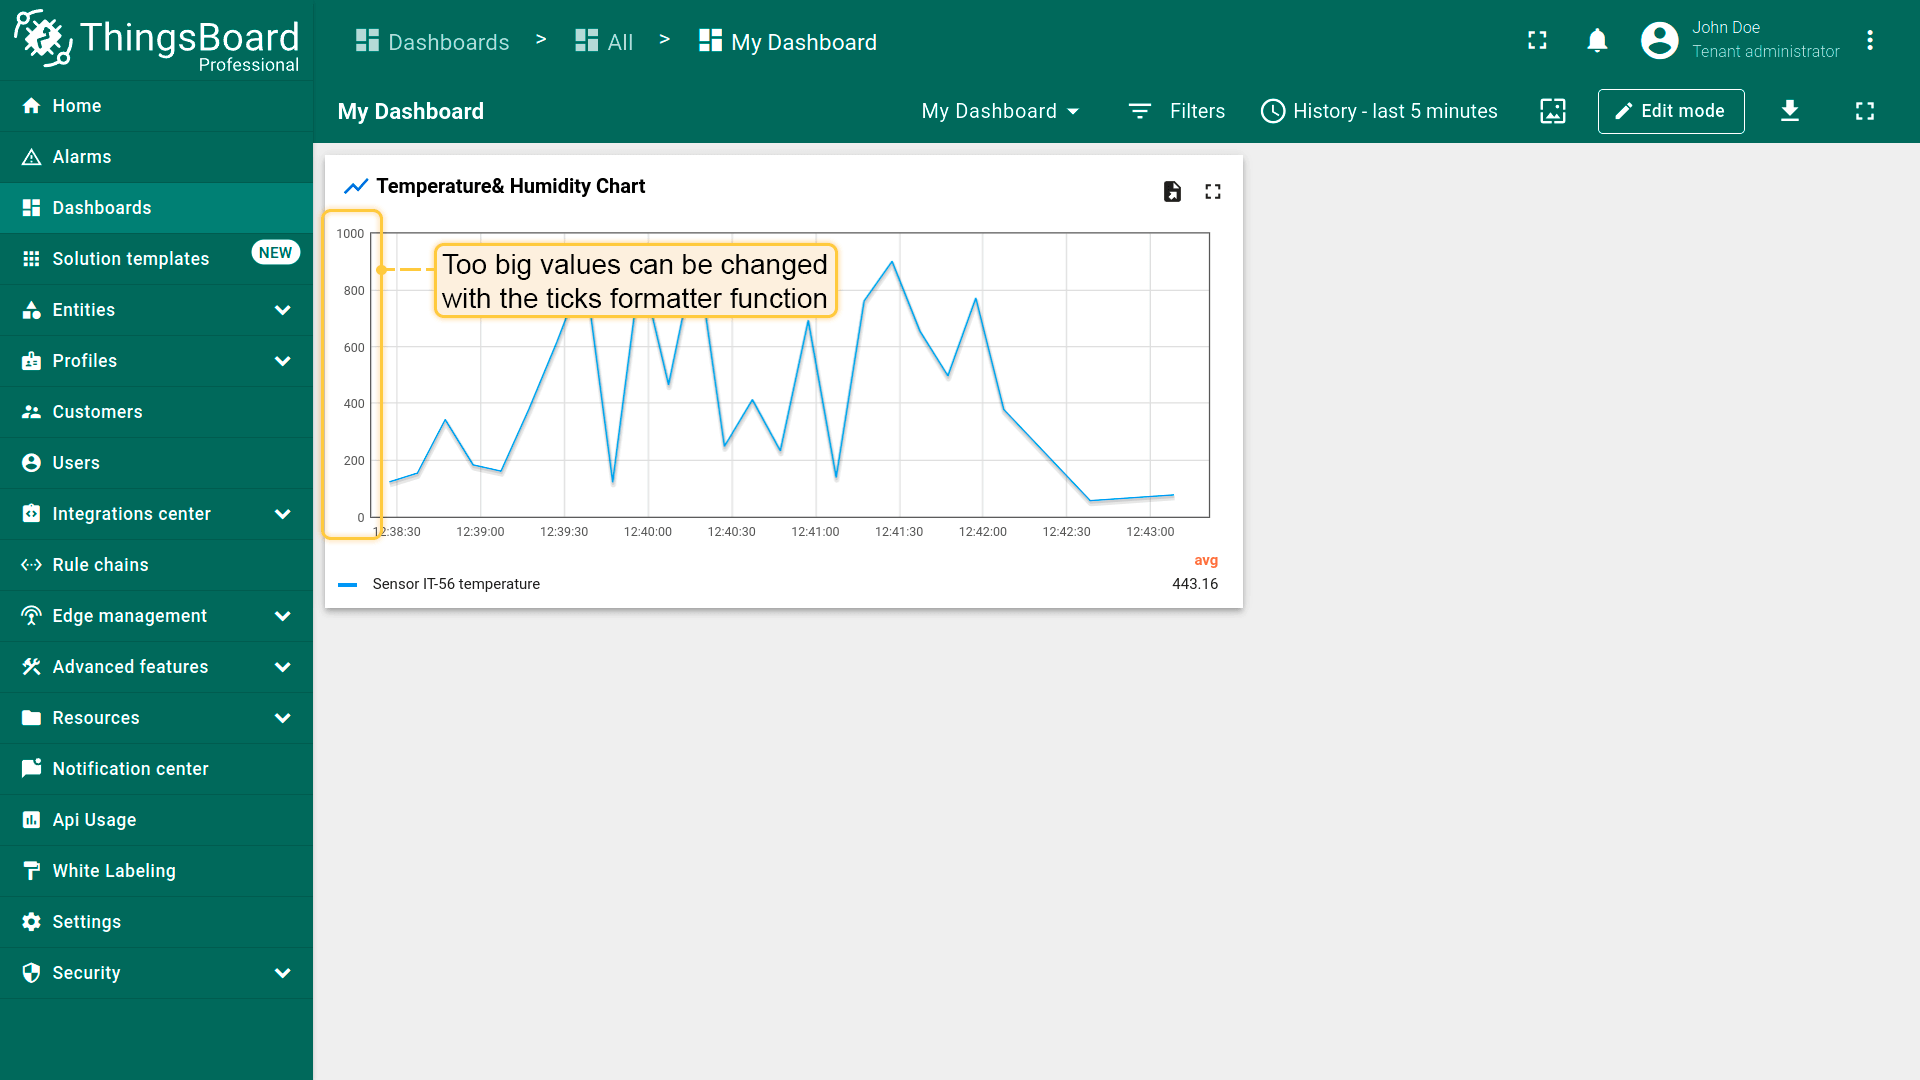
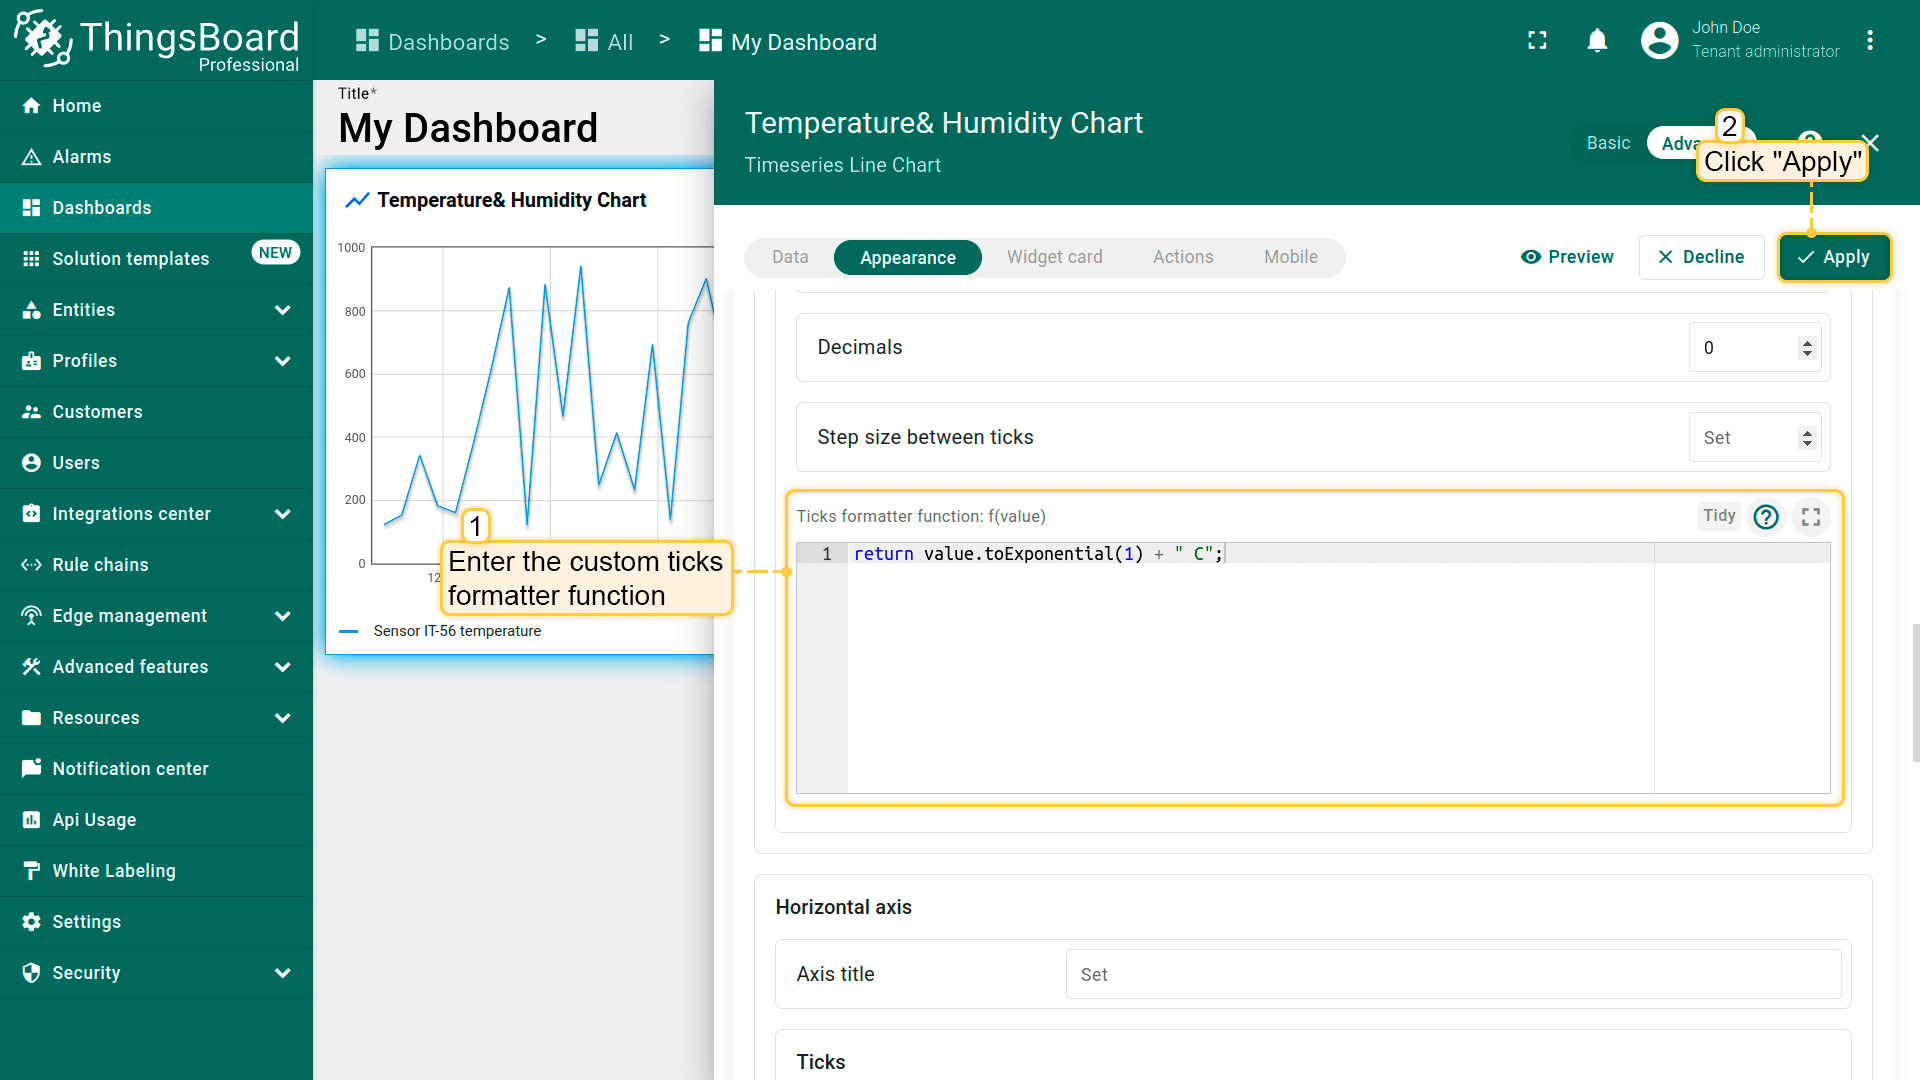
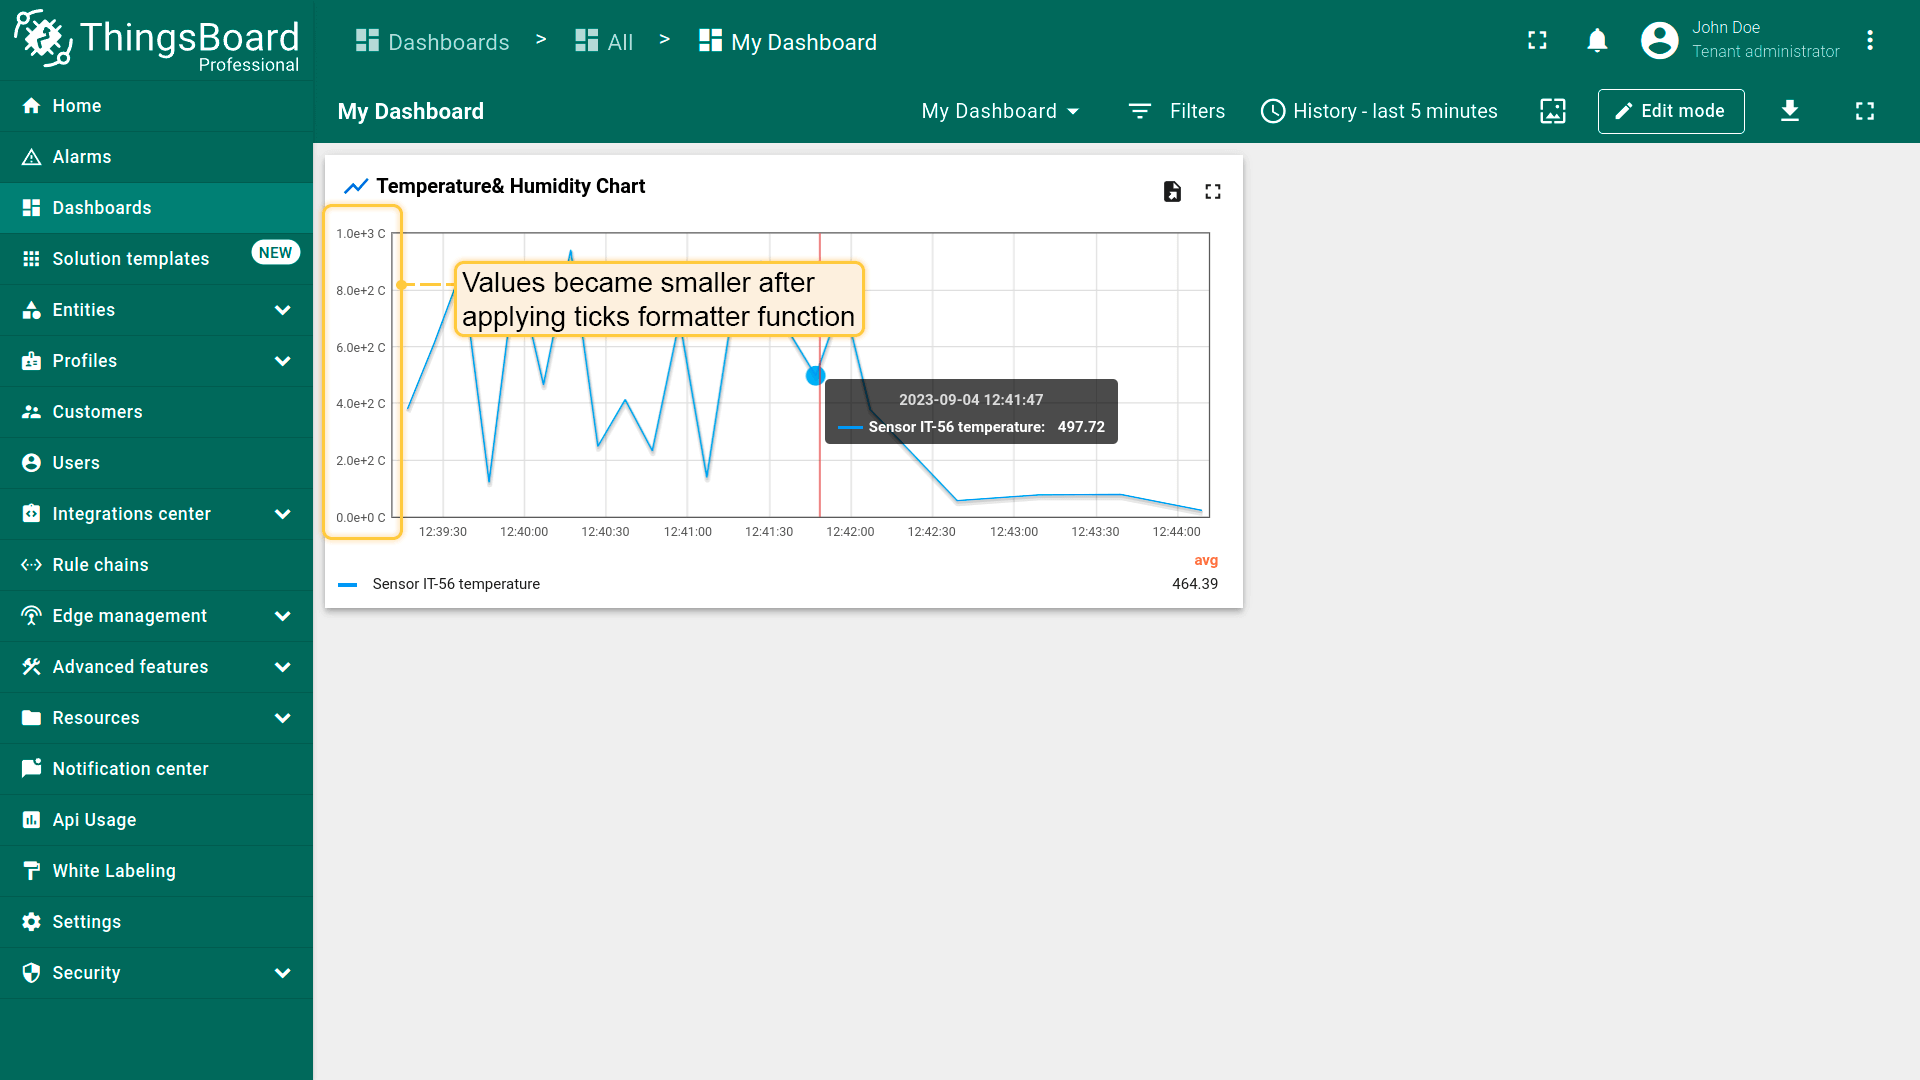
Ticks formatter function, f(value)
若遥测值为很大数值且带有单位符号,而仪表板空间有限需缩小图表时,可使用ticks-formatter函数将刻度值转换为更紧凑的形式。
1
return value.toExponential(1) + " C";
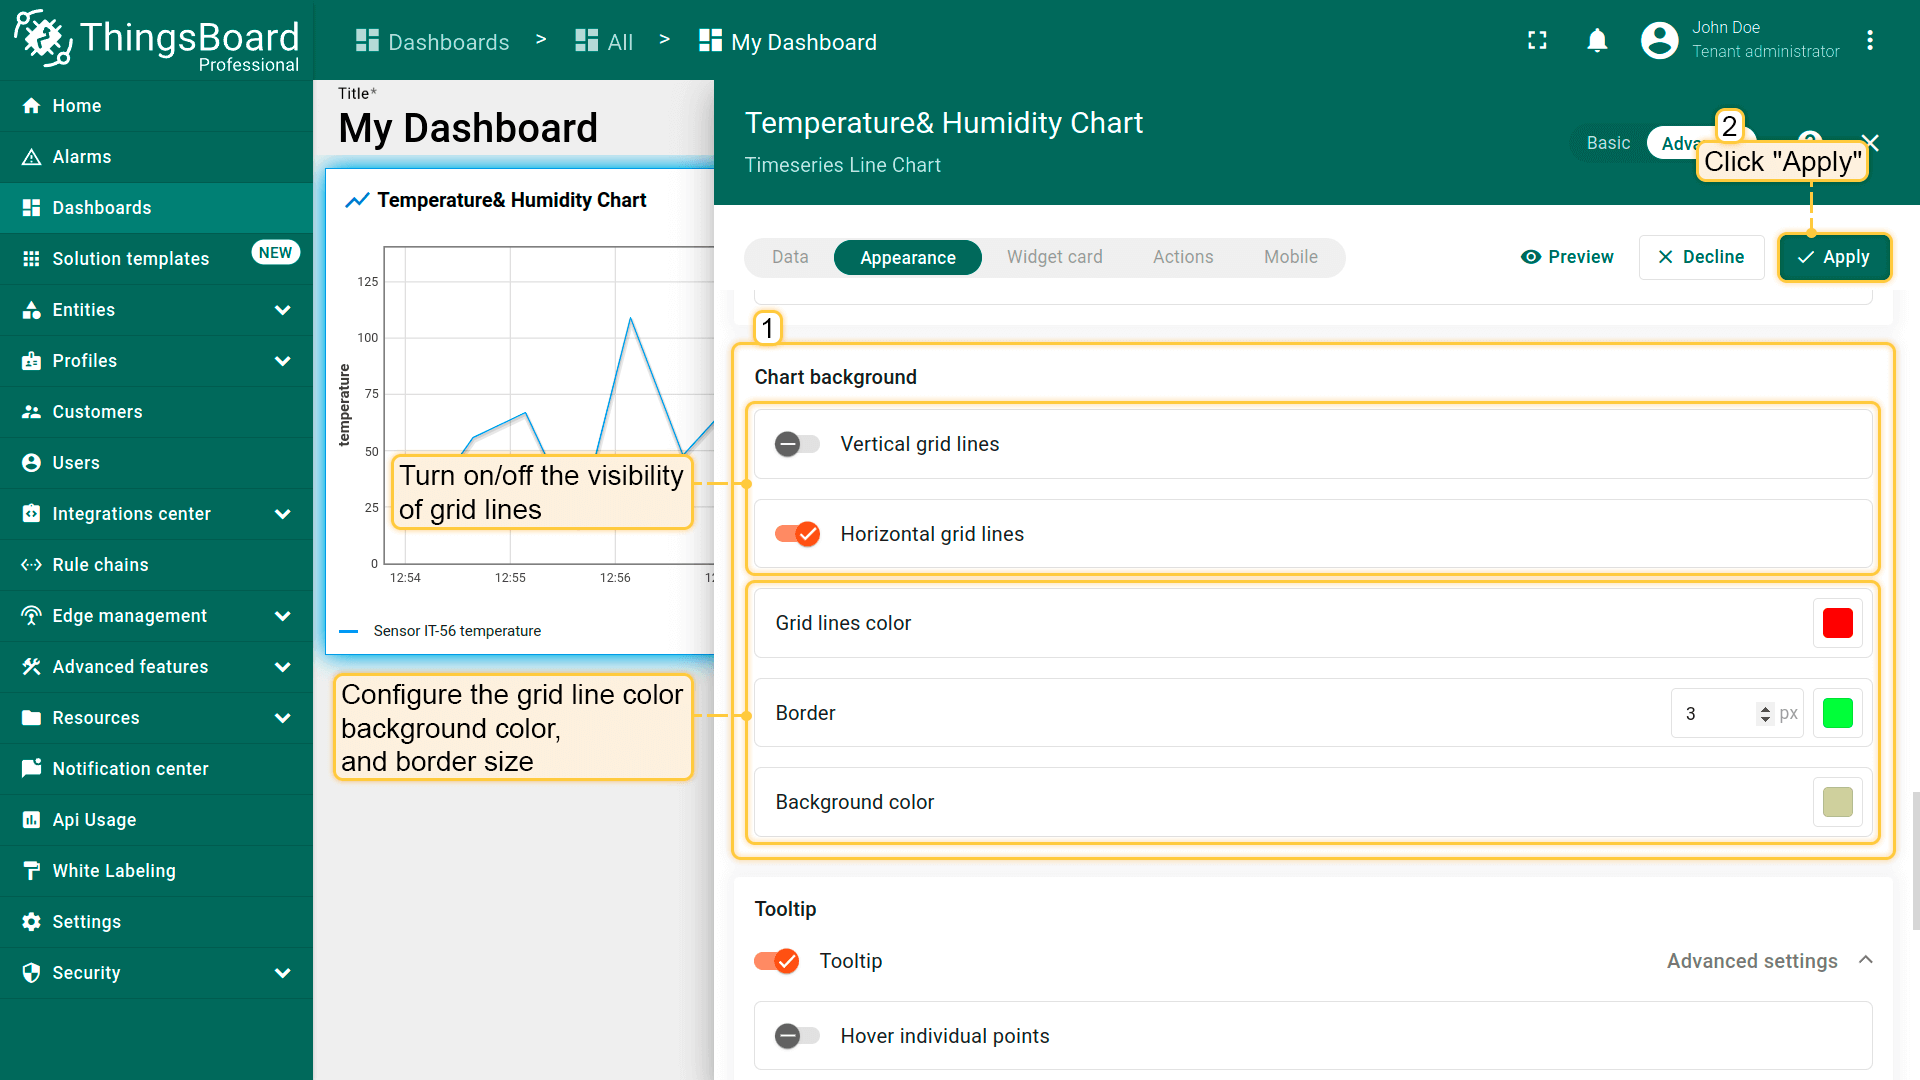
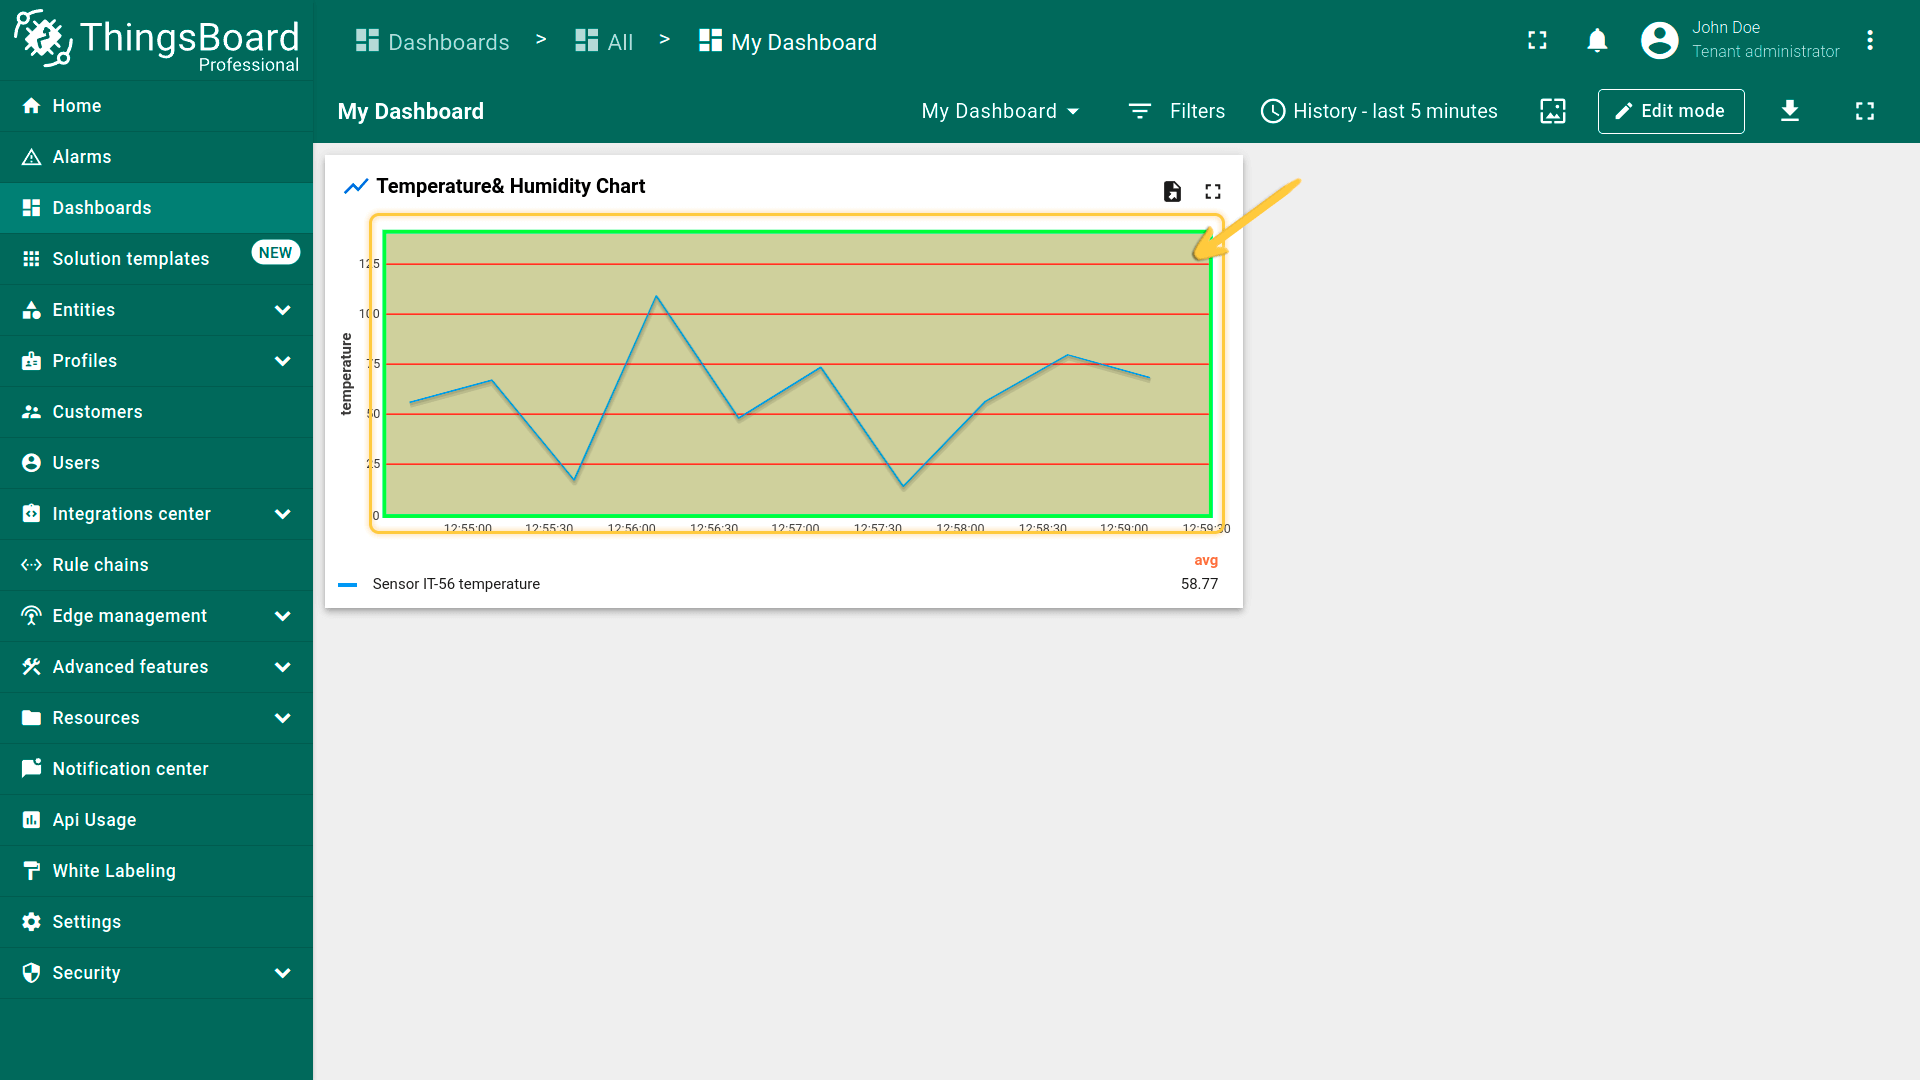
图表背景设置(Chart background settings)
可调整图表网格外观:自定义背景色、网格边框和刻度颜色,或关闭网格线显示。
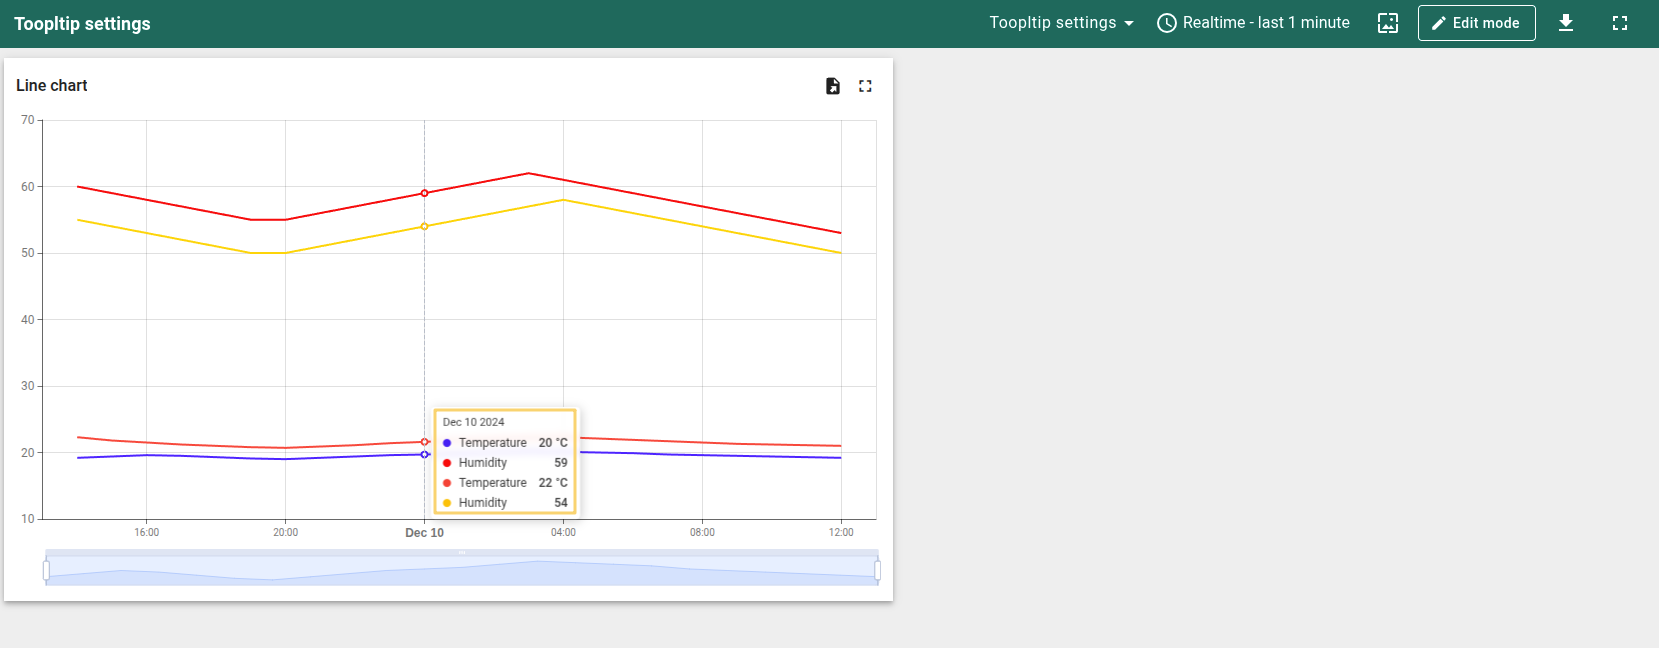
提示框设置(Tooltip settings)
-
Hover individual points。勾选\u201cHover individual points\u201d时,线条上不显示数值点。
-
Show cumulative values in stacking mode。启用堆叠模式时,可勾选\u201cCumulative values\u201d以显示所有实体值的总和。
f(value, latestData) 提示框格式化函数用于自定义提示框显示内容。
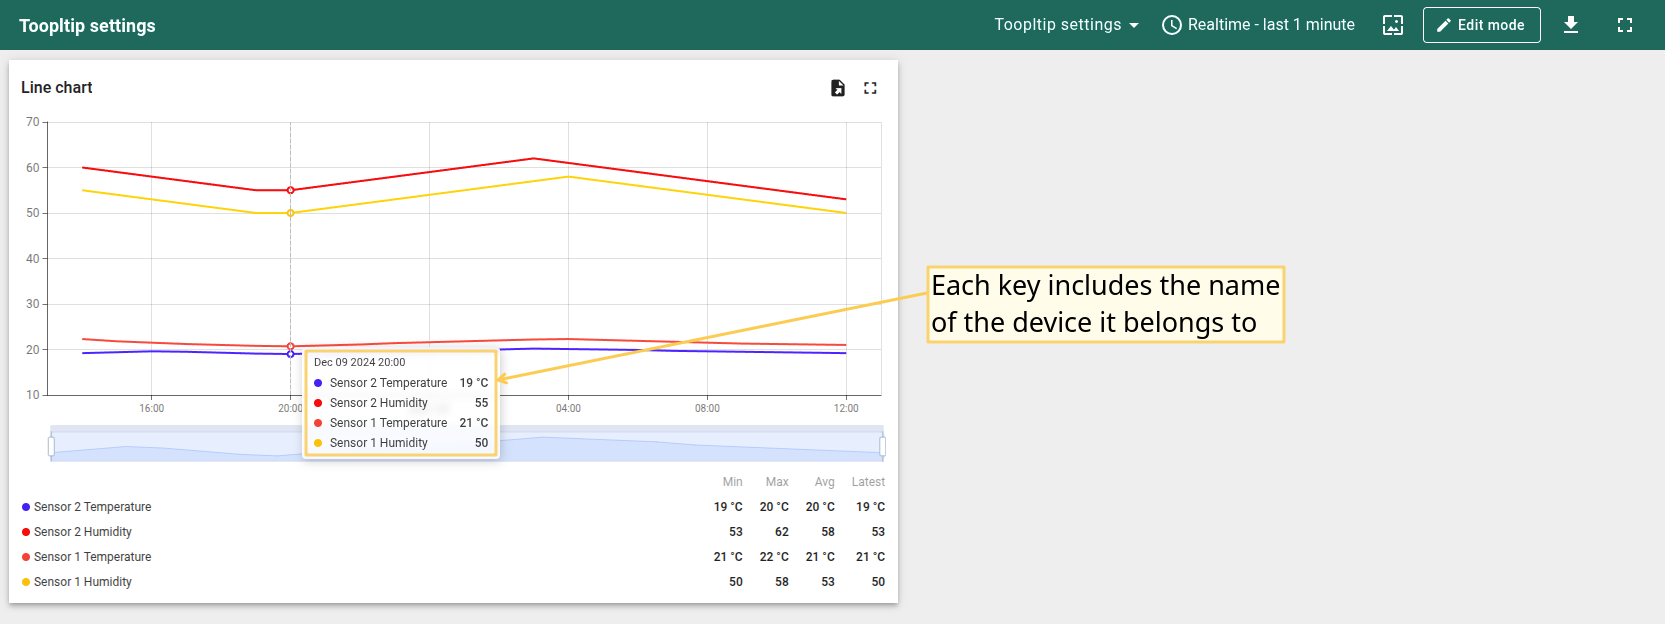
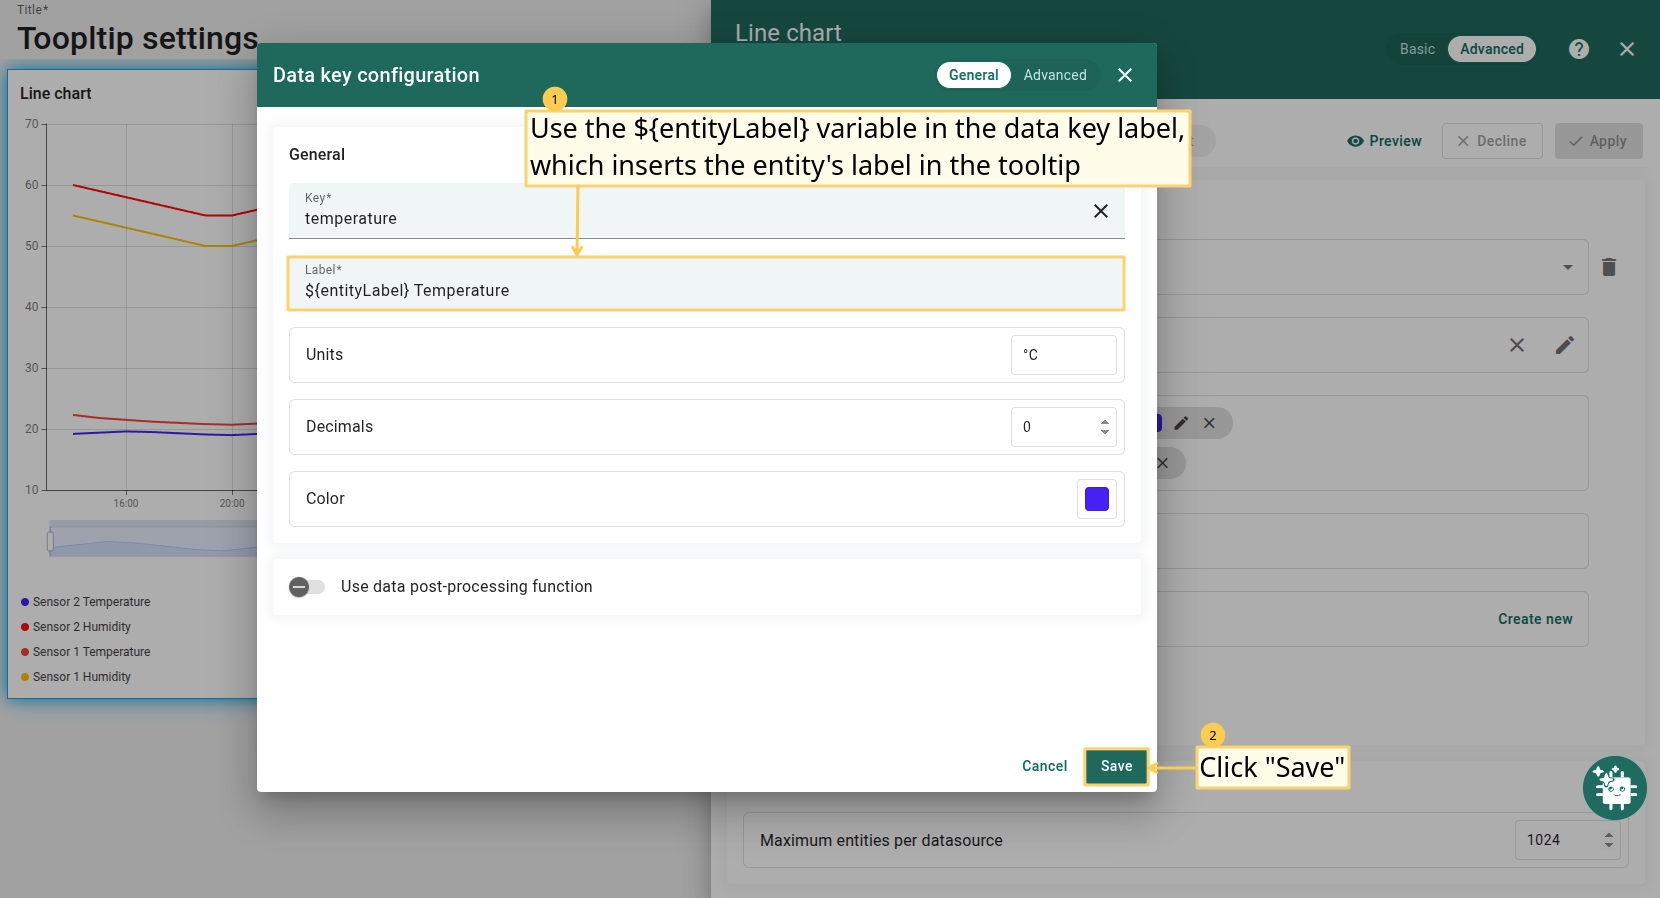
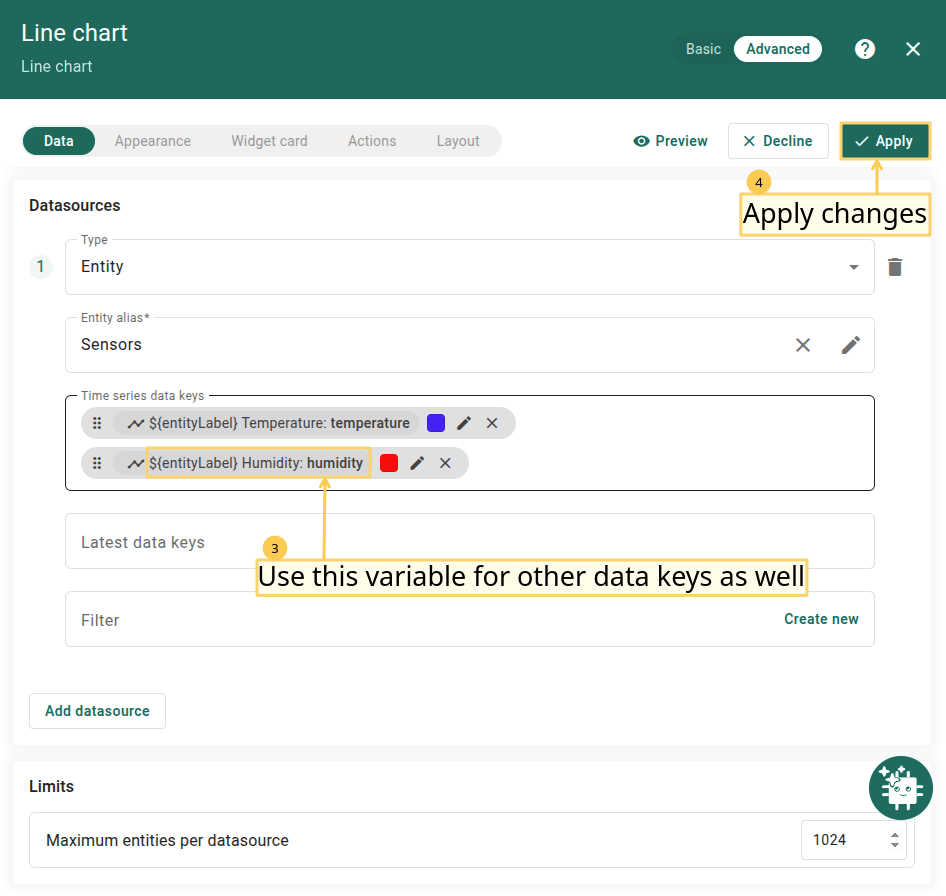
为使提示框更清晰,可在数据键配置的 Label 字段使用 ${entityName} 或 ${entityLabel}。
- ${entityName} — 在提示框中自动插入实体系统名称。
示例:设备名为 Sensor 1 时,${entityName} 处将显示 Sensor 1。
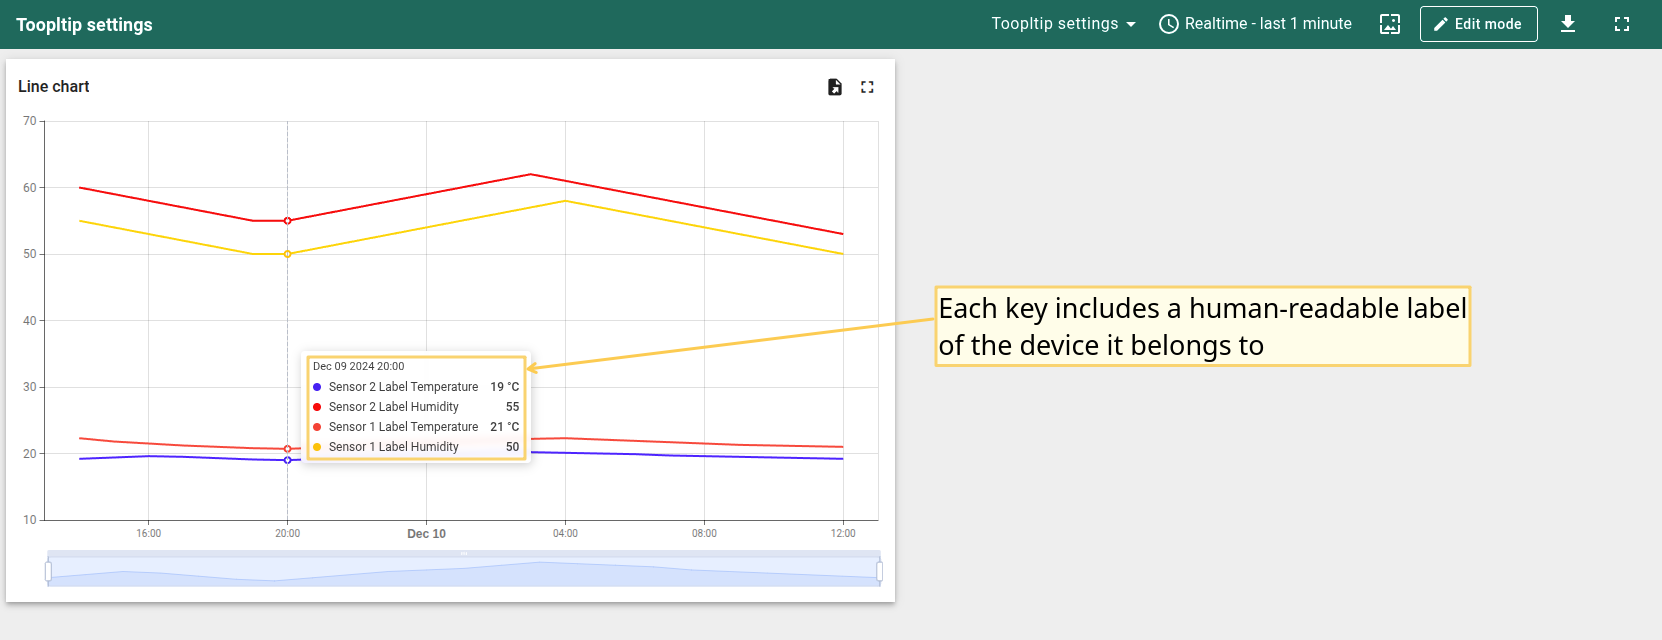
- ${entityLabel} — 在提示框中插入实体标签。
示例:设备 Name = Sensor 1,Label = Sensor 1 Label 时,${entityLabel} 处将显示 Sensor 1 Label。
可通过提示框设置或高级数据键配置自定义提示框显示内容。 通过Settings的提示框配置为基础配置,会同时应用于所有实体。在高级数据键配置中设置时,仅应用于特定时序数据,并会覆盖基础提示框函数。
在State Chart中,可根据实体值配置在提示框中显示的实体状态。
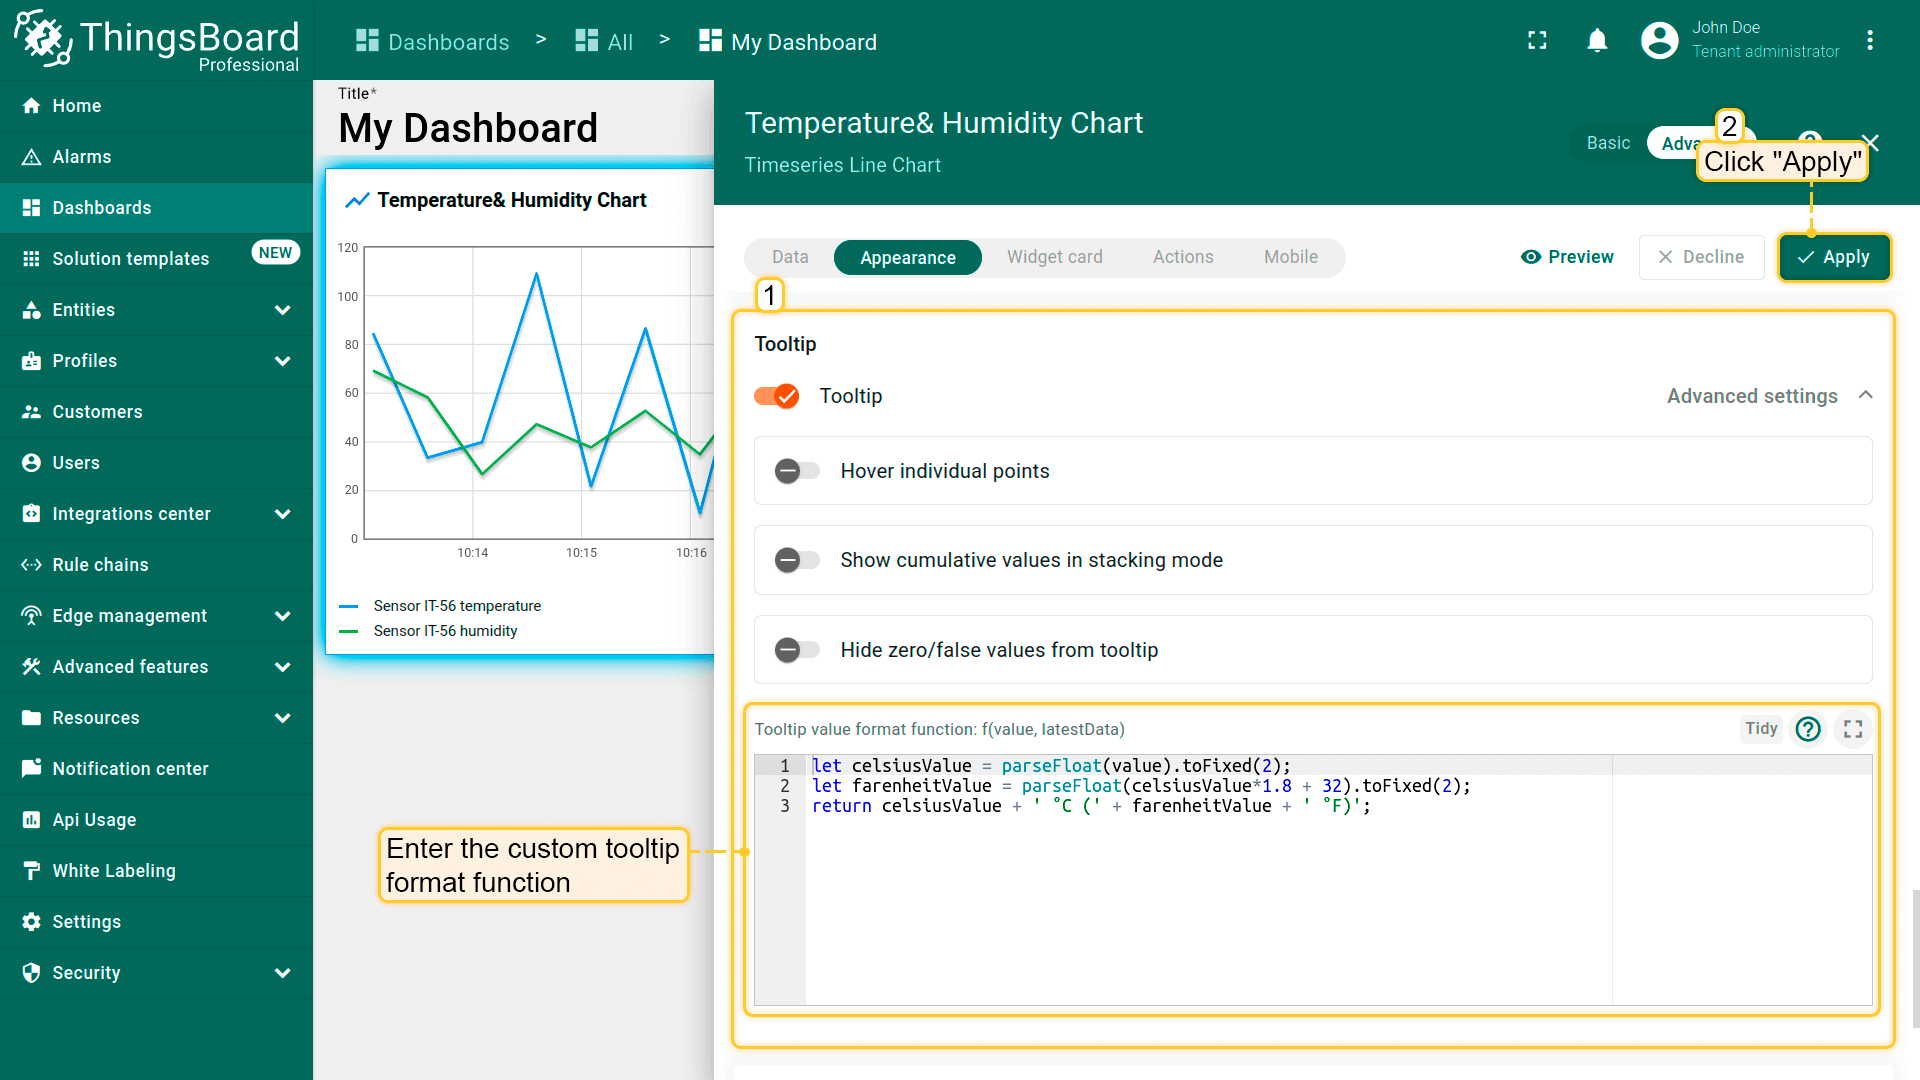
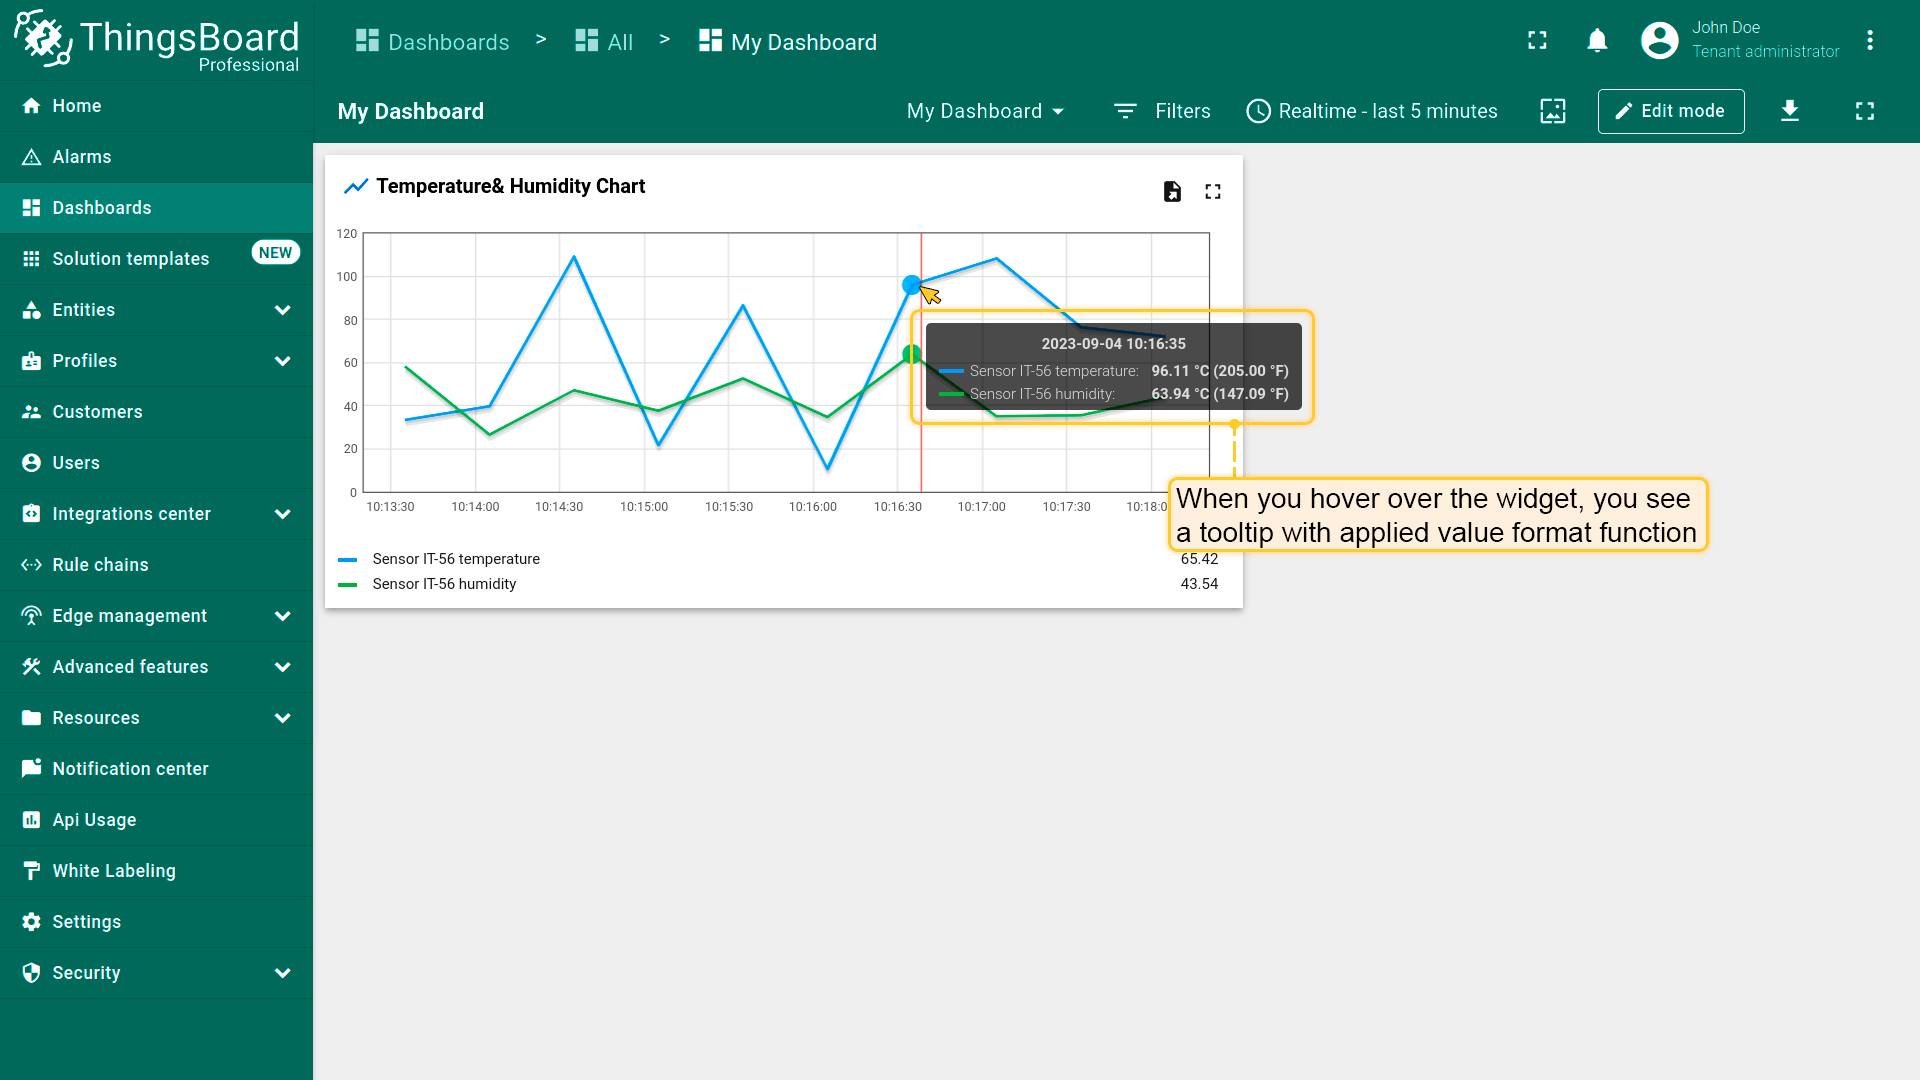
以下示例使用函数将摄氏度转换为华氏度并并排显示:
1
2
3
let celsiusValue = parseFloat(value).toFixed(2);
let farenheitValue = parseFloat(celsiusValue*1.8 + 32).toFixed(2);
return celsiusValue + ' °C (' + farenheitValue + ' °F)';
- In the Tooltip value format function field, enter your tooltip function, then apply changes;
- Hover with your mouse over the widget to see tooltip with applied value format function.
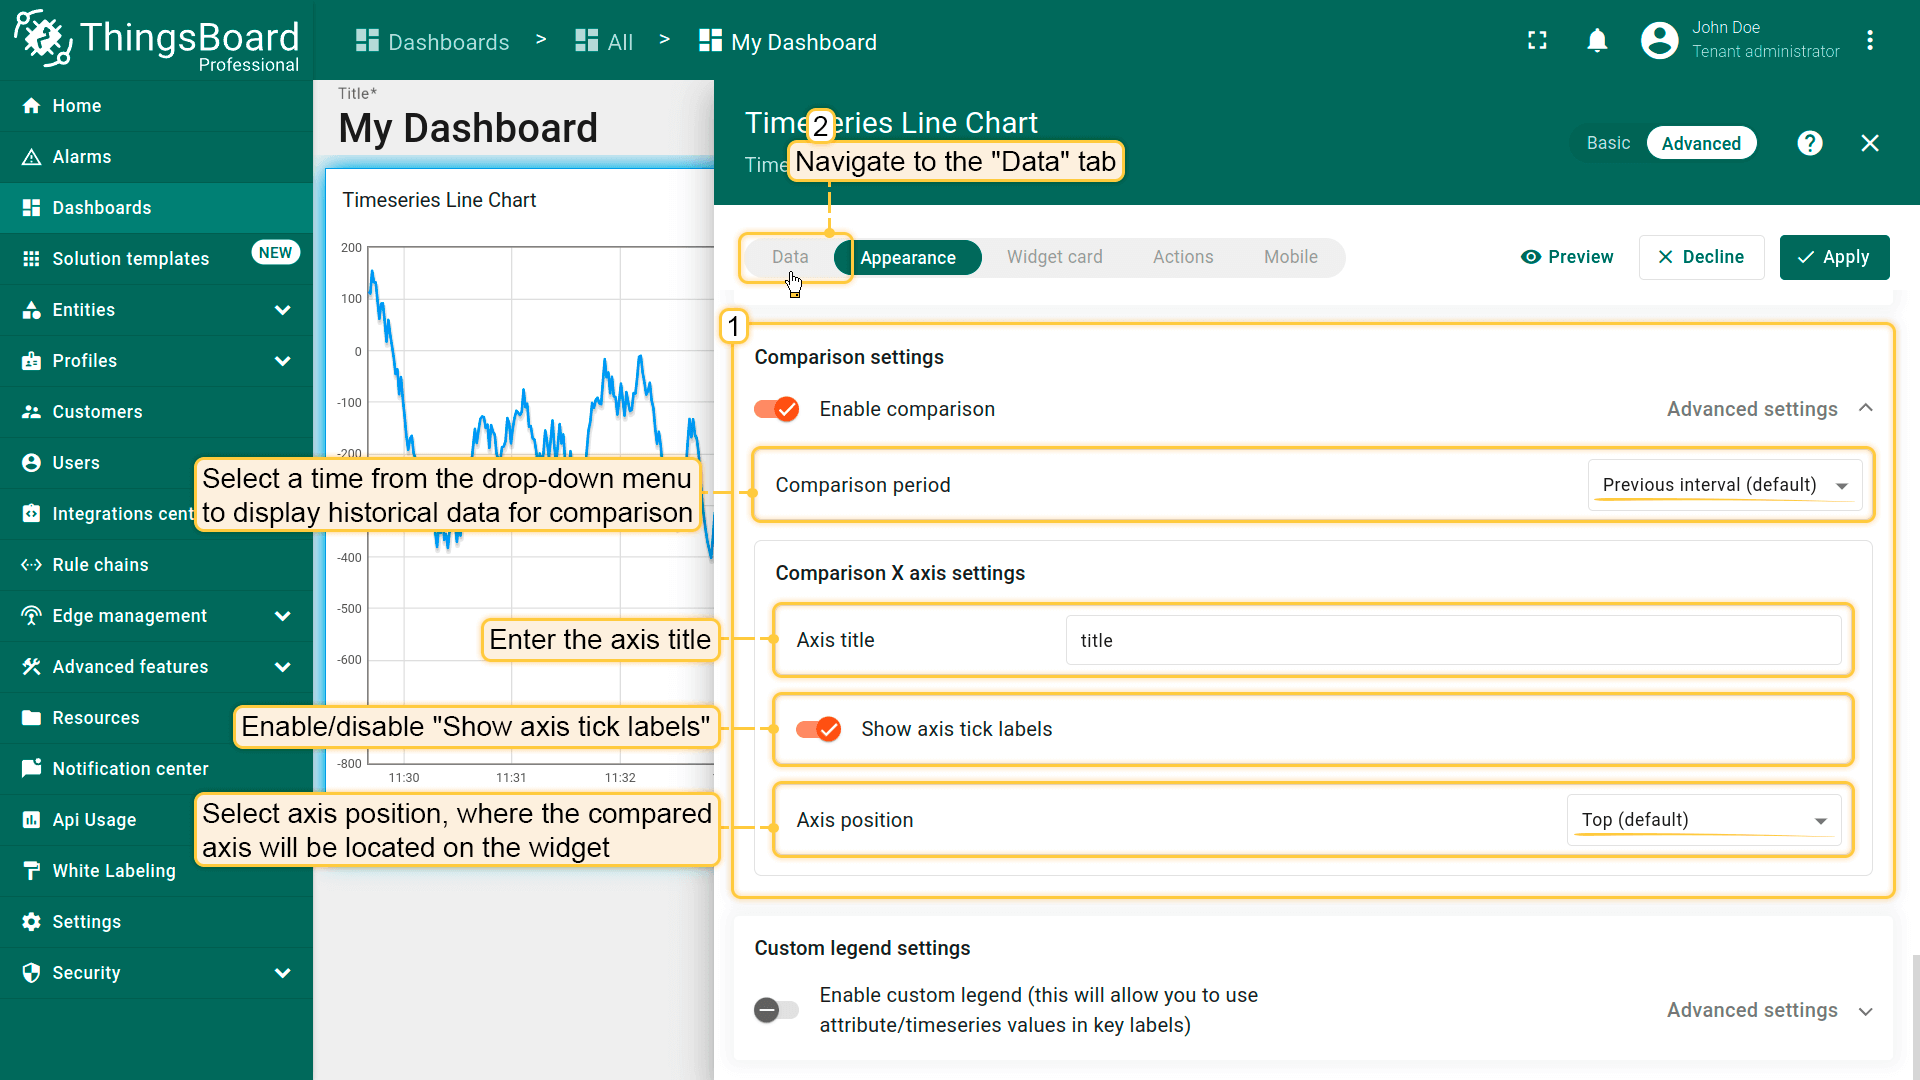
对比设置(Comparison settings)
可显示用于对比的历史数据。
- In the "Appearance" tab, toggle the "Enable comparison" checkbox and from the drop-down menu select time to show historical data with which to compare. In the "Comparison X axis settings" section, select axis position, where the compared axis will be located on the widget. Also, you can enter the axis title and show axis tick labels;
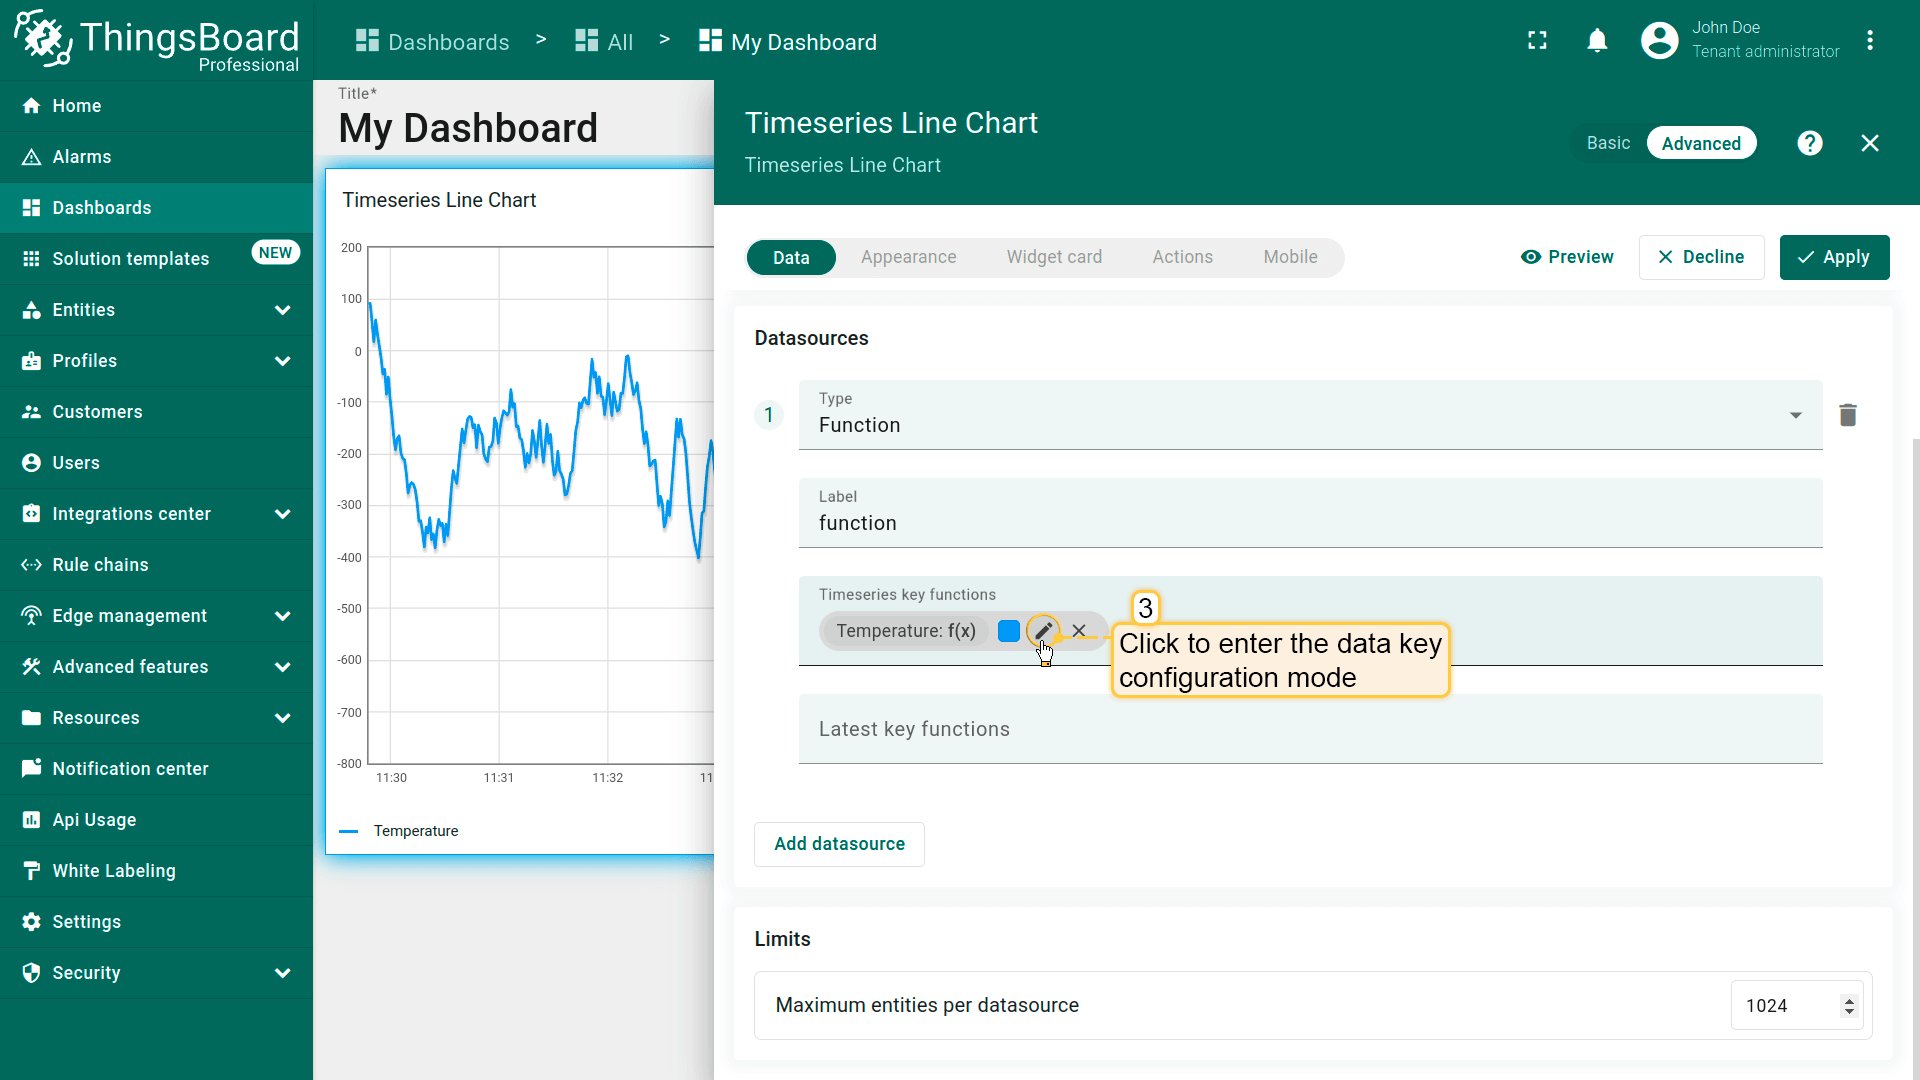
- Navigate to the "Data" tab and click the “pencil” icon of a key in the data keys row;
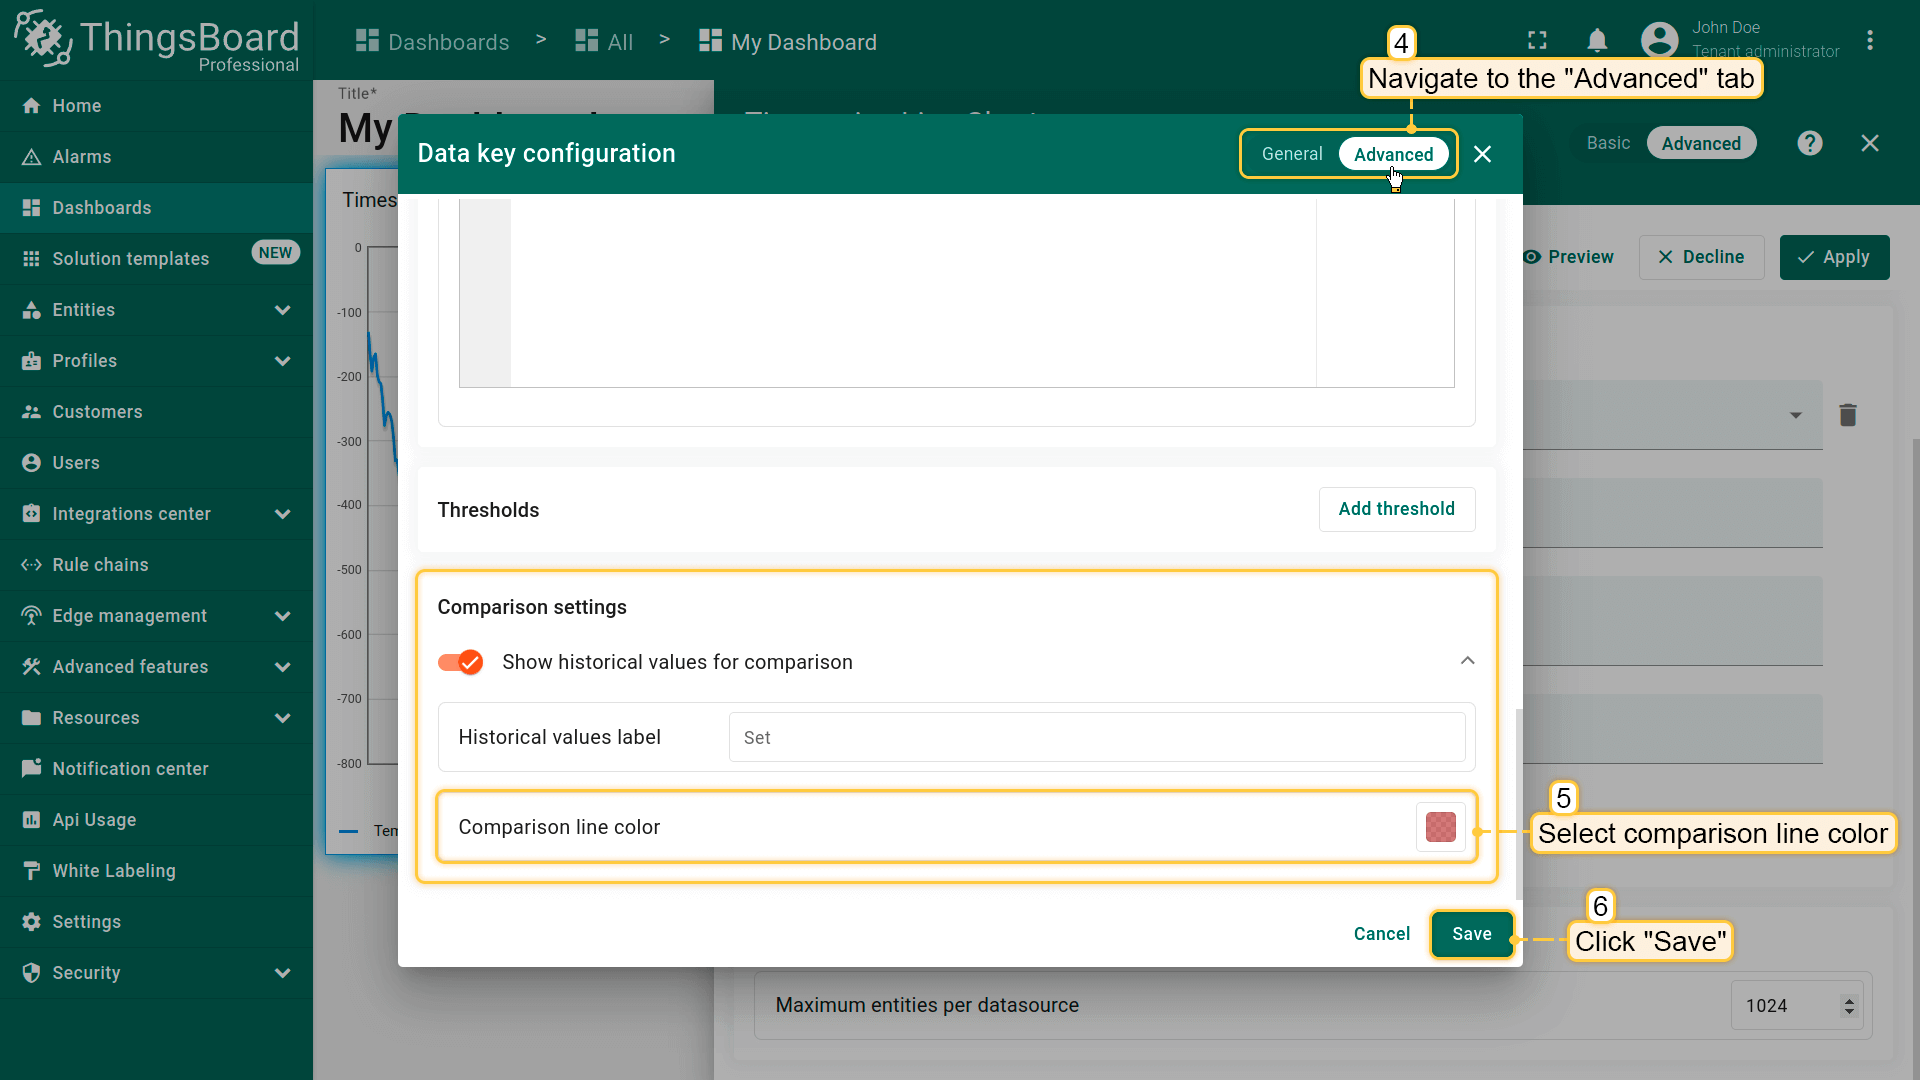
- In the data key configuration window, navigate to the "Advanced" tab and choose the comparison line color. When you are done with Comparison Settings configuration, then apply changes;
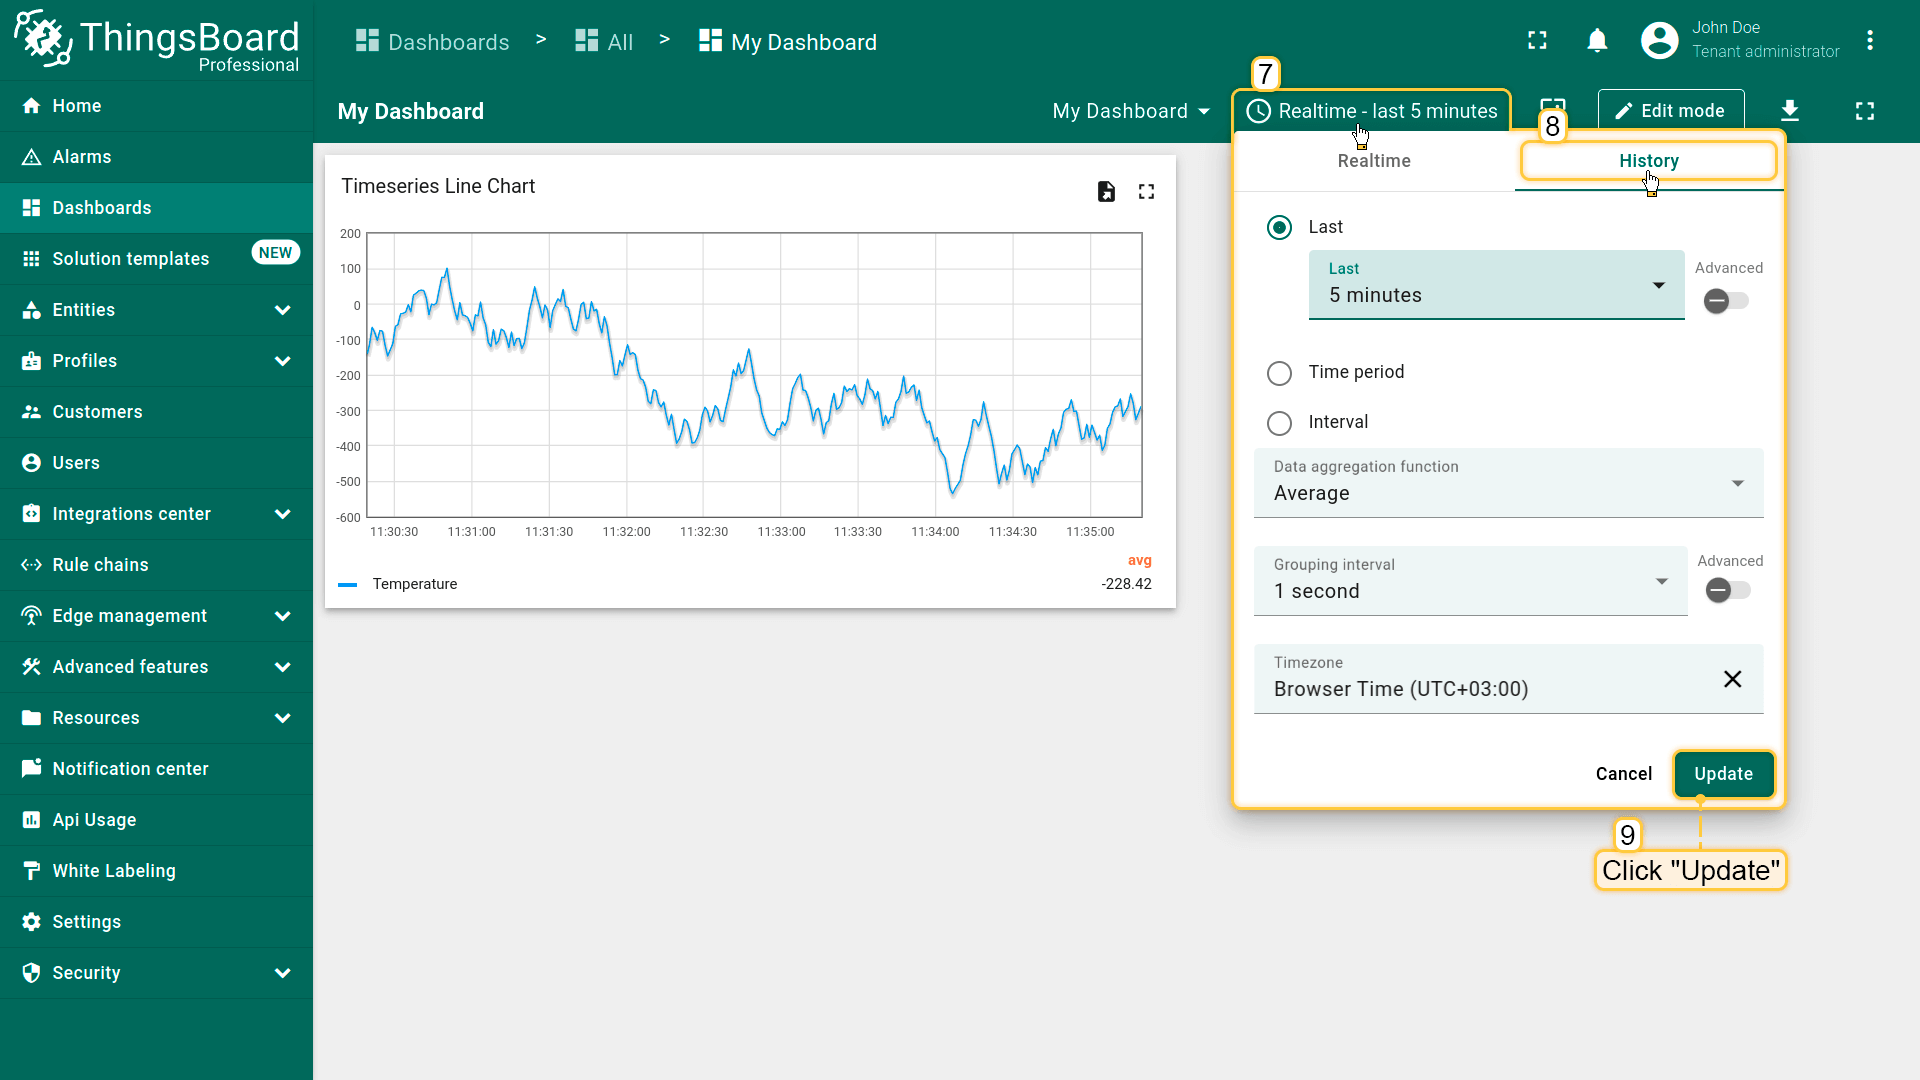
- Since comparison settings work only in history time window mode, click "Edit time window" icon in the dashboard toolbar, go to the "History" tab, and select the time interval with which you want to compare the current data. Then click "Update" to apply;
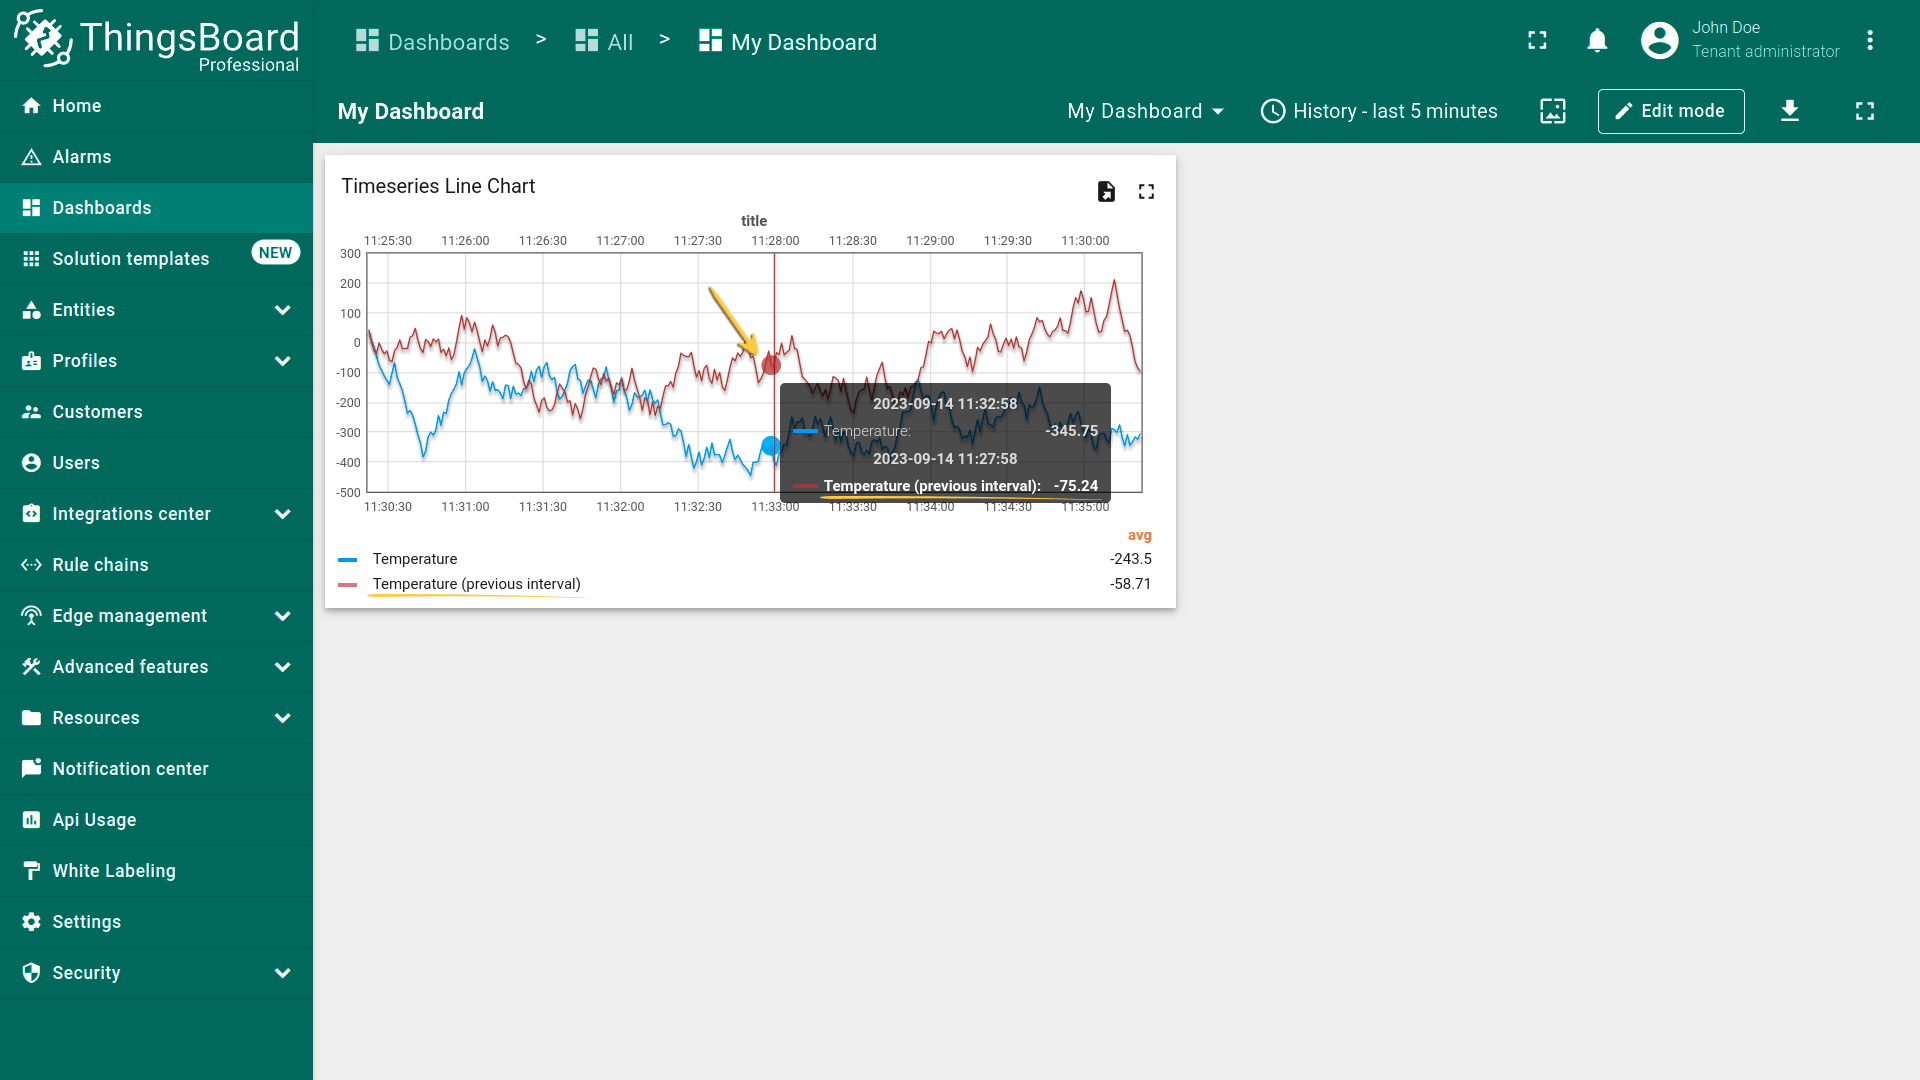
- Now you can compare the value for the current minute and the five minutes ago.
自定义图例设置(Custom legend settings)
当需展示不适合图表形式的数据(如特定属性),或仅需在图表图例中显示部分时序时,可使用Custom Legend Settings。 例如,active/inactive等属性可显示在Table部件中,但无法直接显示在图表上。
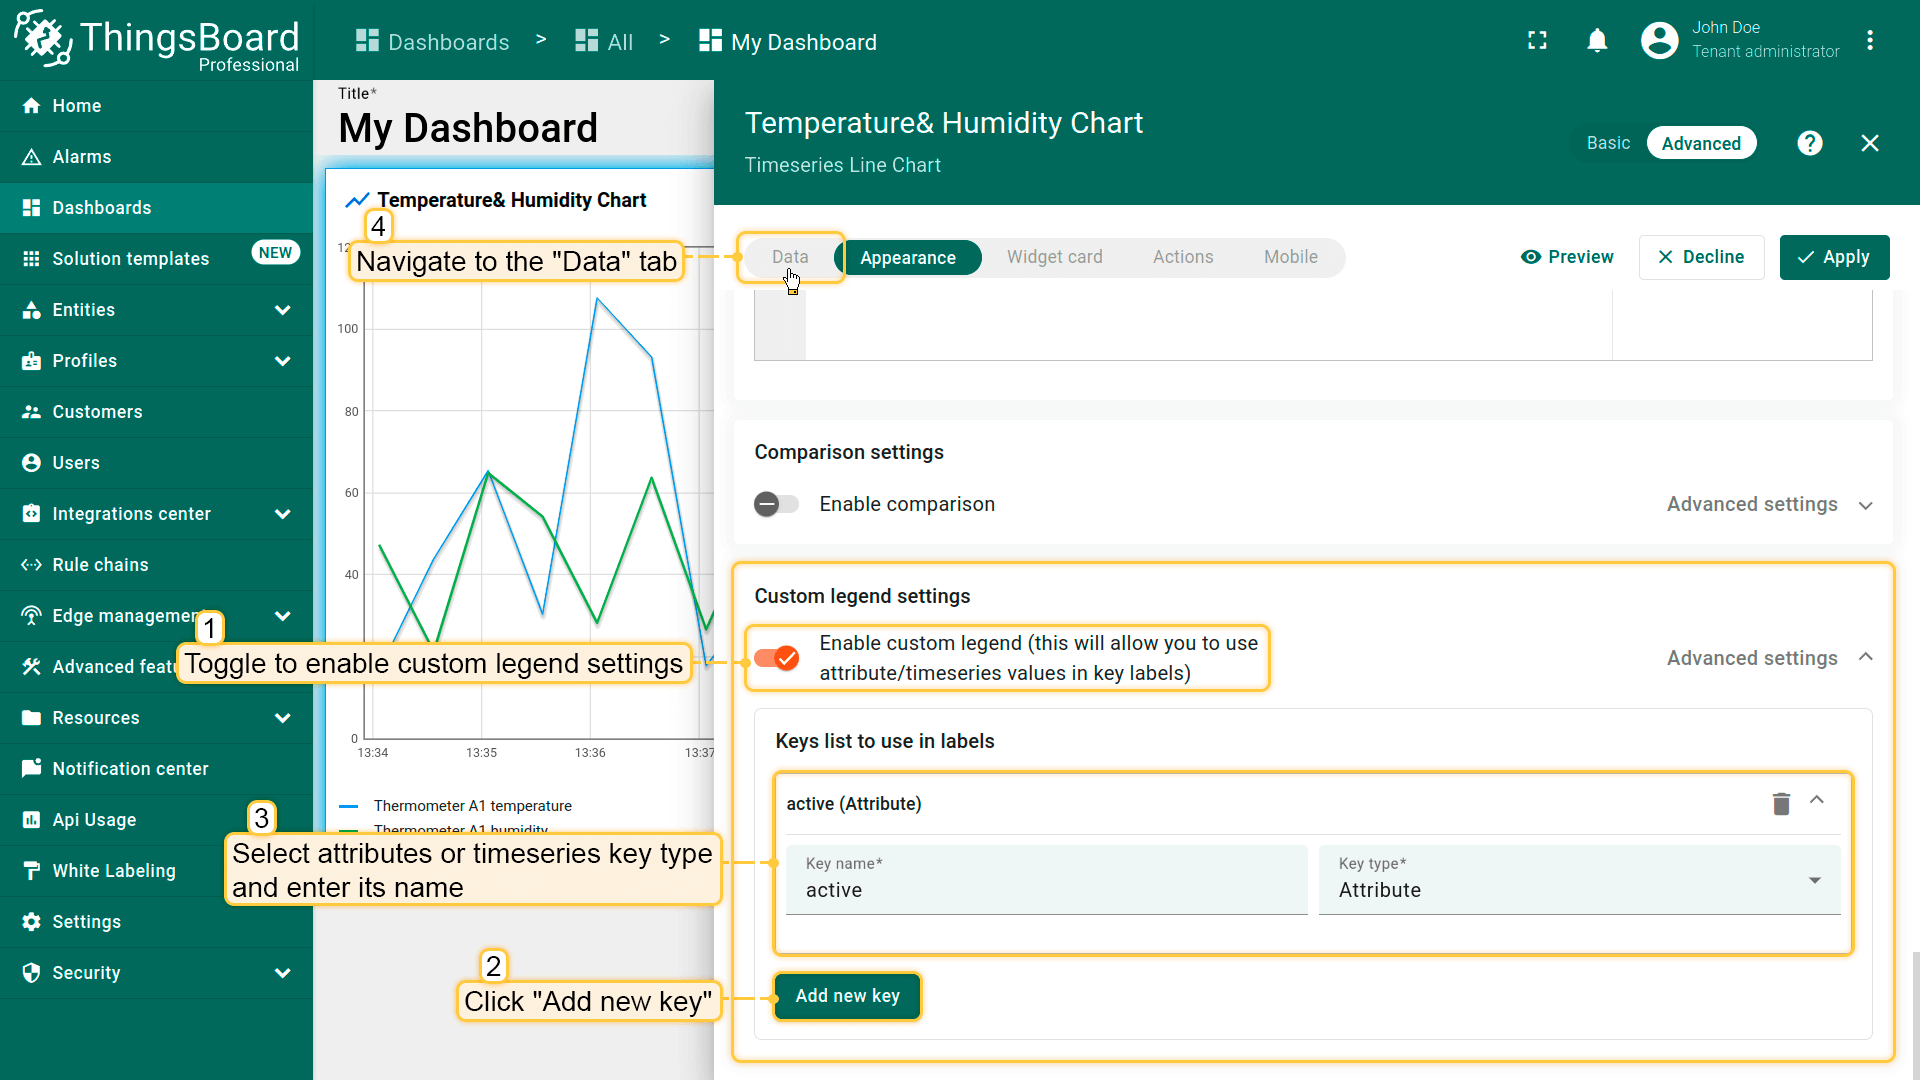
- Navigate to the "Appearance" tab. Activate the "Enable custom legend" option to use attribute or time series values as key labels. Click on "+ Add new key". In the drop-down menu that appears, input the key name and choose the key type;
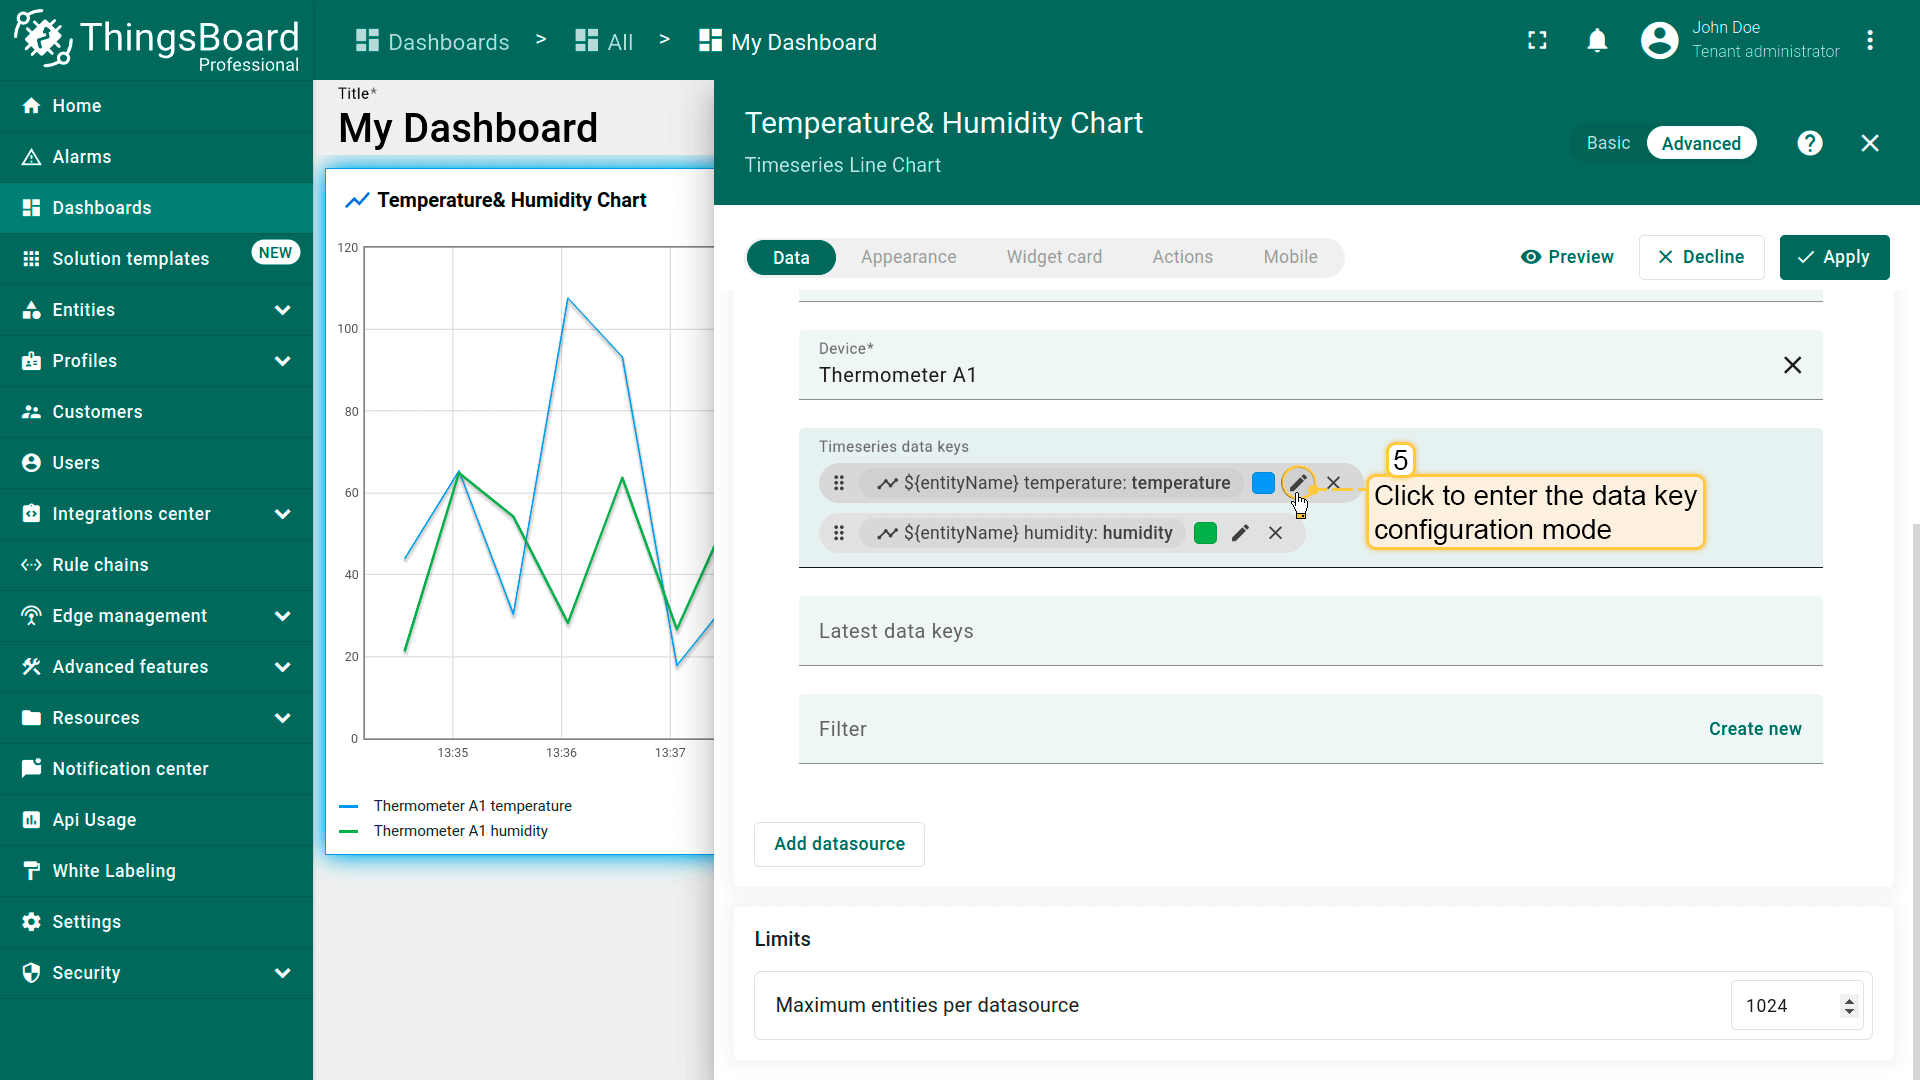
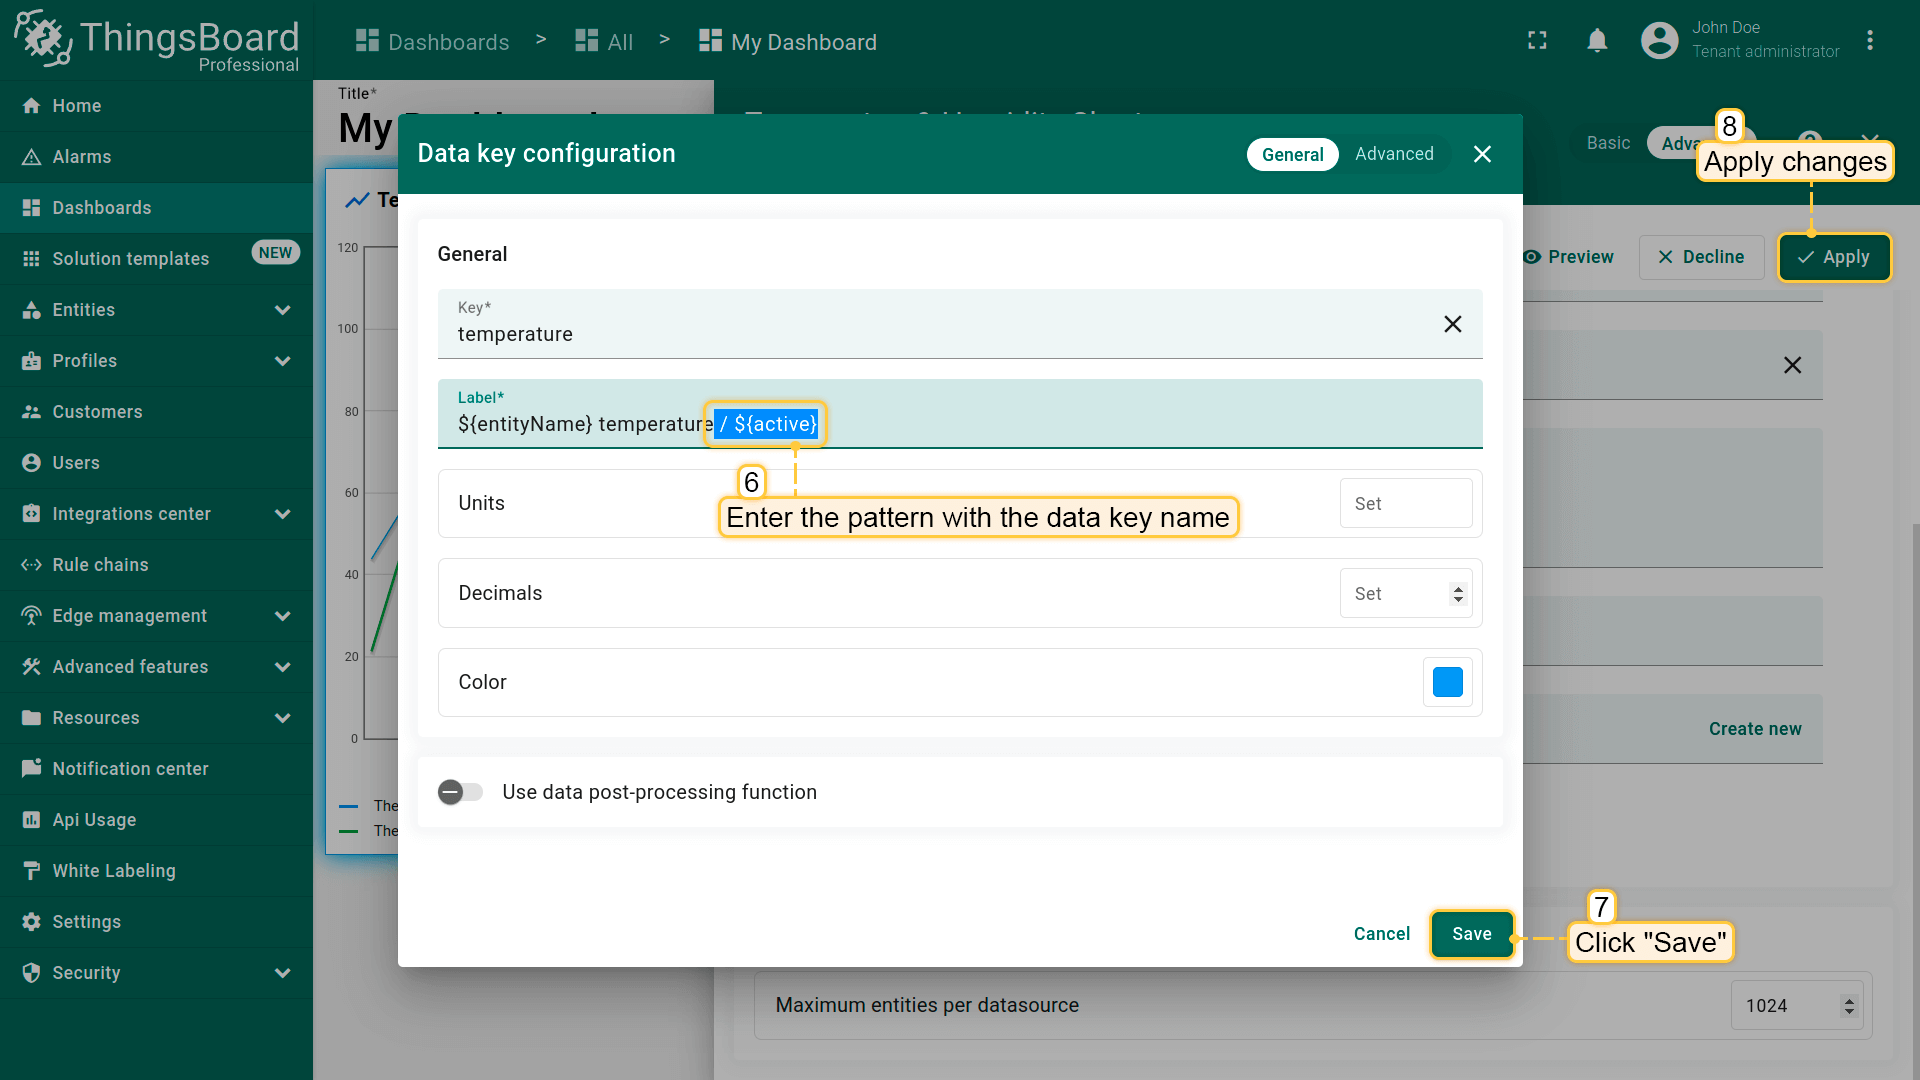
- Proceed to the "Data" tab. Click the pencil icon next to a data key to access the Data key configuration window;
- In the label line, input the pattern ${} and place the data key name within the brackets. Click "Save" to set the new label name and apply all changes;
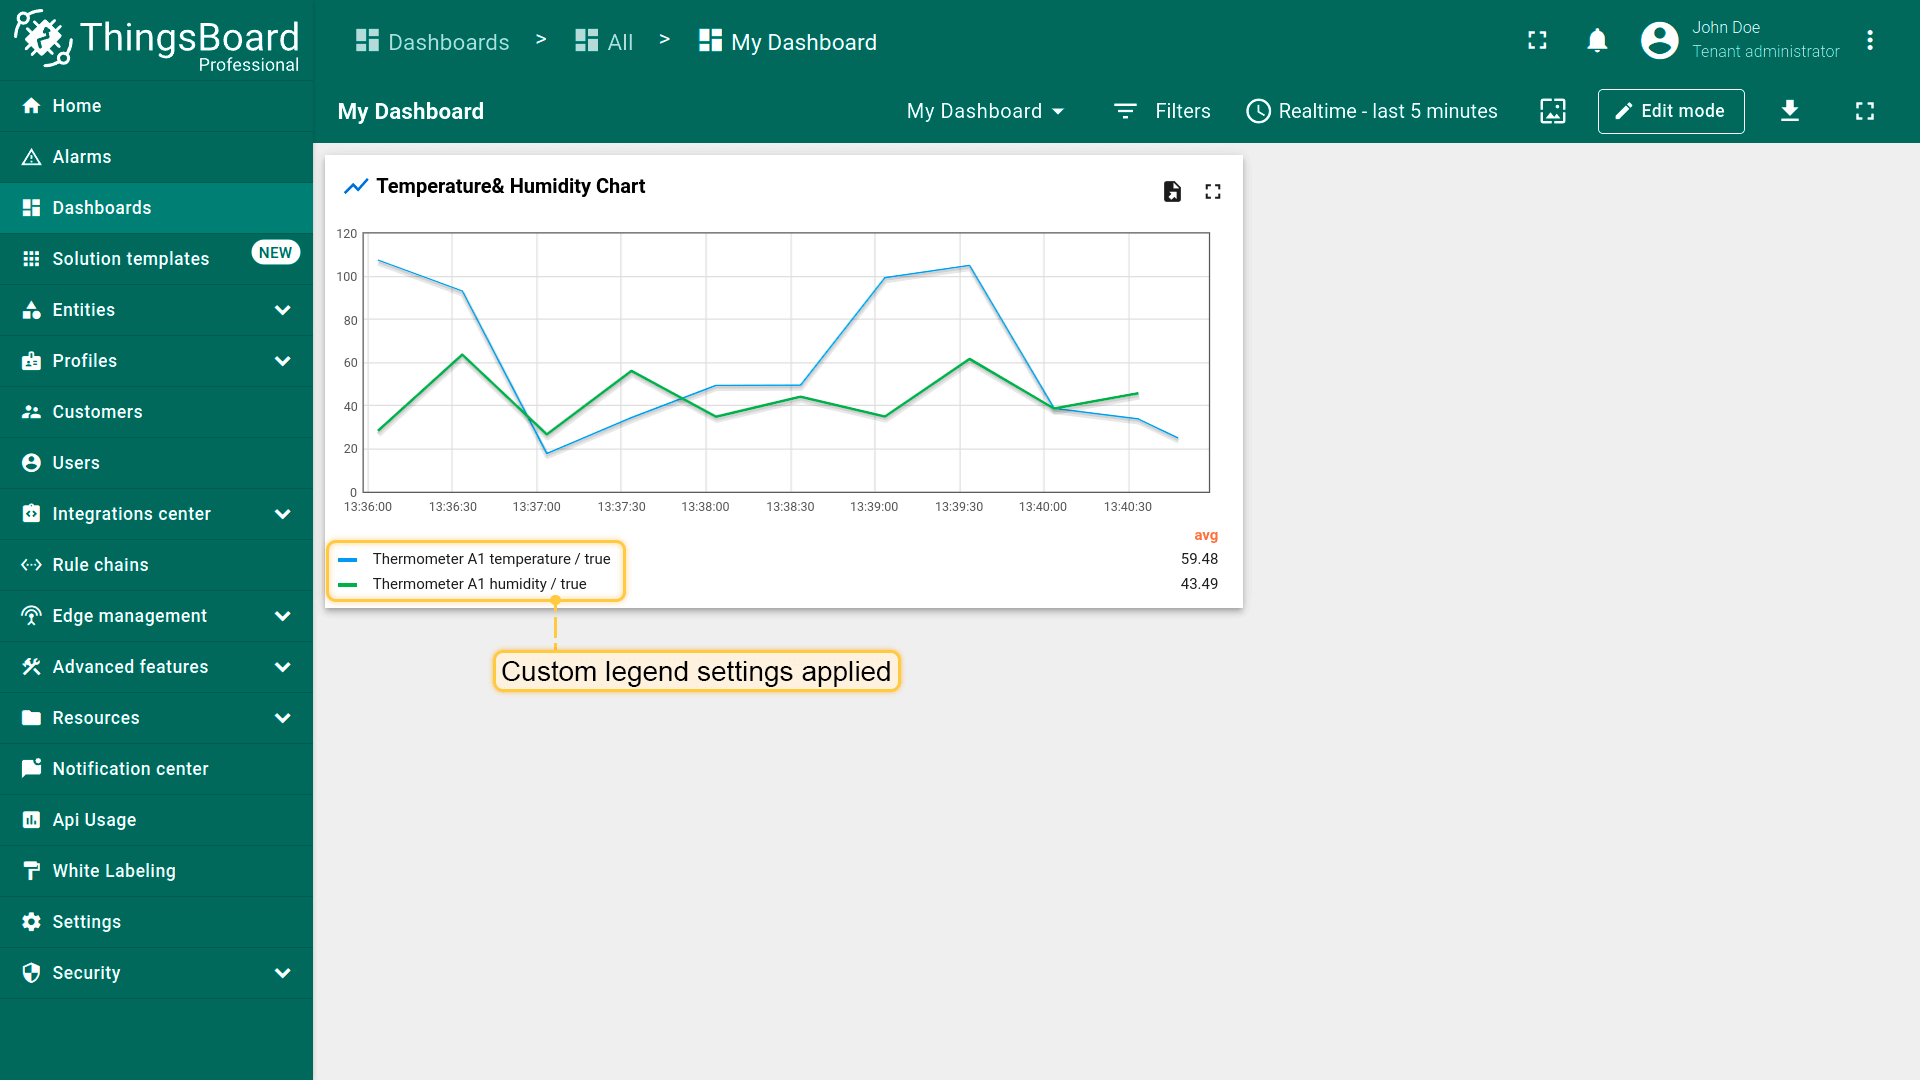
- Now, when you view the widget, you'll see that the custom legend settings have been applied.
部件卡片(Widget card)
部件标题设置(Widget title settings)
可输入自定义部件标题、提示文本和标题样式,也可添加图标并控制图标颜色与大小。参见下方配置与效果。

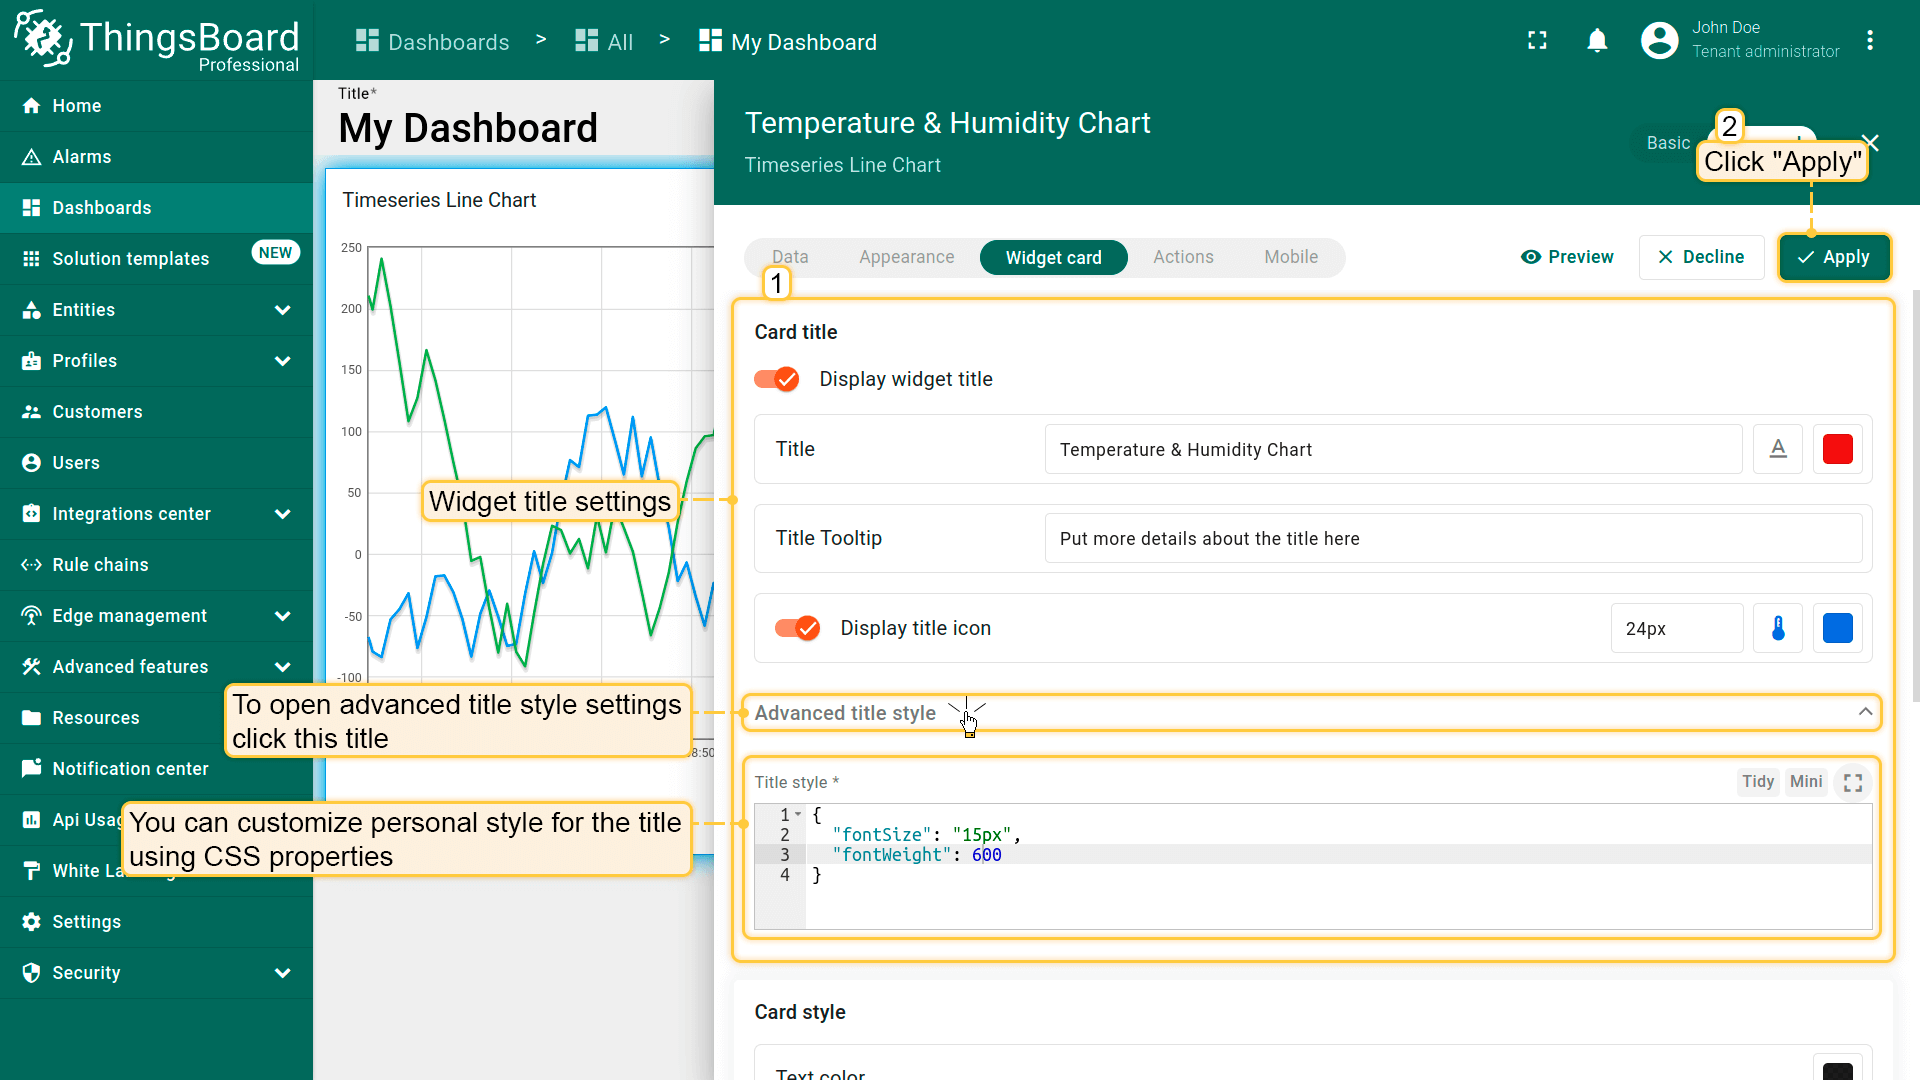
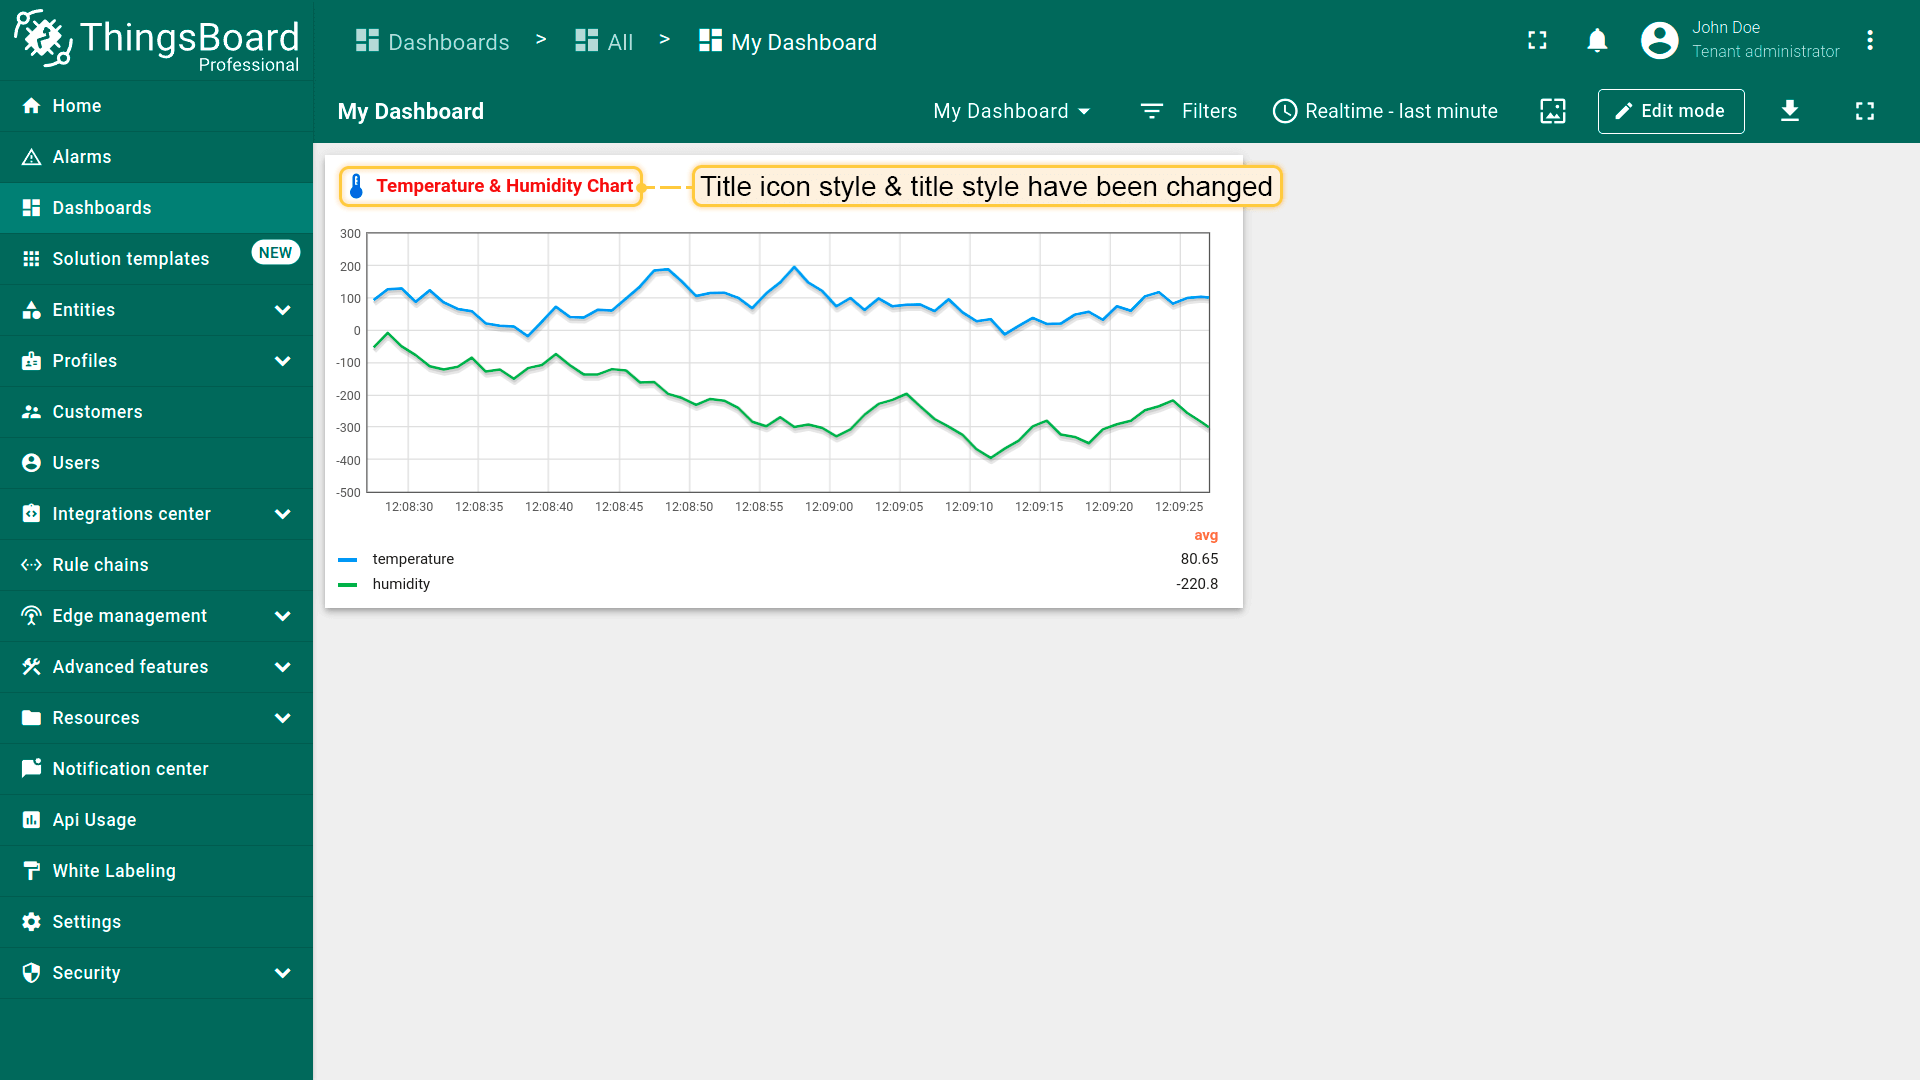
上方界面中的标题样式示例:
1
2
3
4
{
  "fontSize": "15px",
  "fontWeight": 600
}
部件样式设置(Widget style settings)
可使用CSS属性自定义部件样式,样式将应用于部件的主div元素。
可通过\u201cDrop shadow\u201d关闭阴影,通过\u201cEnable fullscreen\u201d关闭全屏。以上选项默认均启用。
可修改背景色、文字颜色、内边距和外边距。参见下方配置与效果。
注意:示例中的样式和背景色仅供参考,非官方规范。
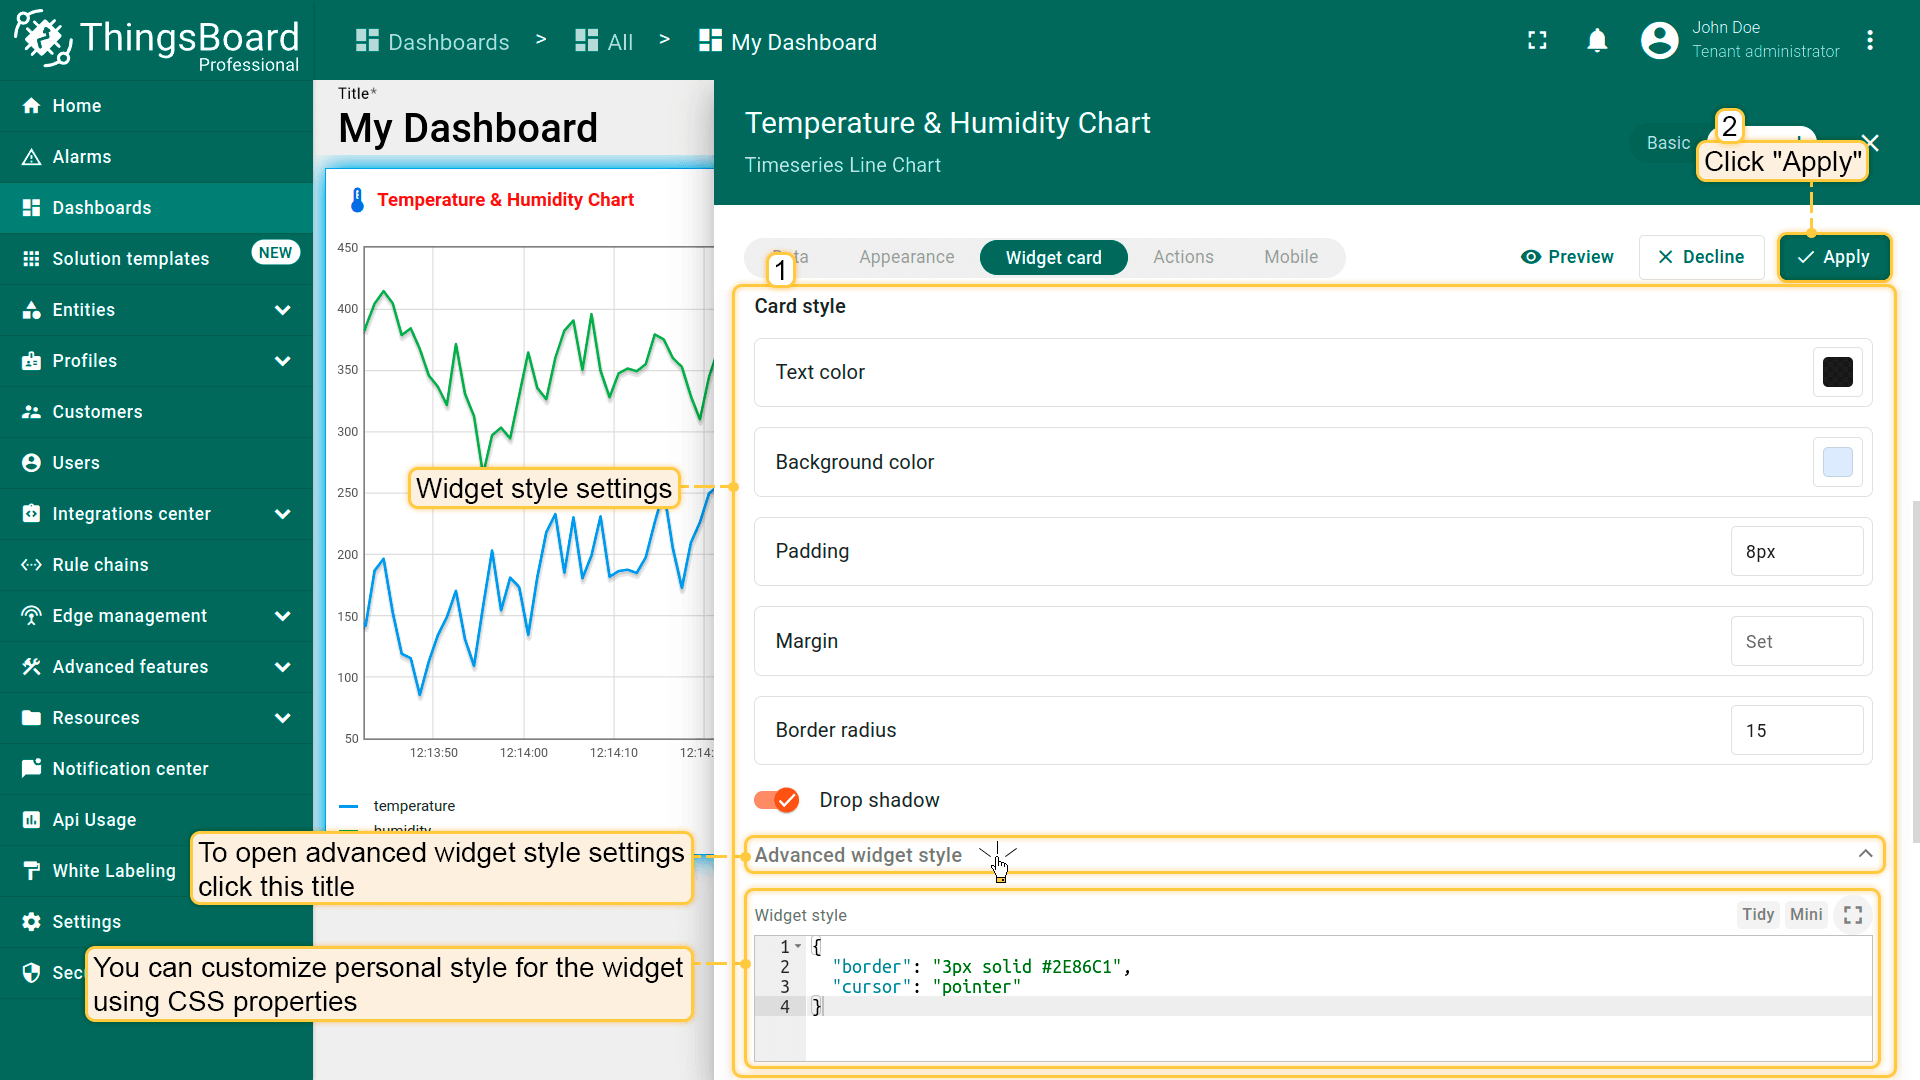
上方界面中的部件样式示例:
1
2
3
4
{
  "border": "3px solid #2E86C1",
  "cursor": "pointer"
}
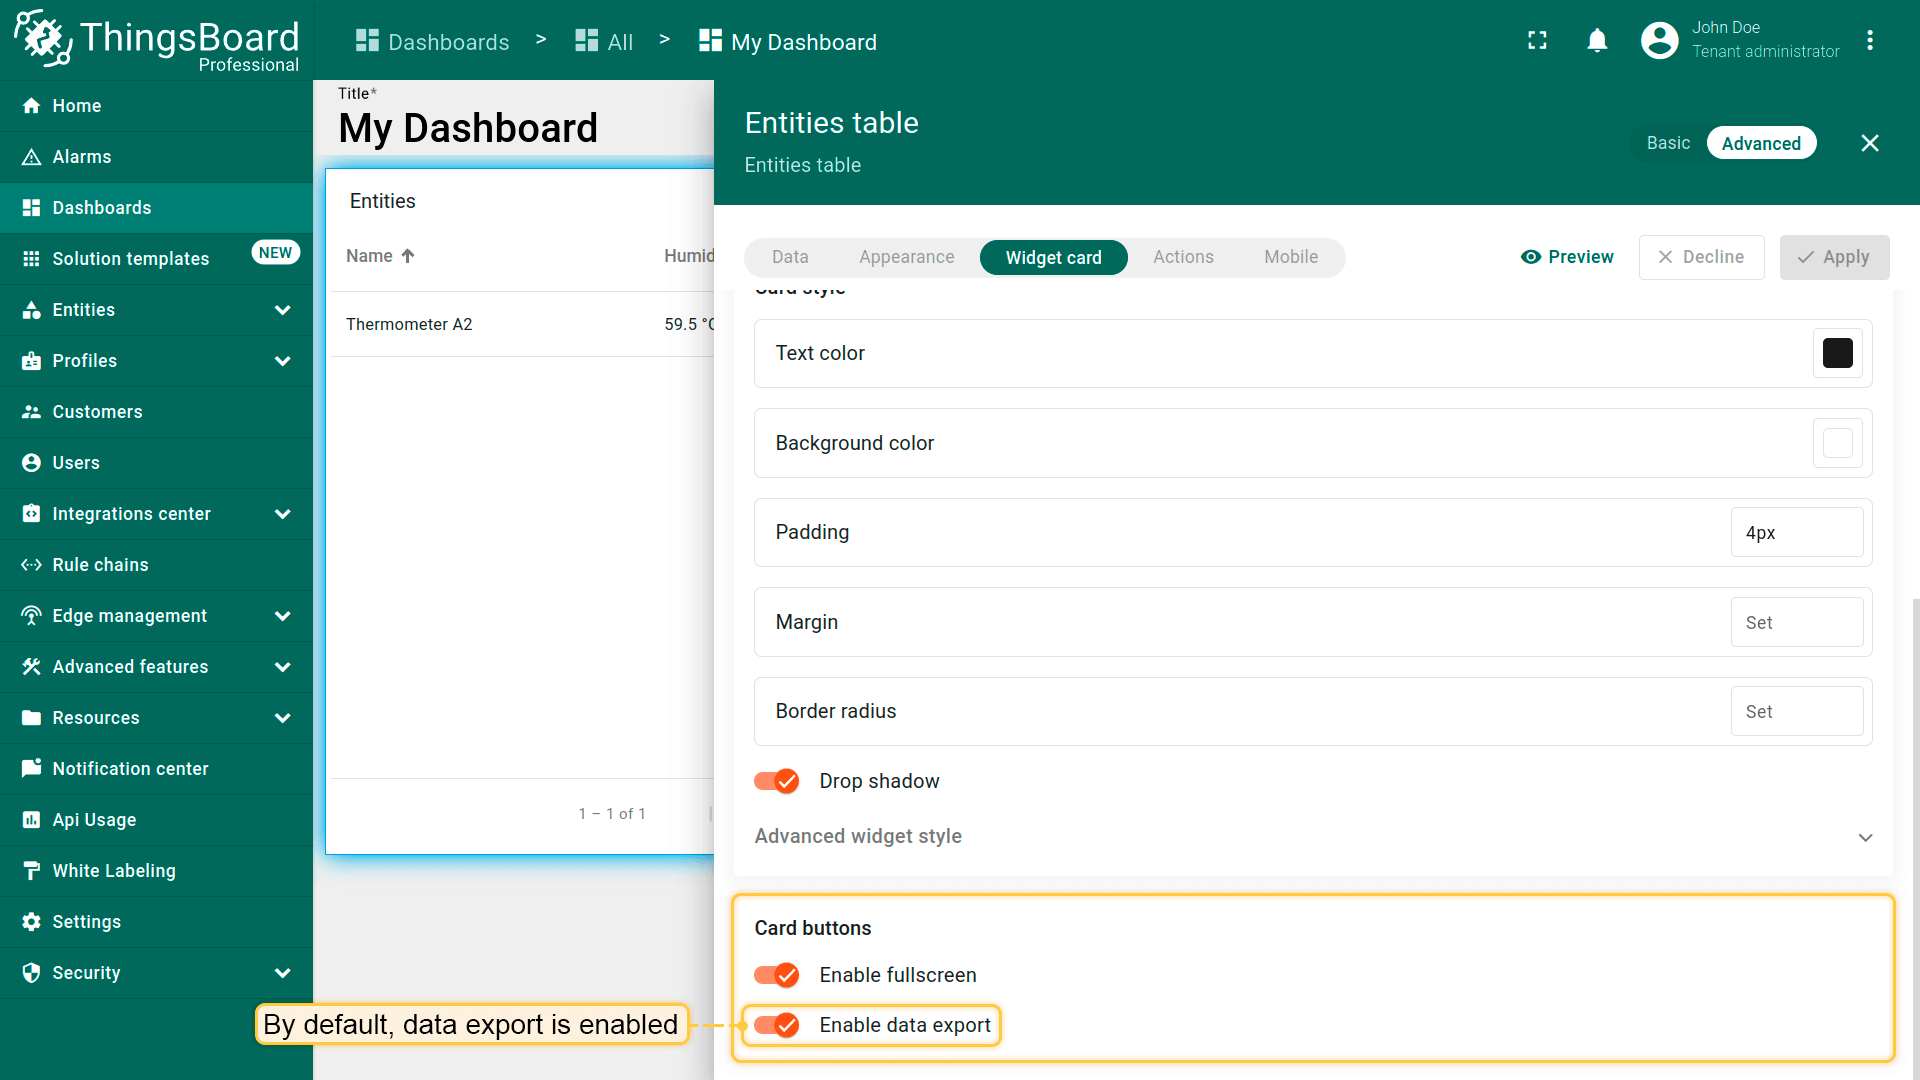
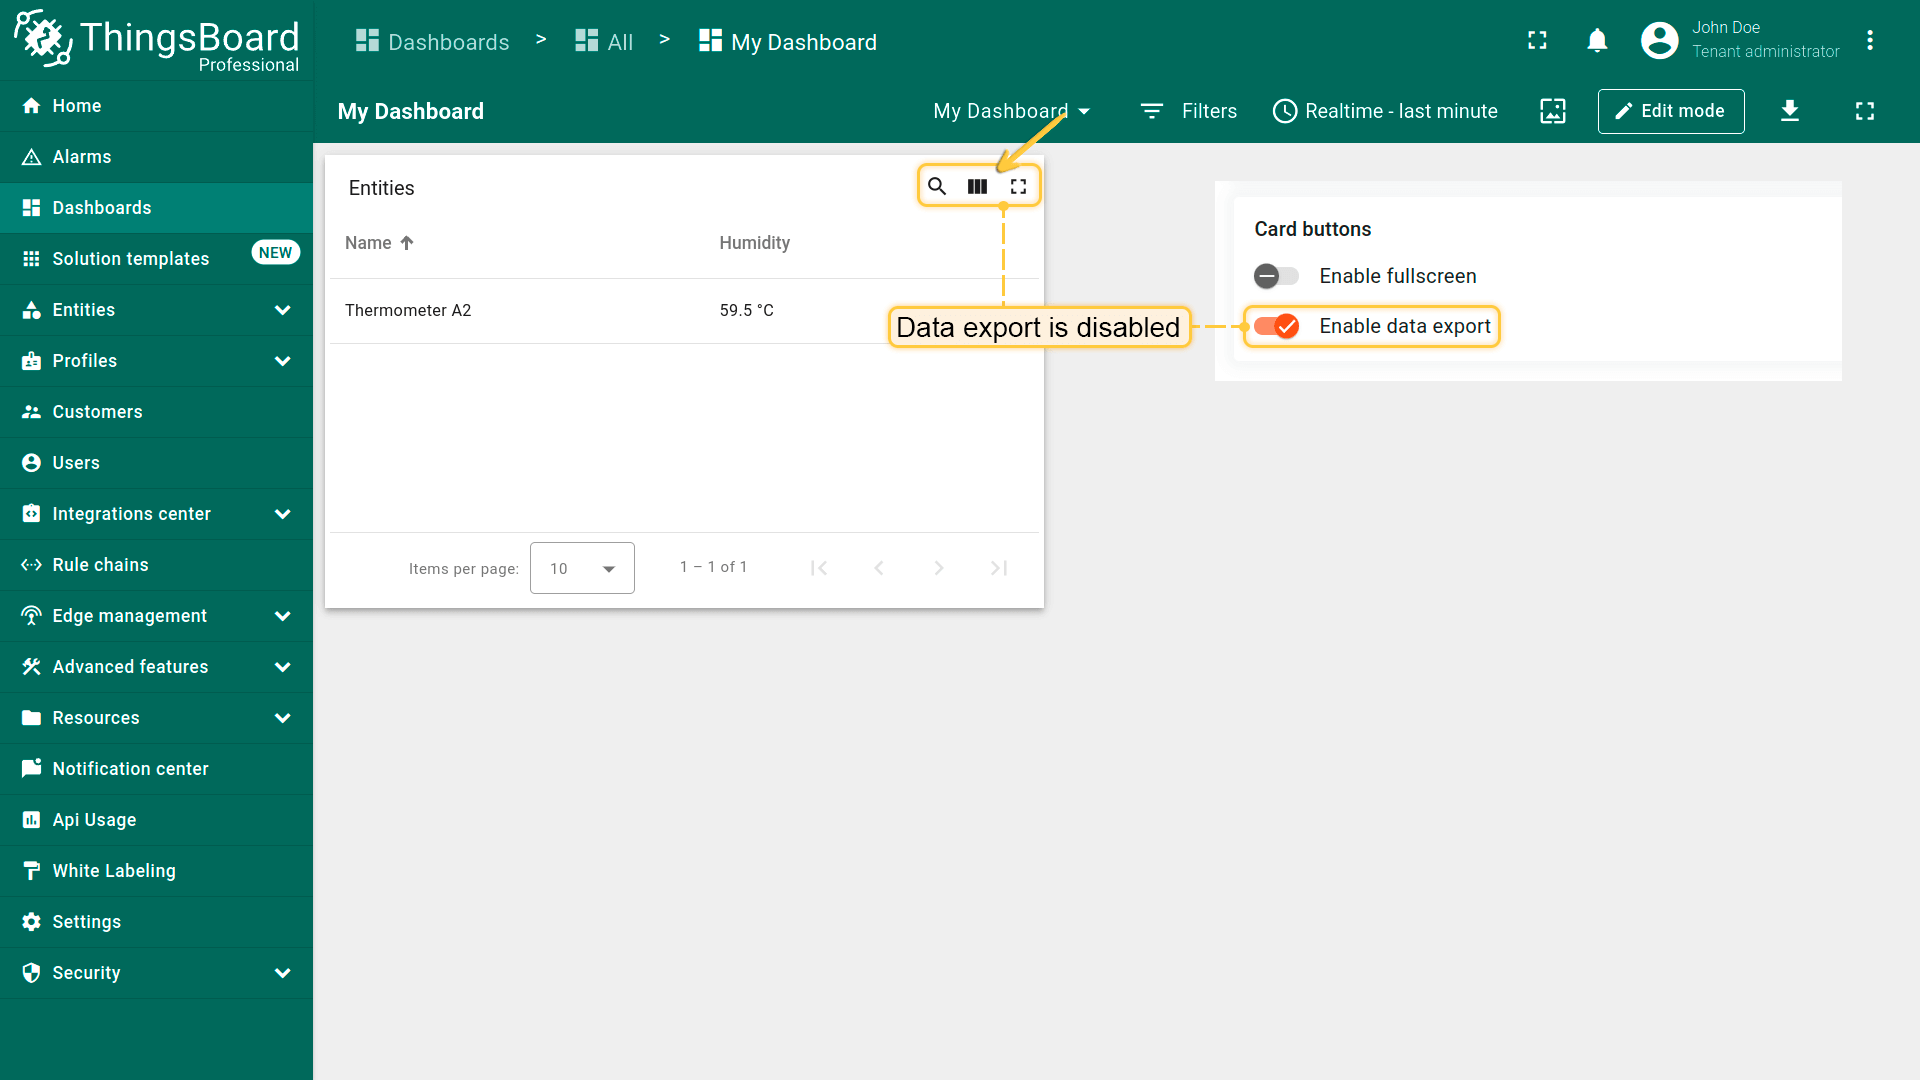
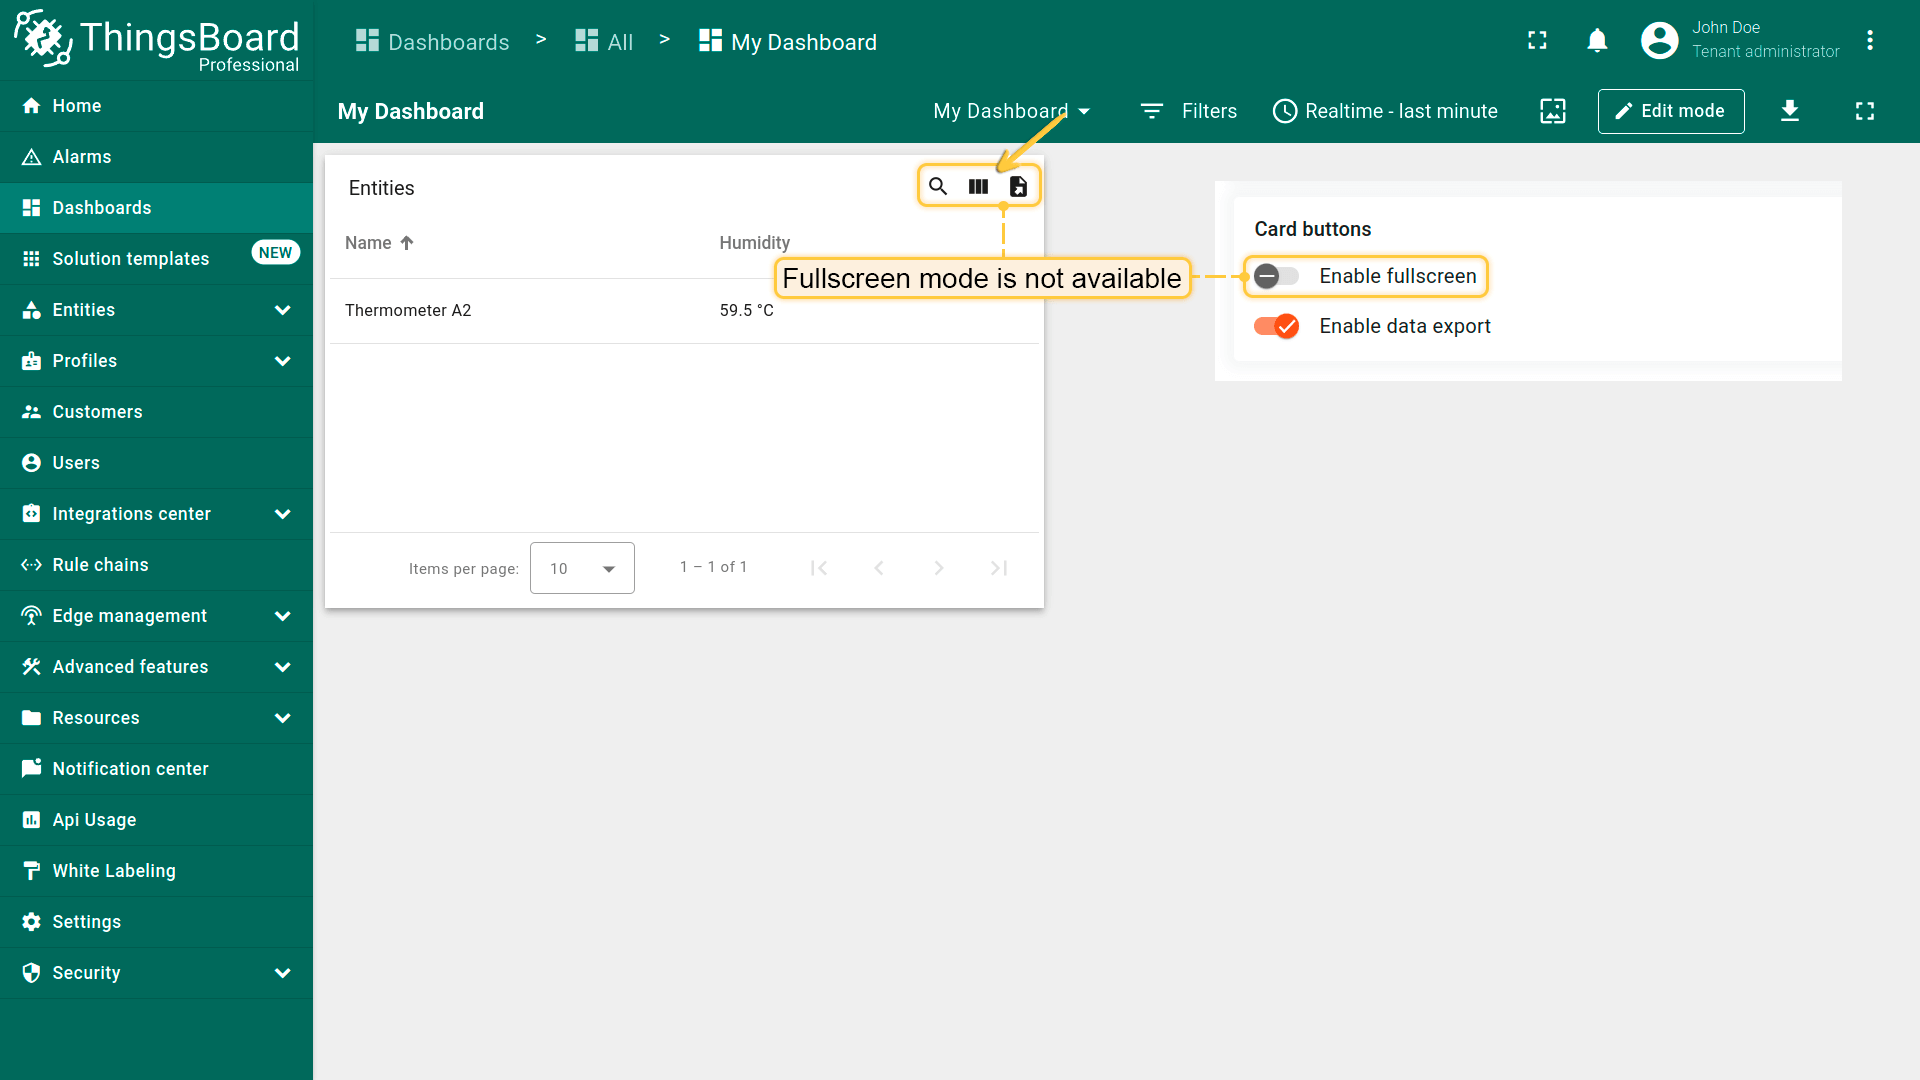
部件按钮设置(Widget buttons settings)
Enable data export(启用数据导出)
\u201cEnable data export\u201d用于启用或关闭部件数据的导出。 默认已启用。点击部件右上角\u201cExport widget data\u201d图标可下载数据。支持导出为csv、xls或xlsx格式。

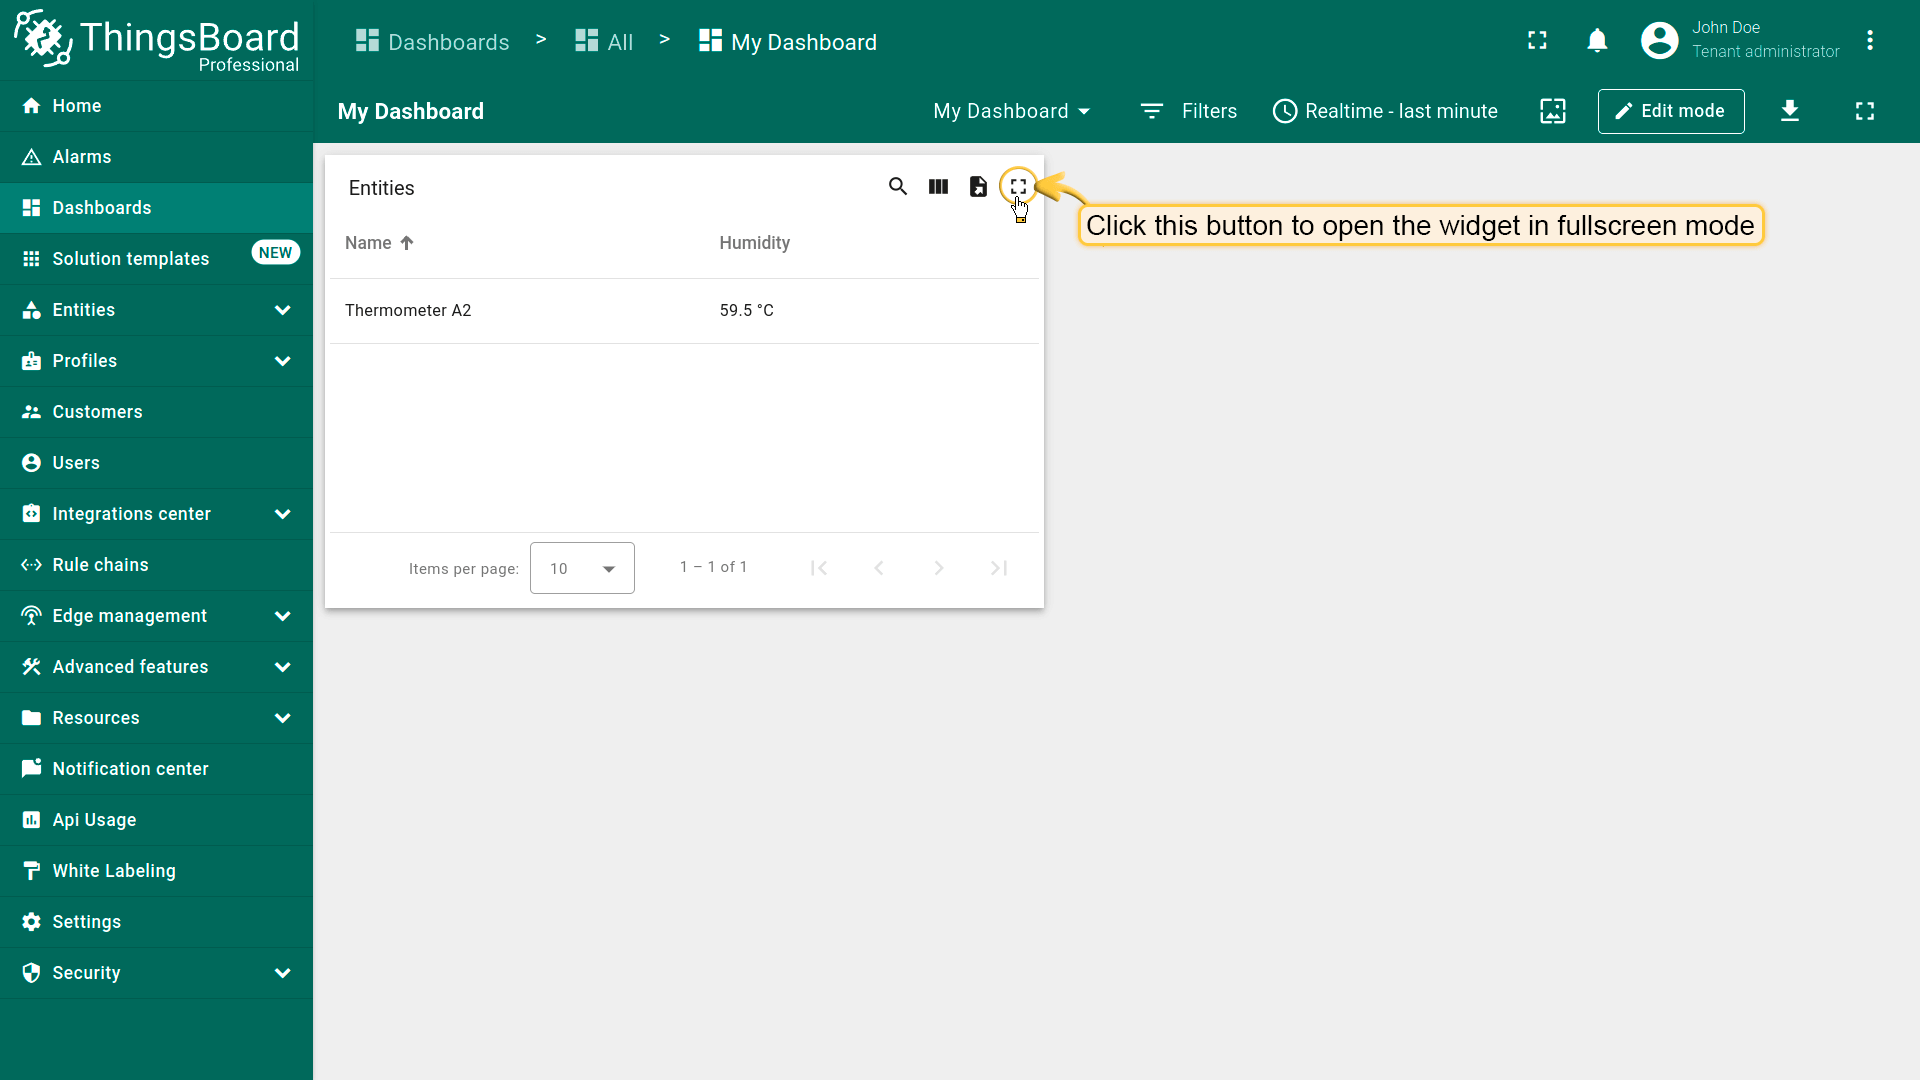
Enable fullscreen(启用全屏)
可通过\u201cEnable fullscreen\u201d复选框关闭全屏。默认启用。
以上设置默认均为启用。

部件操作(Widget actions)
操作可用于快速配置切换到已创建状态、跳转到其他仪表板或更新当前仪表板。不同部件的操作来源不同,但可选操作类型一致。 在对应部件的编辑模式下配置操作。 要完整掌握操作用法,需先为部件添加状态。
更多详见部件操作文档。
布局设置(Layout settings)
通过 Layout 选项卡控制部件在桌面和移动端仪表板网格中的行为。
调整大小选项
- Resizable。允许在编辑模式下由用户调整部件大小。禁用后部件保持当前尺寸,调整柄隐藏。
- Preserve aspect ratio。调整大小时保持部件宽高比,有助于图表和媒体在不同屏幕与网格断点下避免变形。禁用后可独立调整宽高。
提示: 对图表、图片和视频启用 Preserve aspect ratio;对需要更多垂直空间的表格和列表则禁用。
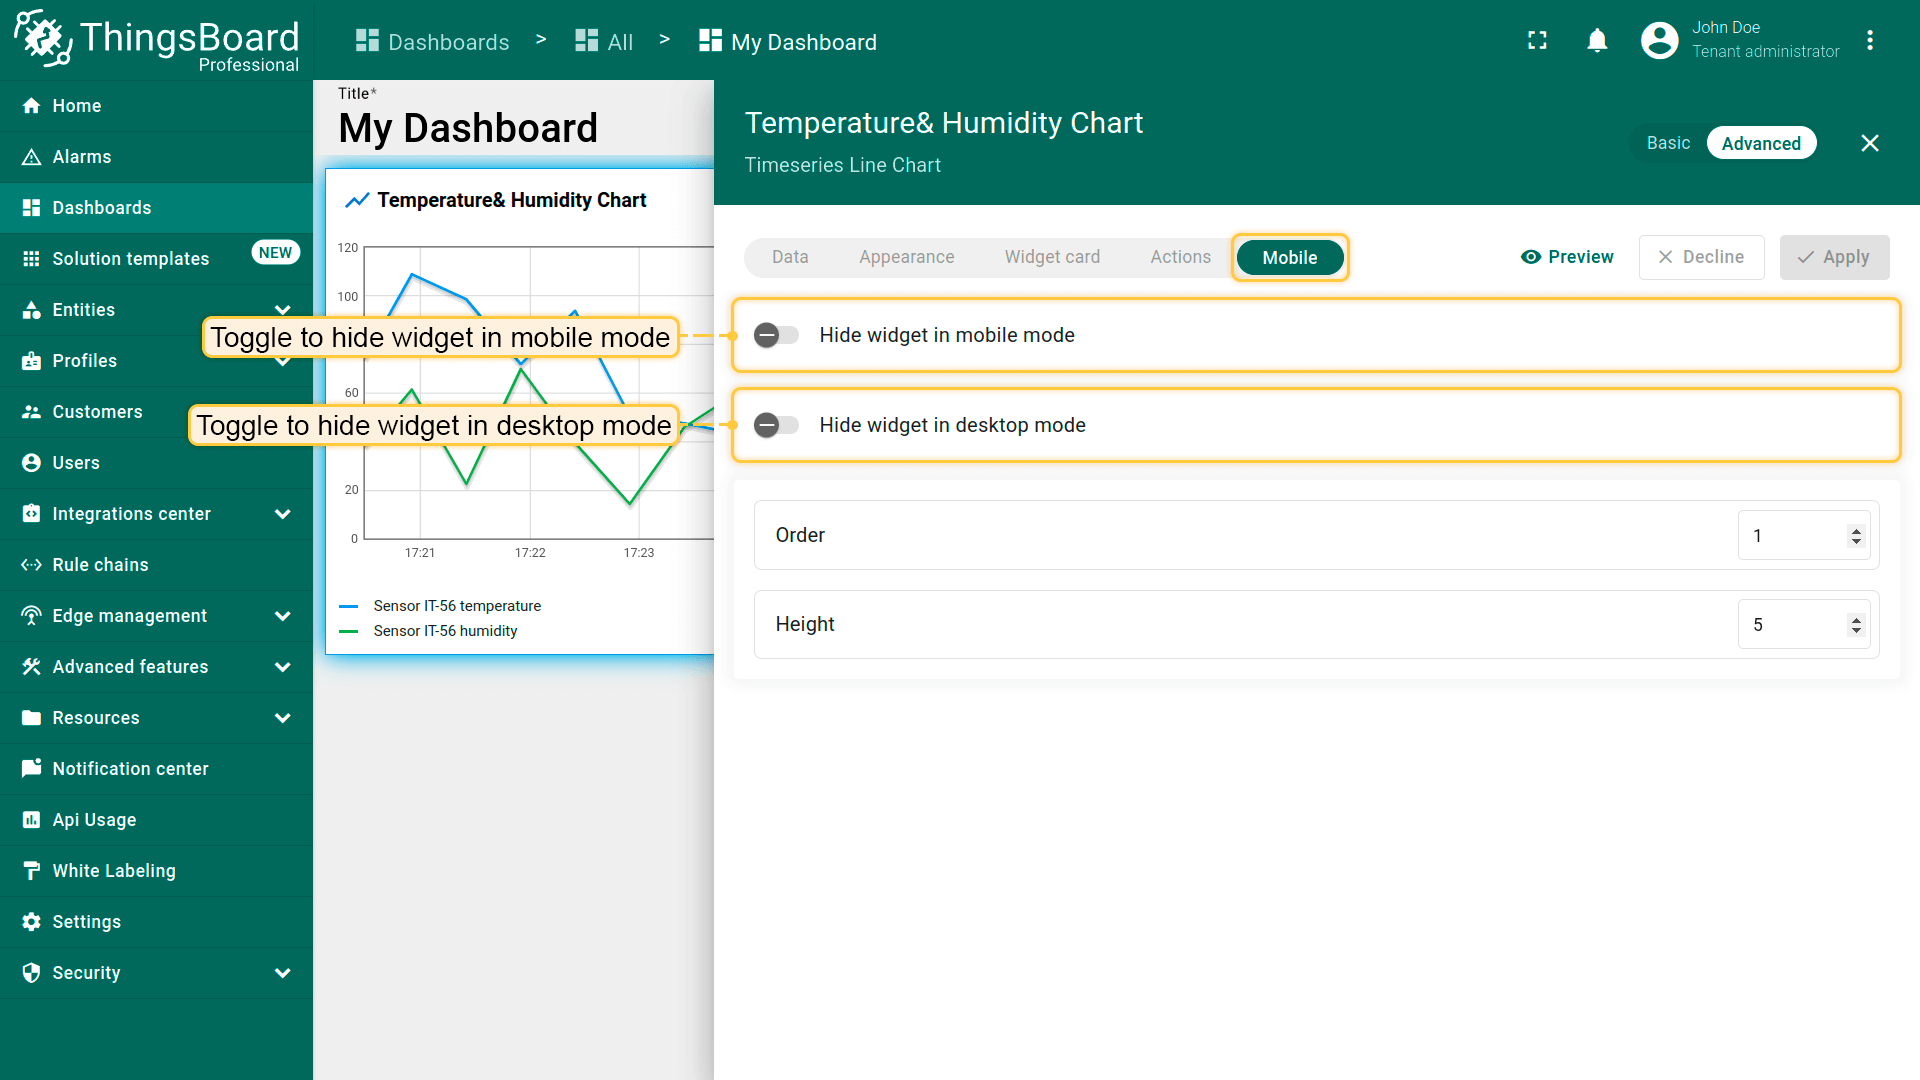
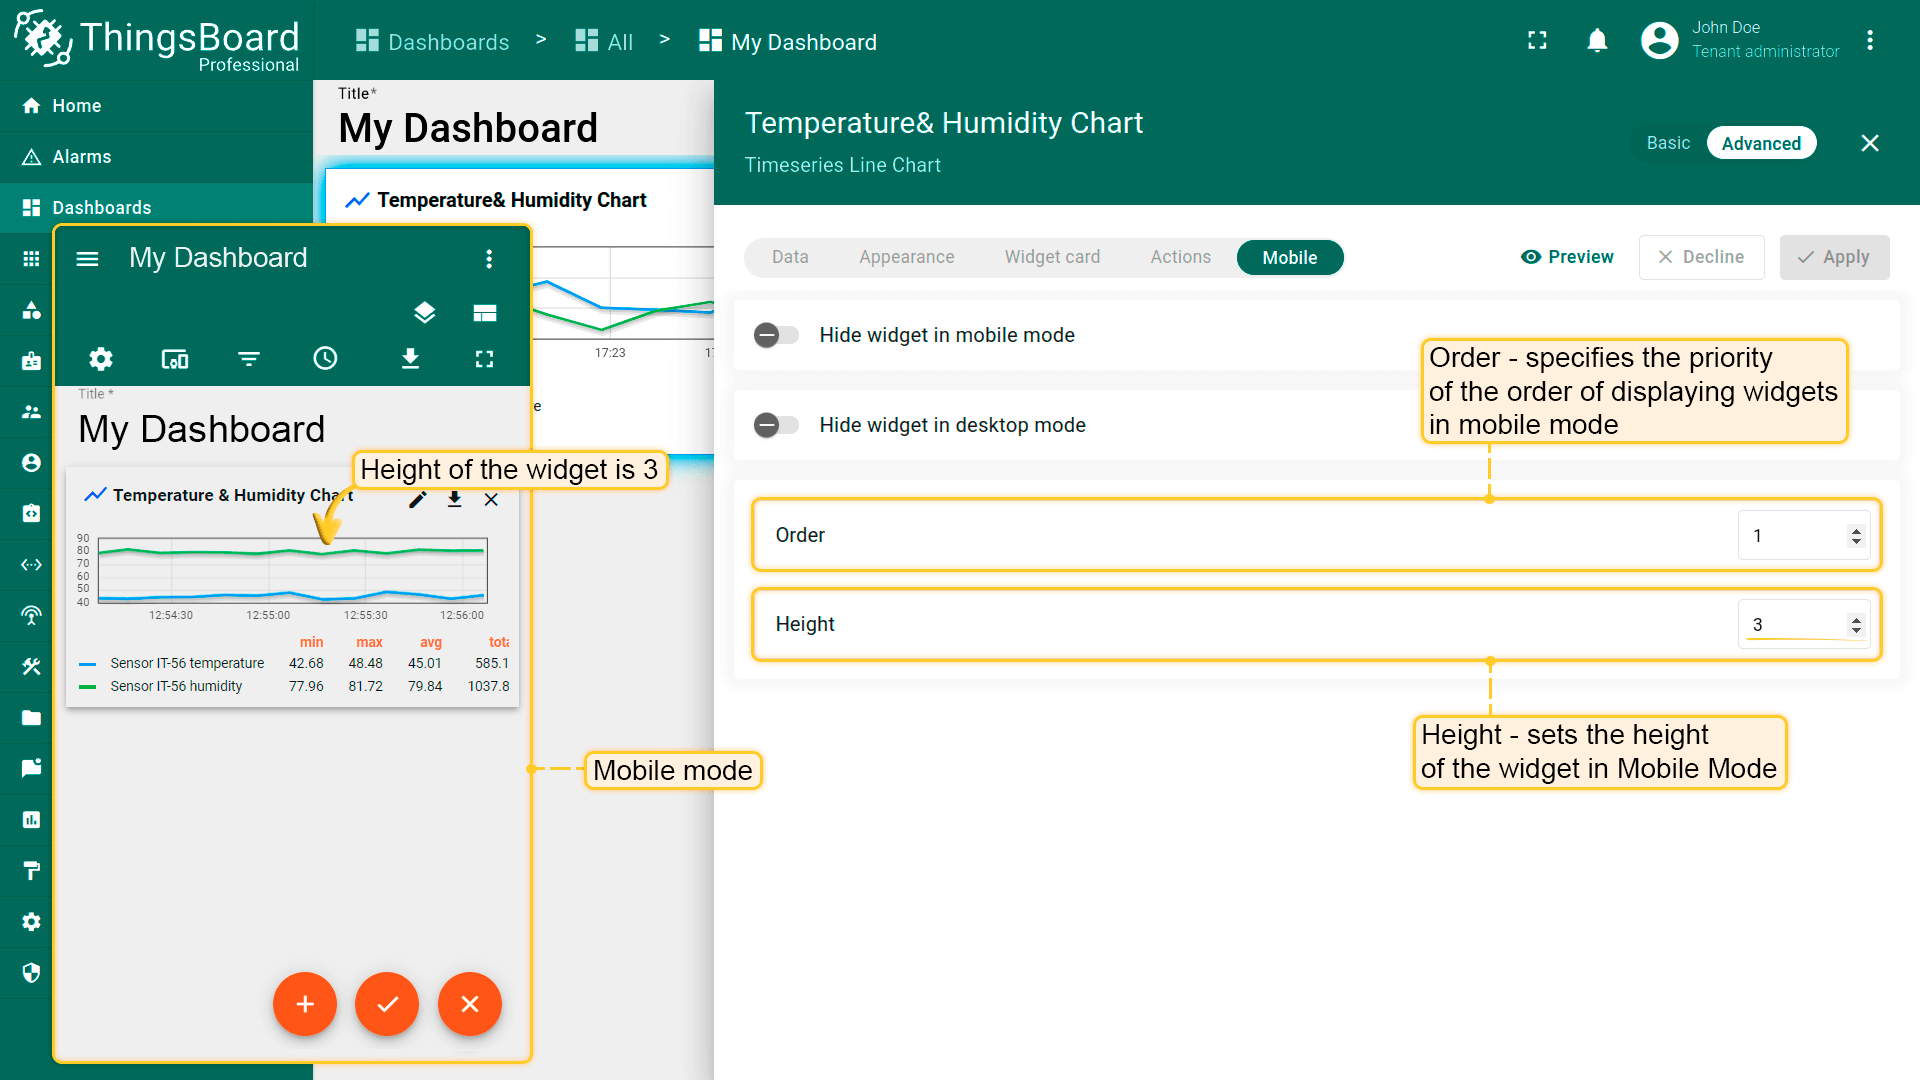
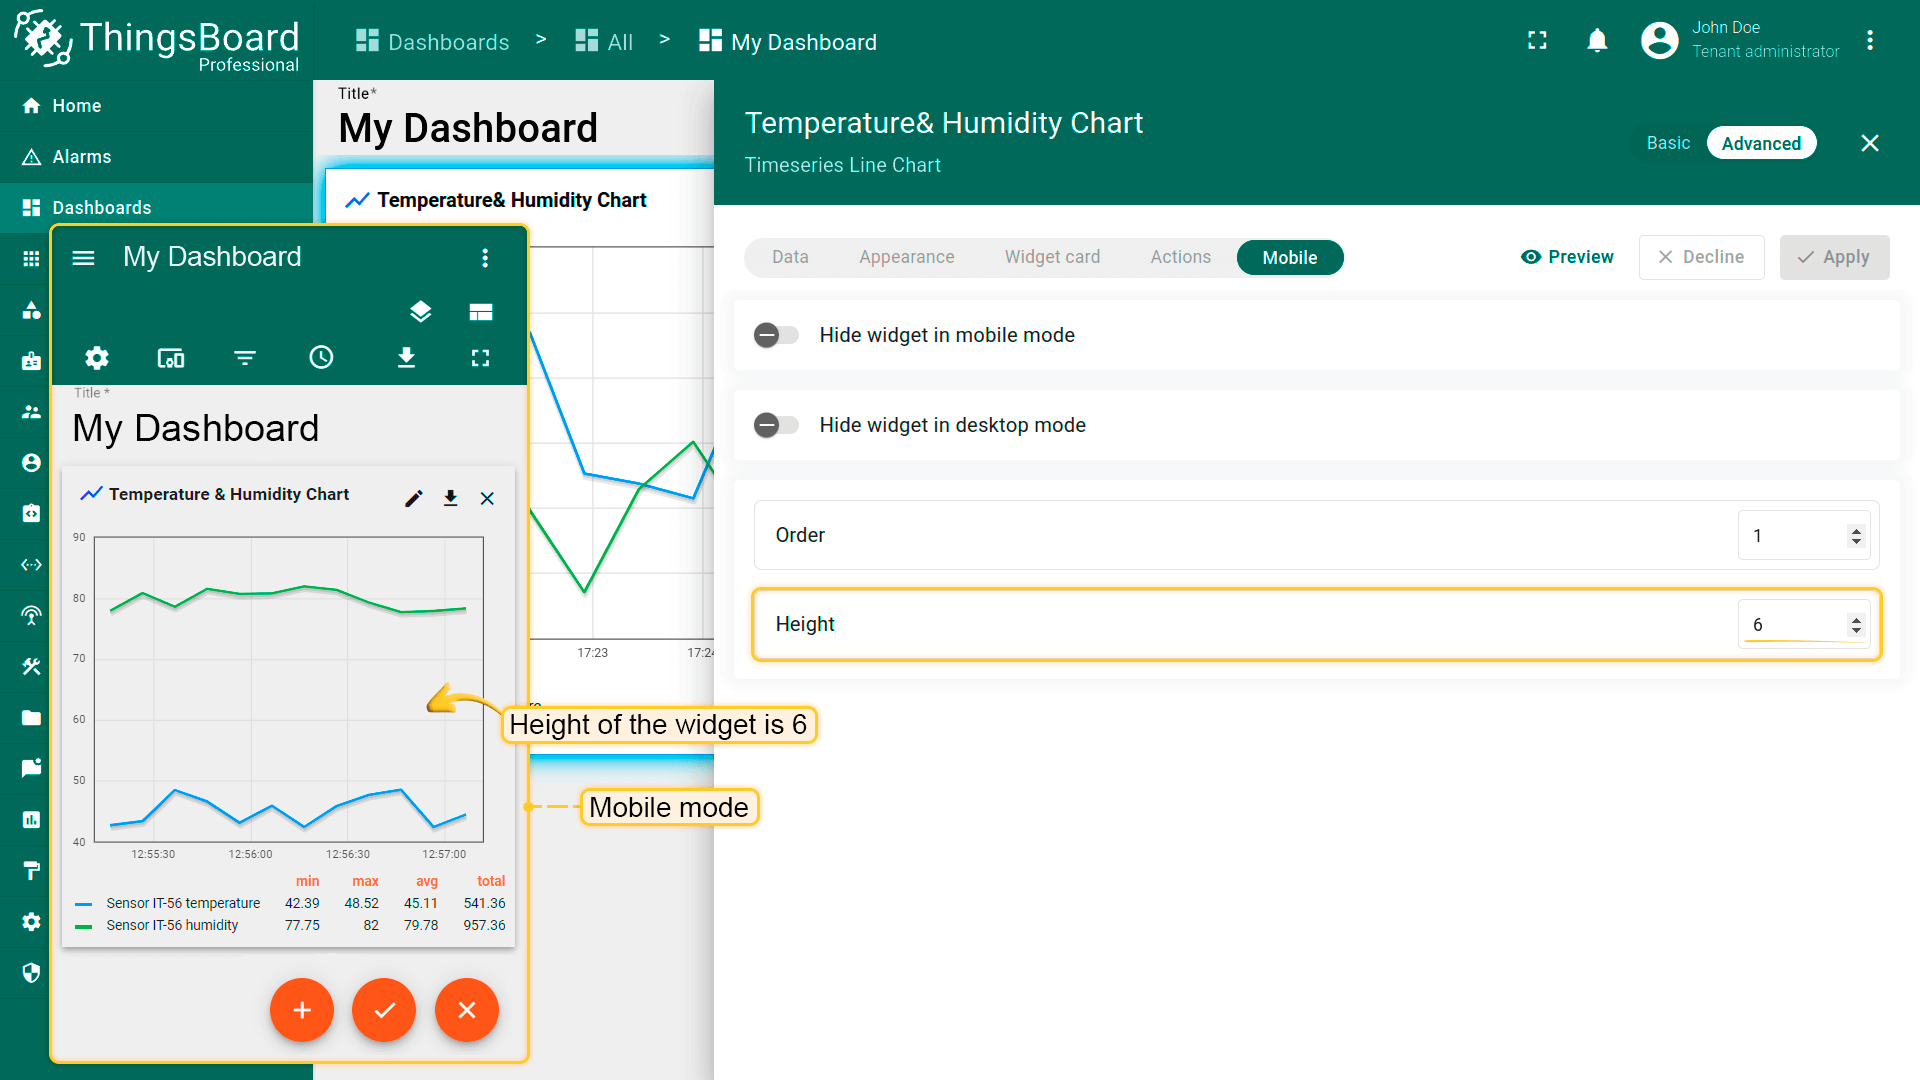
移动模式
这些选项控制移动模式(响应式布局)中的可见性和大小:
- 在移动模式中隐藏部件。当仪表板在移动布局中查看时,不渲染此部件。适合不适合小屏幕的大图可视化。
- 在桌面模式中隐藏部件。仅在移动端显示此部件,桌面端隐藏,适合为复杂桌面部件设计简洁的移动端替代。
- 顺序。设置部件在移动端布局中相对于其他部件的位置,数值越小越靠前(左上)。使用整数(如1、2、3…)。
- 高度。定义部件在移动网格中的高度(网格行数量)。增加值以为列表和卡片提供更多下拉空间;减少值以查看模式下的小KPI。
最佳实践:
- 保持相关部件的移动端顺序一致以维持阅读流序。
- 使用实际设备或仪表板的移动预览来验证高度和滚动会慢。
部件的导入与导出(Import and Export widget)
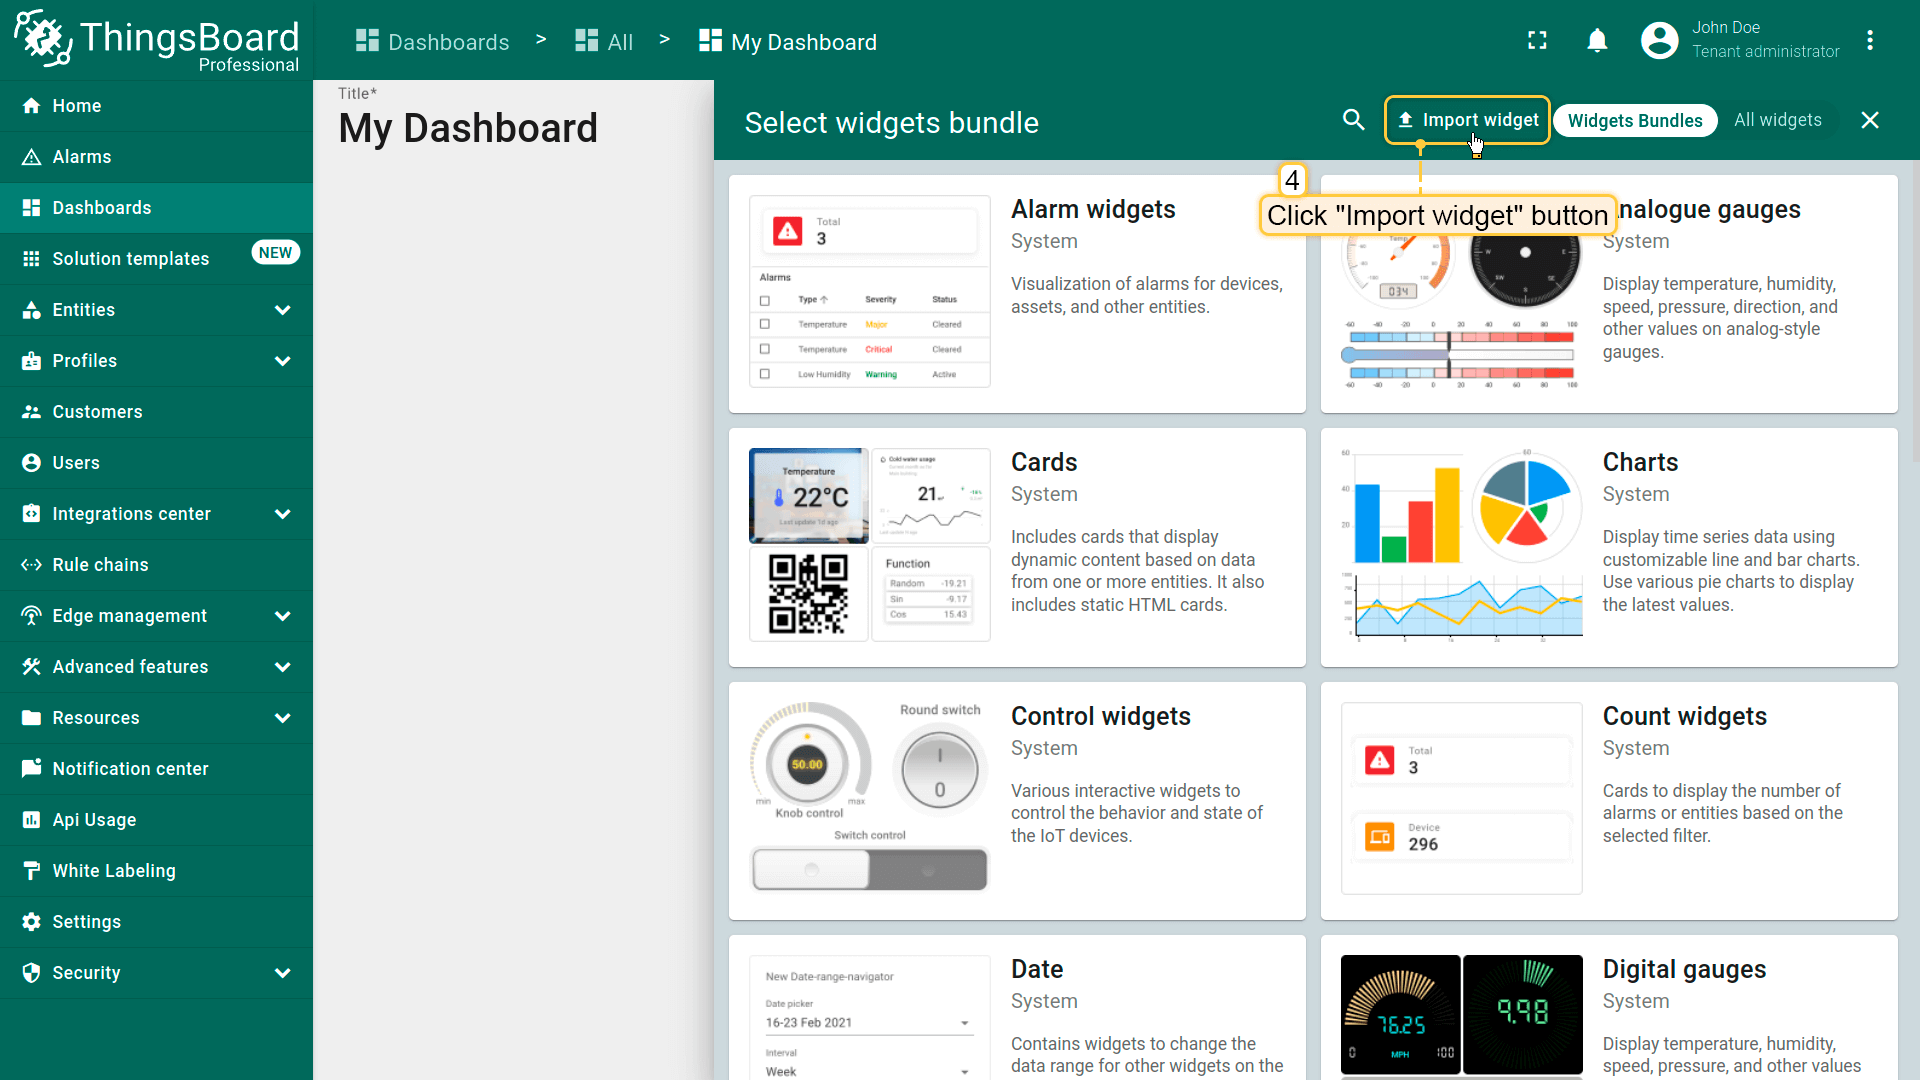
导入部件(Import widget)
可从 JSON 文件导入部件。
- Open your dashboard and switch to Edit mode. Click + Add widget. The Select widgets bundle dialog opens.
- Click Import widget in the top‑right corner.
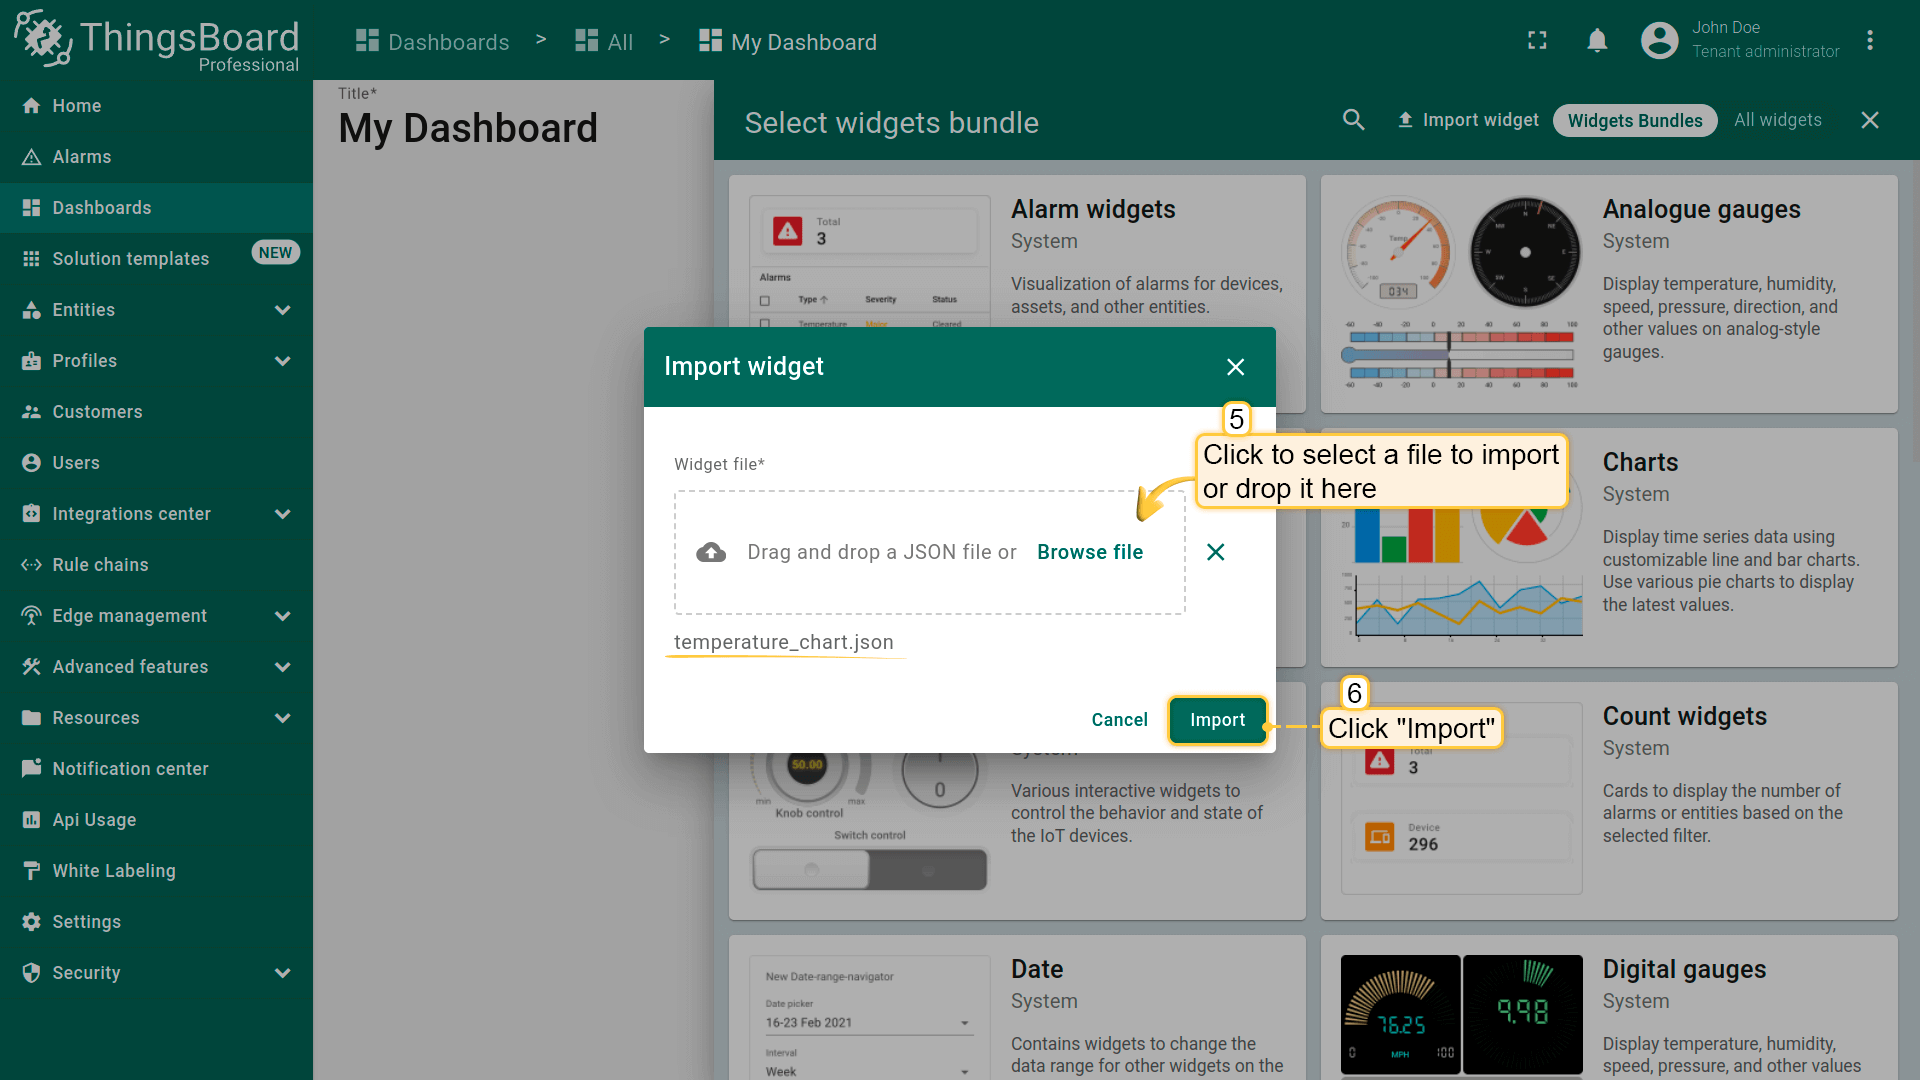
- In the import dialog, upload the JSON file and click Import.
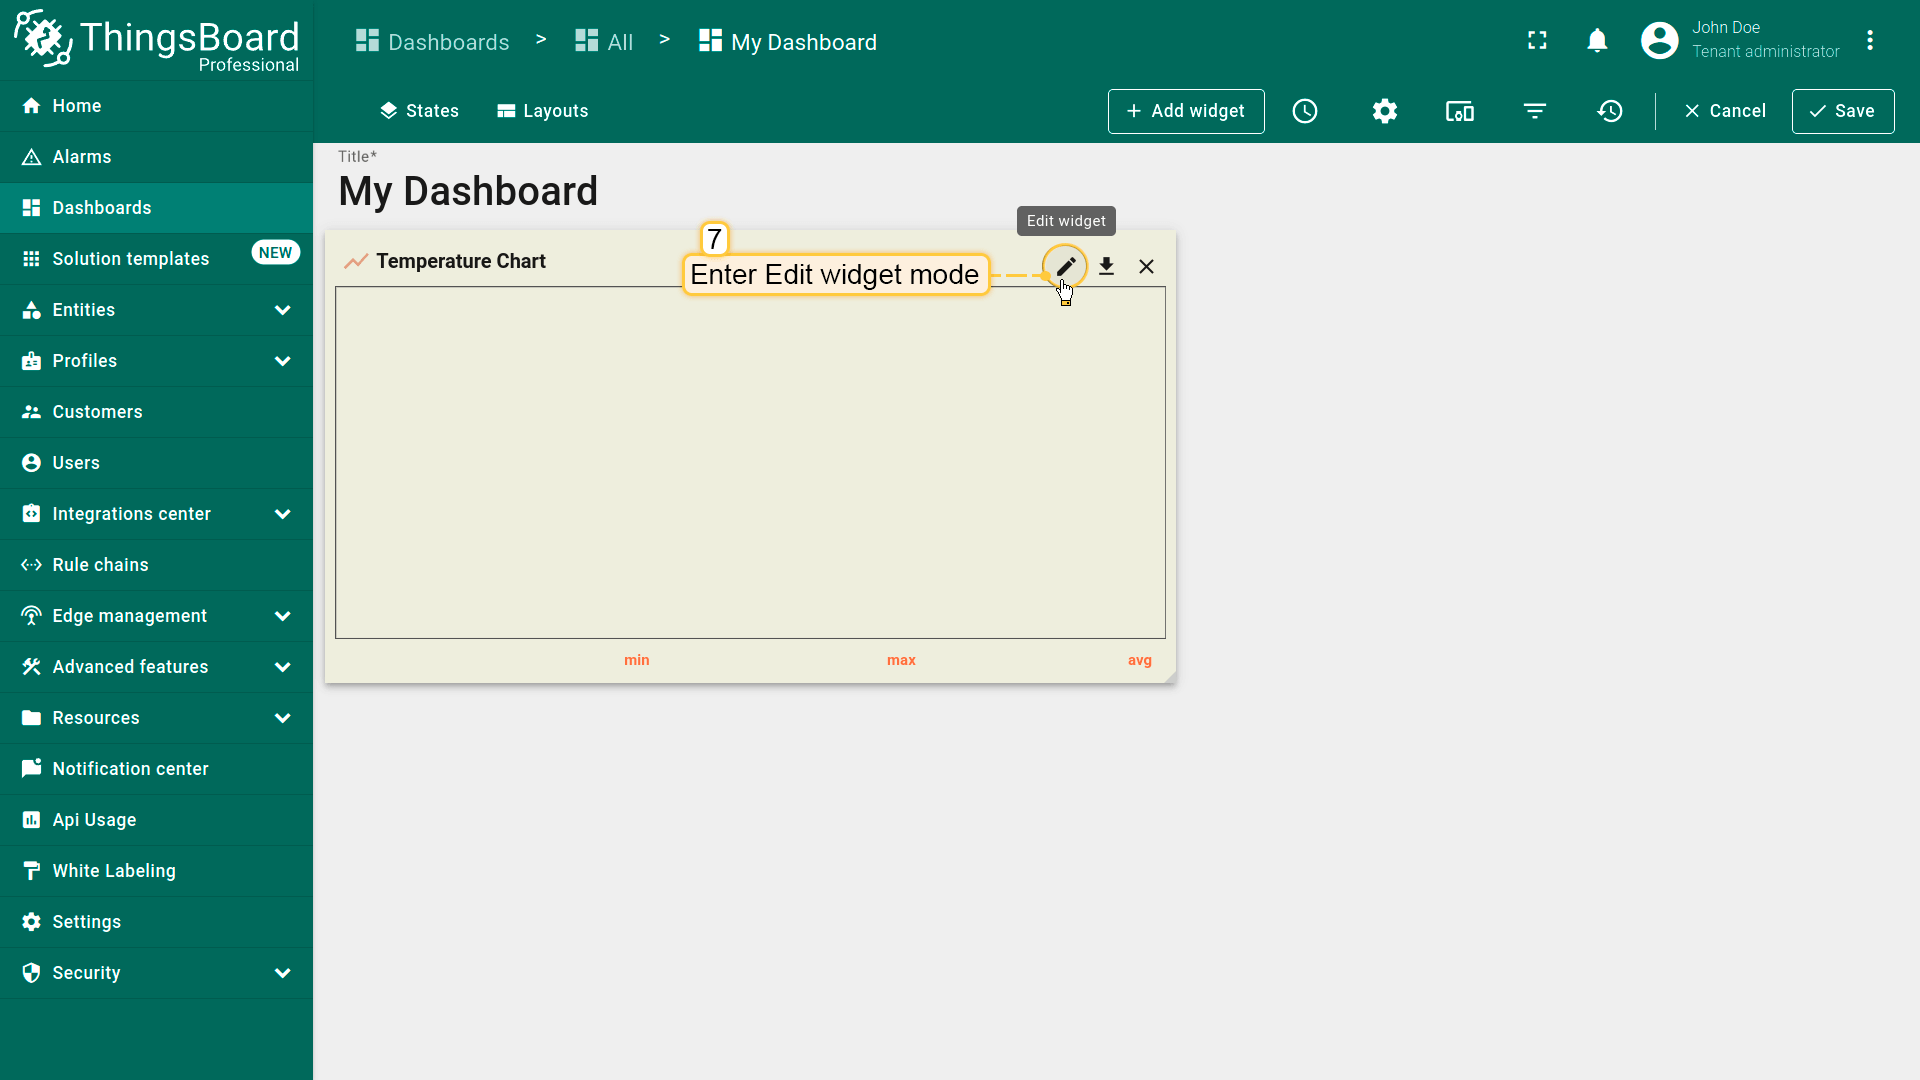
- The widget has been added to the dashboard. It may not show data yet because the data source needs to be updated.
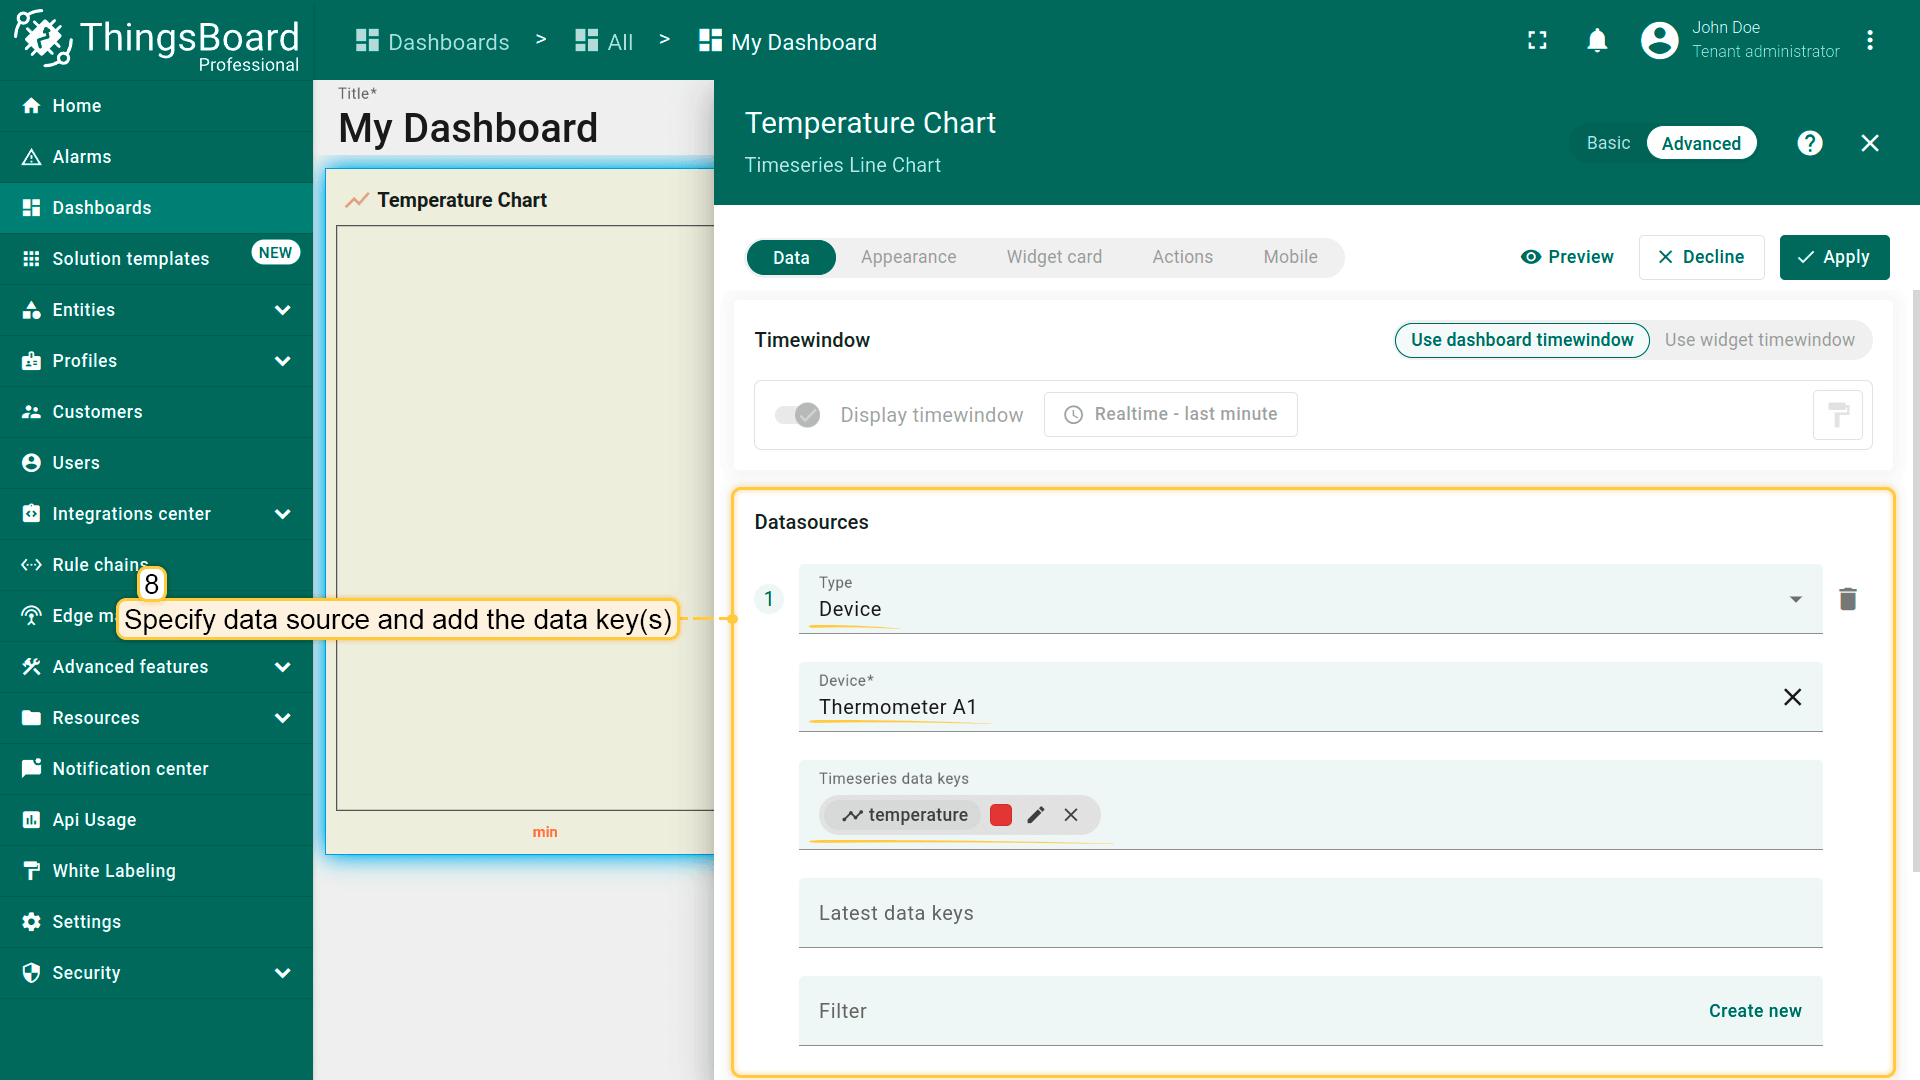
- Enter widget edit mode, specify the data source, add the required data key(s), and apply changes.
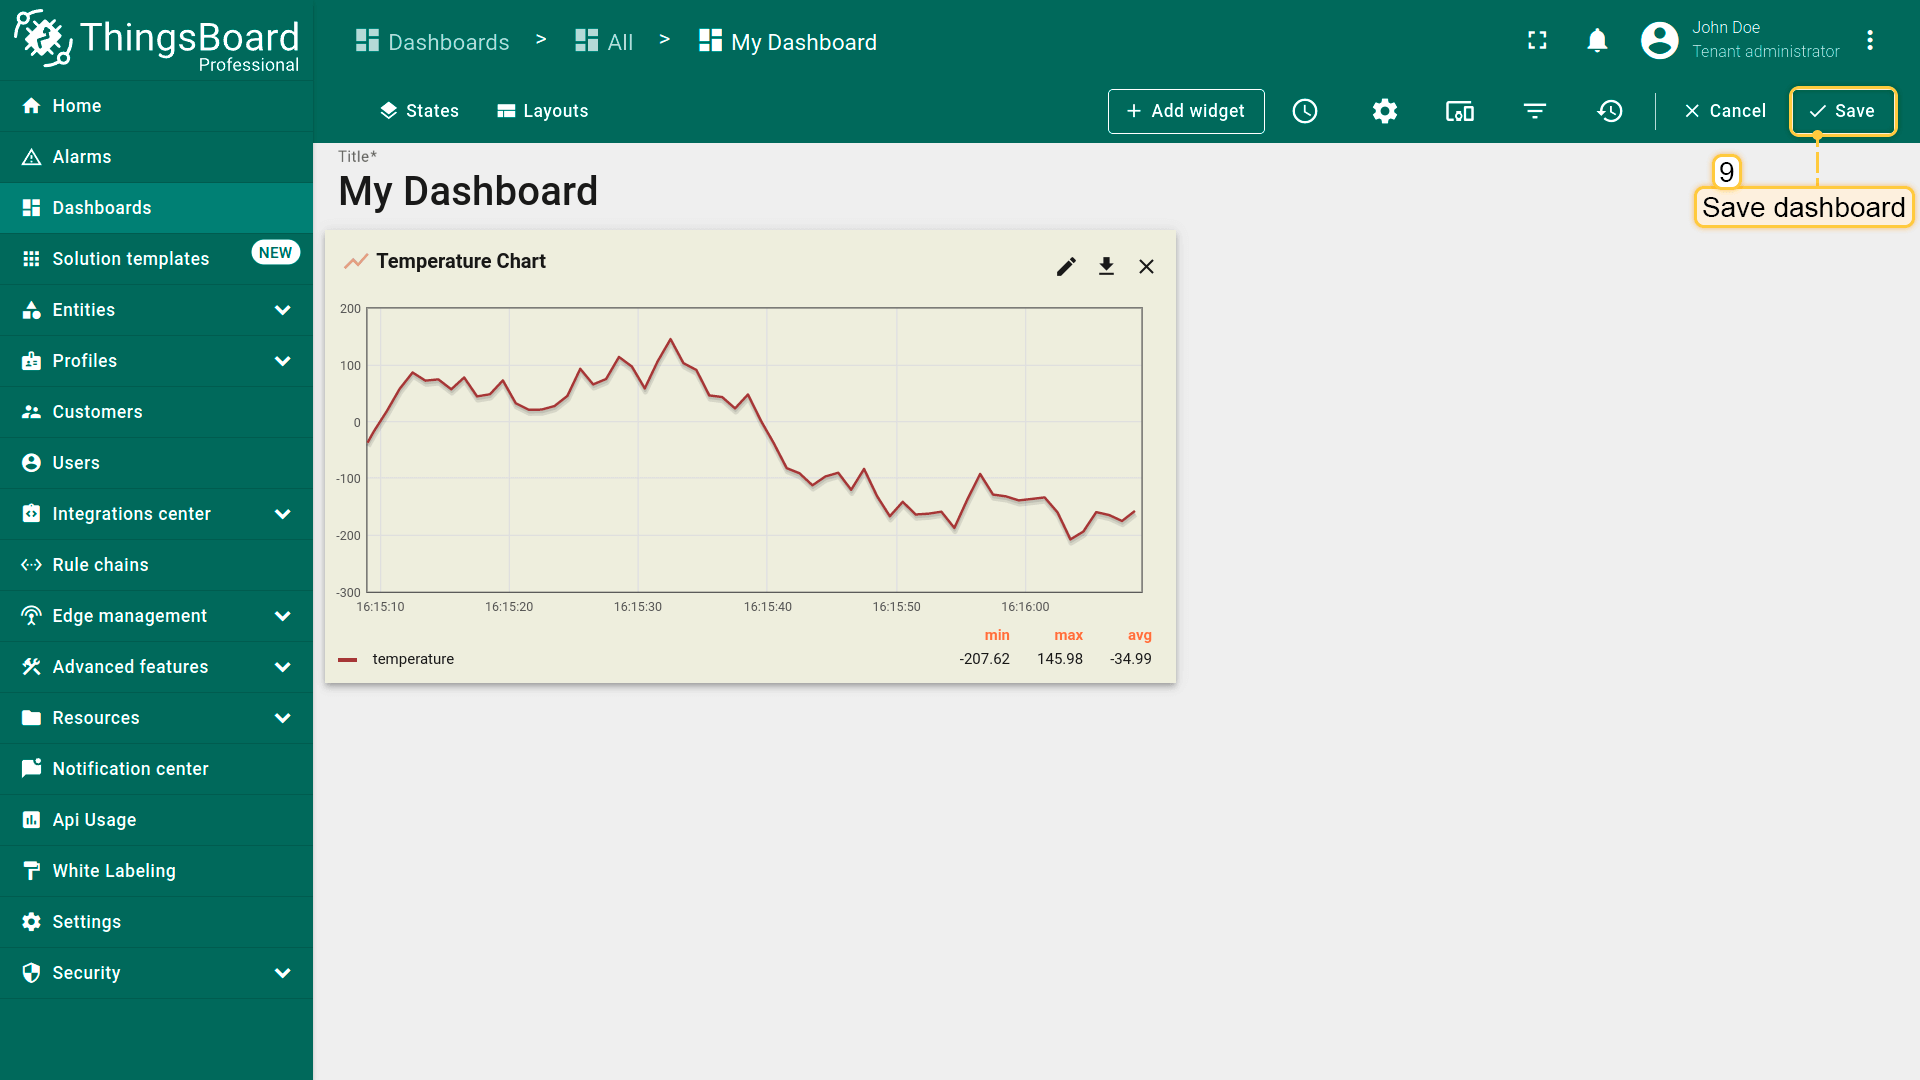
- Verify that the widget displays data (e.g., a temperature chart) and Save the dashboard.
提示: 若导入的部件使用当前环境中不存在的实体别名或键,请在编辑部件时进行映射。
导出部件(Export widget)
导出将部件配置保存为 JSON,以便在其他处复用。
步骤:
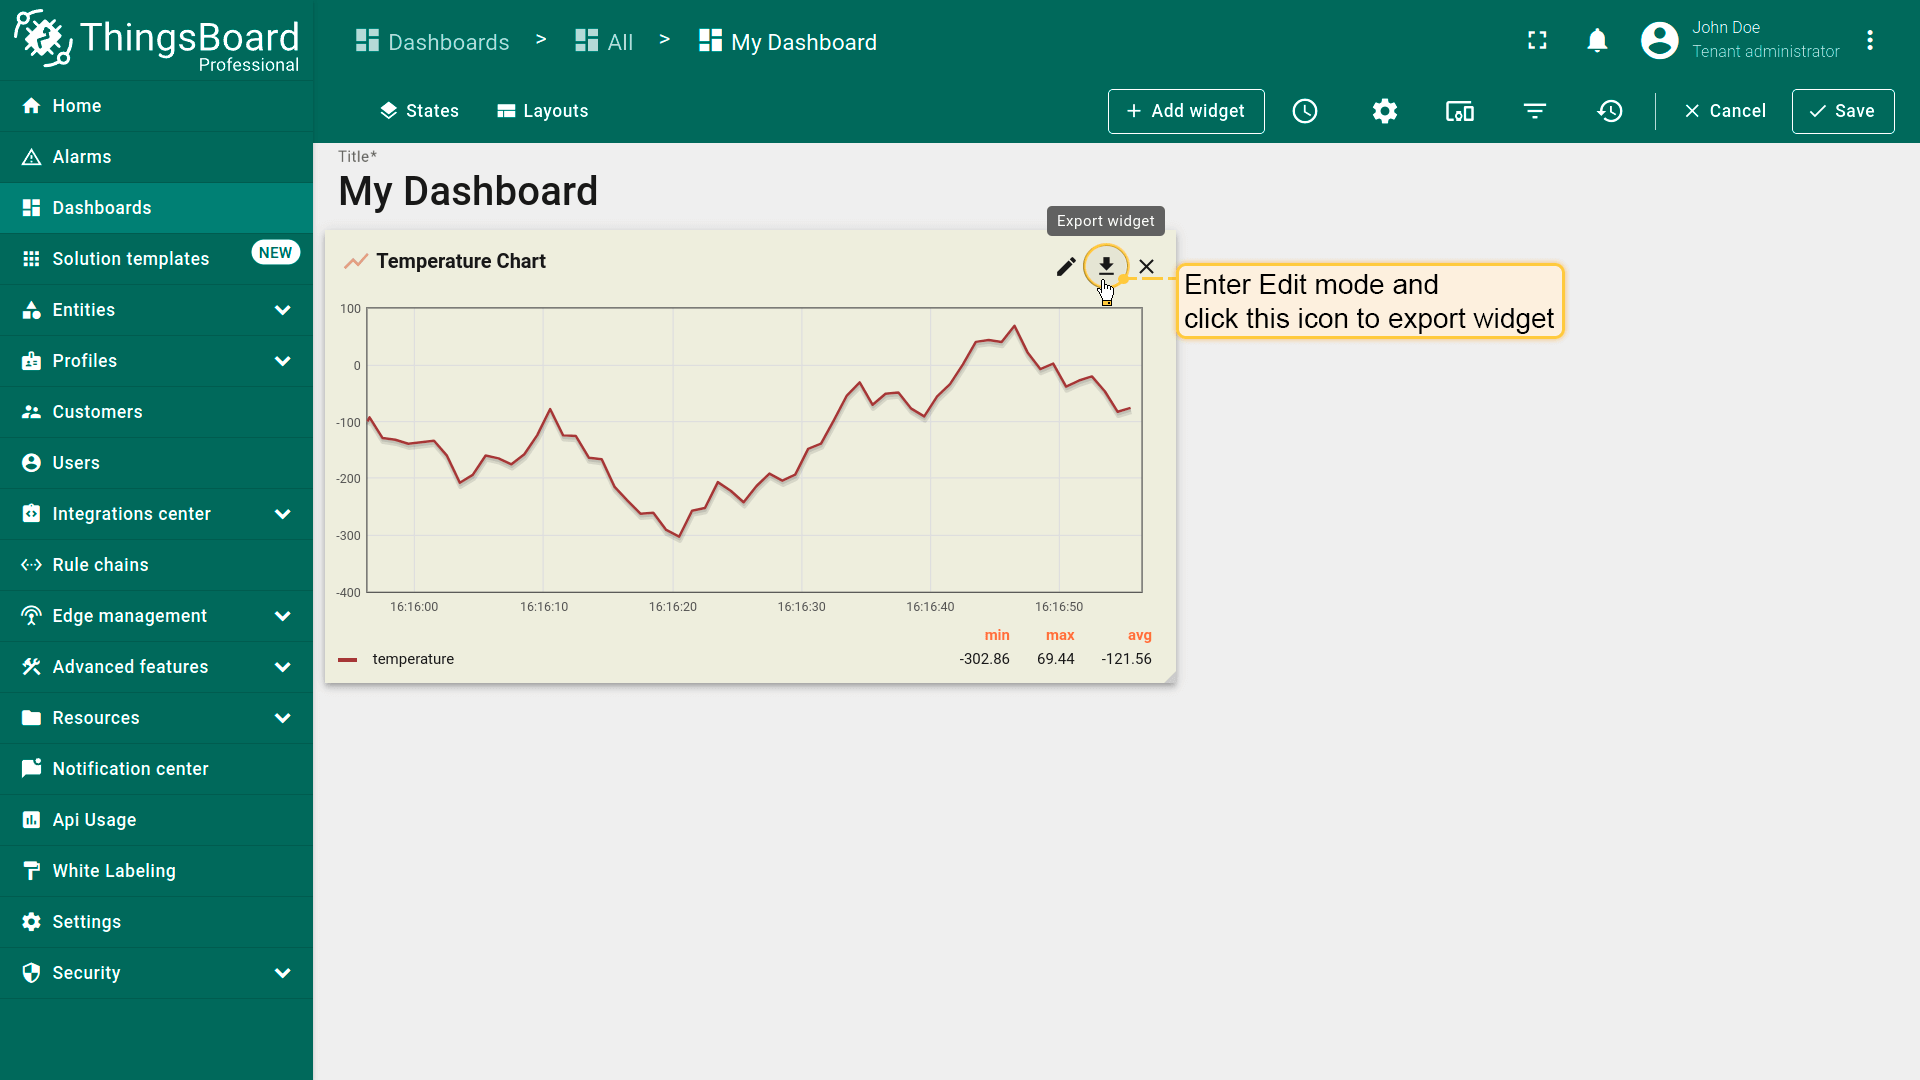
- 打开包含该部件的仪表板并切换到 Edit mode。
- 在部件右上角工具栏点击 Export widget。
- 包含部件配置的 JSON 文件将下载到本地。
注意: 导出仅包含部件设置,不包含数据。