- 简介
- 前置条件
- 步骤 1. 发现拓扑
- 步骤 2. 创建折线图视图
- 步骤 3. 将折线图添加到 ThingsBoard 仪表板
- 步骤 4. 计算新指标
- 步骤 5. 预测能耗
- 步骤 6. 检测能耗异常
- 步骤 7. 体验 AI 助手
- 下一步
简介
本教程用于演示 Trendz Analytics 的基本用法,您将学会:
- 首次登录 Trendz
- 从 ThingsBoard 发现拓扑
- 创建基础可视化
- 将 Trendz 视图添加到 ThingsBoard 仪表板
- 基于现有遥测计算新遥测
- 使用历史数据预测遥测
- 检测遥测数据中的异常
- 与 Trendz AI 助手交互
前置条件
需已安装并运行 Trendz Analytics。 推荐使用 ThingsBoard Cloud 中的 Trendz Analytics 插件(SaaS 方式)进行快速体验。
也可参考安装指南自行安装 Trendz Analytics。
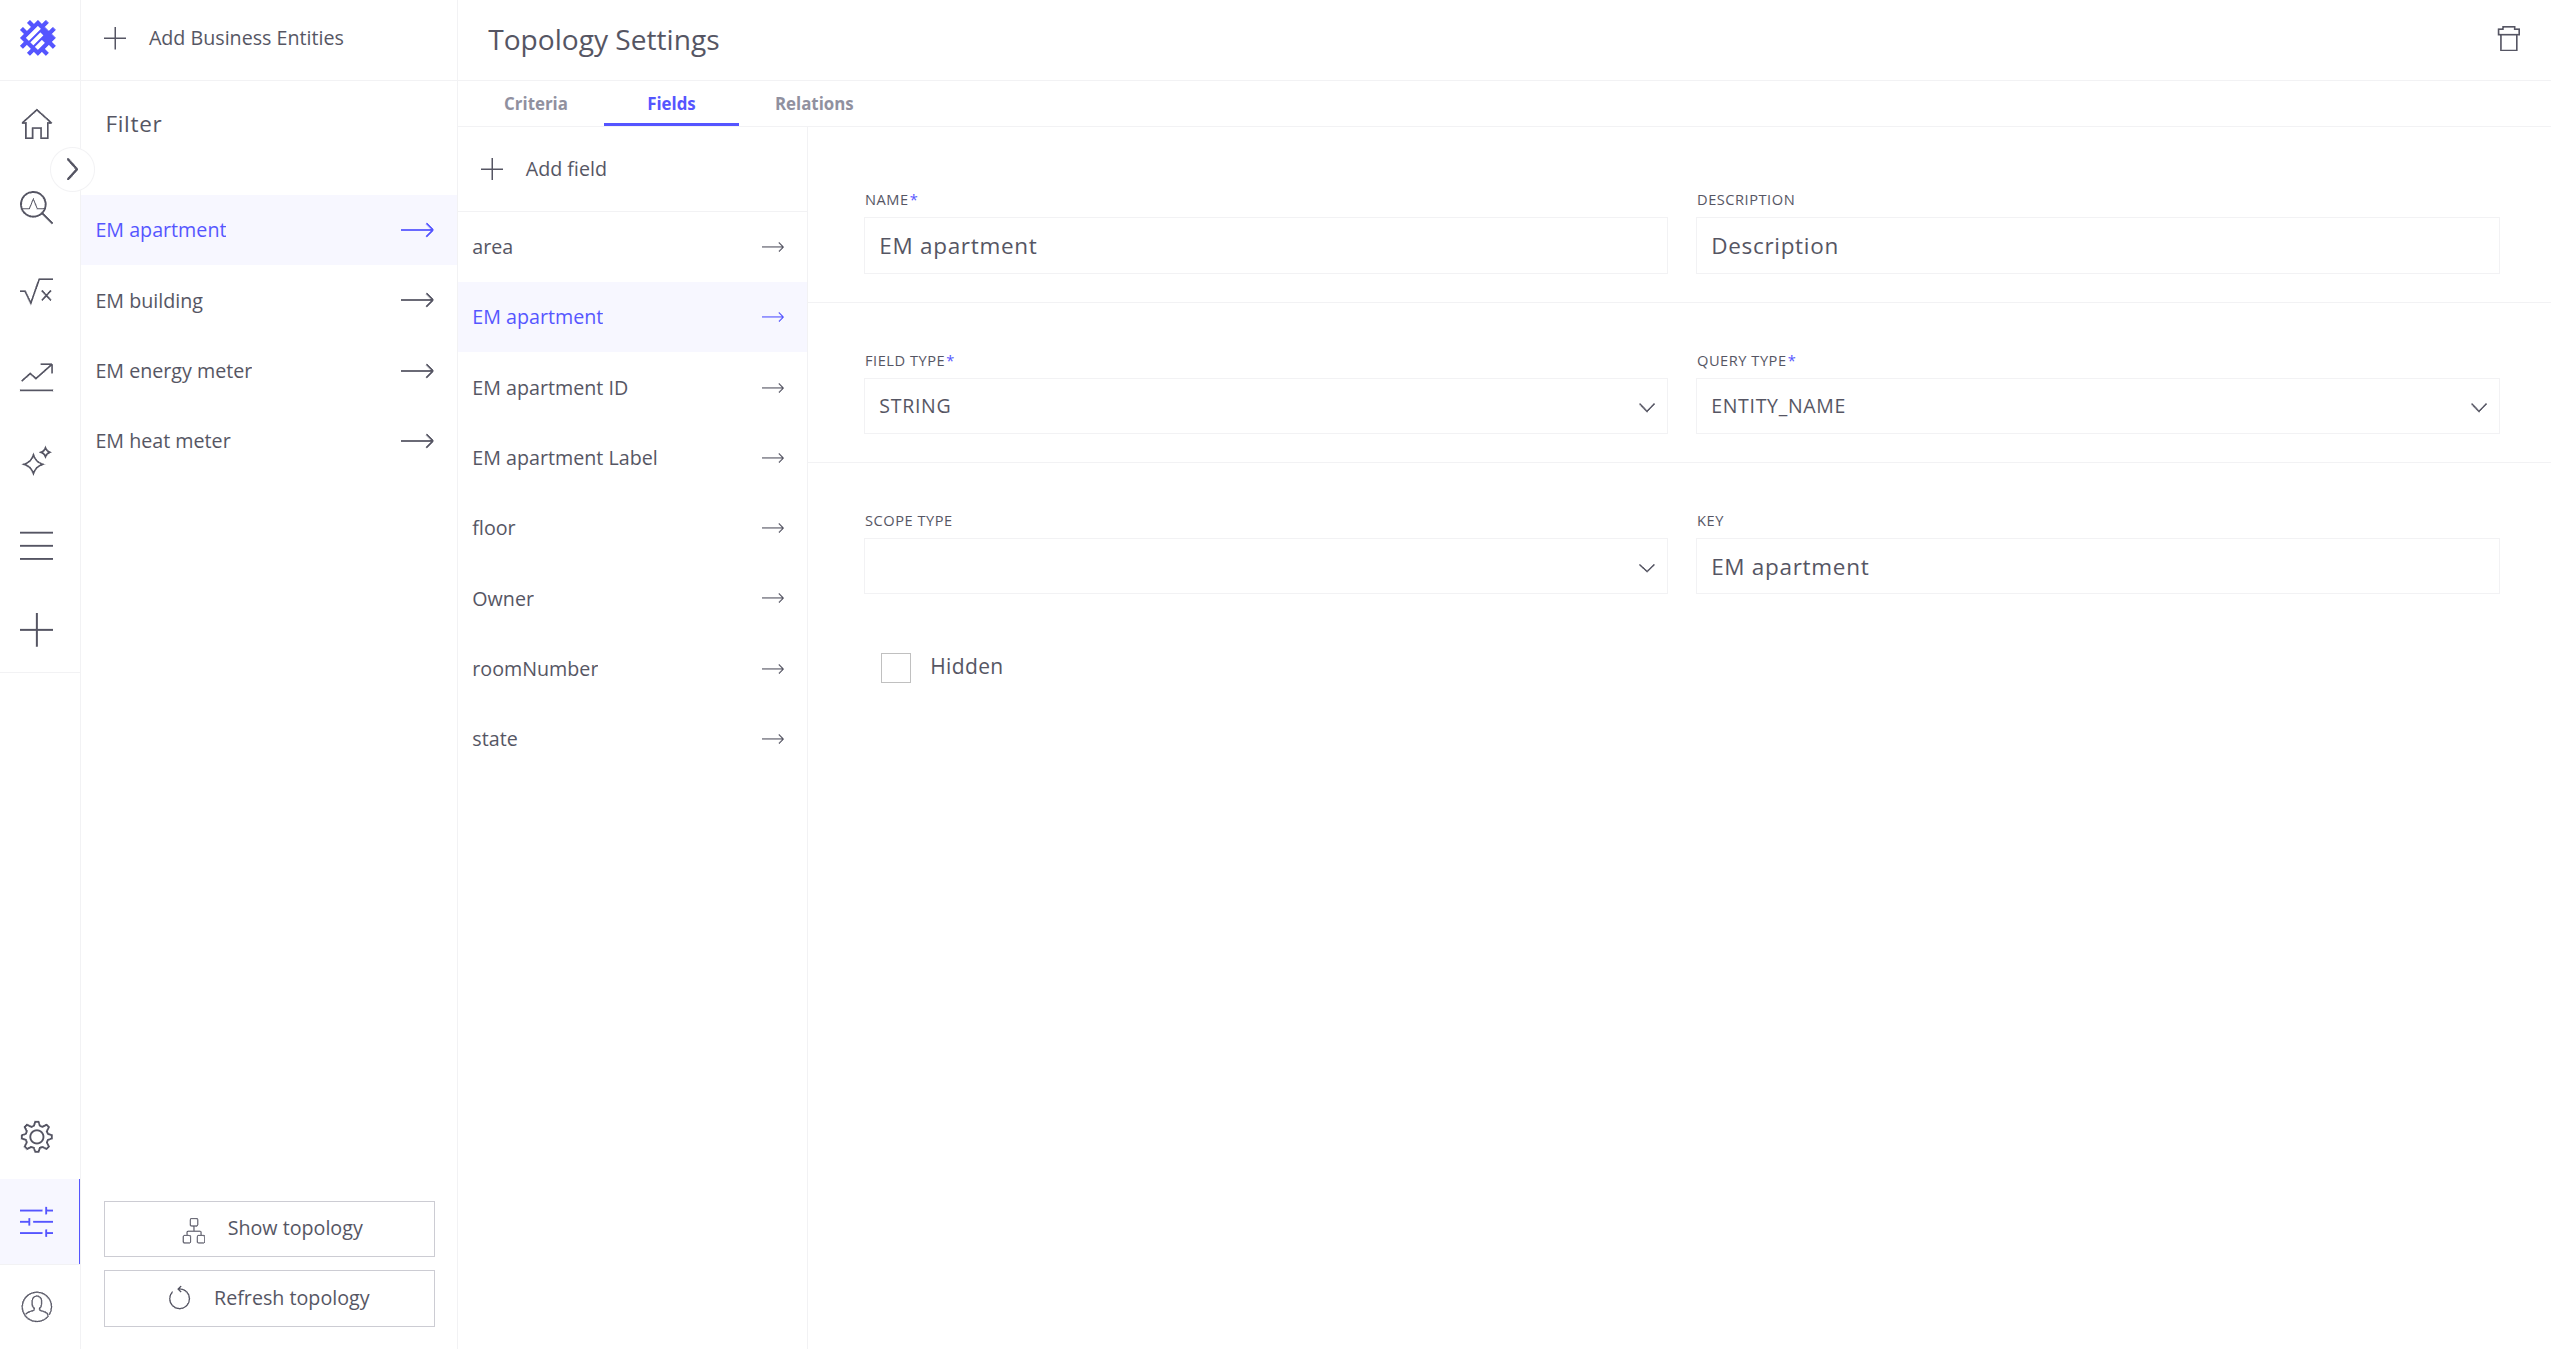
本指南将使用楼栋(Building)和公寓(Apartment)资产,以及热表(Heat Meter)和电表(Energy Meter)设备。 您可使用自有设备并按相同概念操作;若尚无设备,可尝试任意可用解决方案模板。 本指南涉及的全部字段与关联关系如下所示:


步骤 1. 发现拓扑
Trendz 服务启动后,可通过以下地址登录 Trendz 界面:
- ThingsBoard Cloud(北美):https://thingsboard.cloud/trendz/
- ThingsBoard Cloud(欧洲地区):https://eu.thingsboard.cloud/trendz/
- 自托管 Trendz:http://localhost:8888/trendz/
可使用 ThingsBoard 的租户管理员账号登录。任何租户管理员或客户用户均可使用其在 ThingsBoard 中的同一账号和密码登录 Trendz 界面。


步骤 2. 创建折线图视图
我们将创建一张包含所有楼栋的折线图,展示今日各楼栋的用电量。
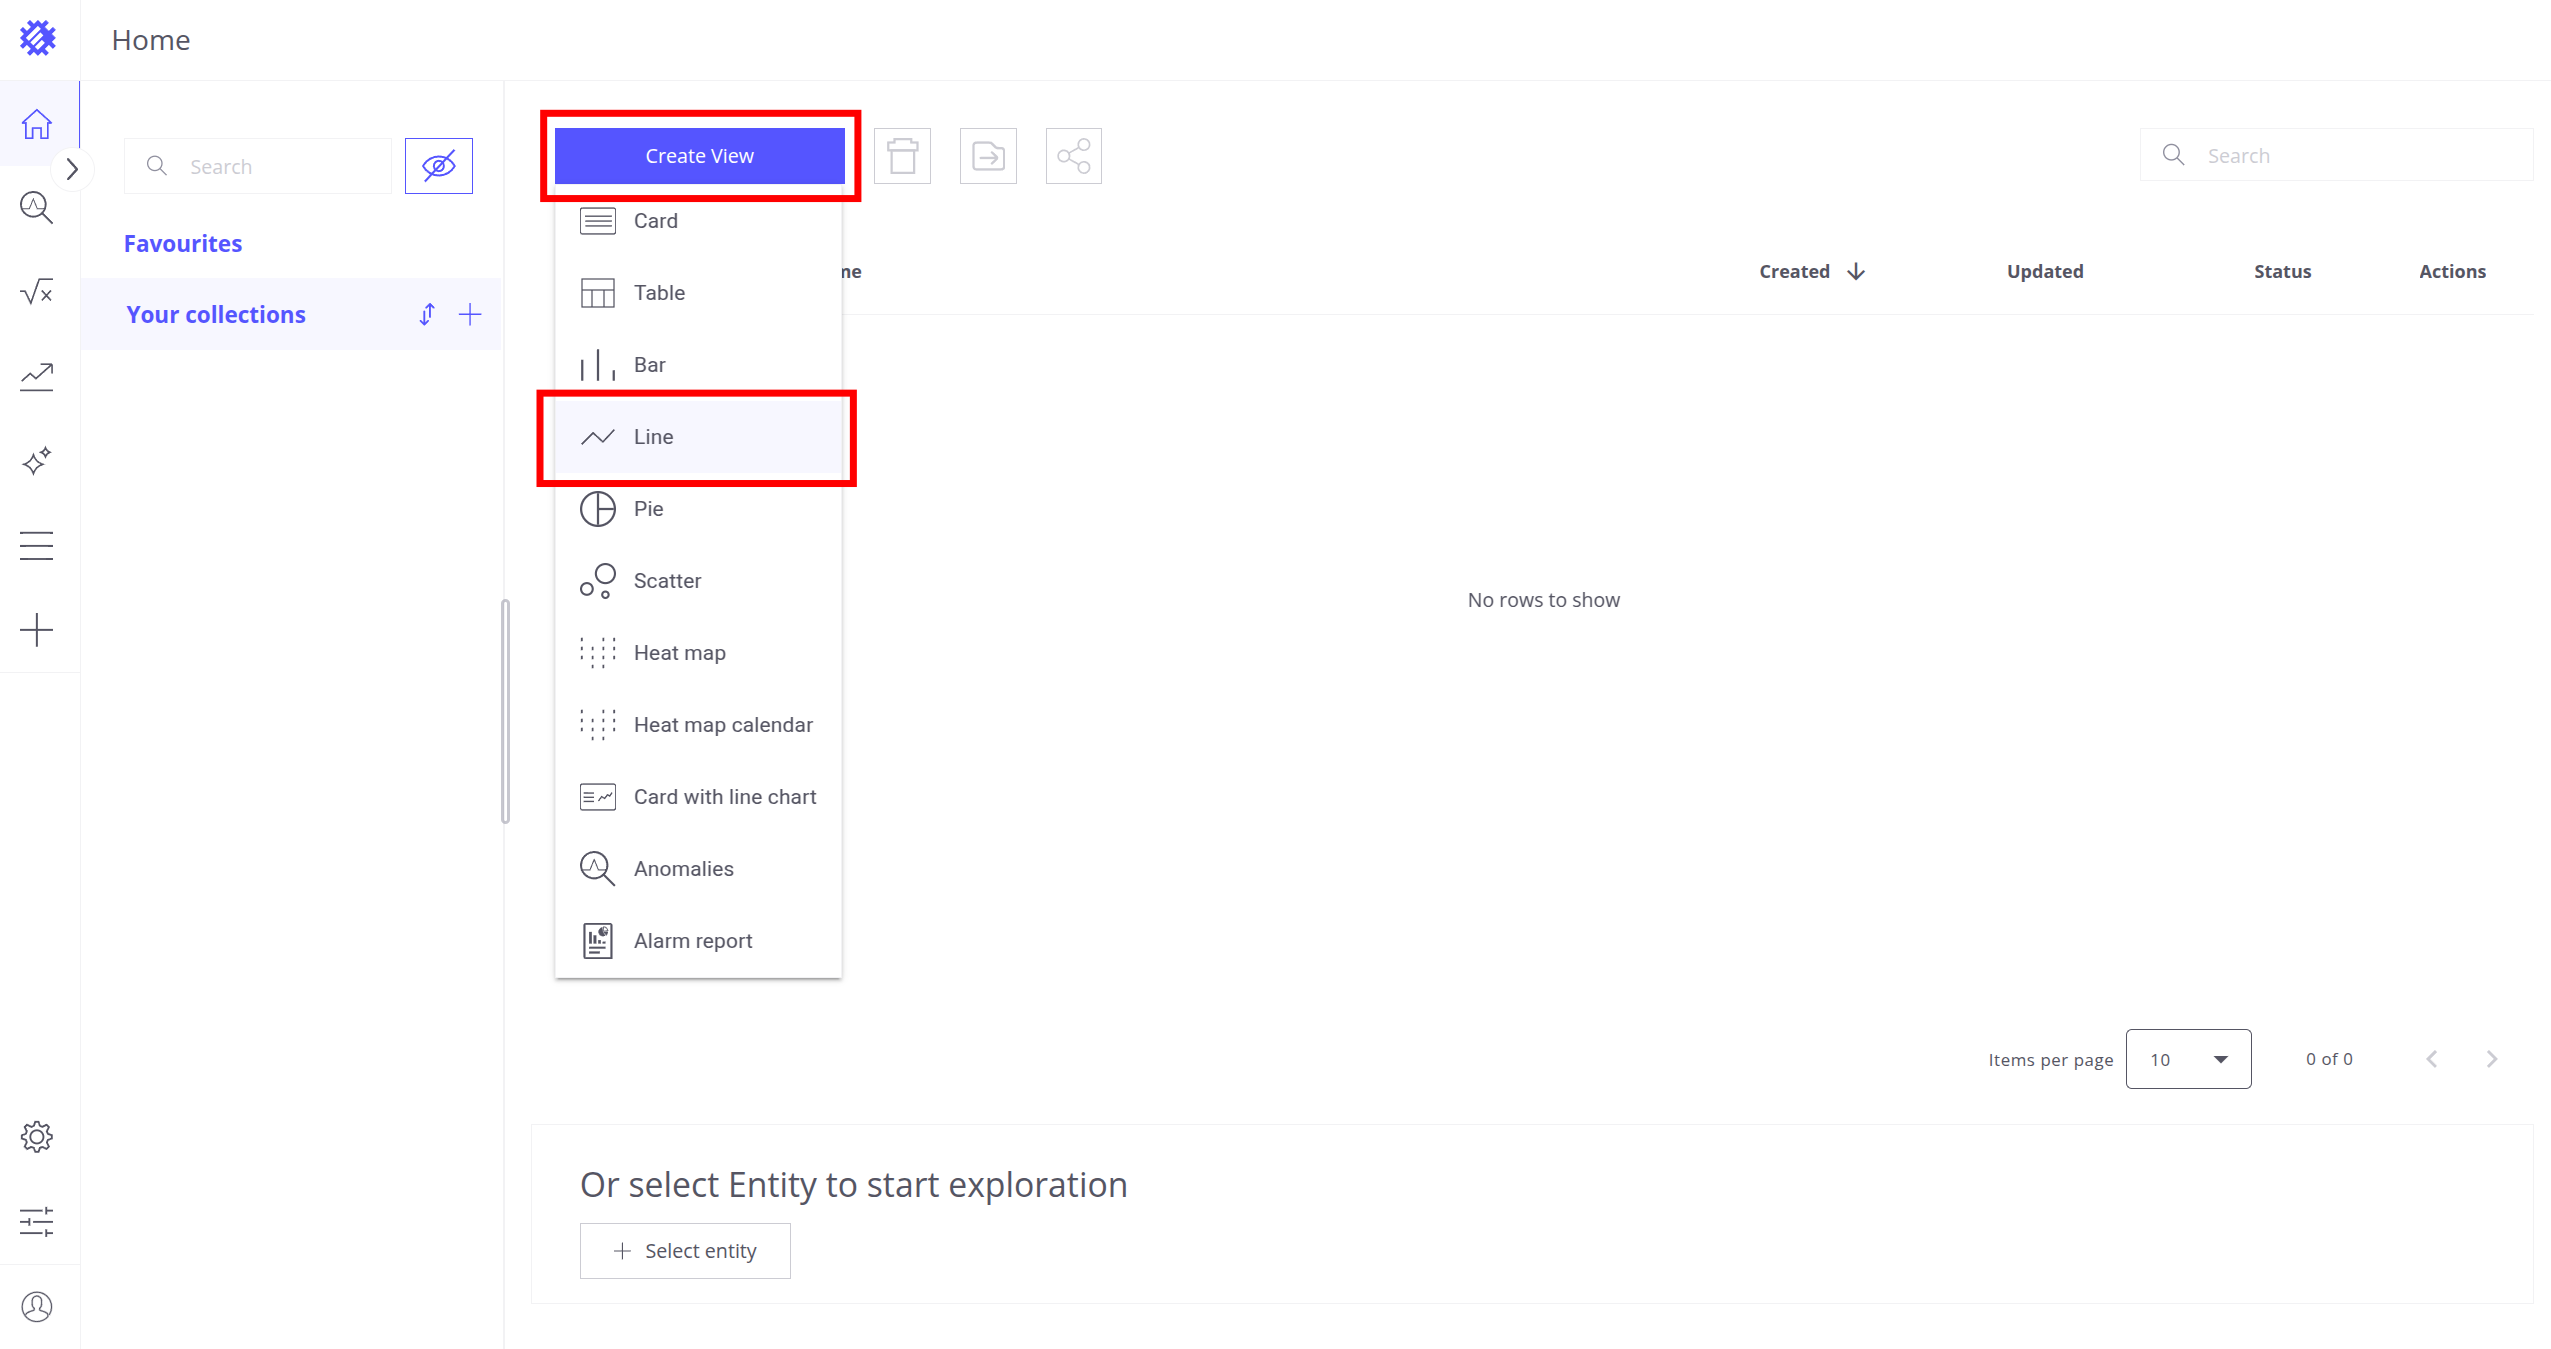
- 在首页点击 创建视图按钮,选择 折线图
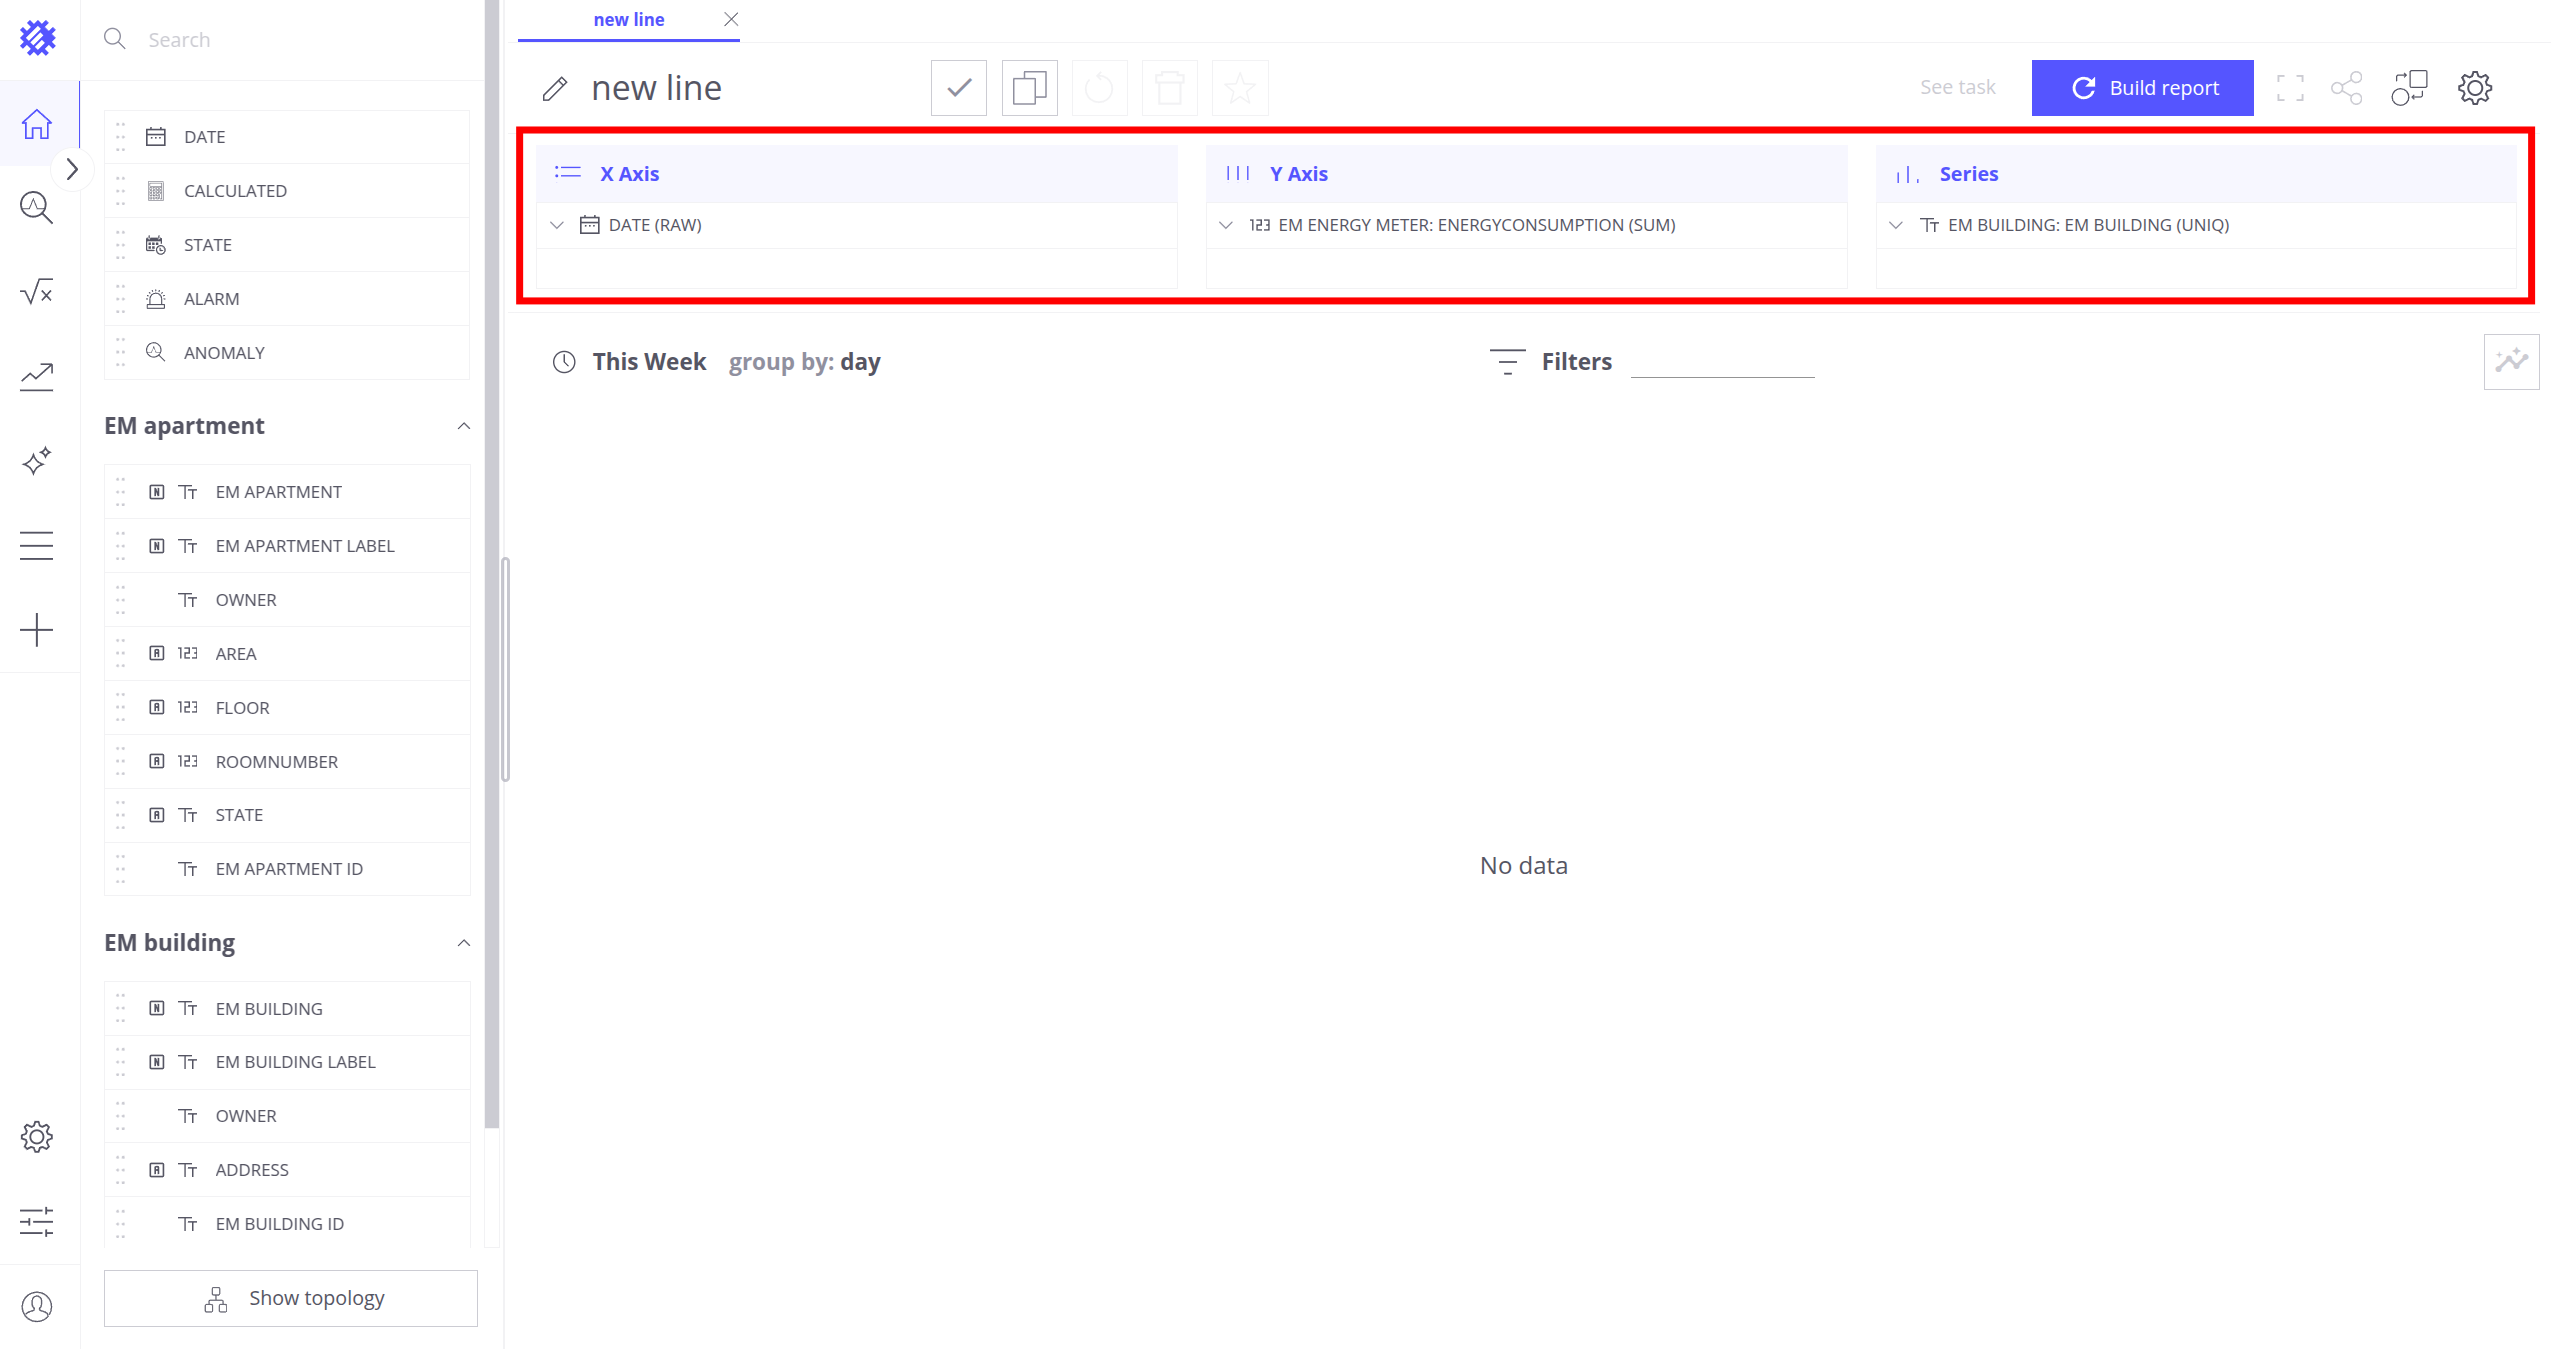
从屏幕左侧的实体列表中选择字段,拖放到对应区域。日期字段可从屏幕左上角拖放。为各区域添加所需字段:
- 将
Date (RAW)添加到 X 轴区域(日期字段) - 将
EM energy meter.energyConsumption添加到 Y 轴区域(用电量遥测) - 将
EM building.EM building添加到 系列区域(楼栋名称)
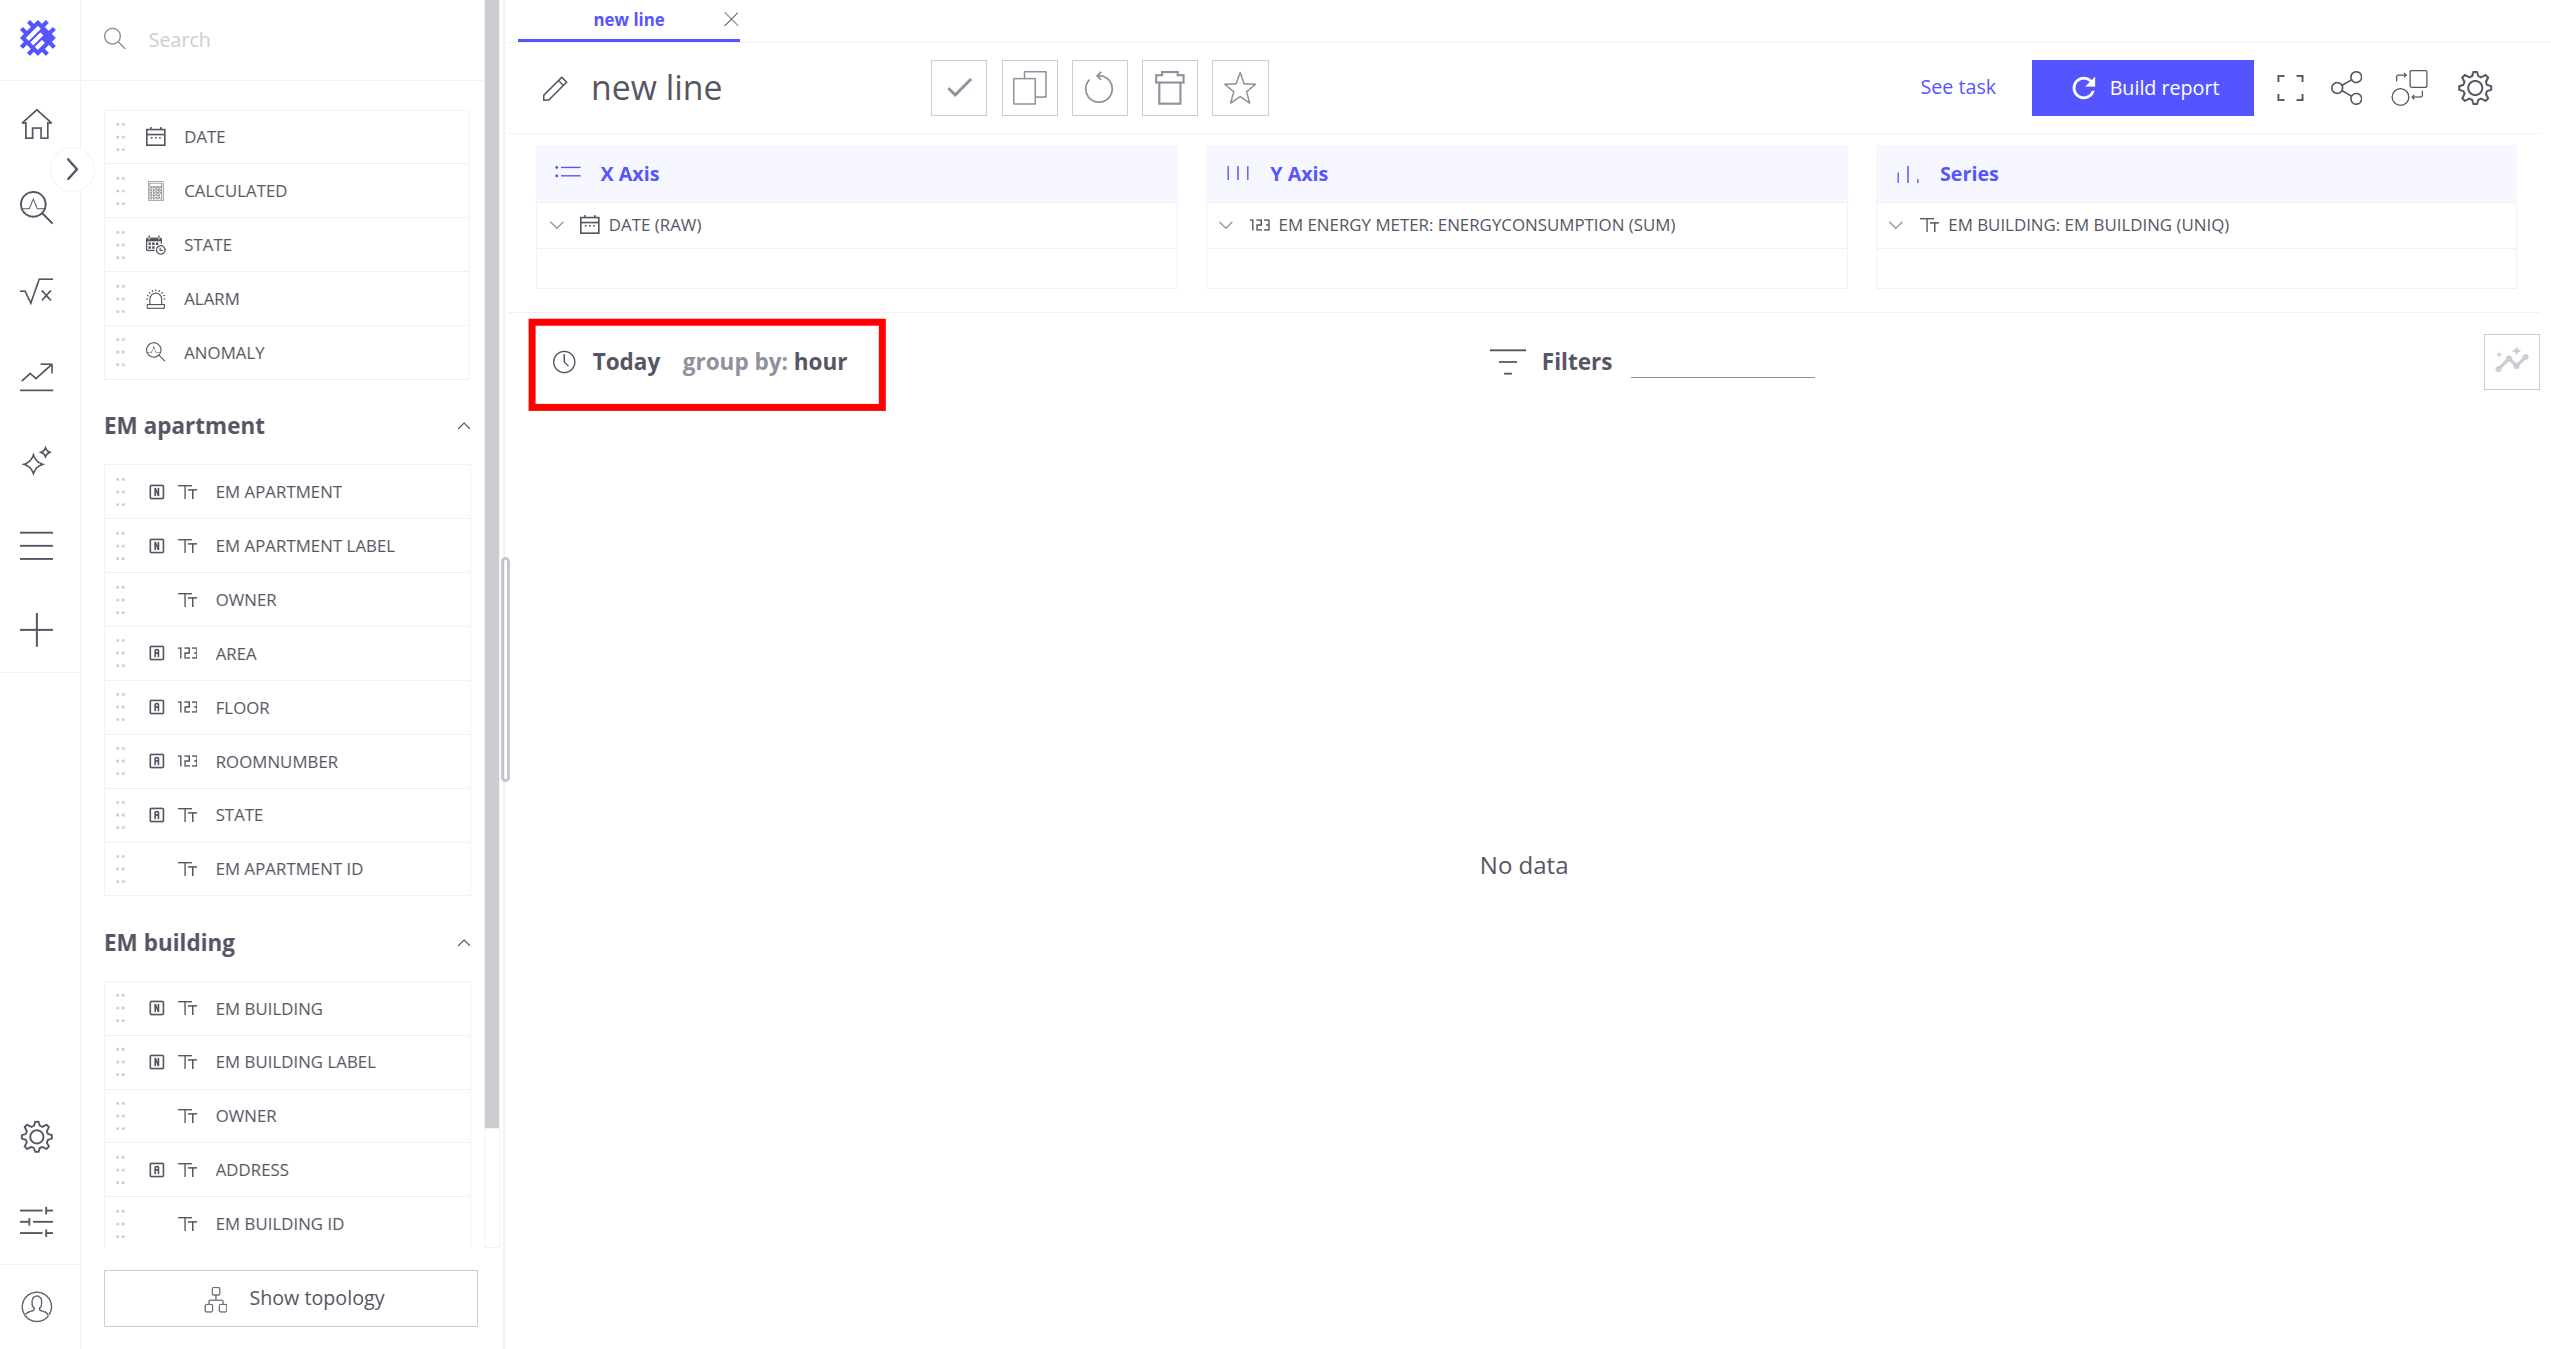
配置日期:
- 将日期选择器设为 今天,将 分组方式 设为 小时
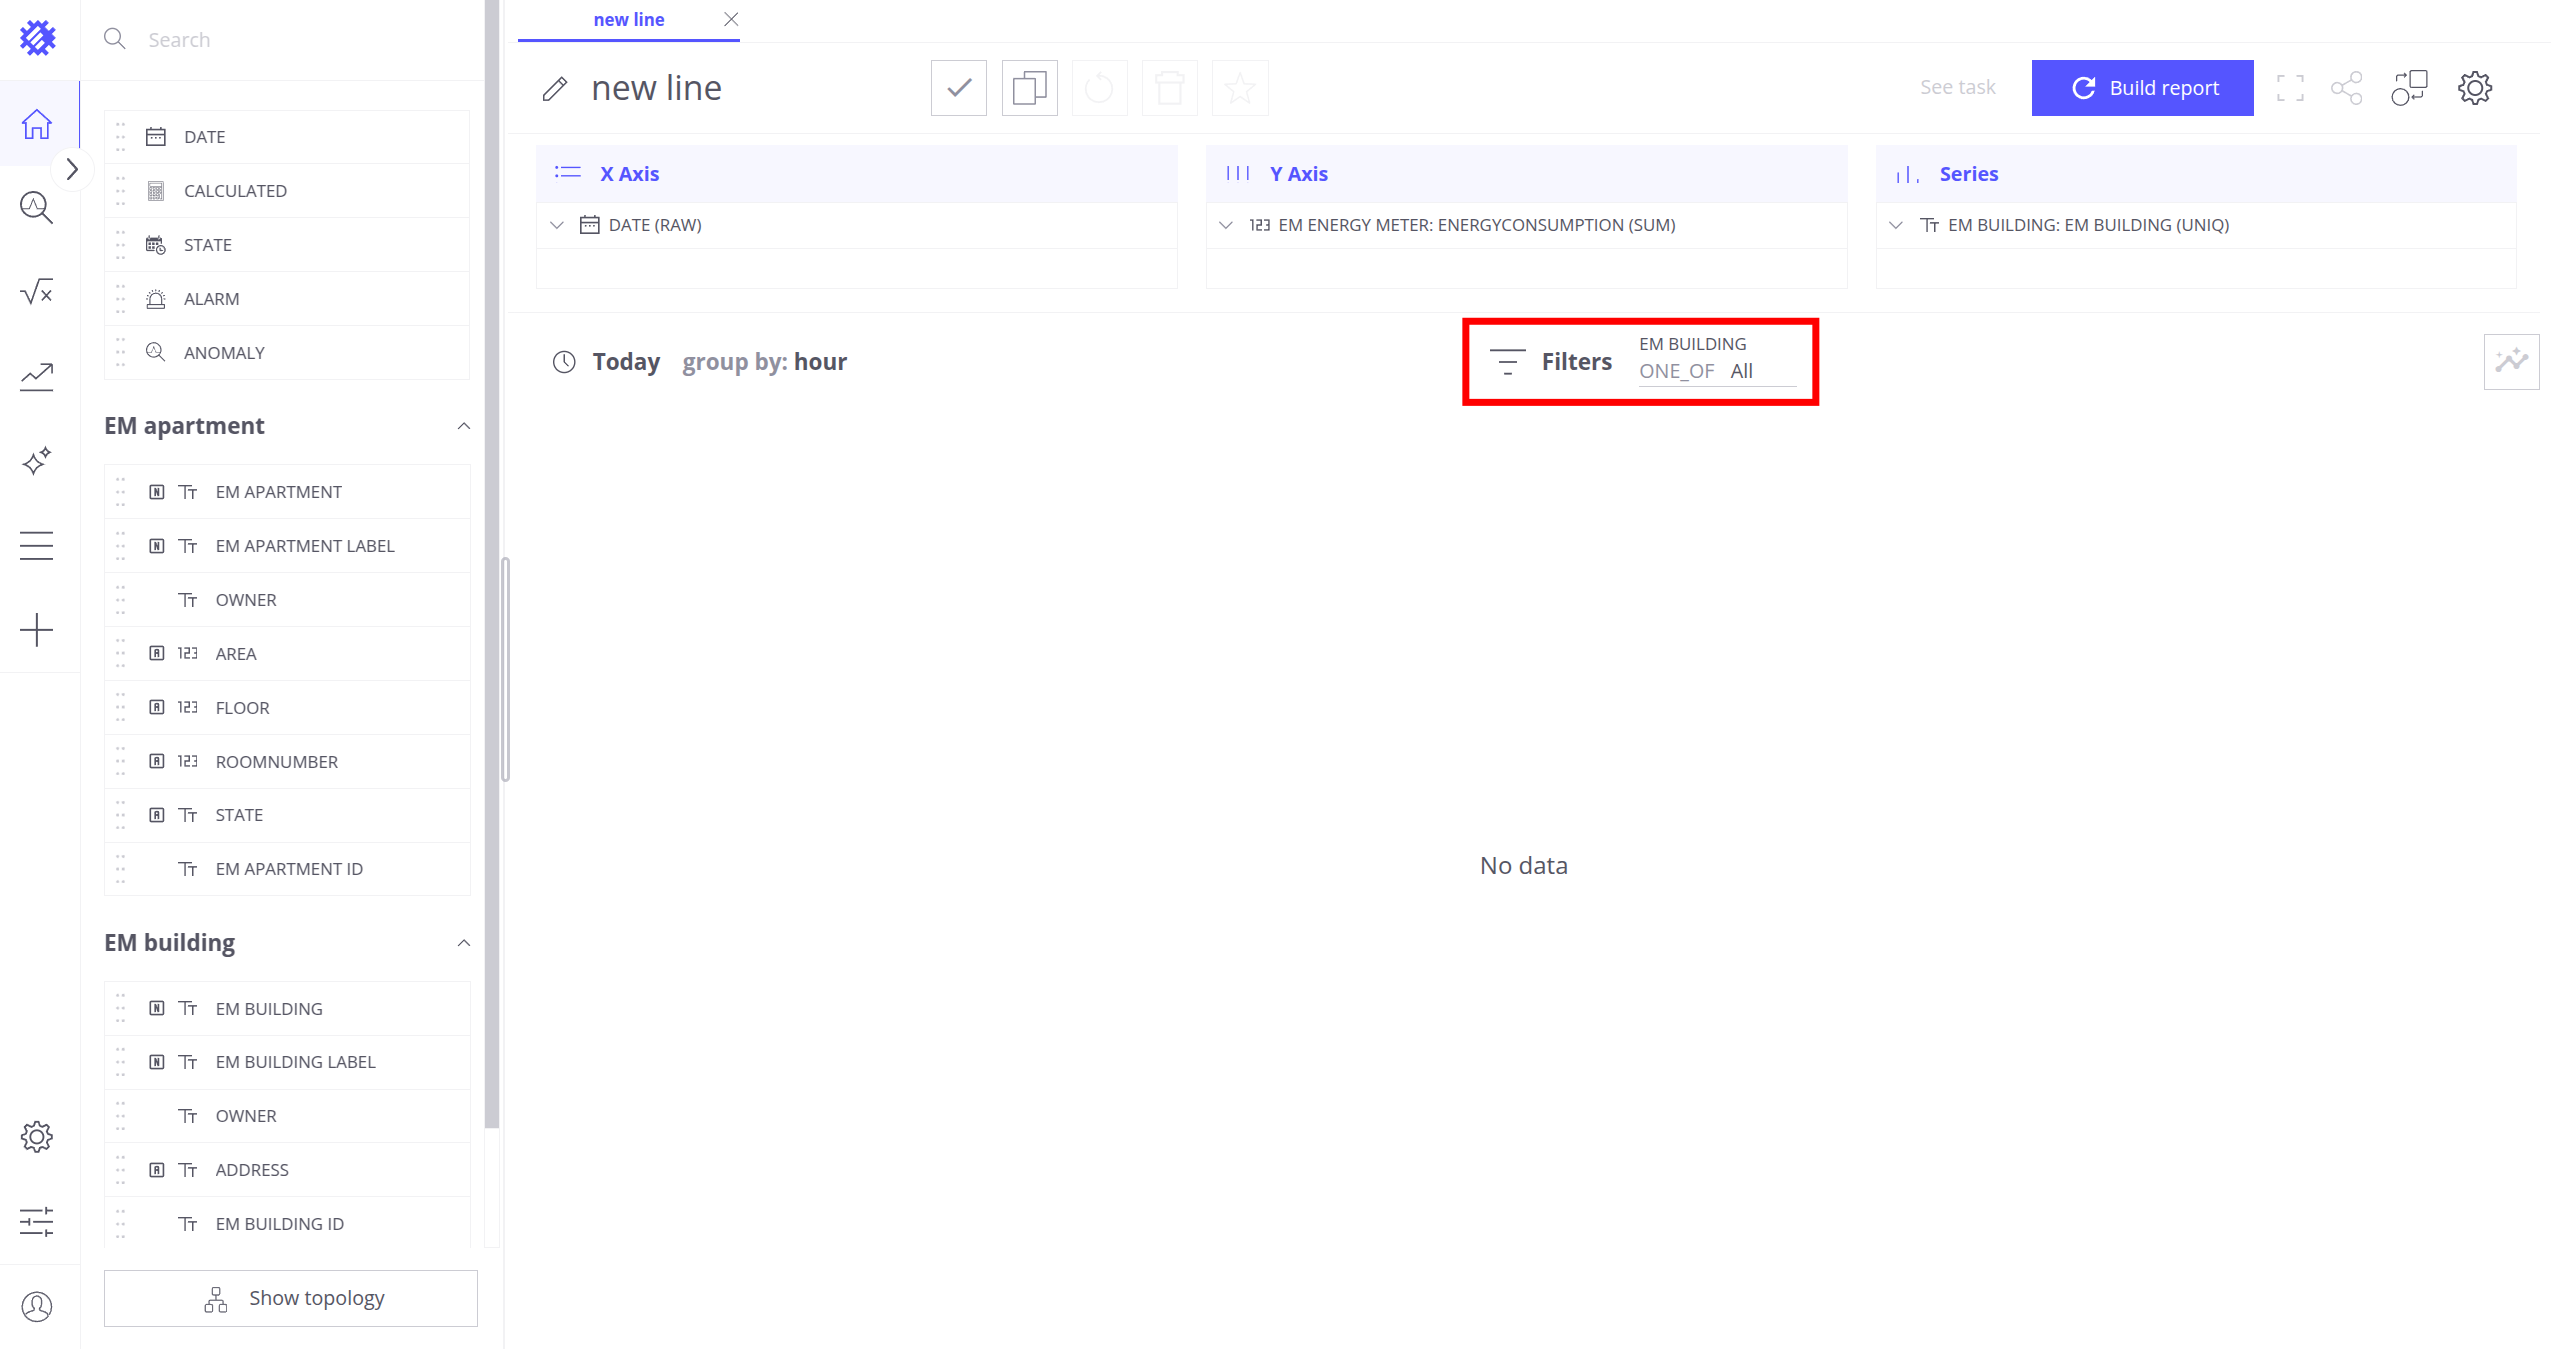
配置筛选条件:
- 在筛选区域添加
EM building.EM building,以查看指定楼栋的能耗
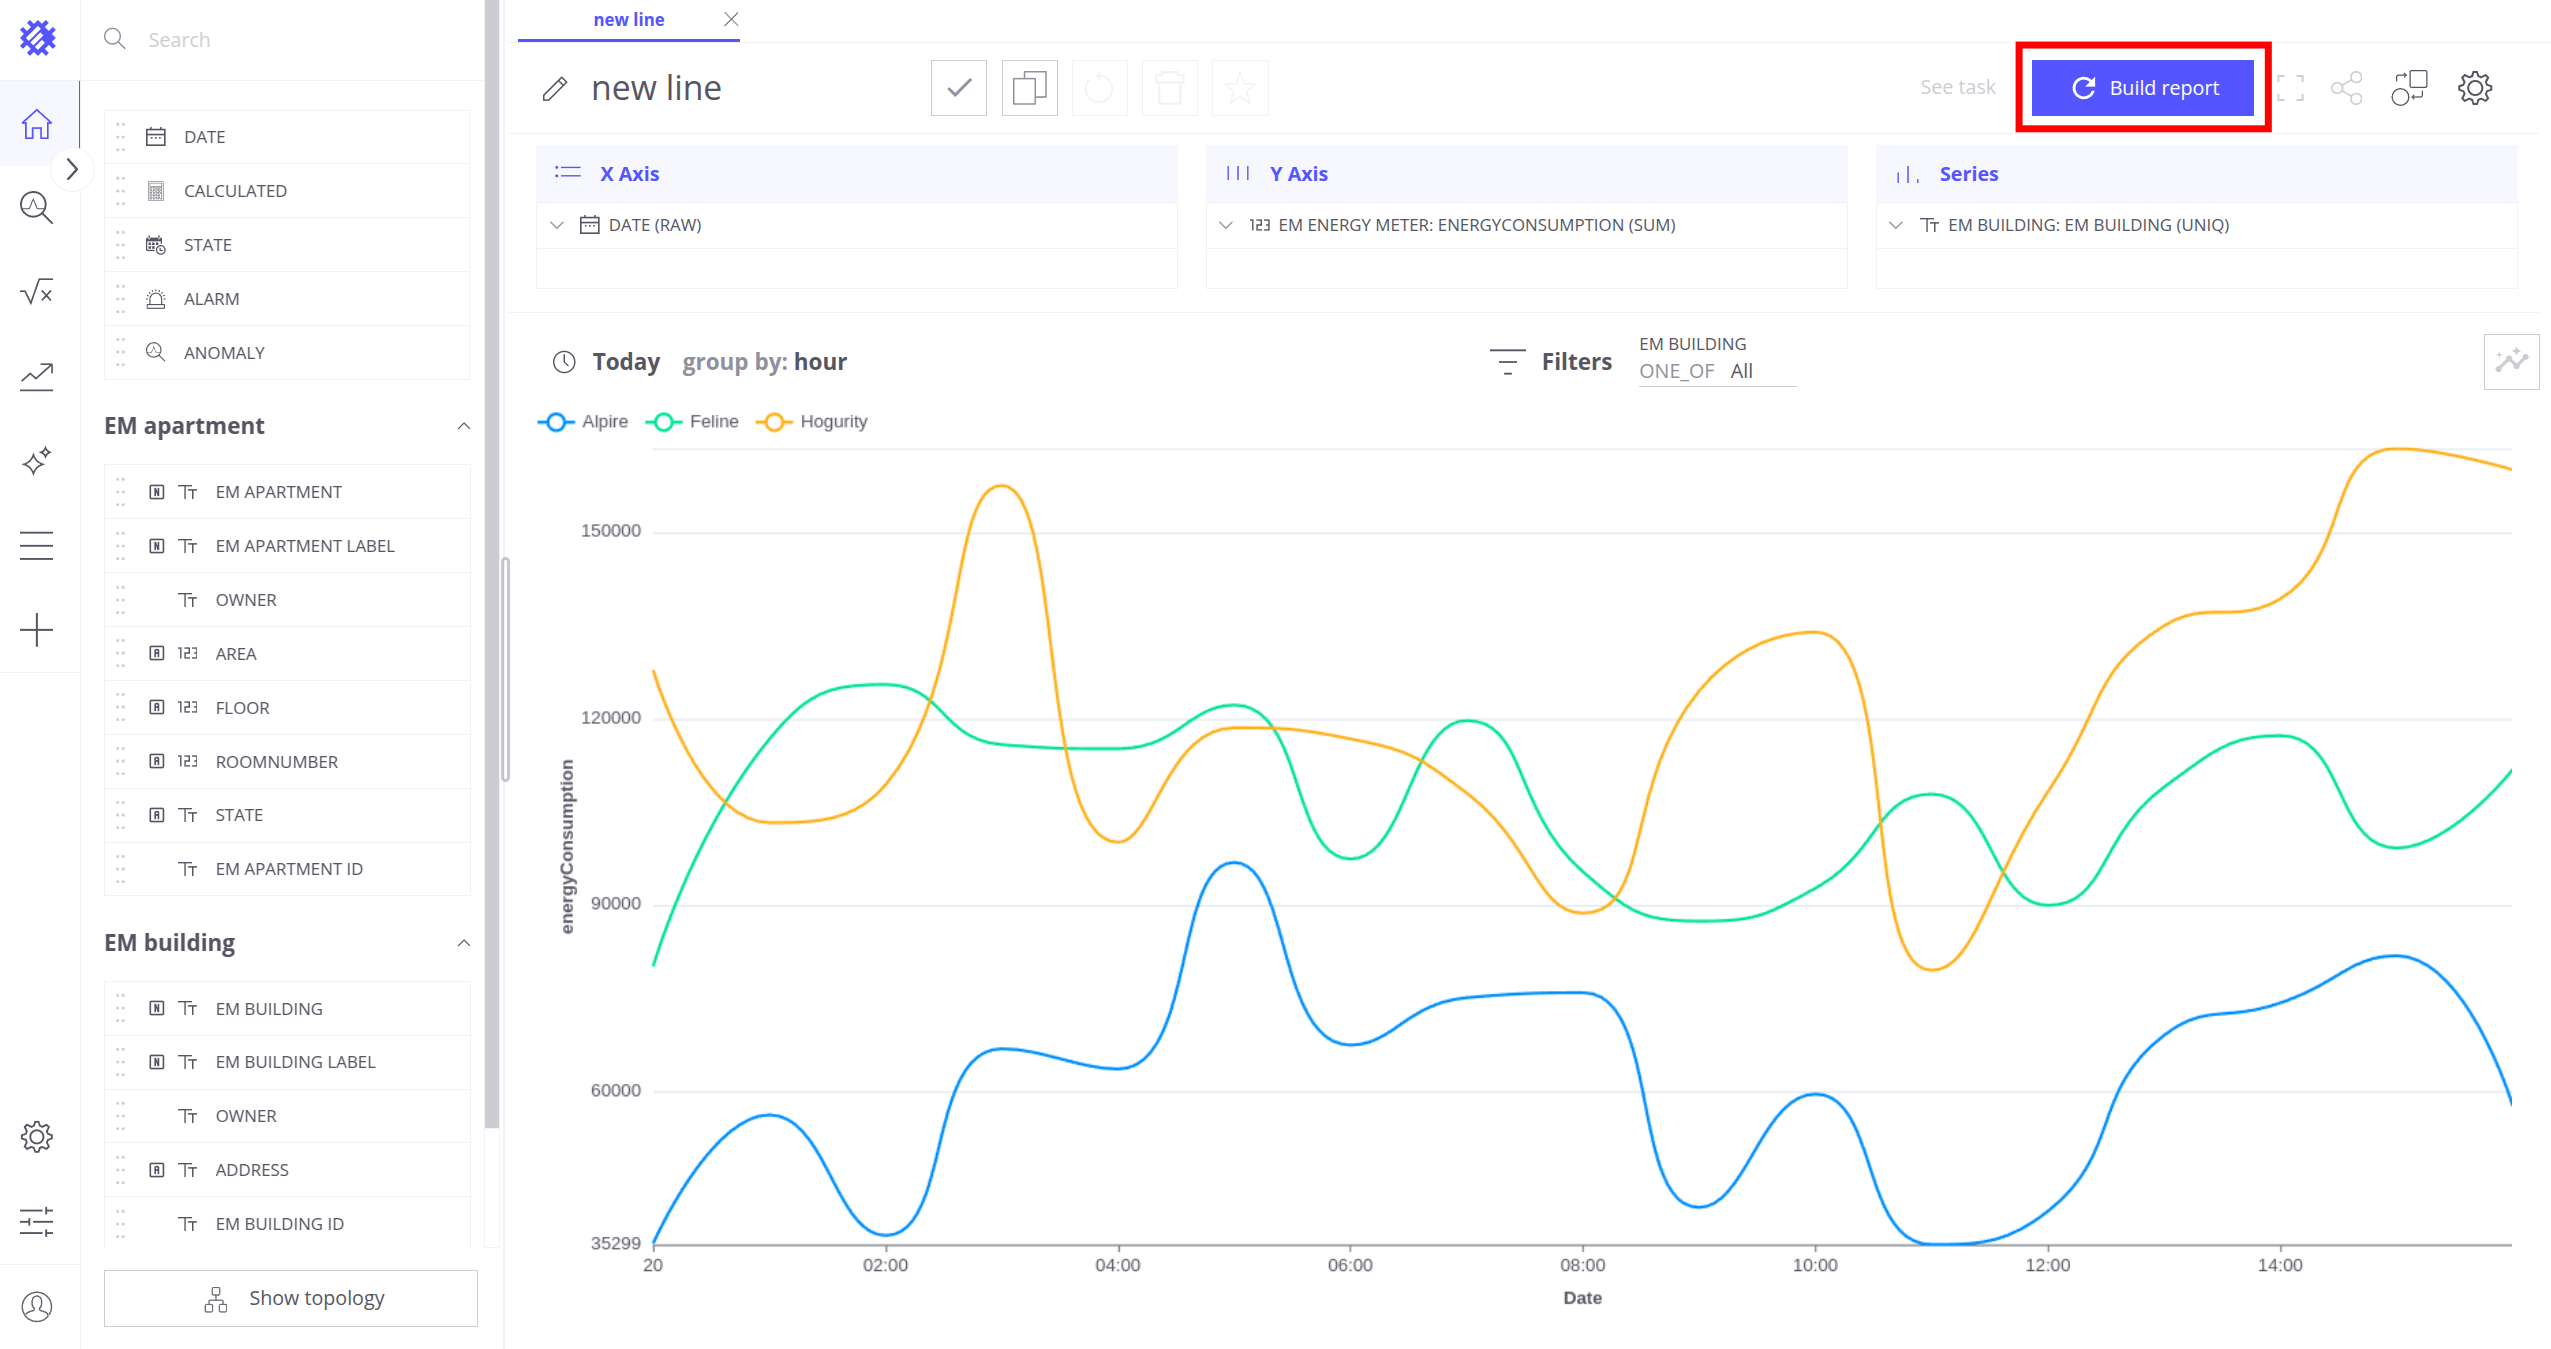
构建并保存视图:
- 点击 构建报告,将生成按楼栋划分的折线图
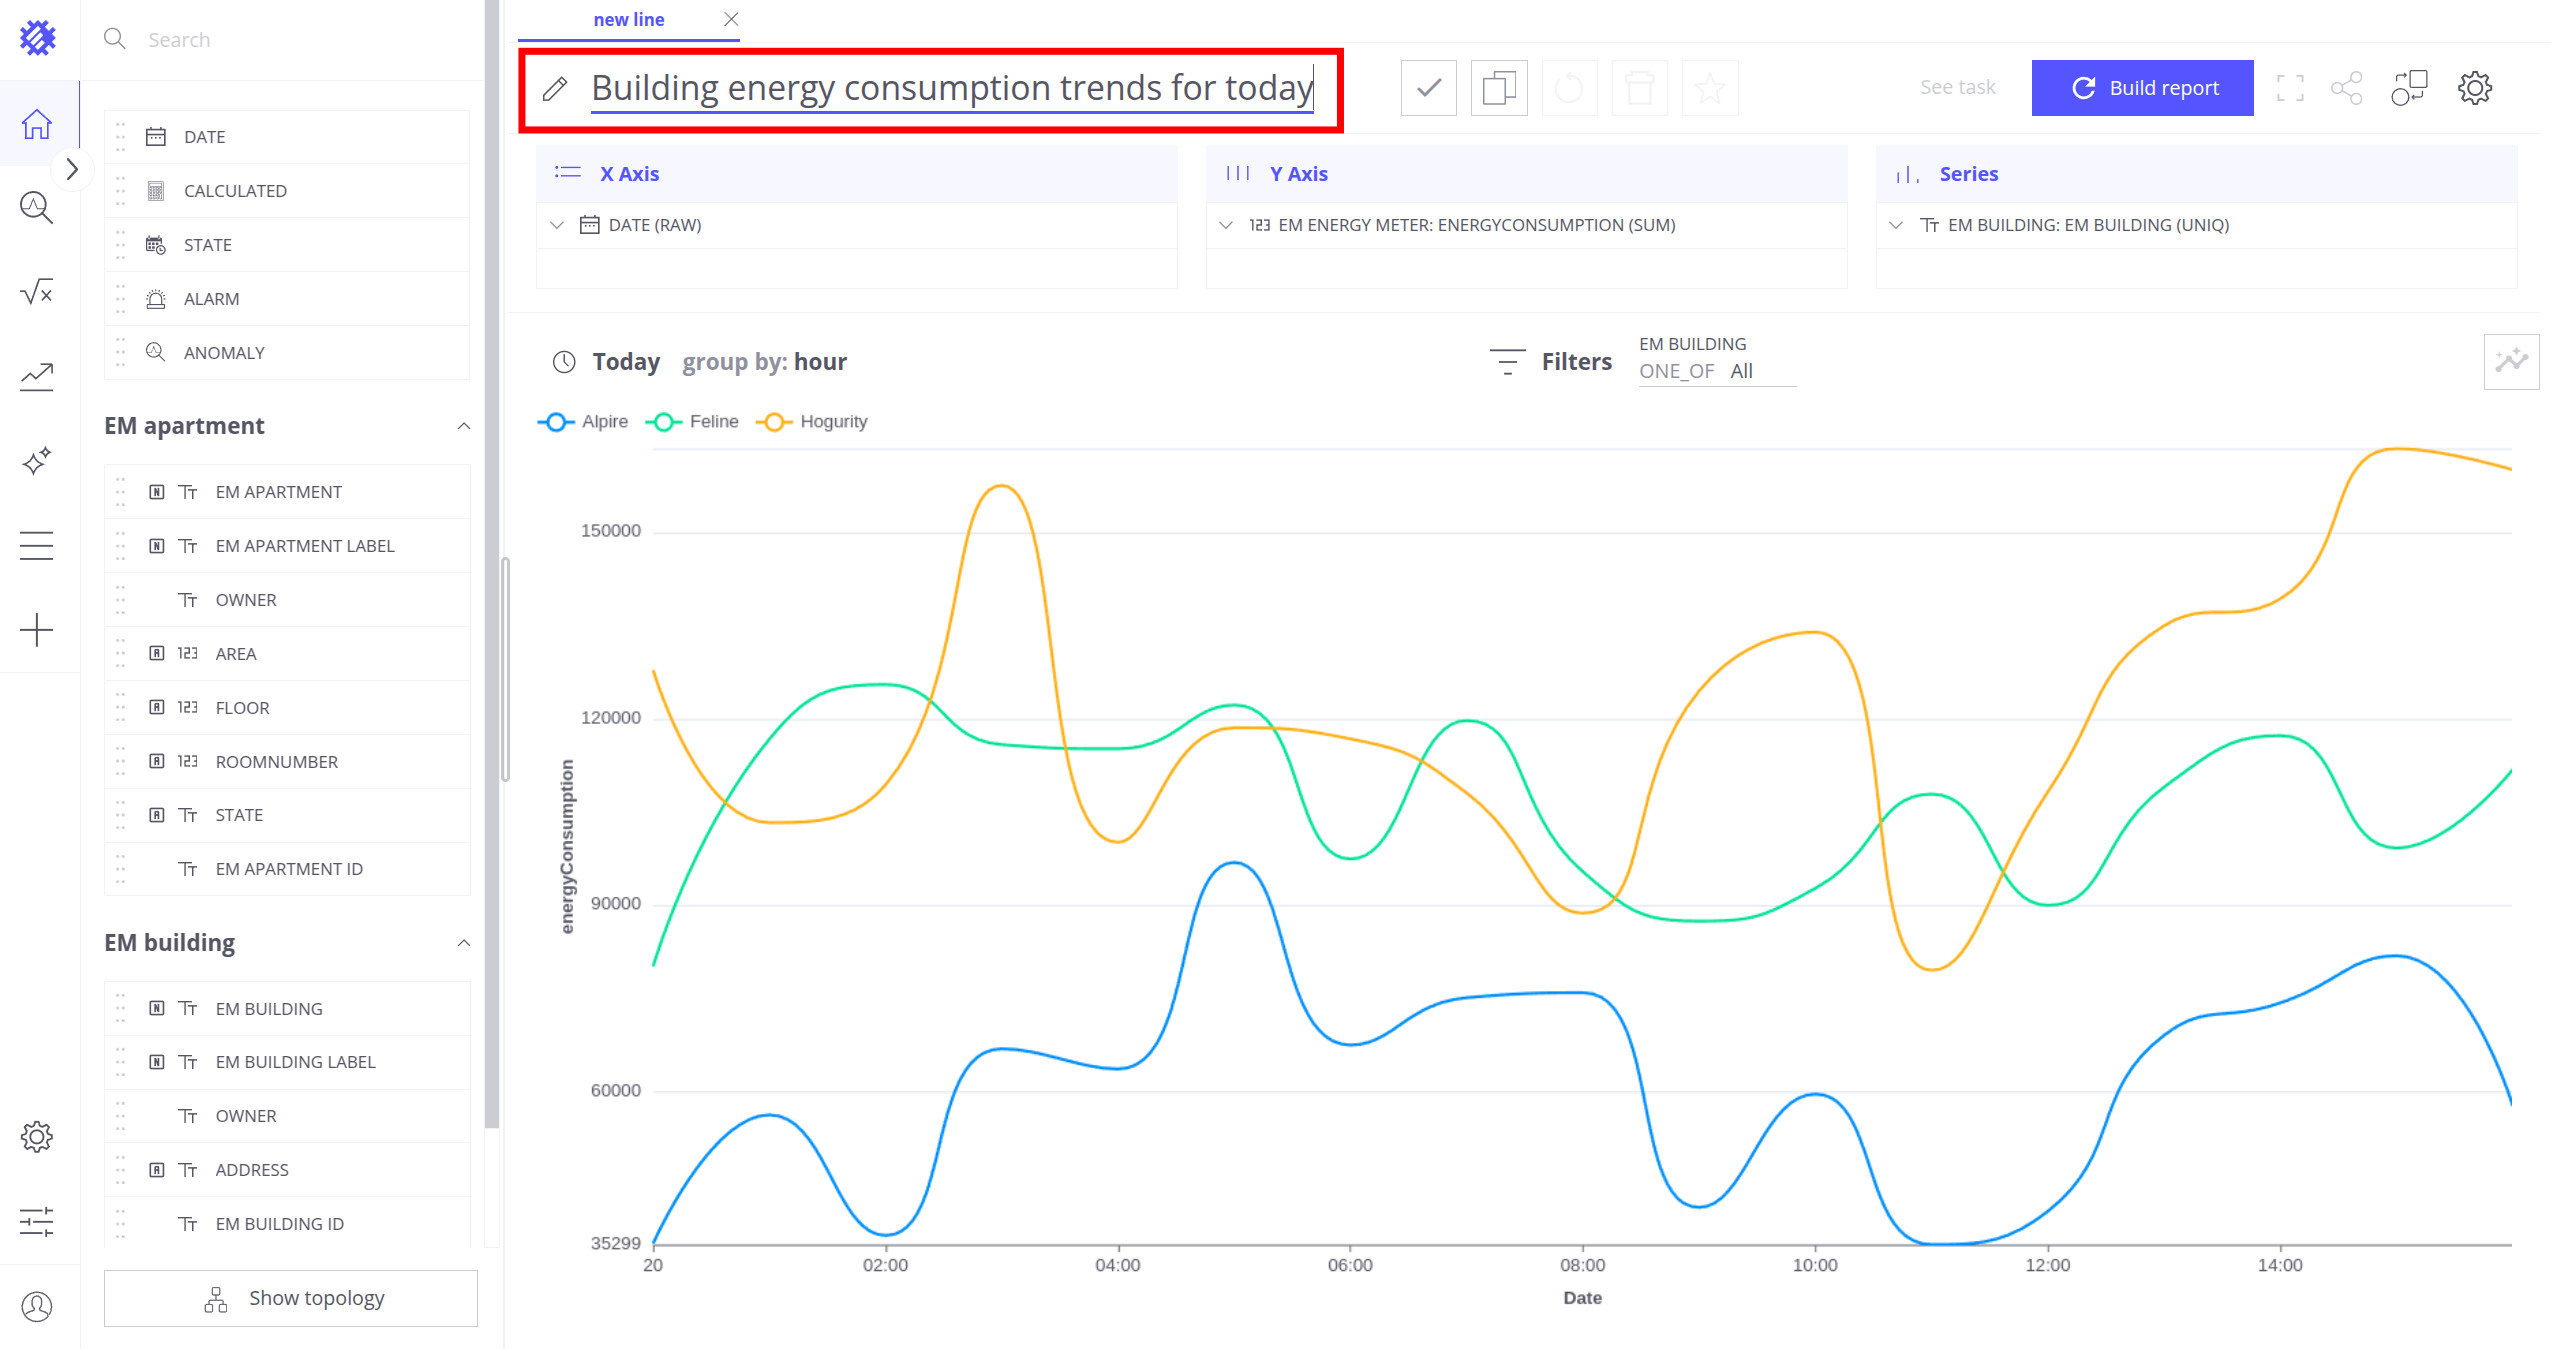
-
点击名称旁的铅笔图标重命名视图,例如「今日楼栋能耗趋势」
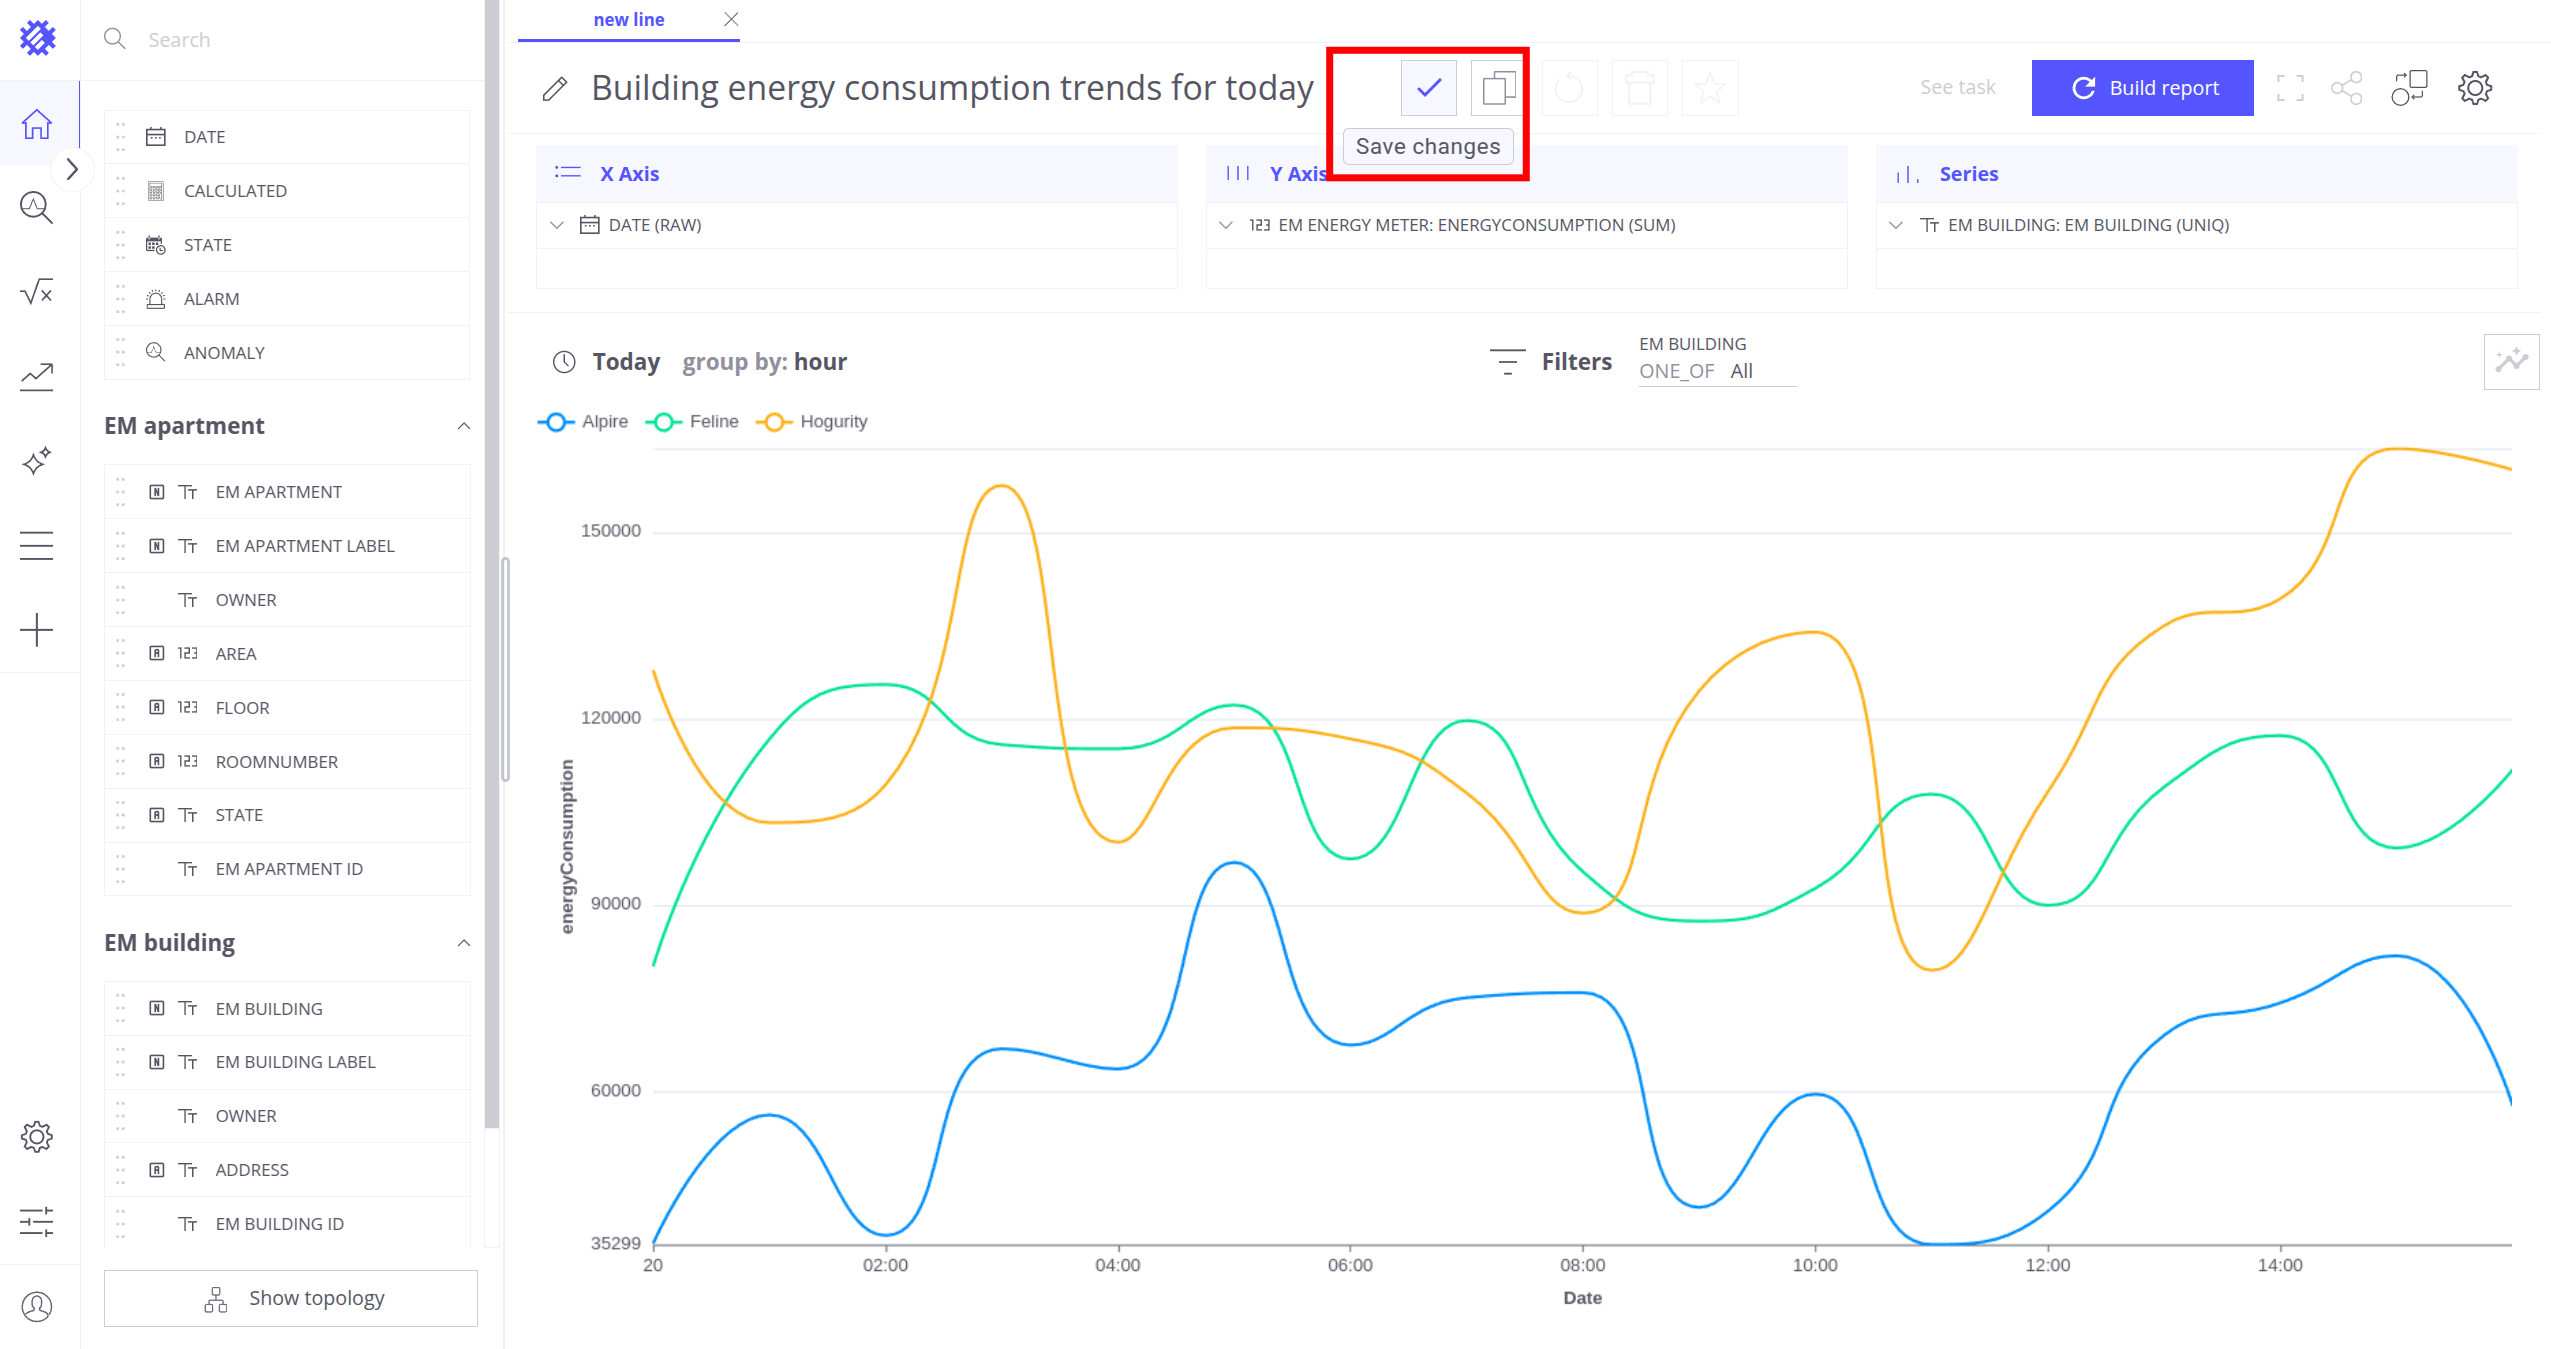
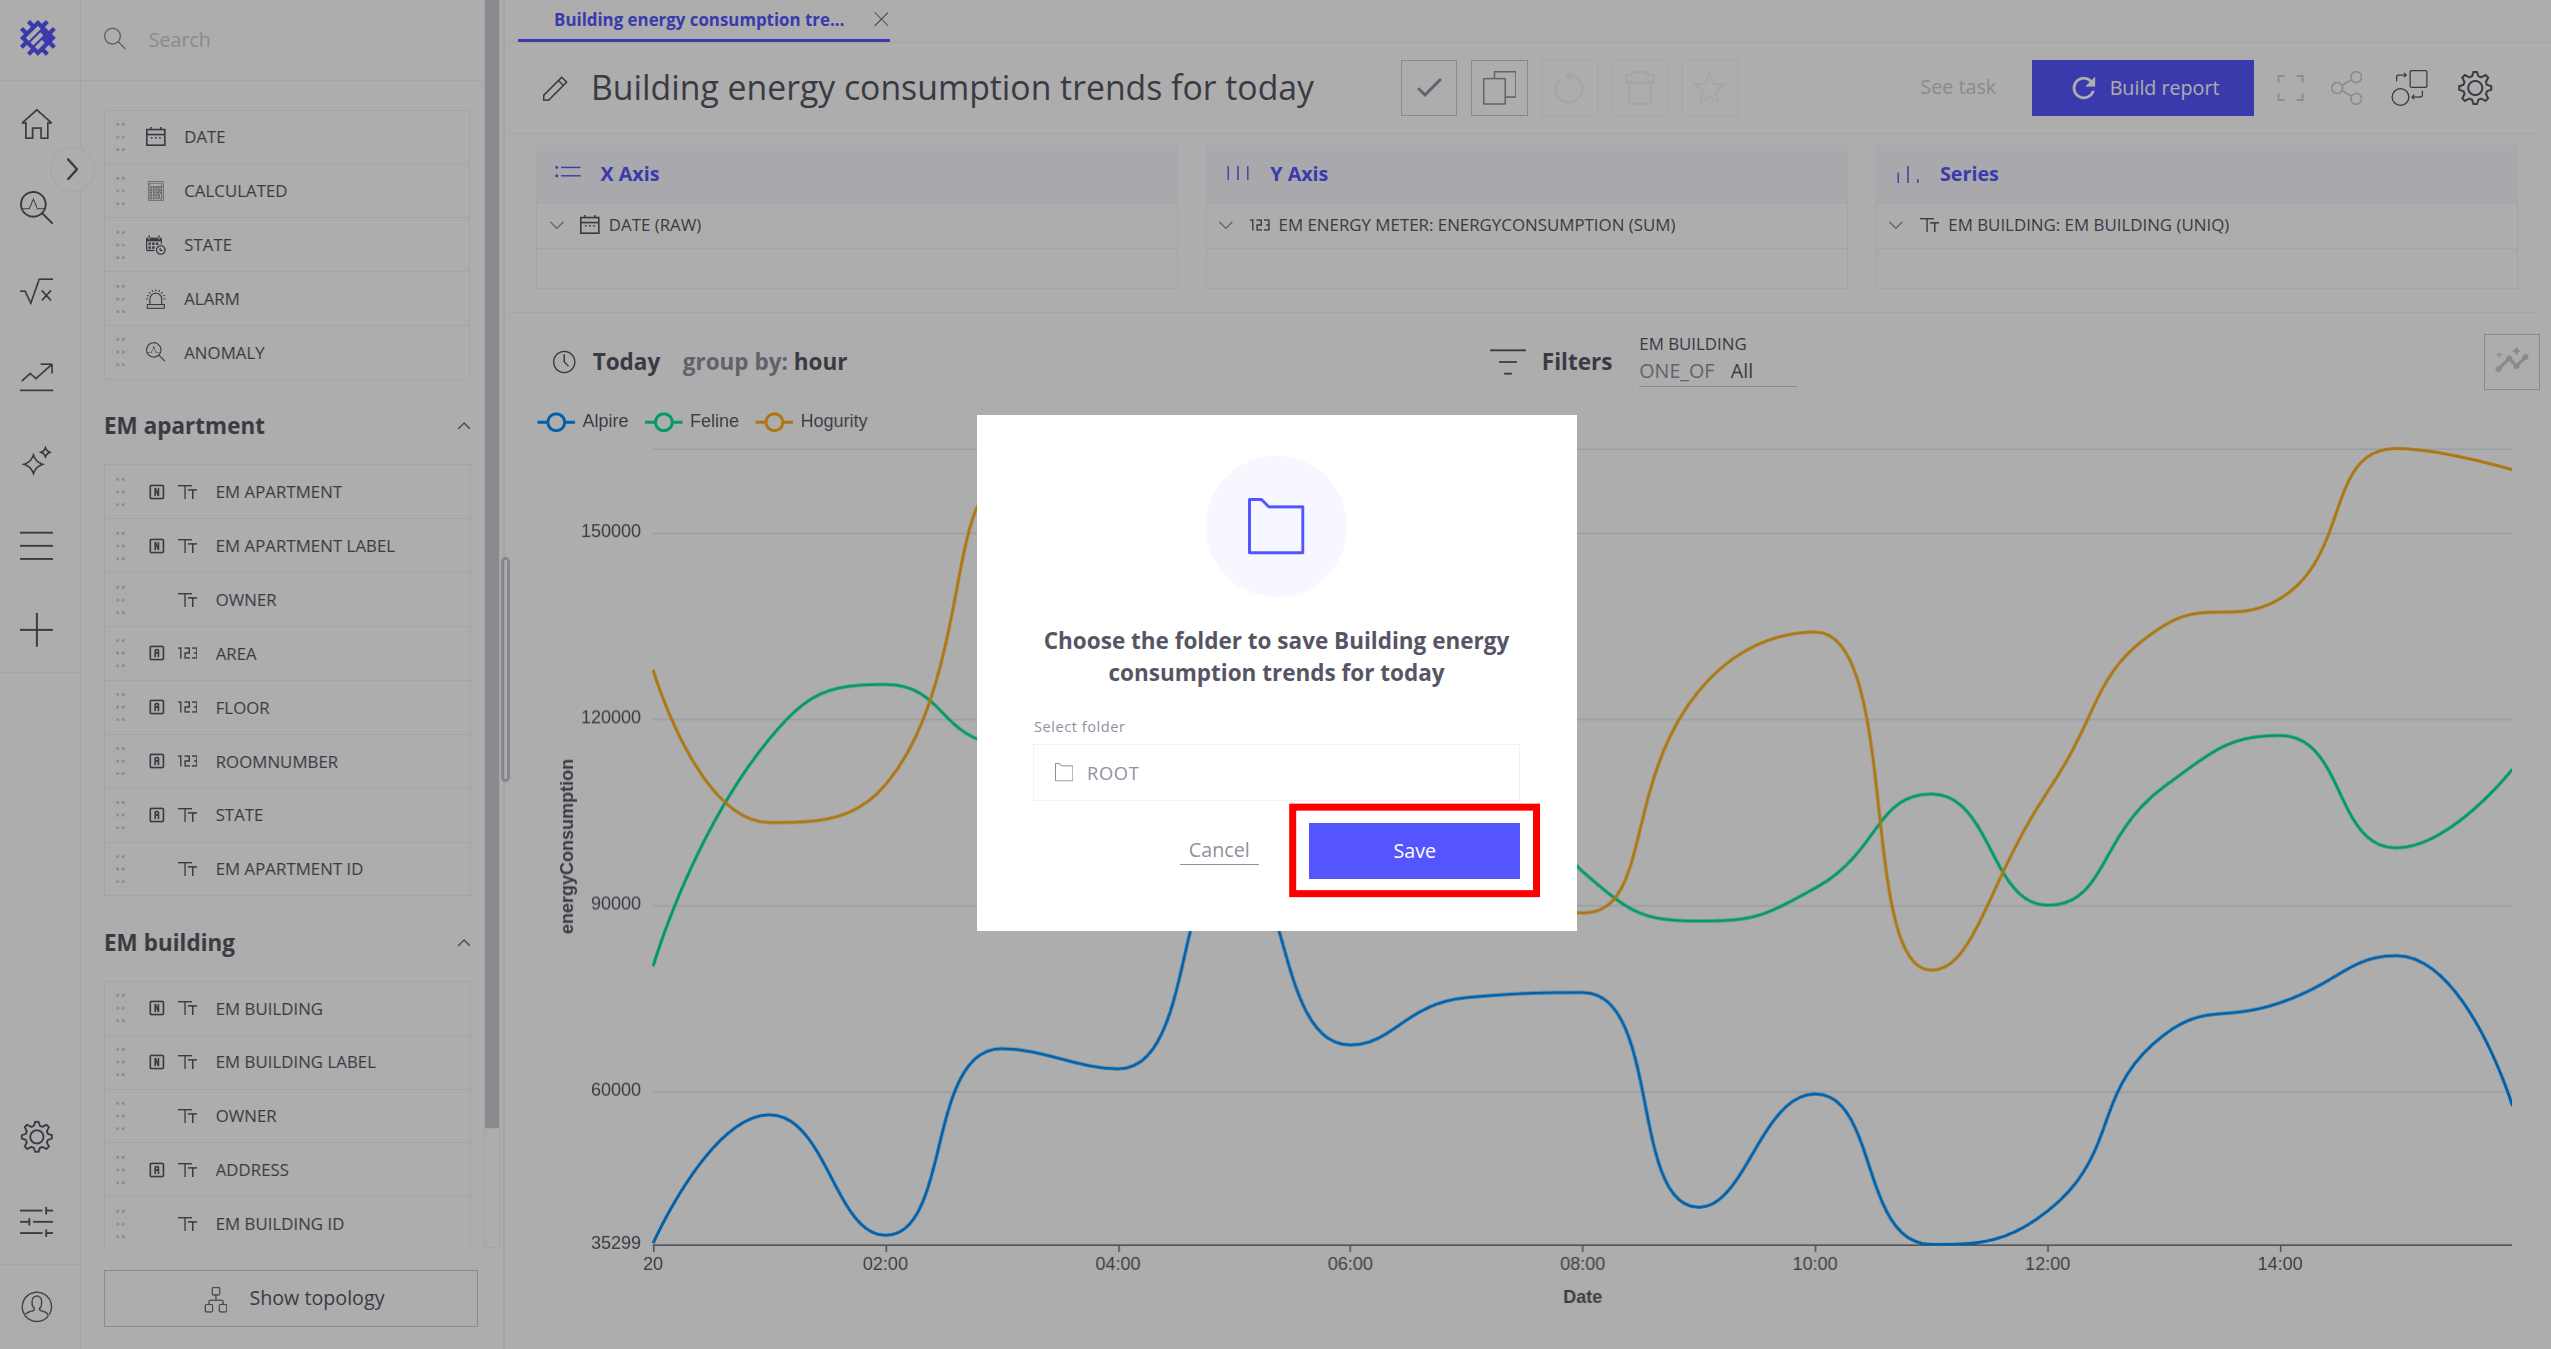
- 点击 保存更改按钮保存图表
- 在弹窗中点击 保存按钮
更多可构建的视图类型说明见此处。
步骤 3. 将折线图添加到 ThingsBoard 仪表板
可将该折线图添加到 ThingsBoard 仪表板。
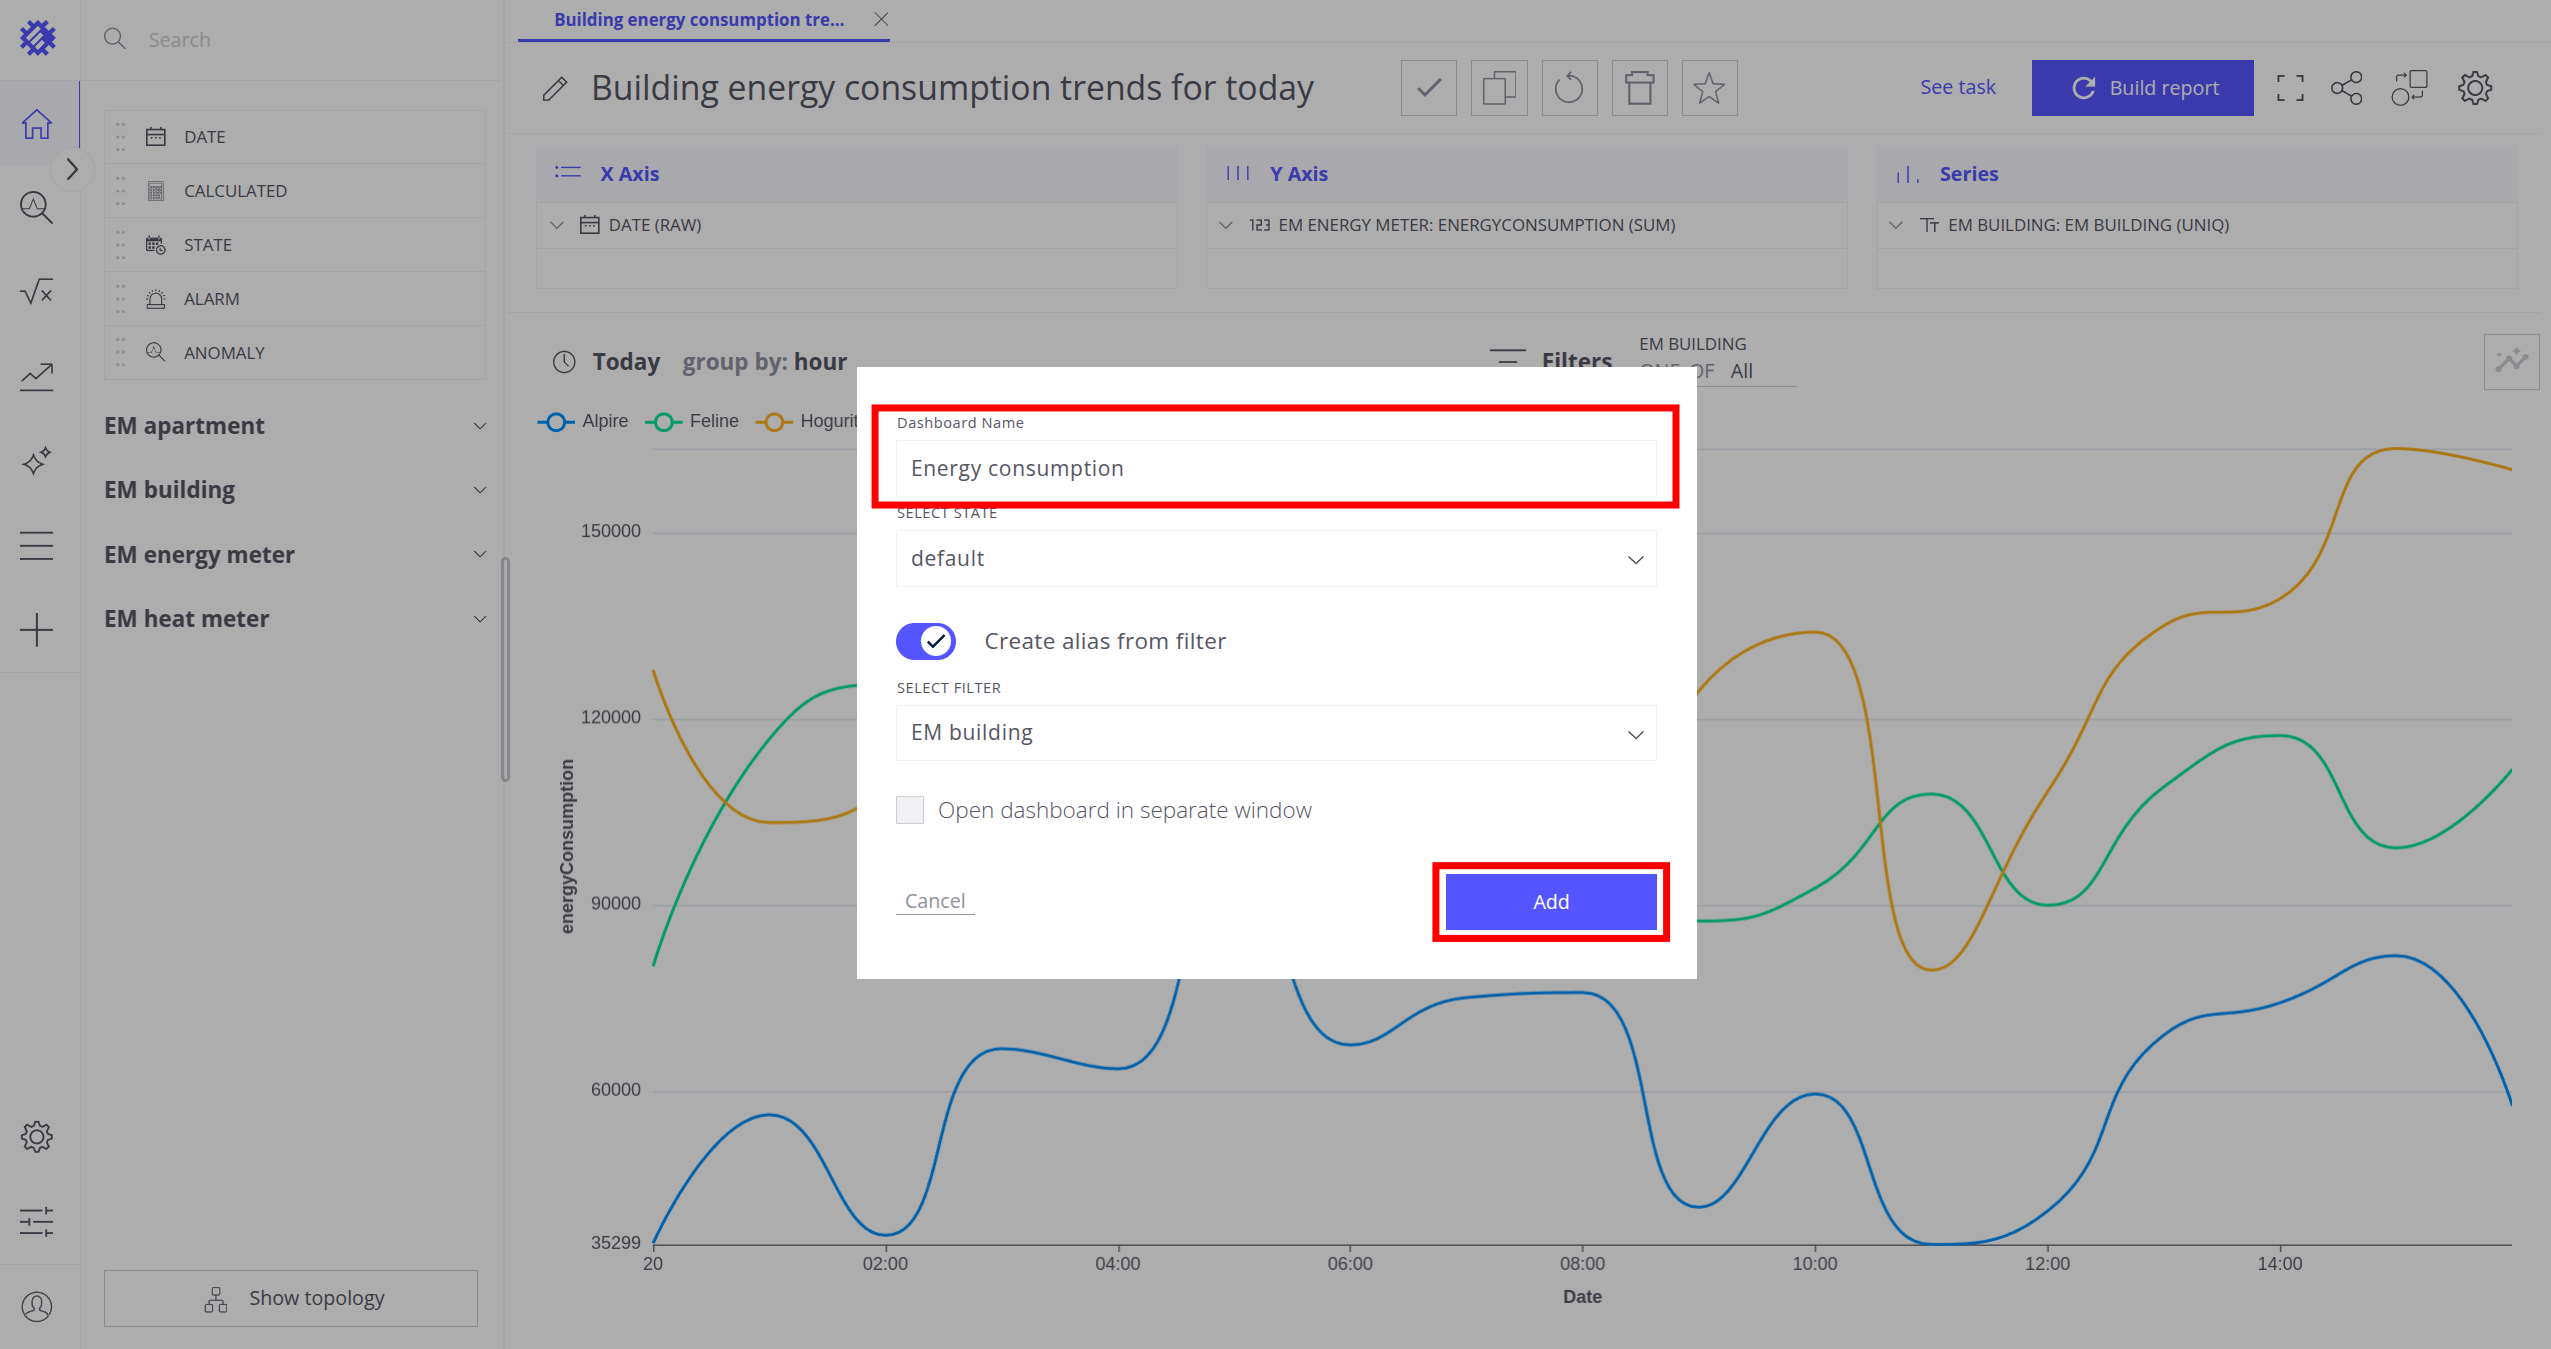
- 点击 分享到 ThingsBoard按钮并选择 添加到新仪表板
- 将仪表板名称设为
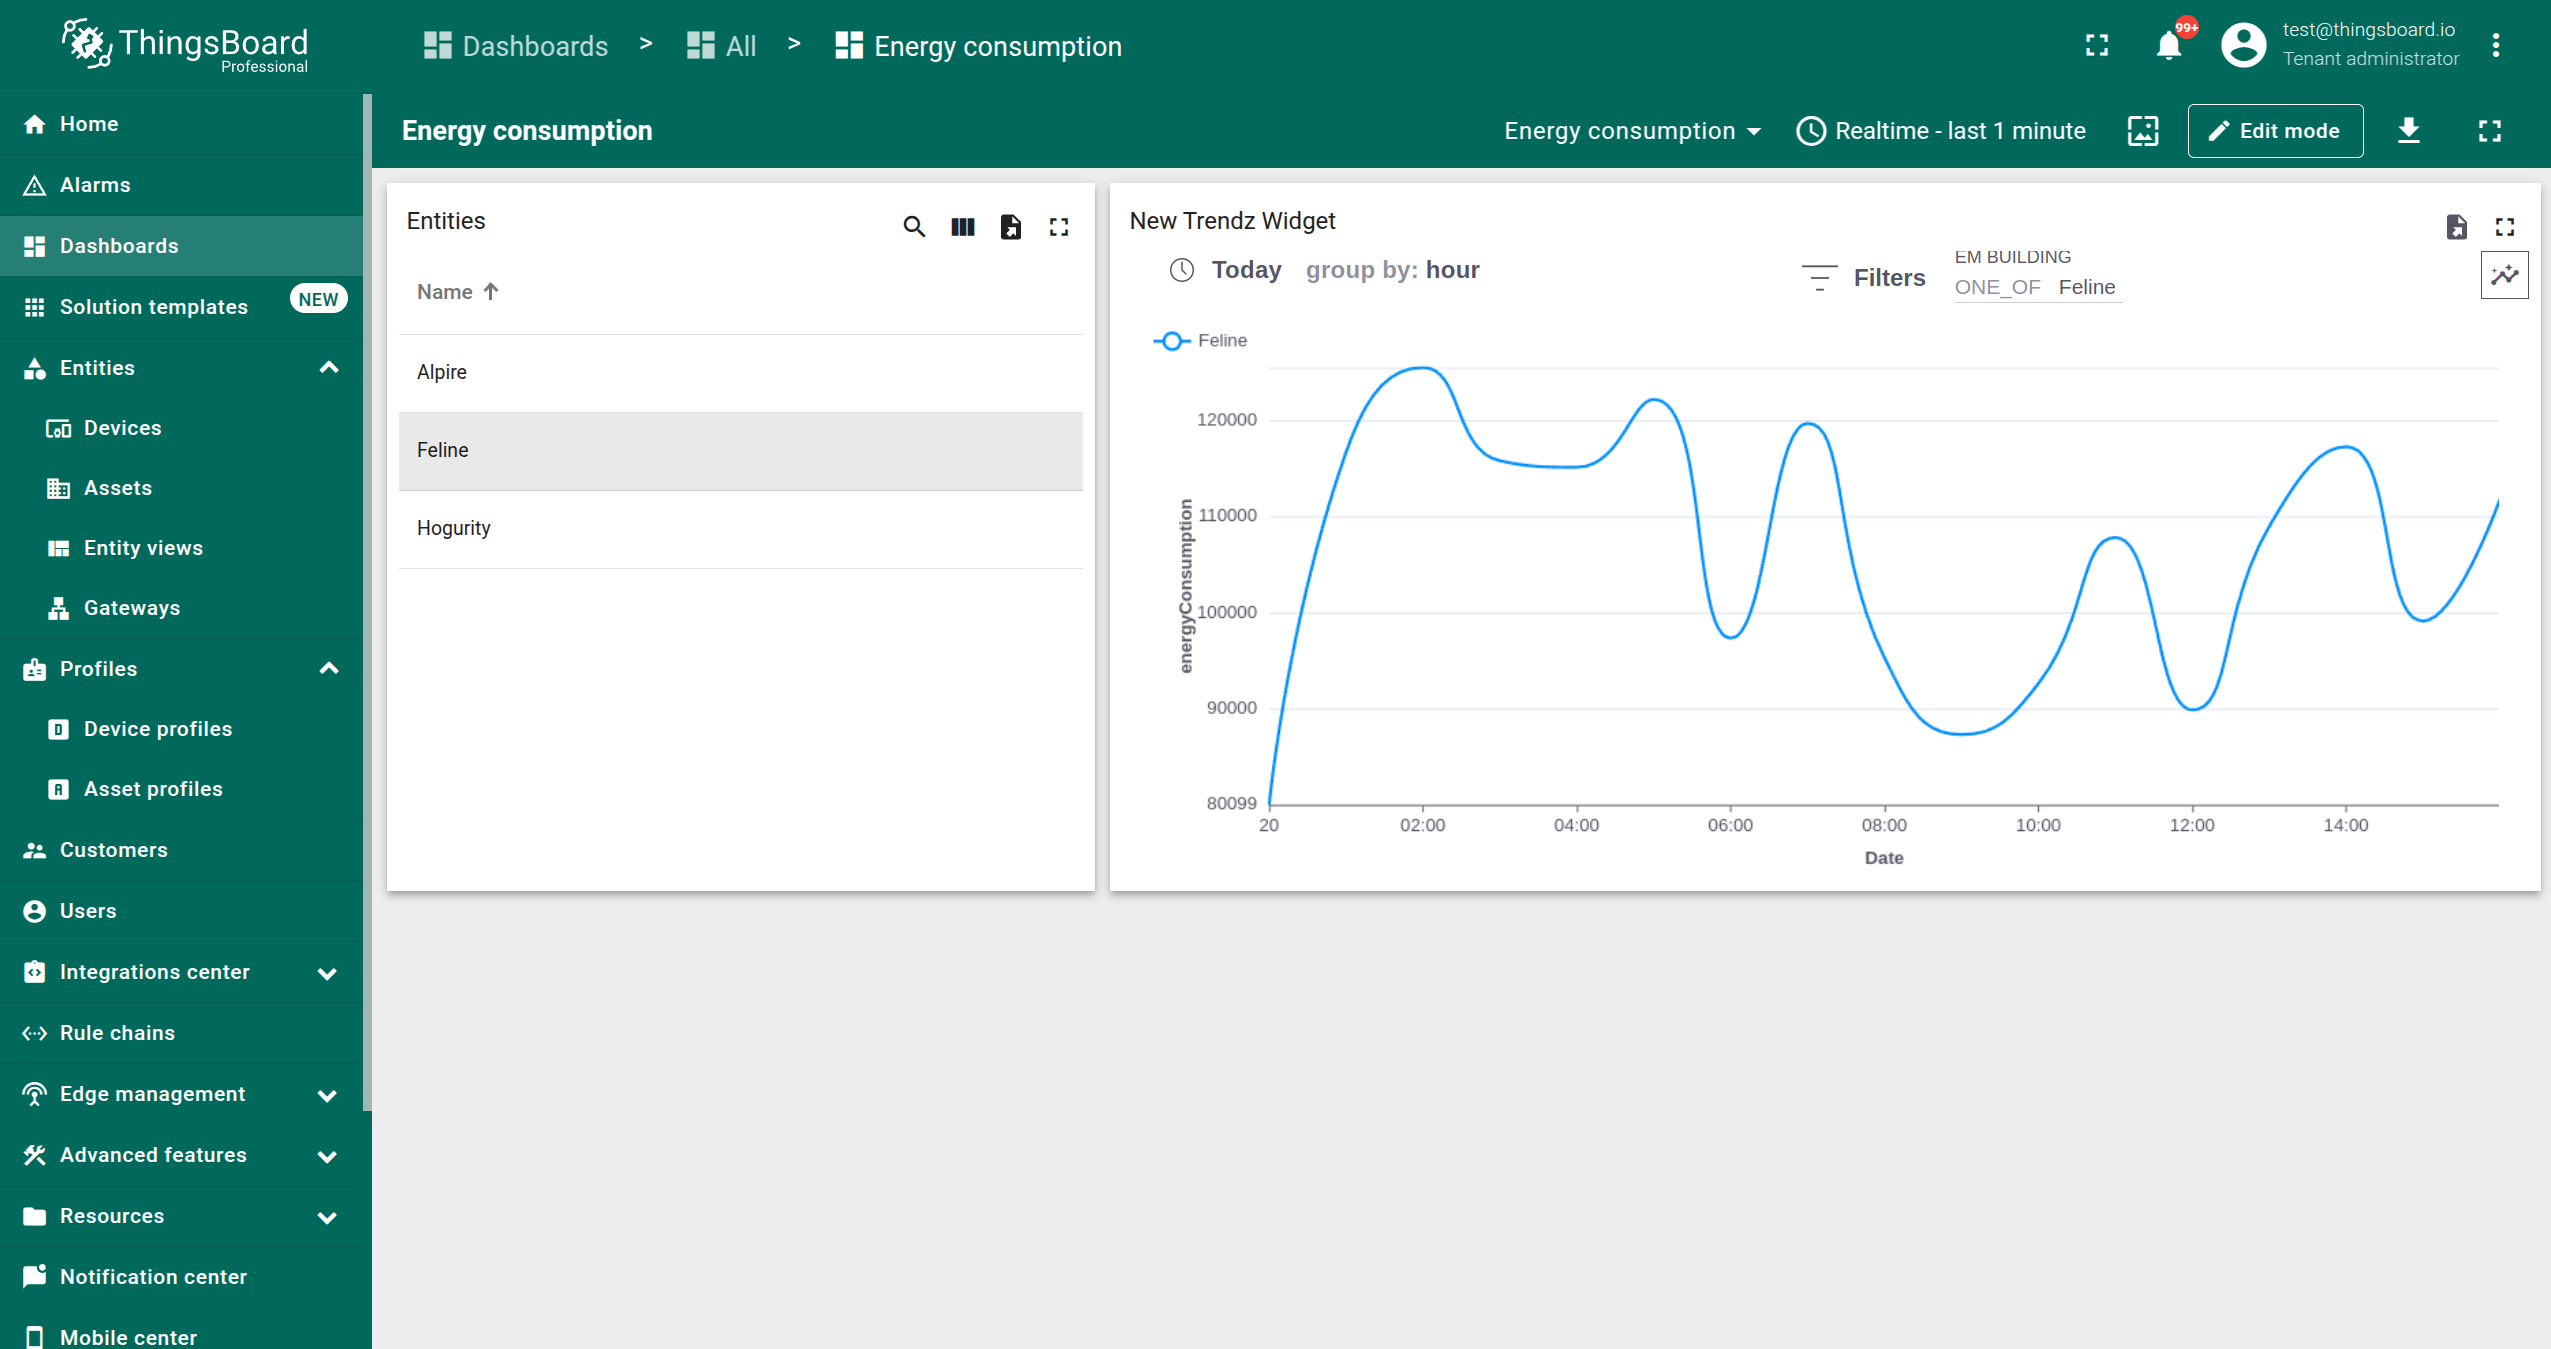
能耗,其余保持默认,点击 添加按钮 - 在 ThingsBoard 中可看到名为「能耗」的新仪表板,包含生成的别名和 Trendz 折线视图 (可通过点击表格中对应楼栋查看各楼栋的图表)
现在 ThingsBoard 中已创建新仪表板,图表已嵌入并支持按楼栋筛选。
关于分享视图的更多说明见此处。

步骤 4. 计算新指标
接下来将创建一张包含所有楼栋与公寓的表格,并计算各公寓单位面积的用电量和热耗。
创建字段计算
首先创建字段计算,该字段可在多个视图中复用。
-
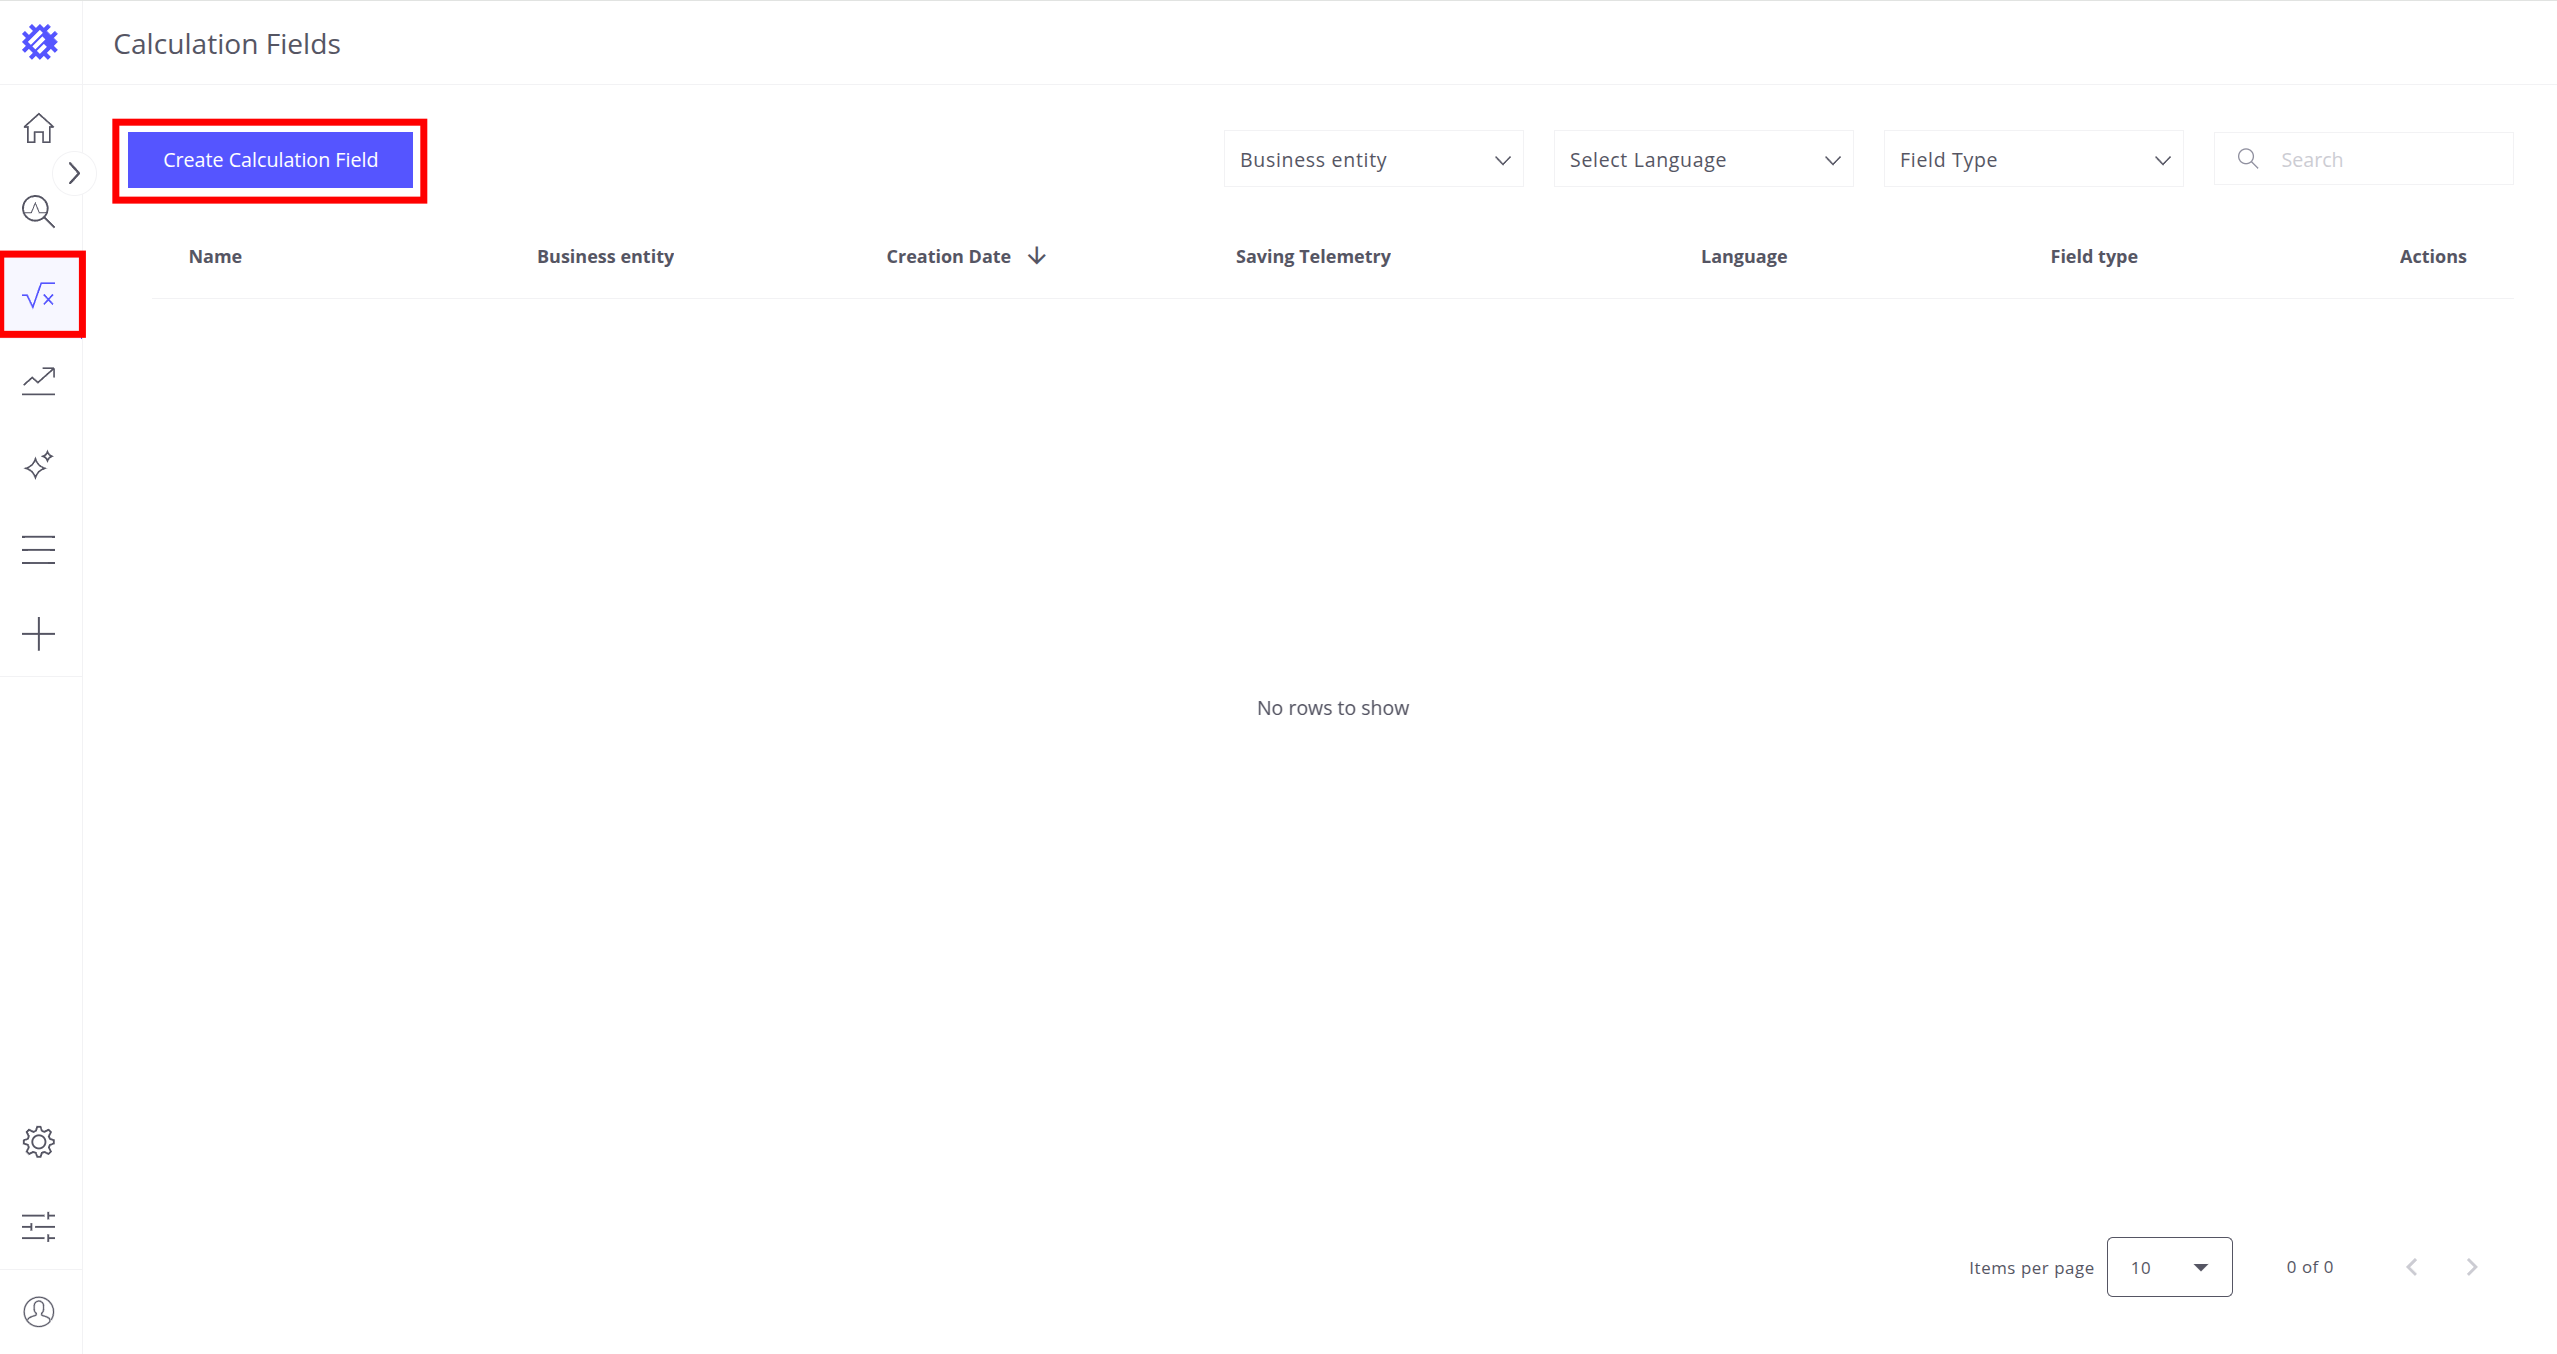
点击左侧面板的计算器图标,进入 字段计算页面
- 点击 创建字段计算按钮
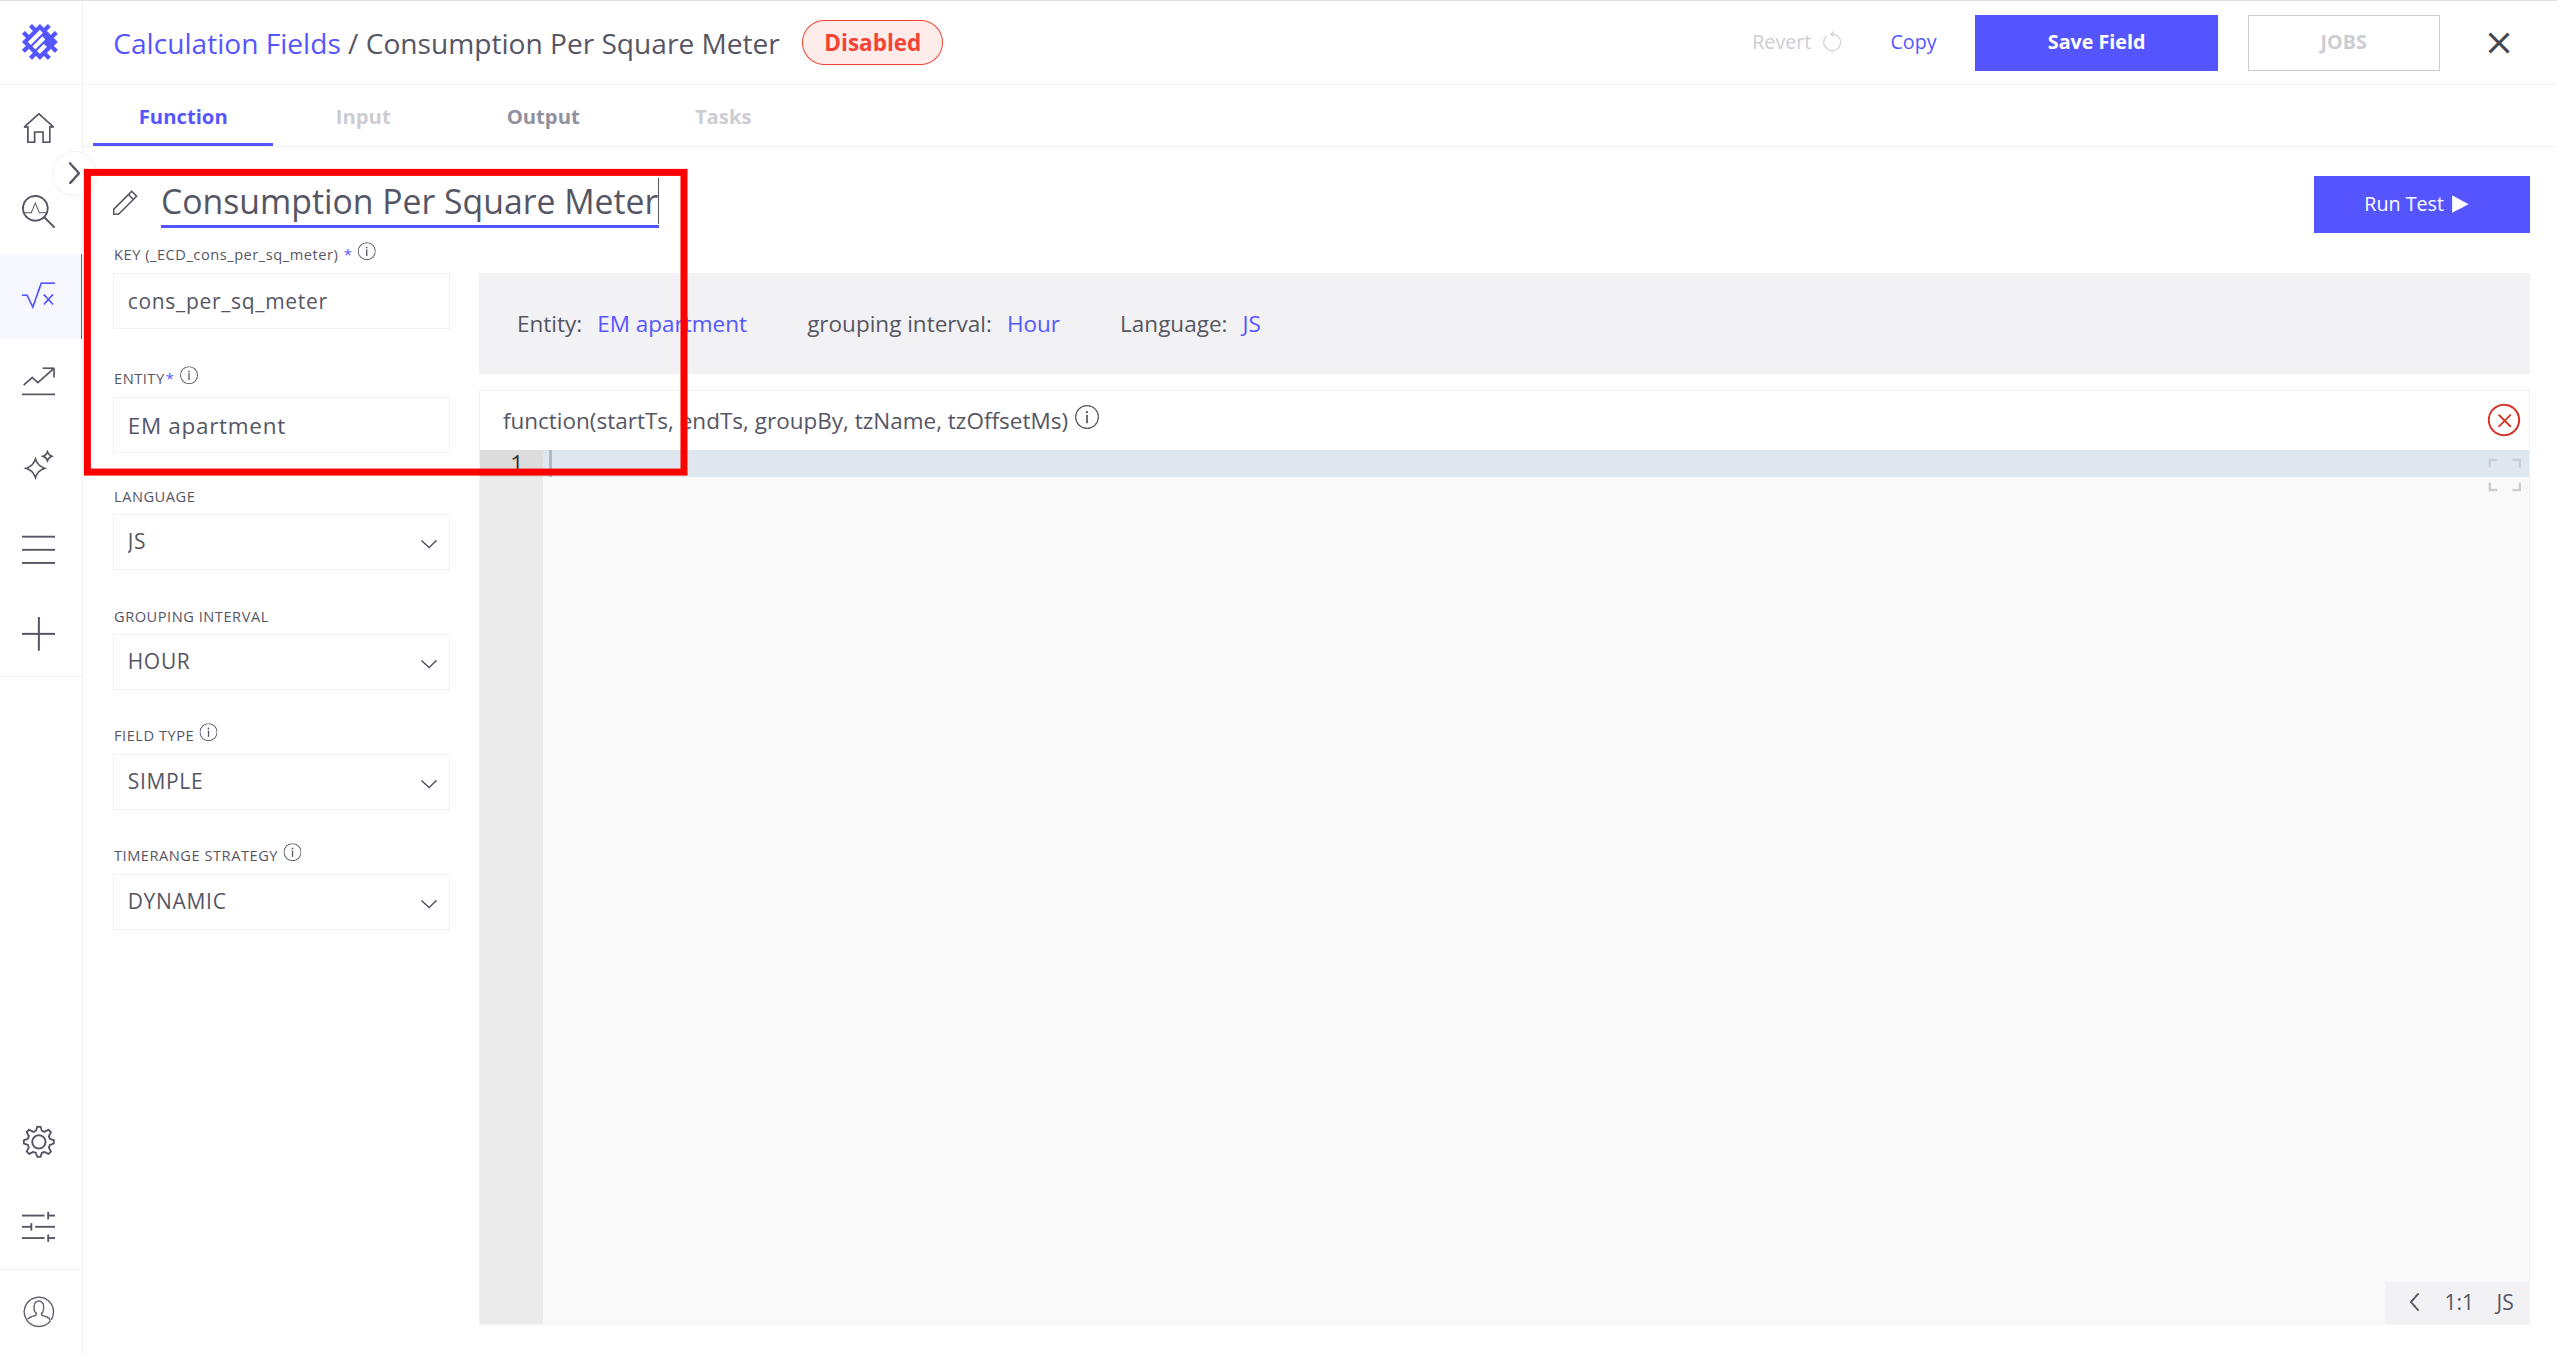
- 将名称设为
单位面积耗能 - 将键设为
cons_per_sq_meter - 将实体设为
EM apartment -
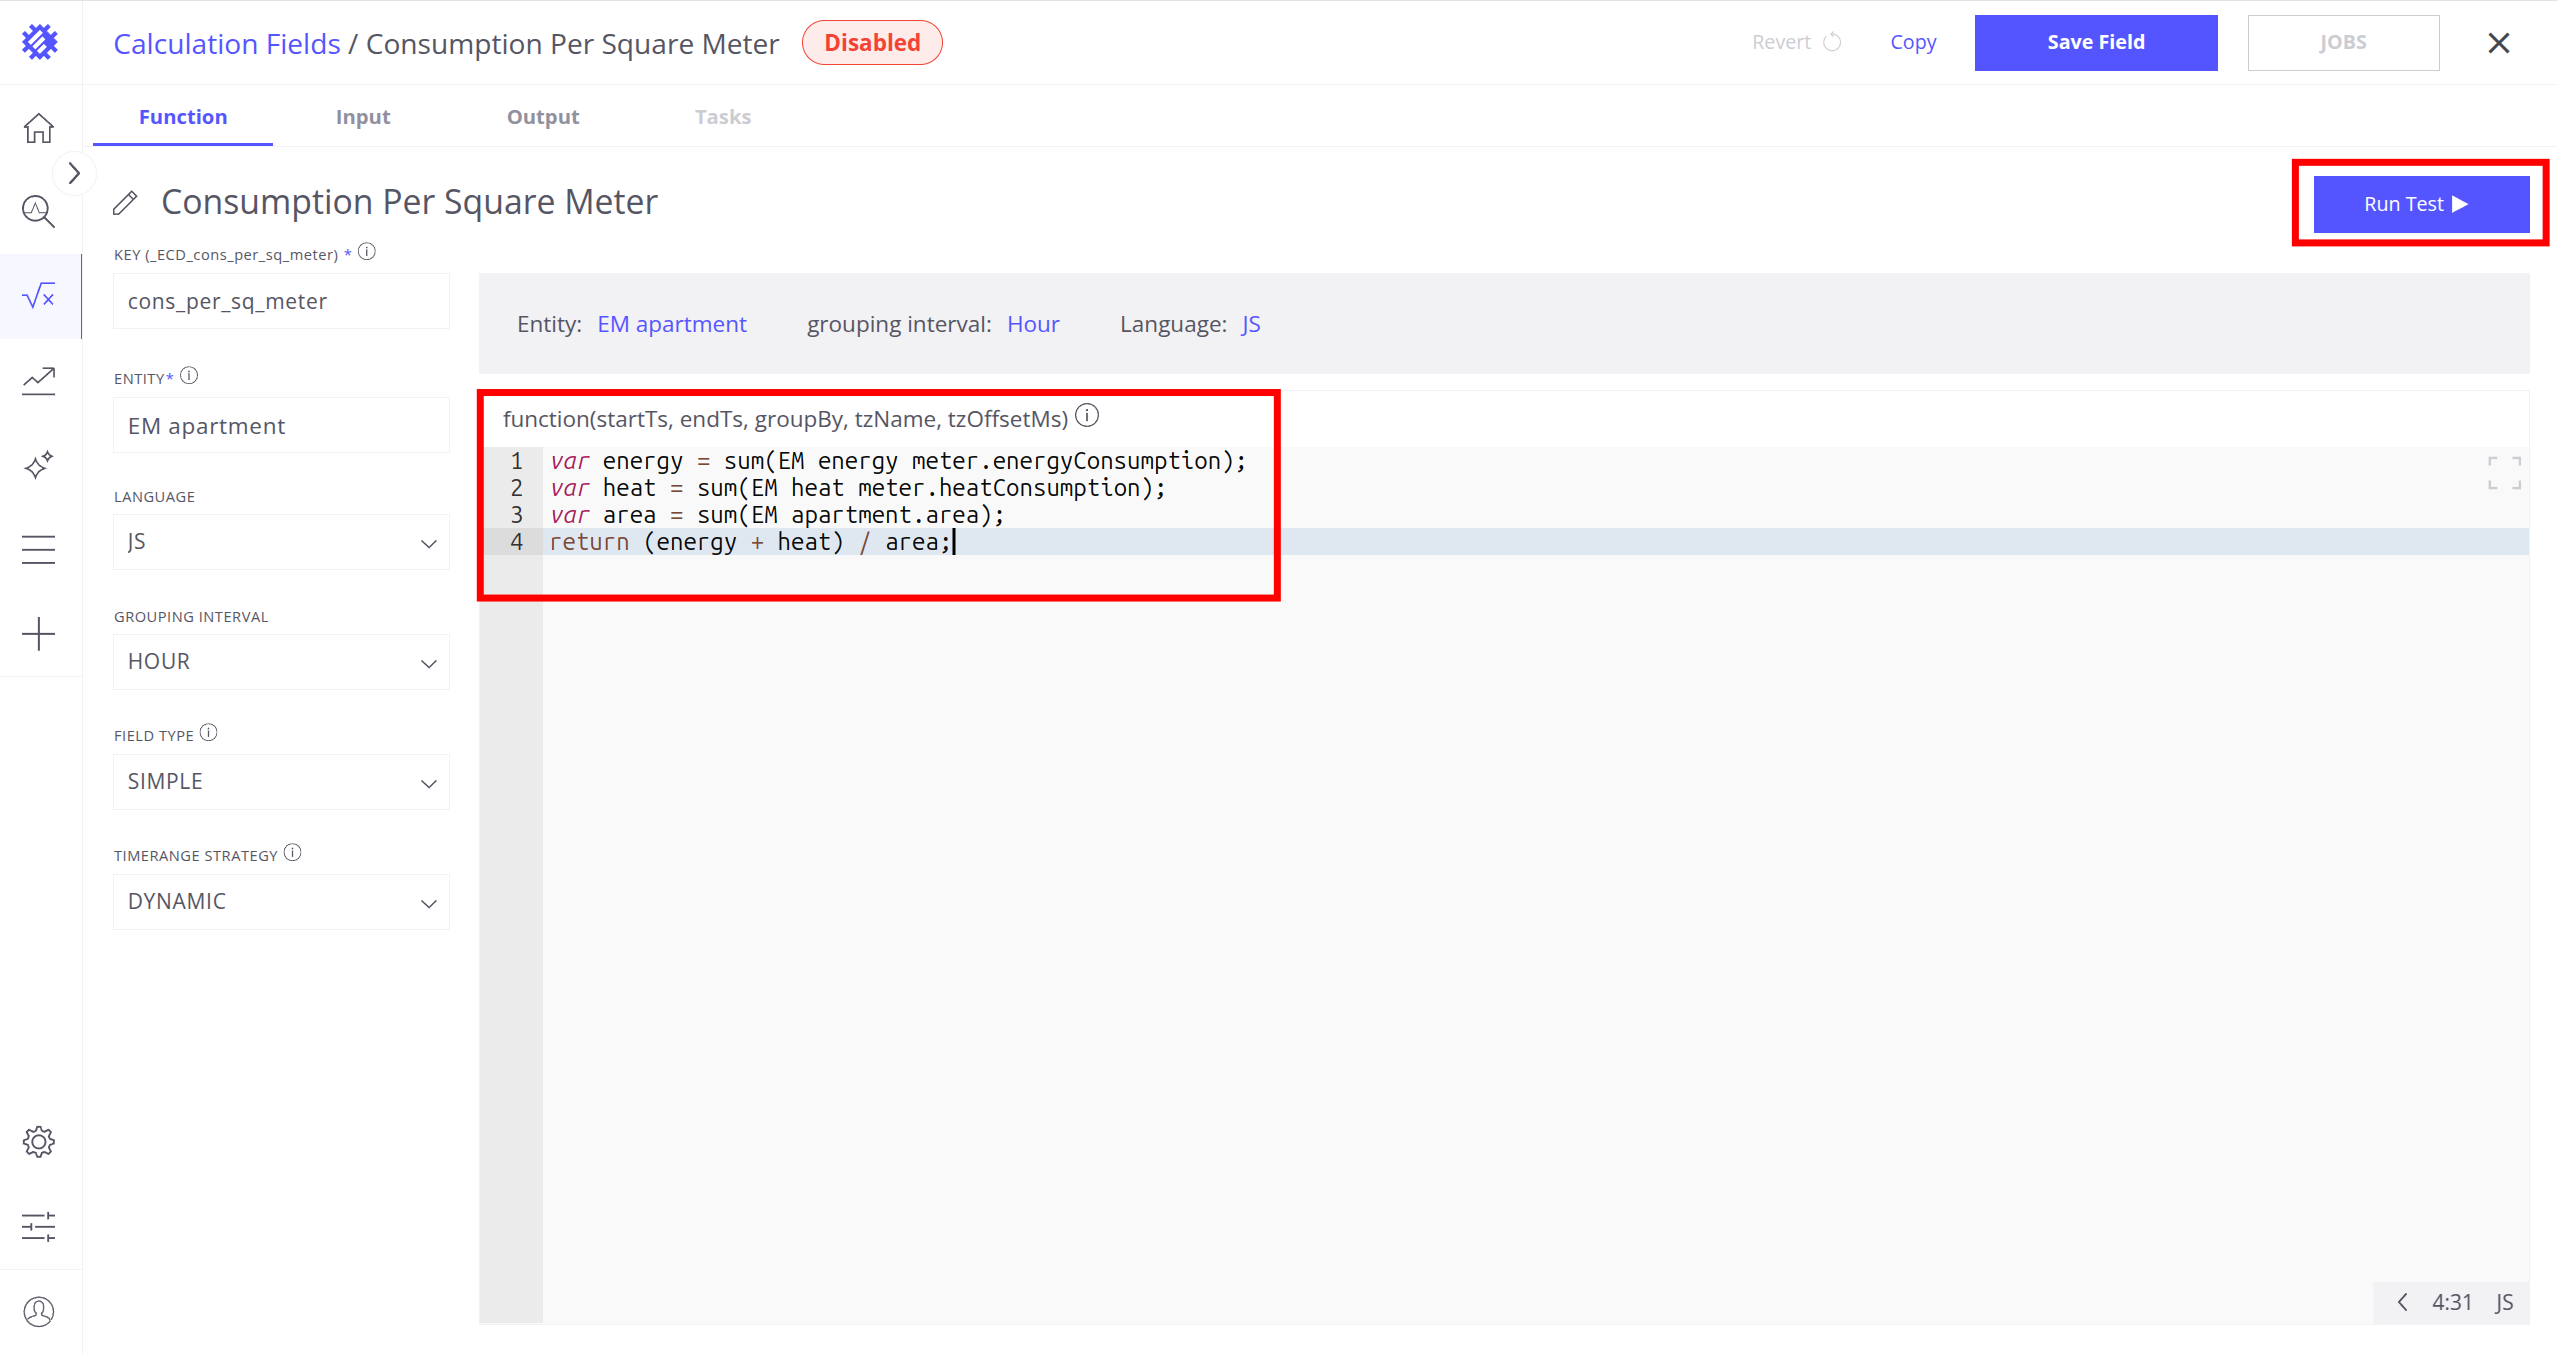
将以下代码粘贴到代码编辑器中:
1
2
3
4
var energy = sum(EM energy meter.energyConsumption);
var heat = sum(EM heat meter.heatConsumption);
var area = sum(EM apartment.area);
return (energy + heat) / area;
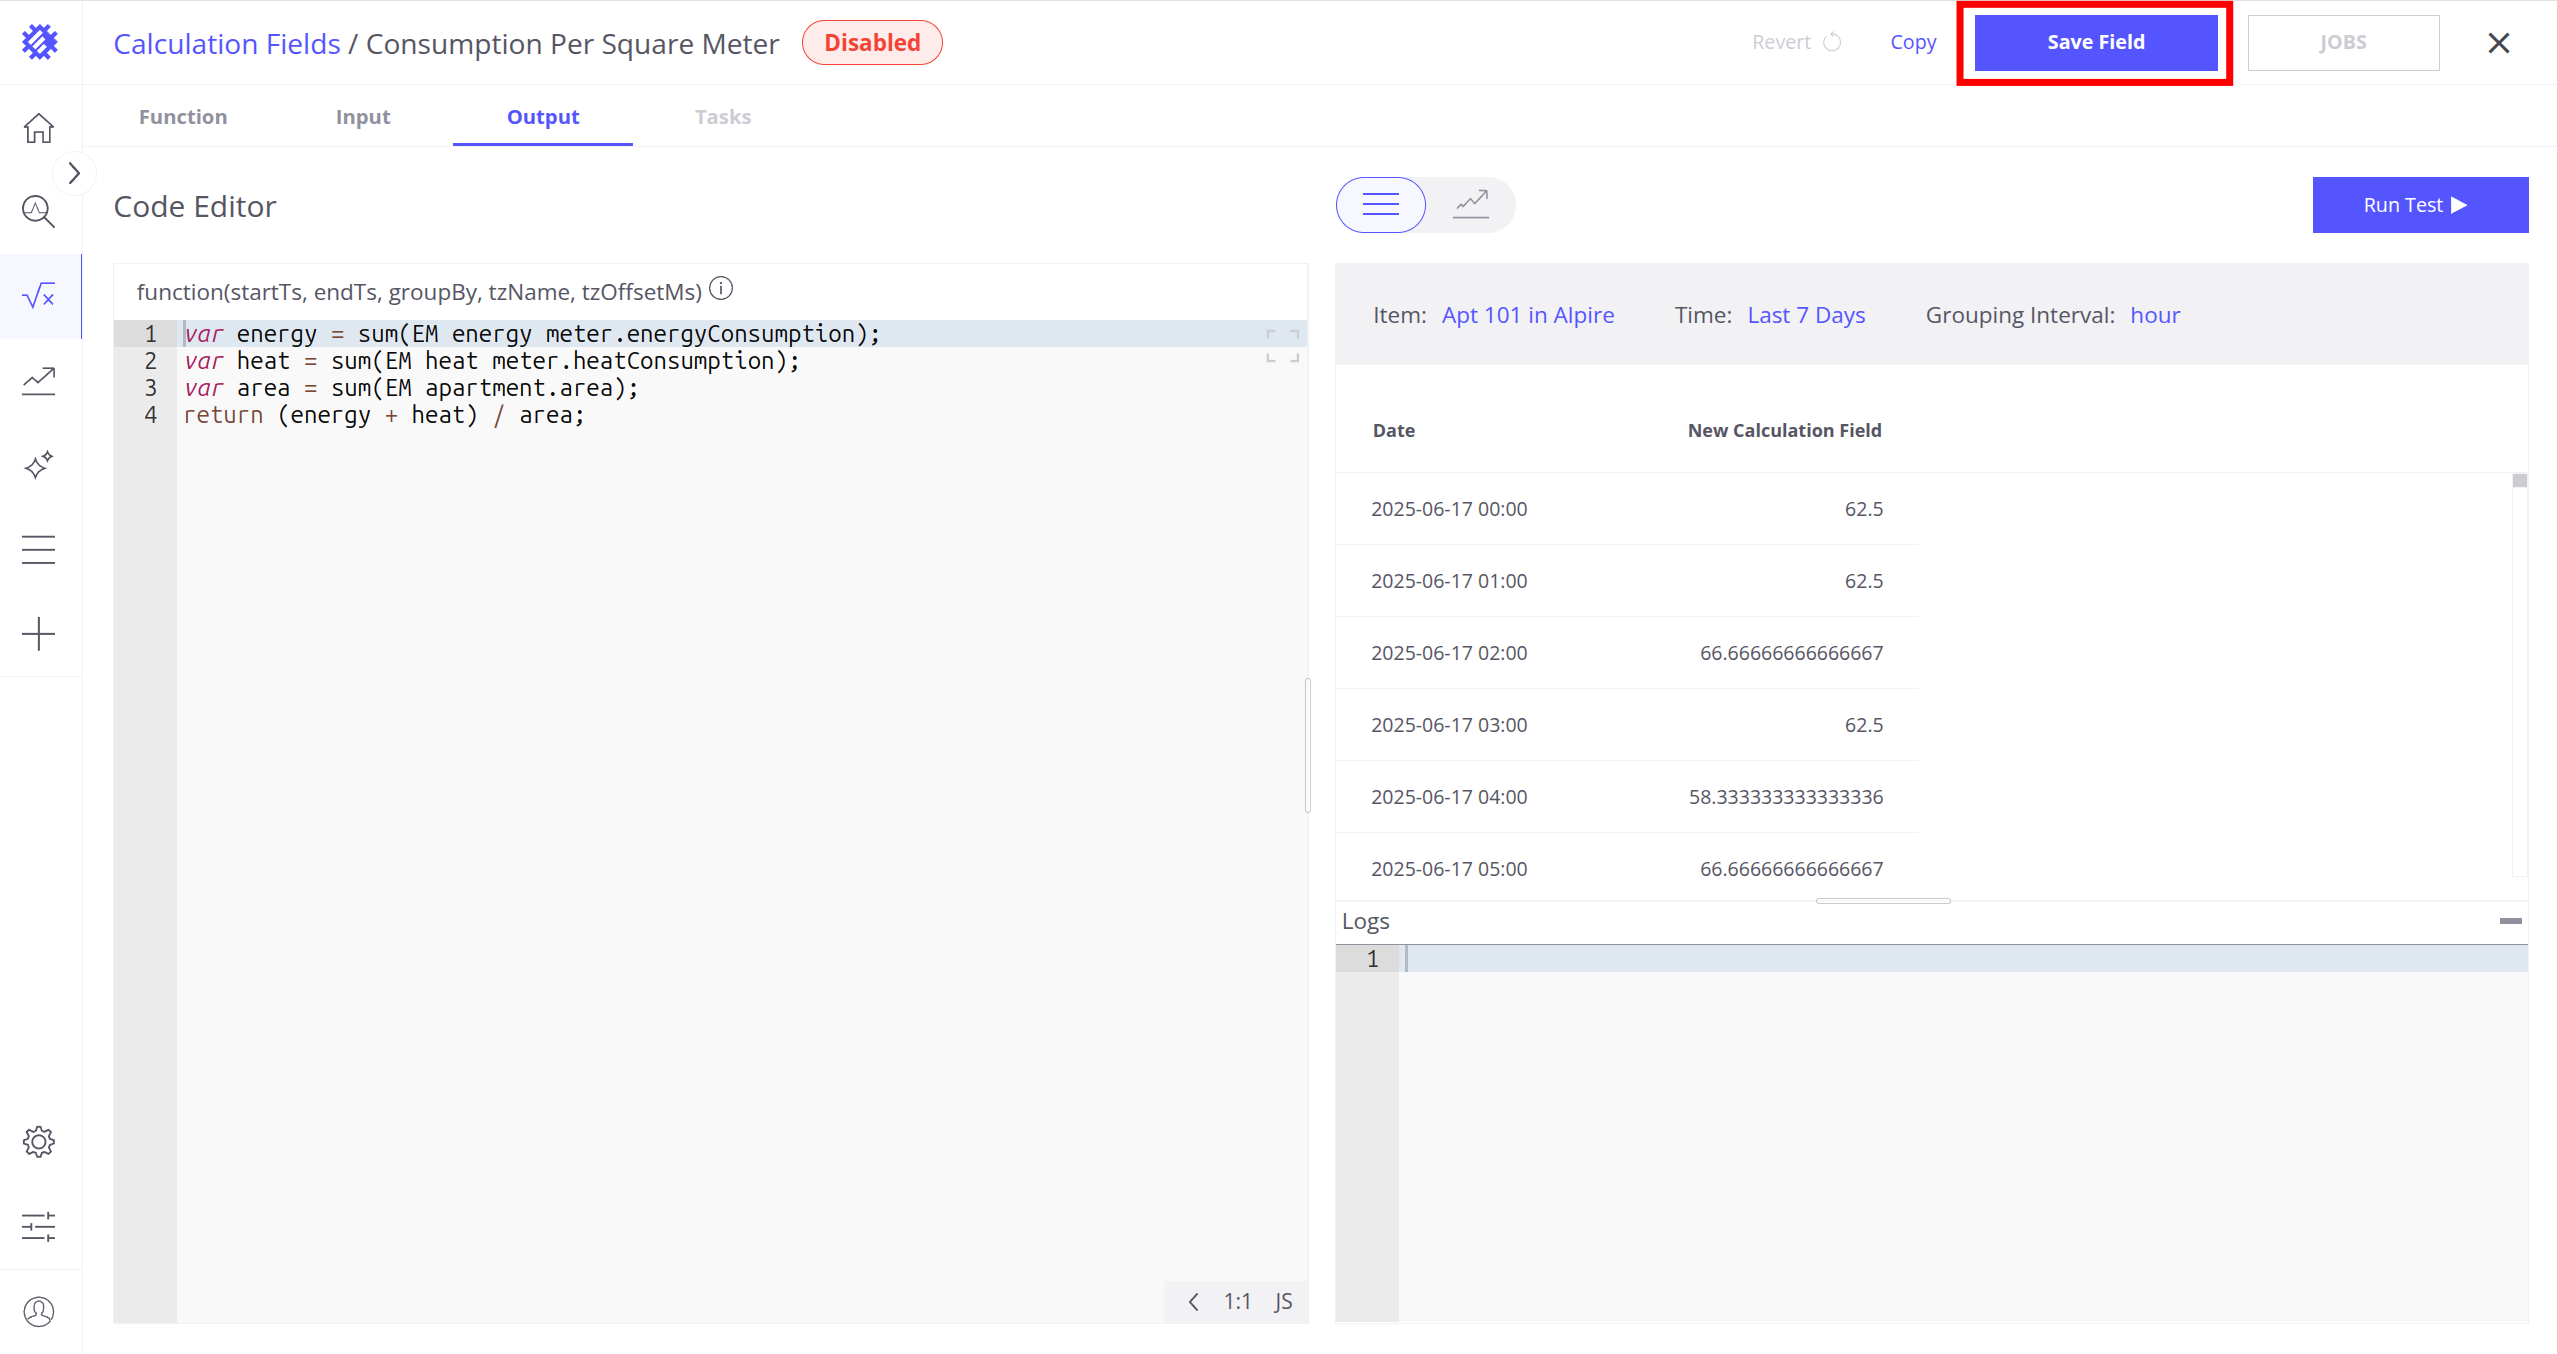
- 点击 运行测试 验证计算
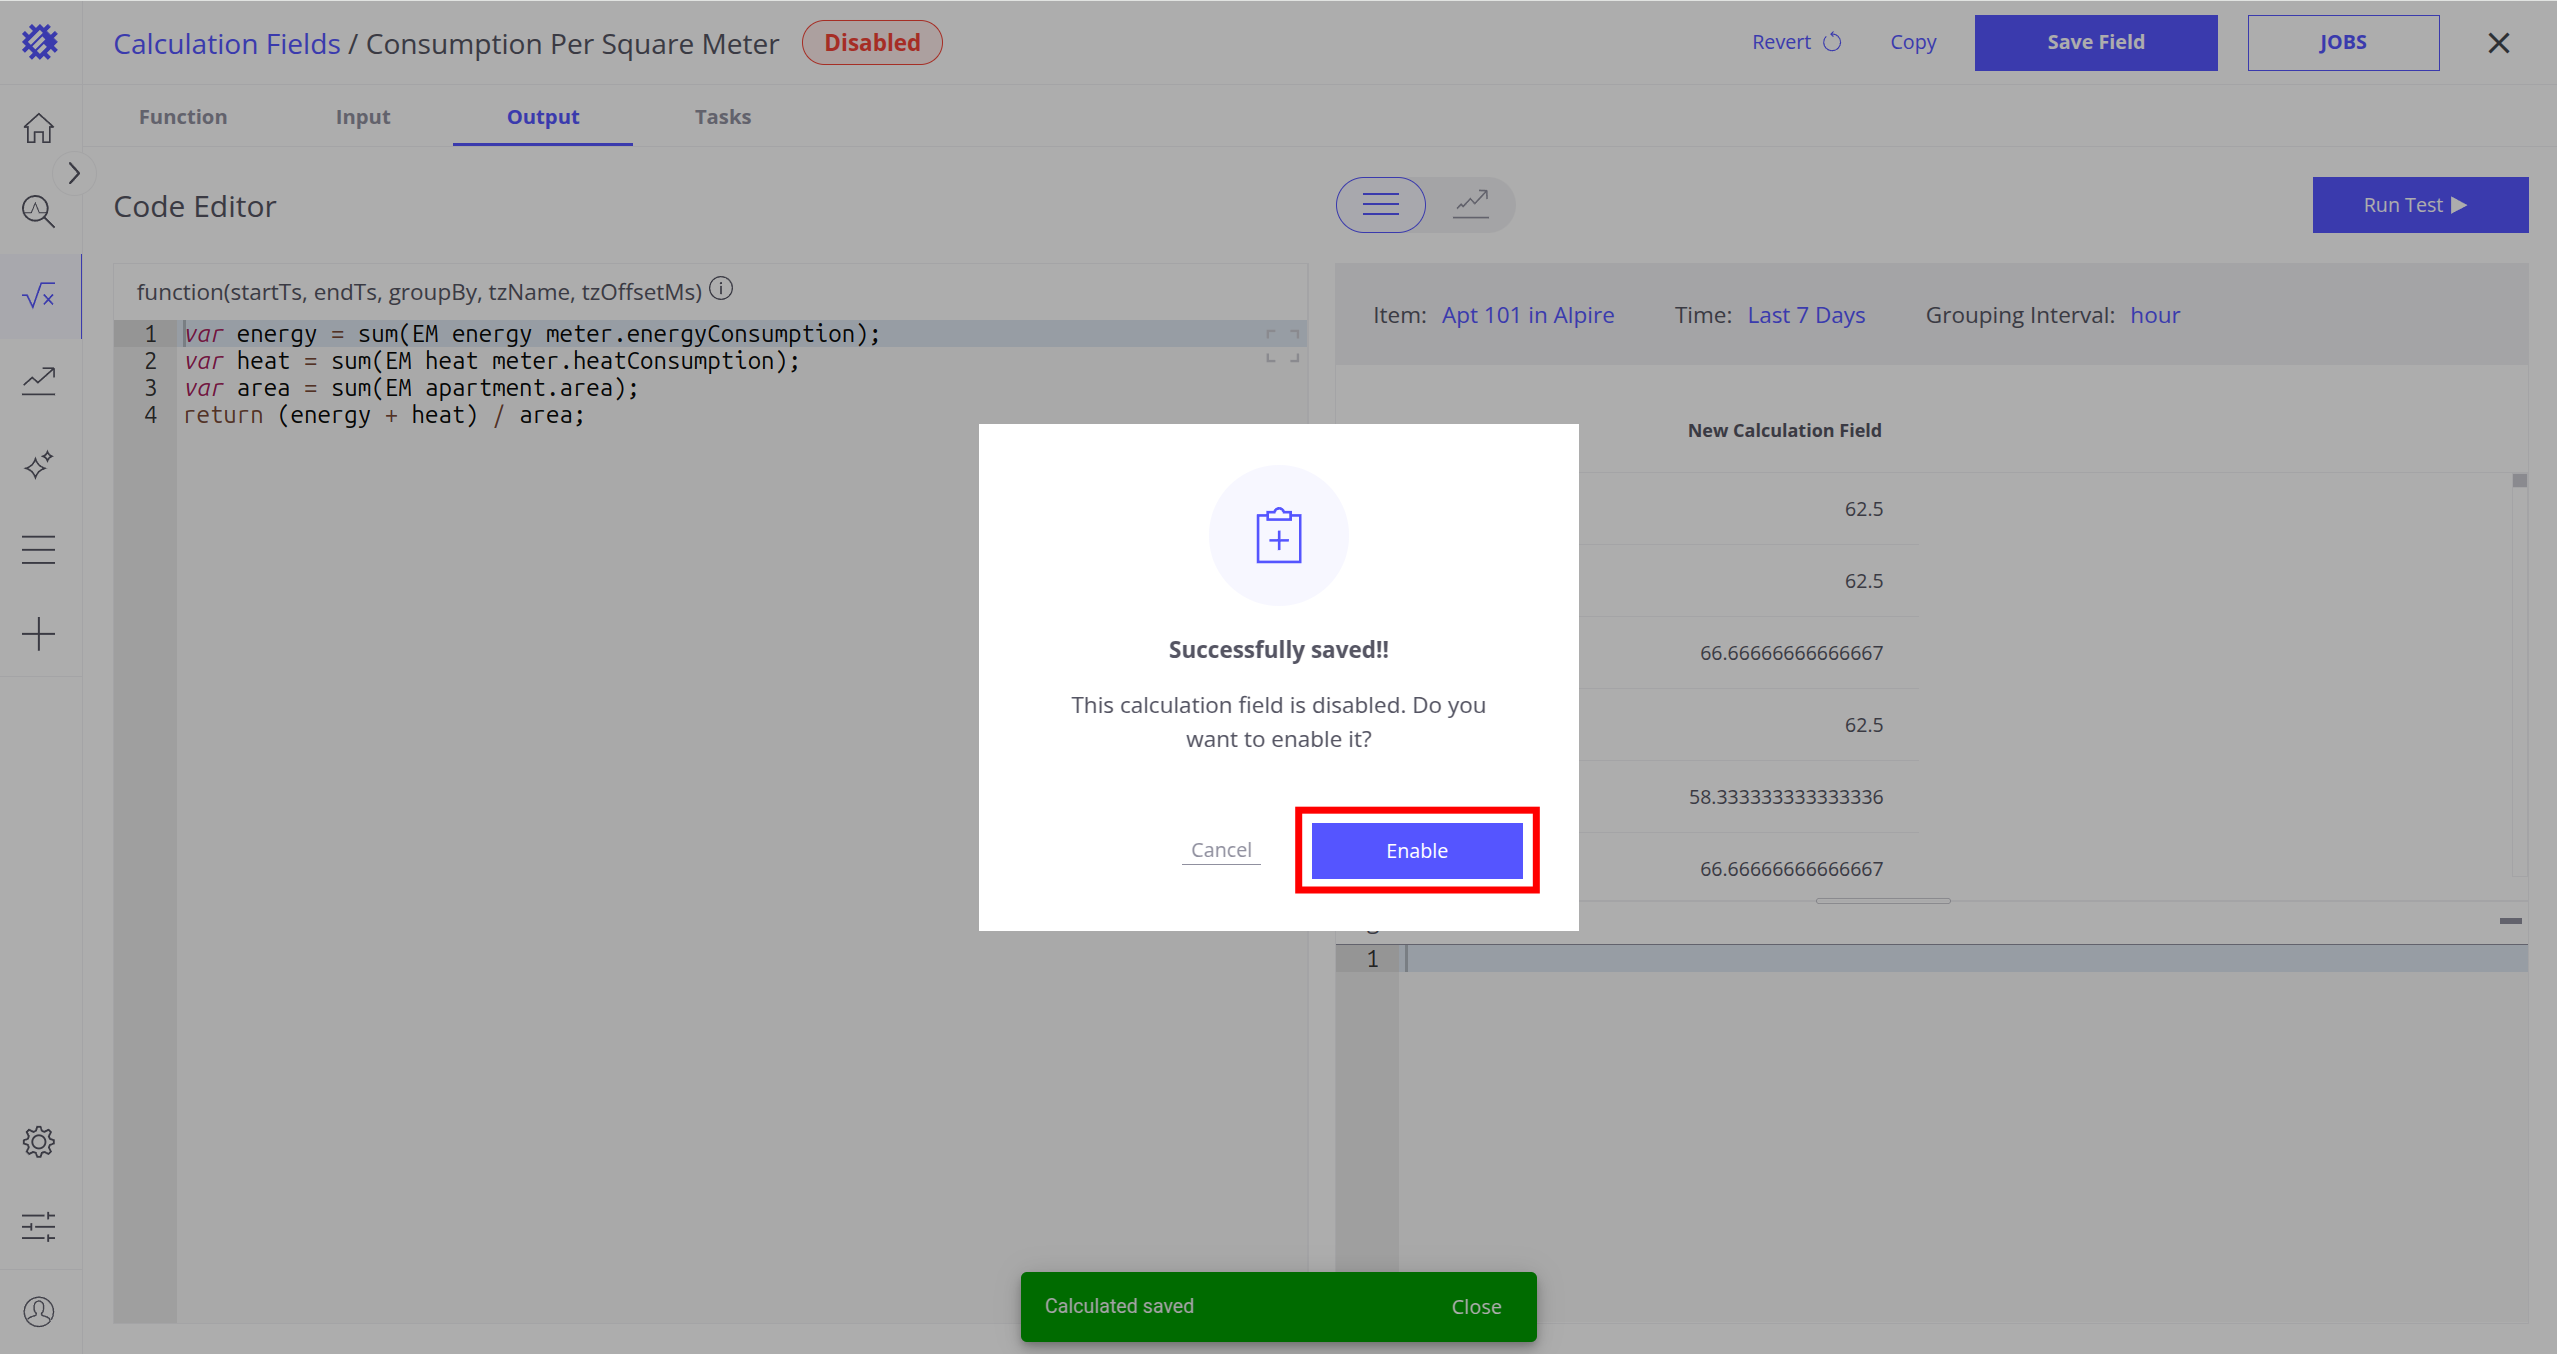
- 点击 保存字段 进行保存
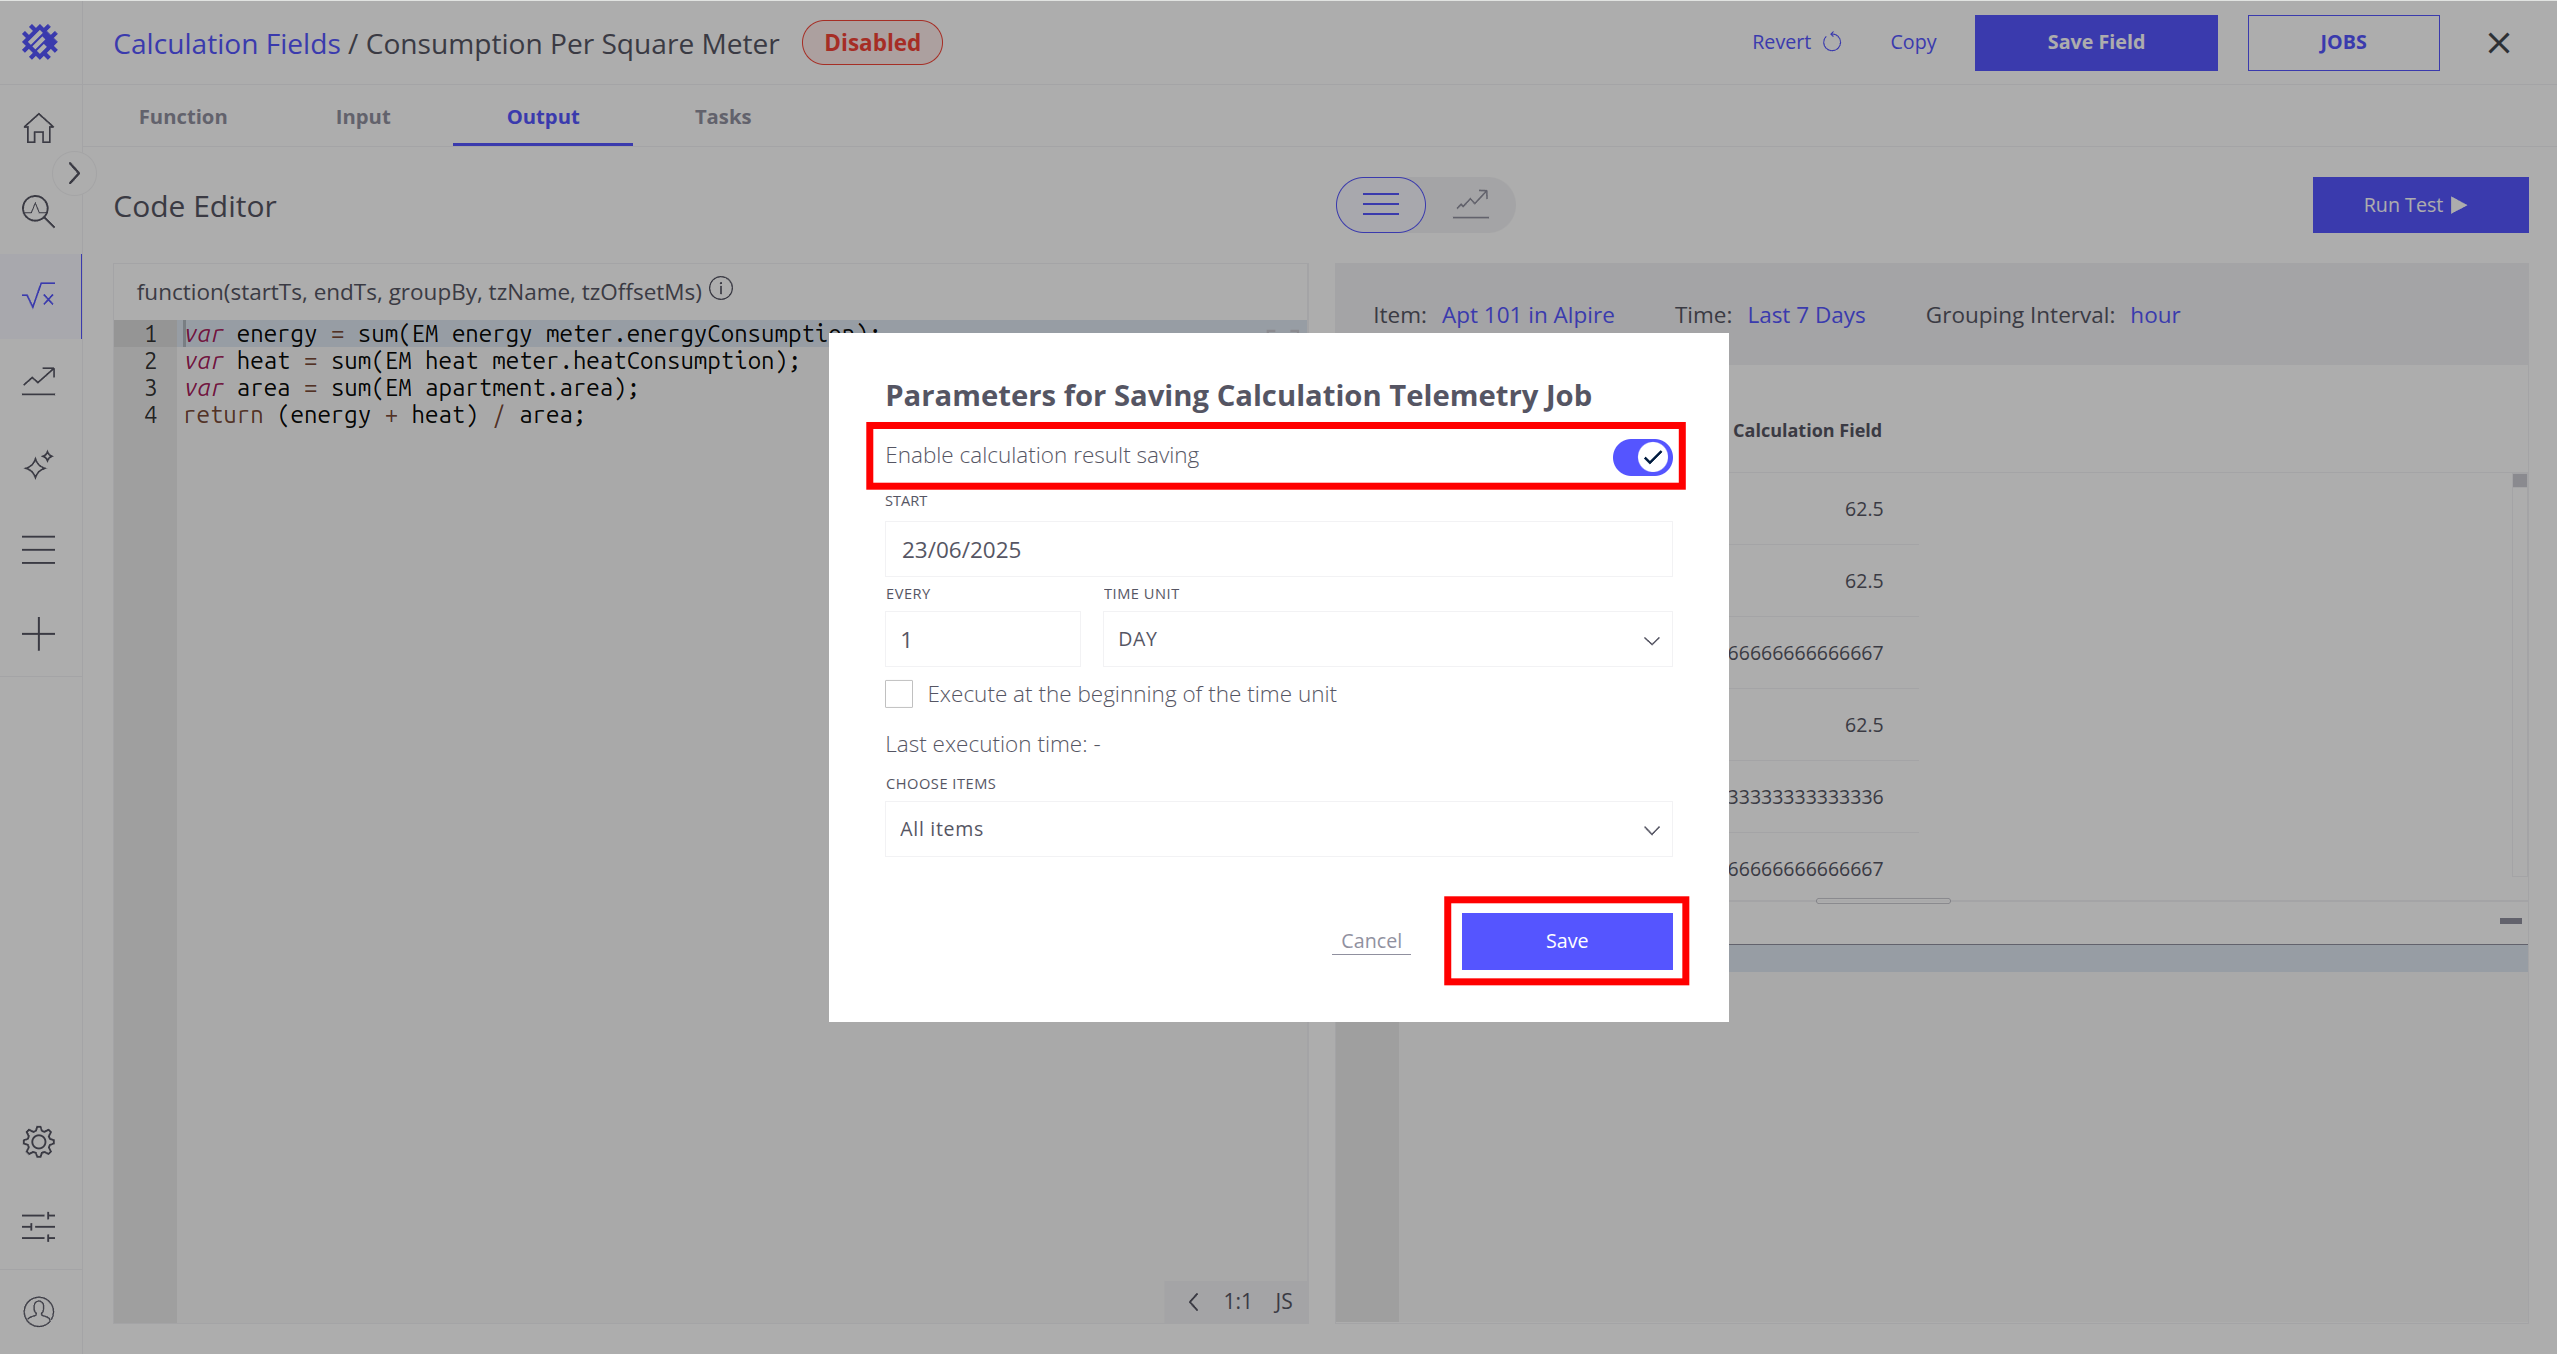
- 在弹窗中点击 启用
- 启用「计算结果保存」并点击 保存按钮 (其余属性可保持默认)
字段计算已就绪。关于字段计算的更多说明见此处。
在视图中使用字段计算
接下来在新建视图中使用已创建的字段计算。
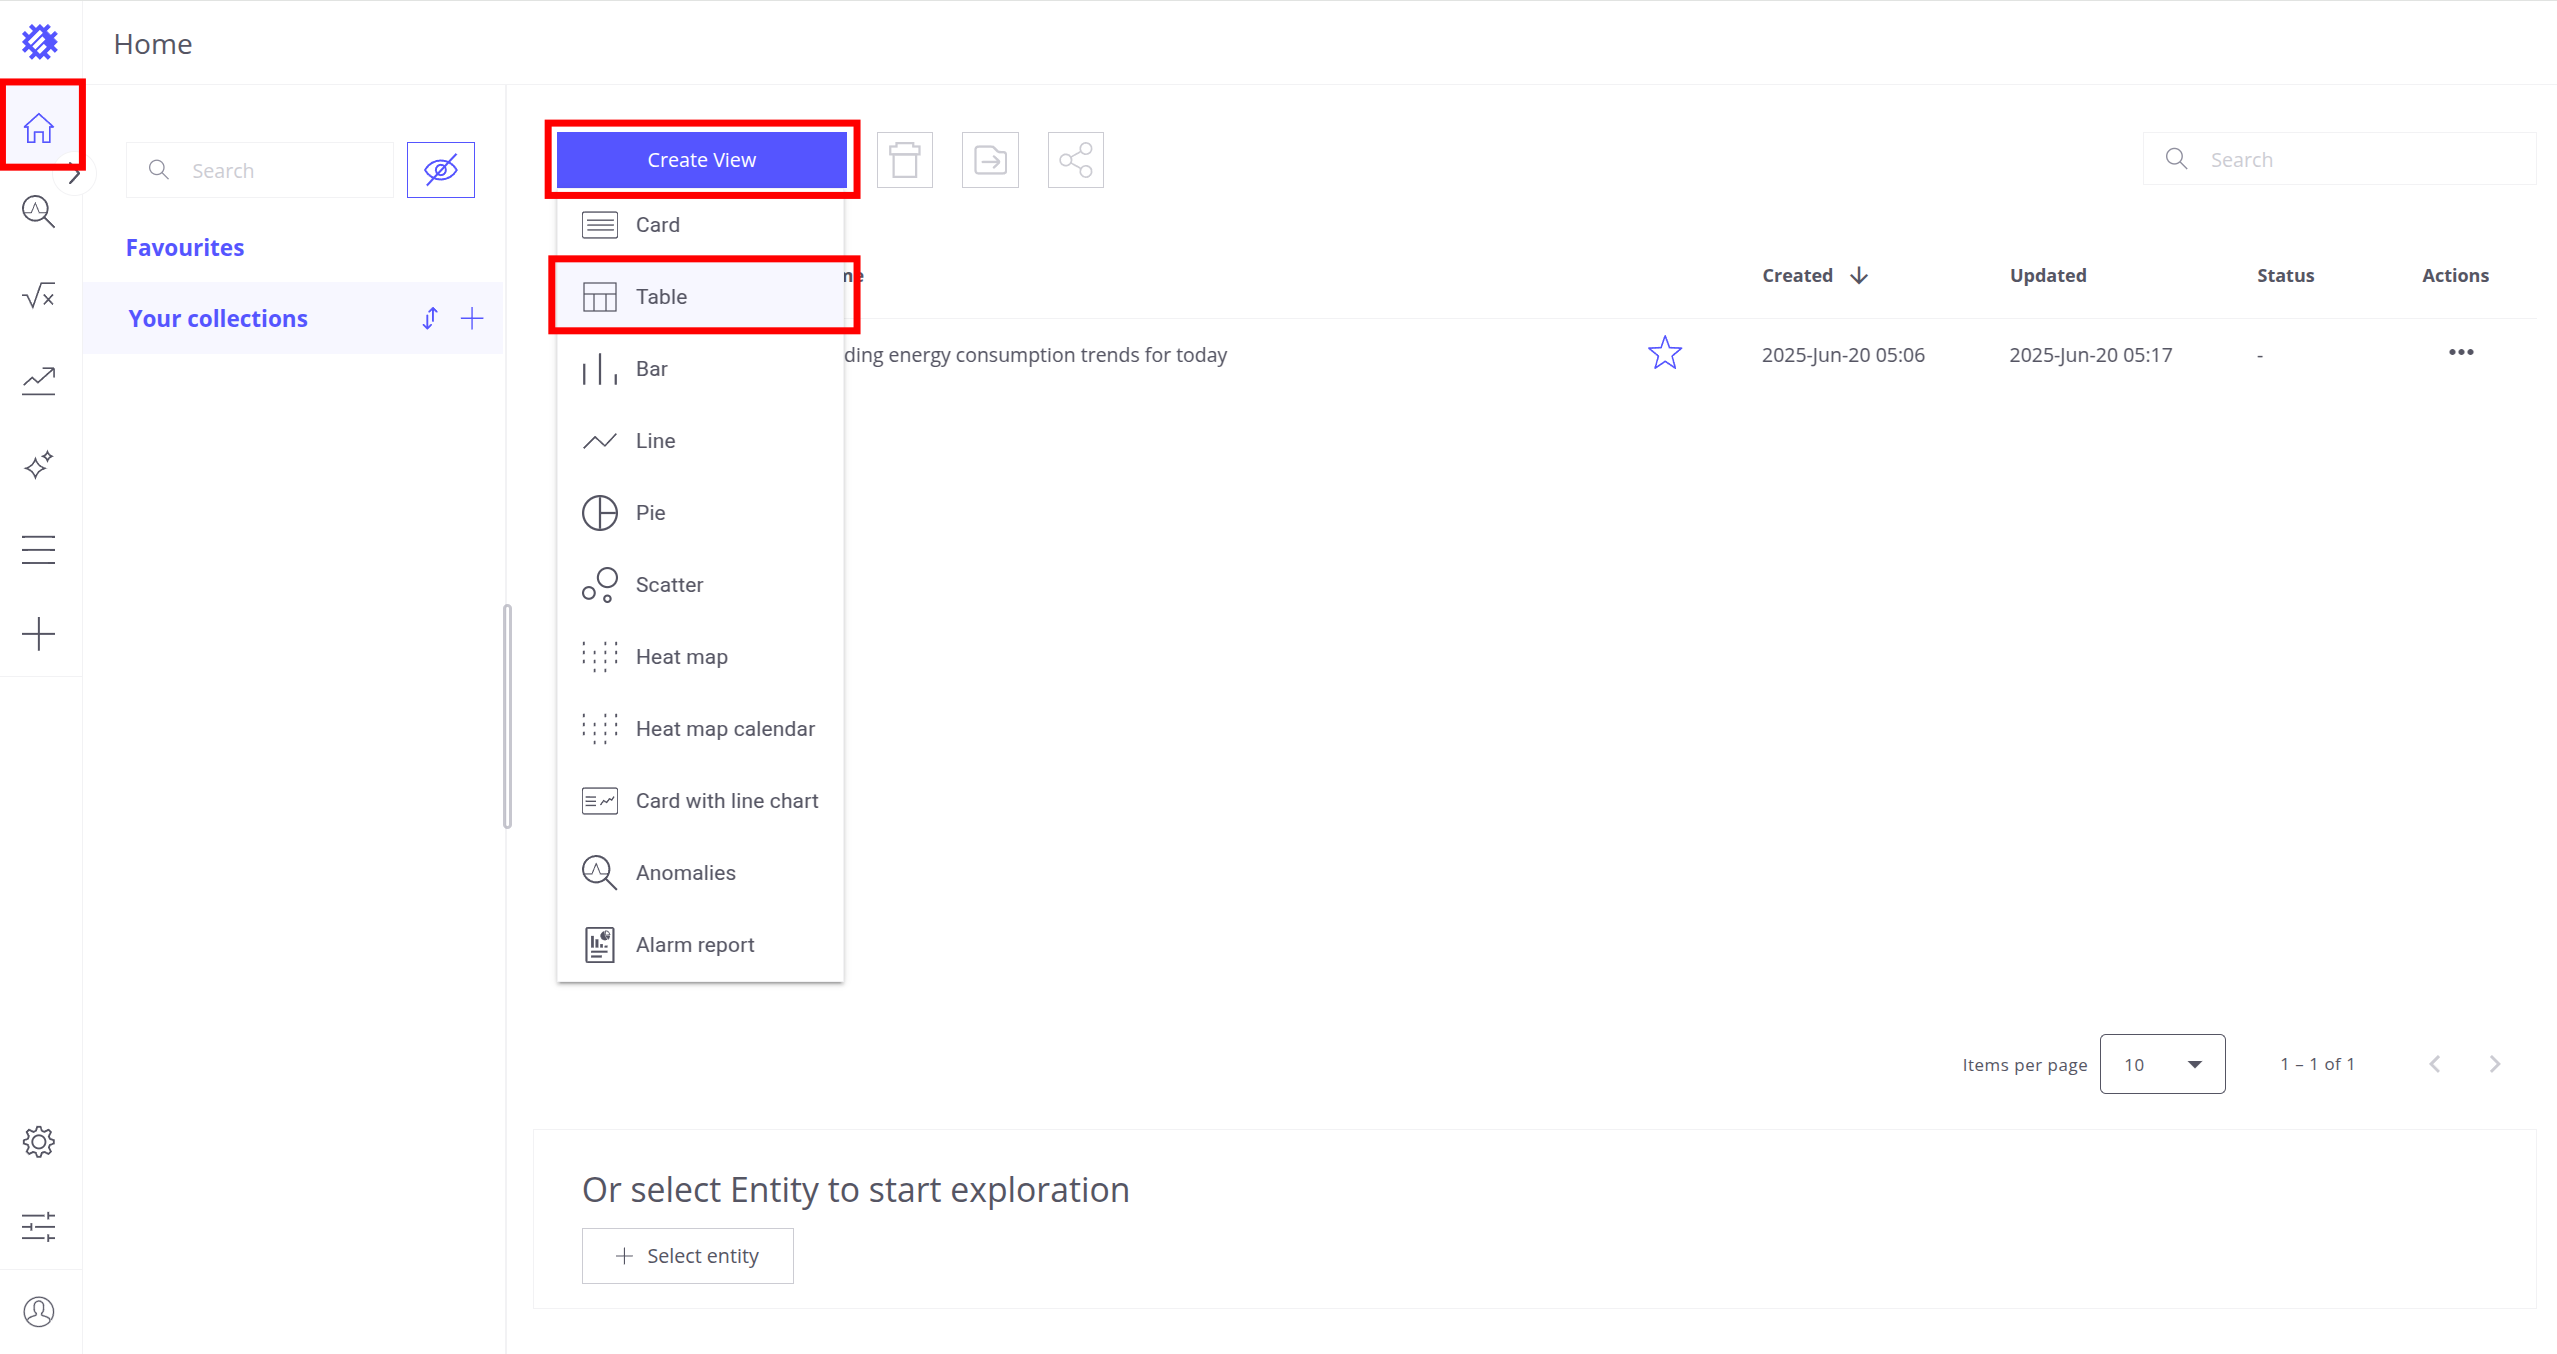
- 在首页点击 创建视图按钮,选择 表格
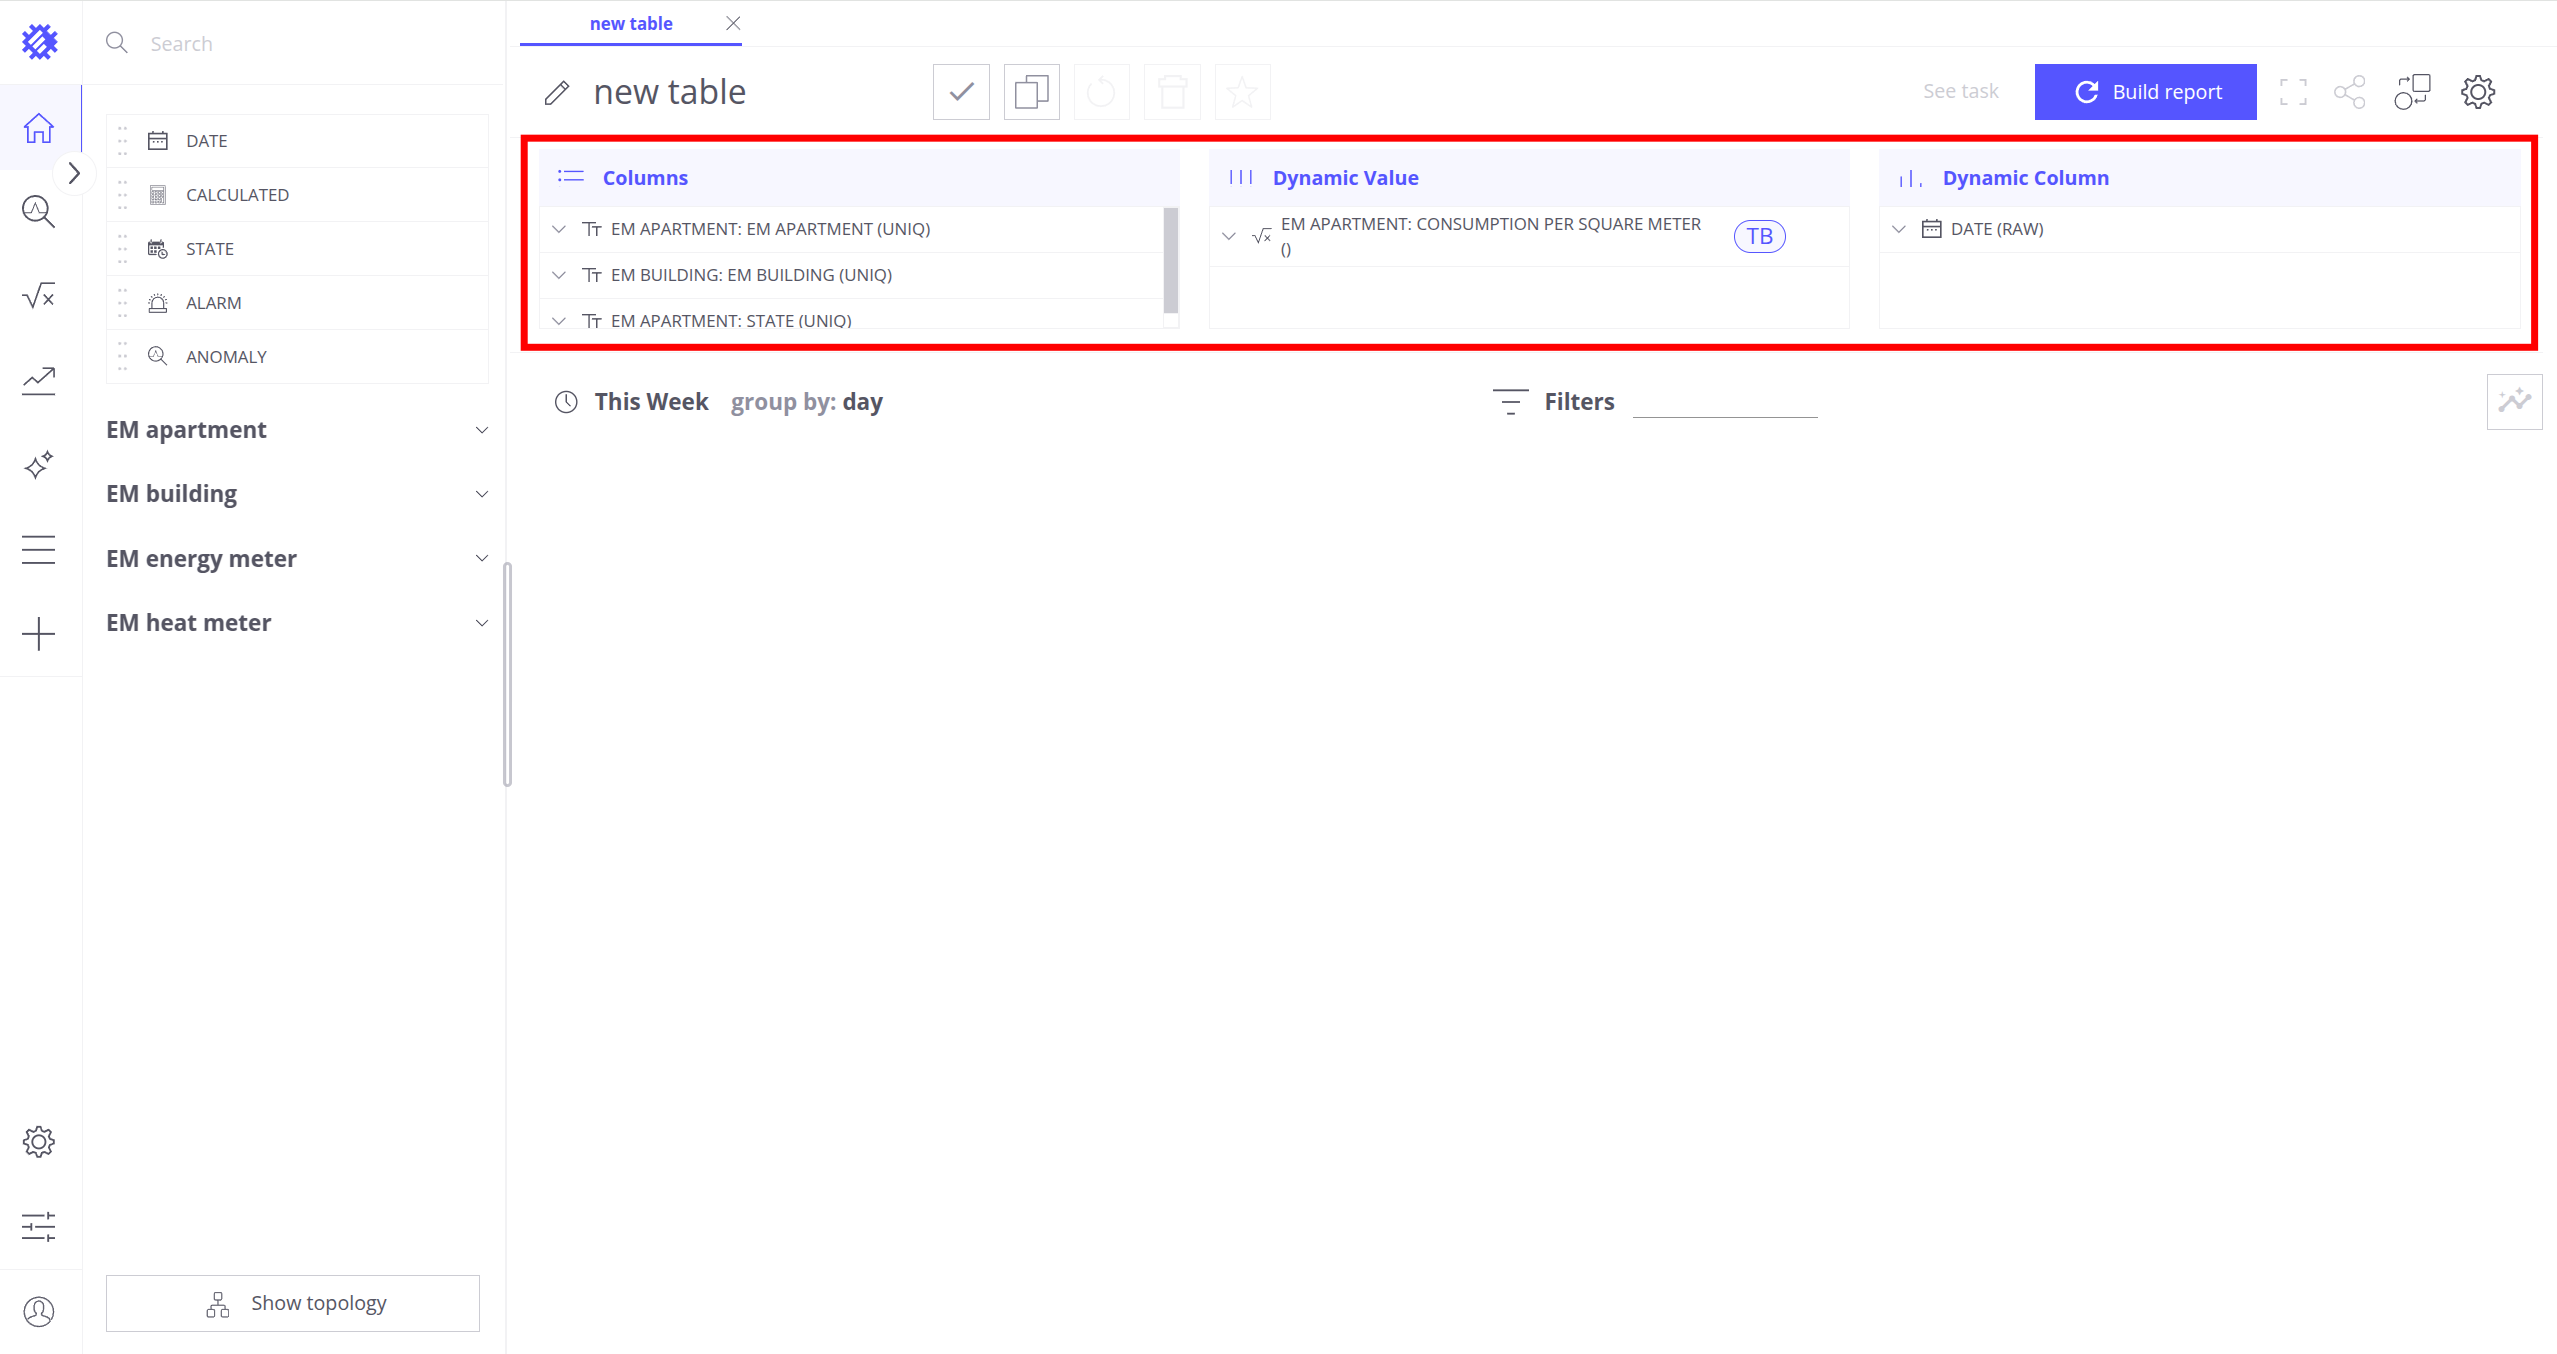
为各区域添加所需字段:
- 在 列区域添加:
EM apartment.EM apartmentEM building.EM buildingEM apartment.state
- 在 动态值区域添加:
EM apartment.单位面积耗能(启用字段计算后该字段会显示)
- 在 动态列区域添加:
Date (RAW)
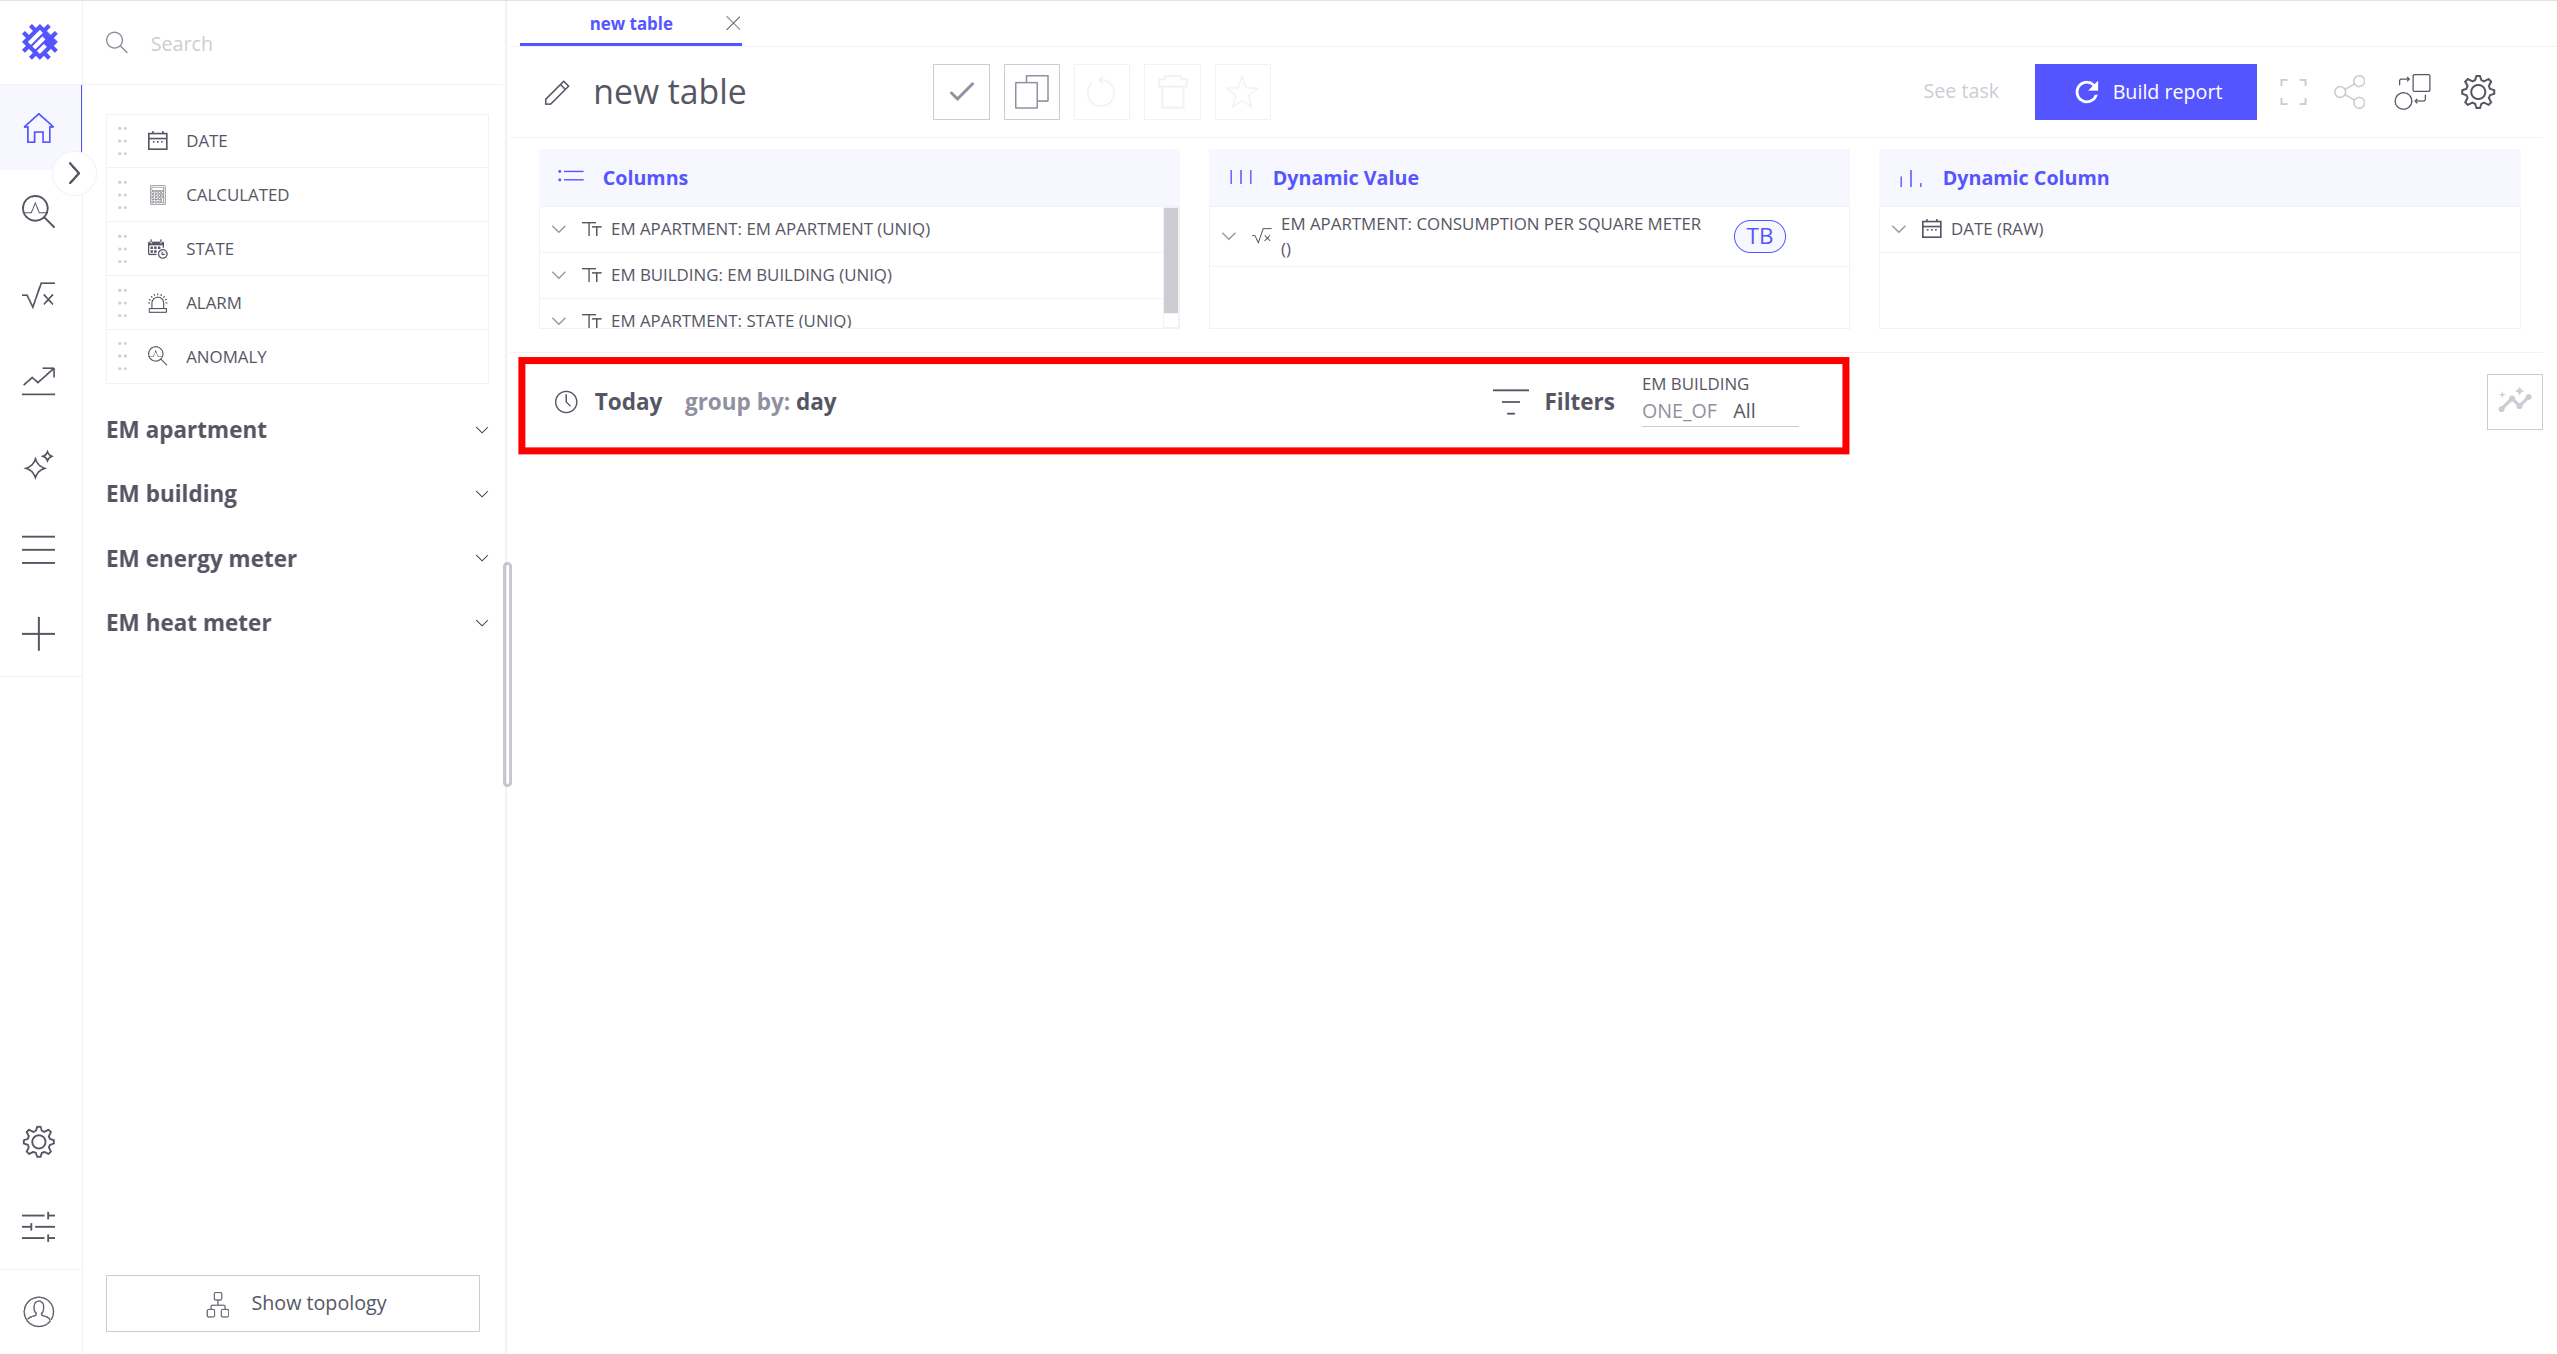
配置日期与筛选:
- 将日期选择器设为 今天
- 在筛选区域添加
EM building.EM building,以查看指定楼栋的能耗
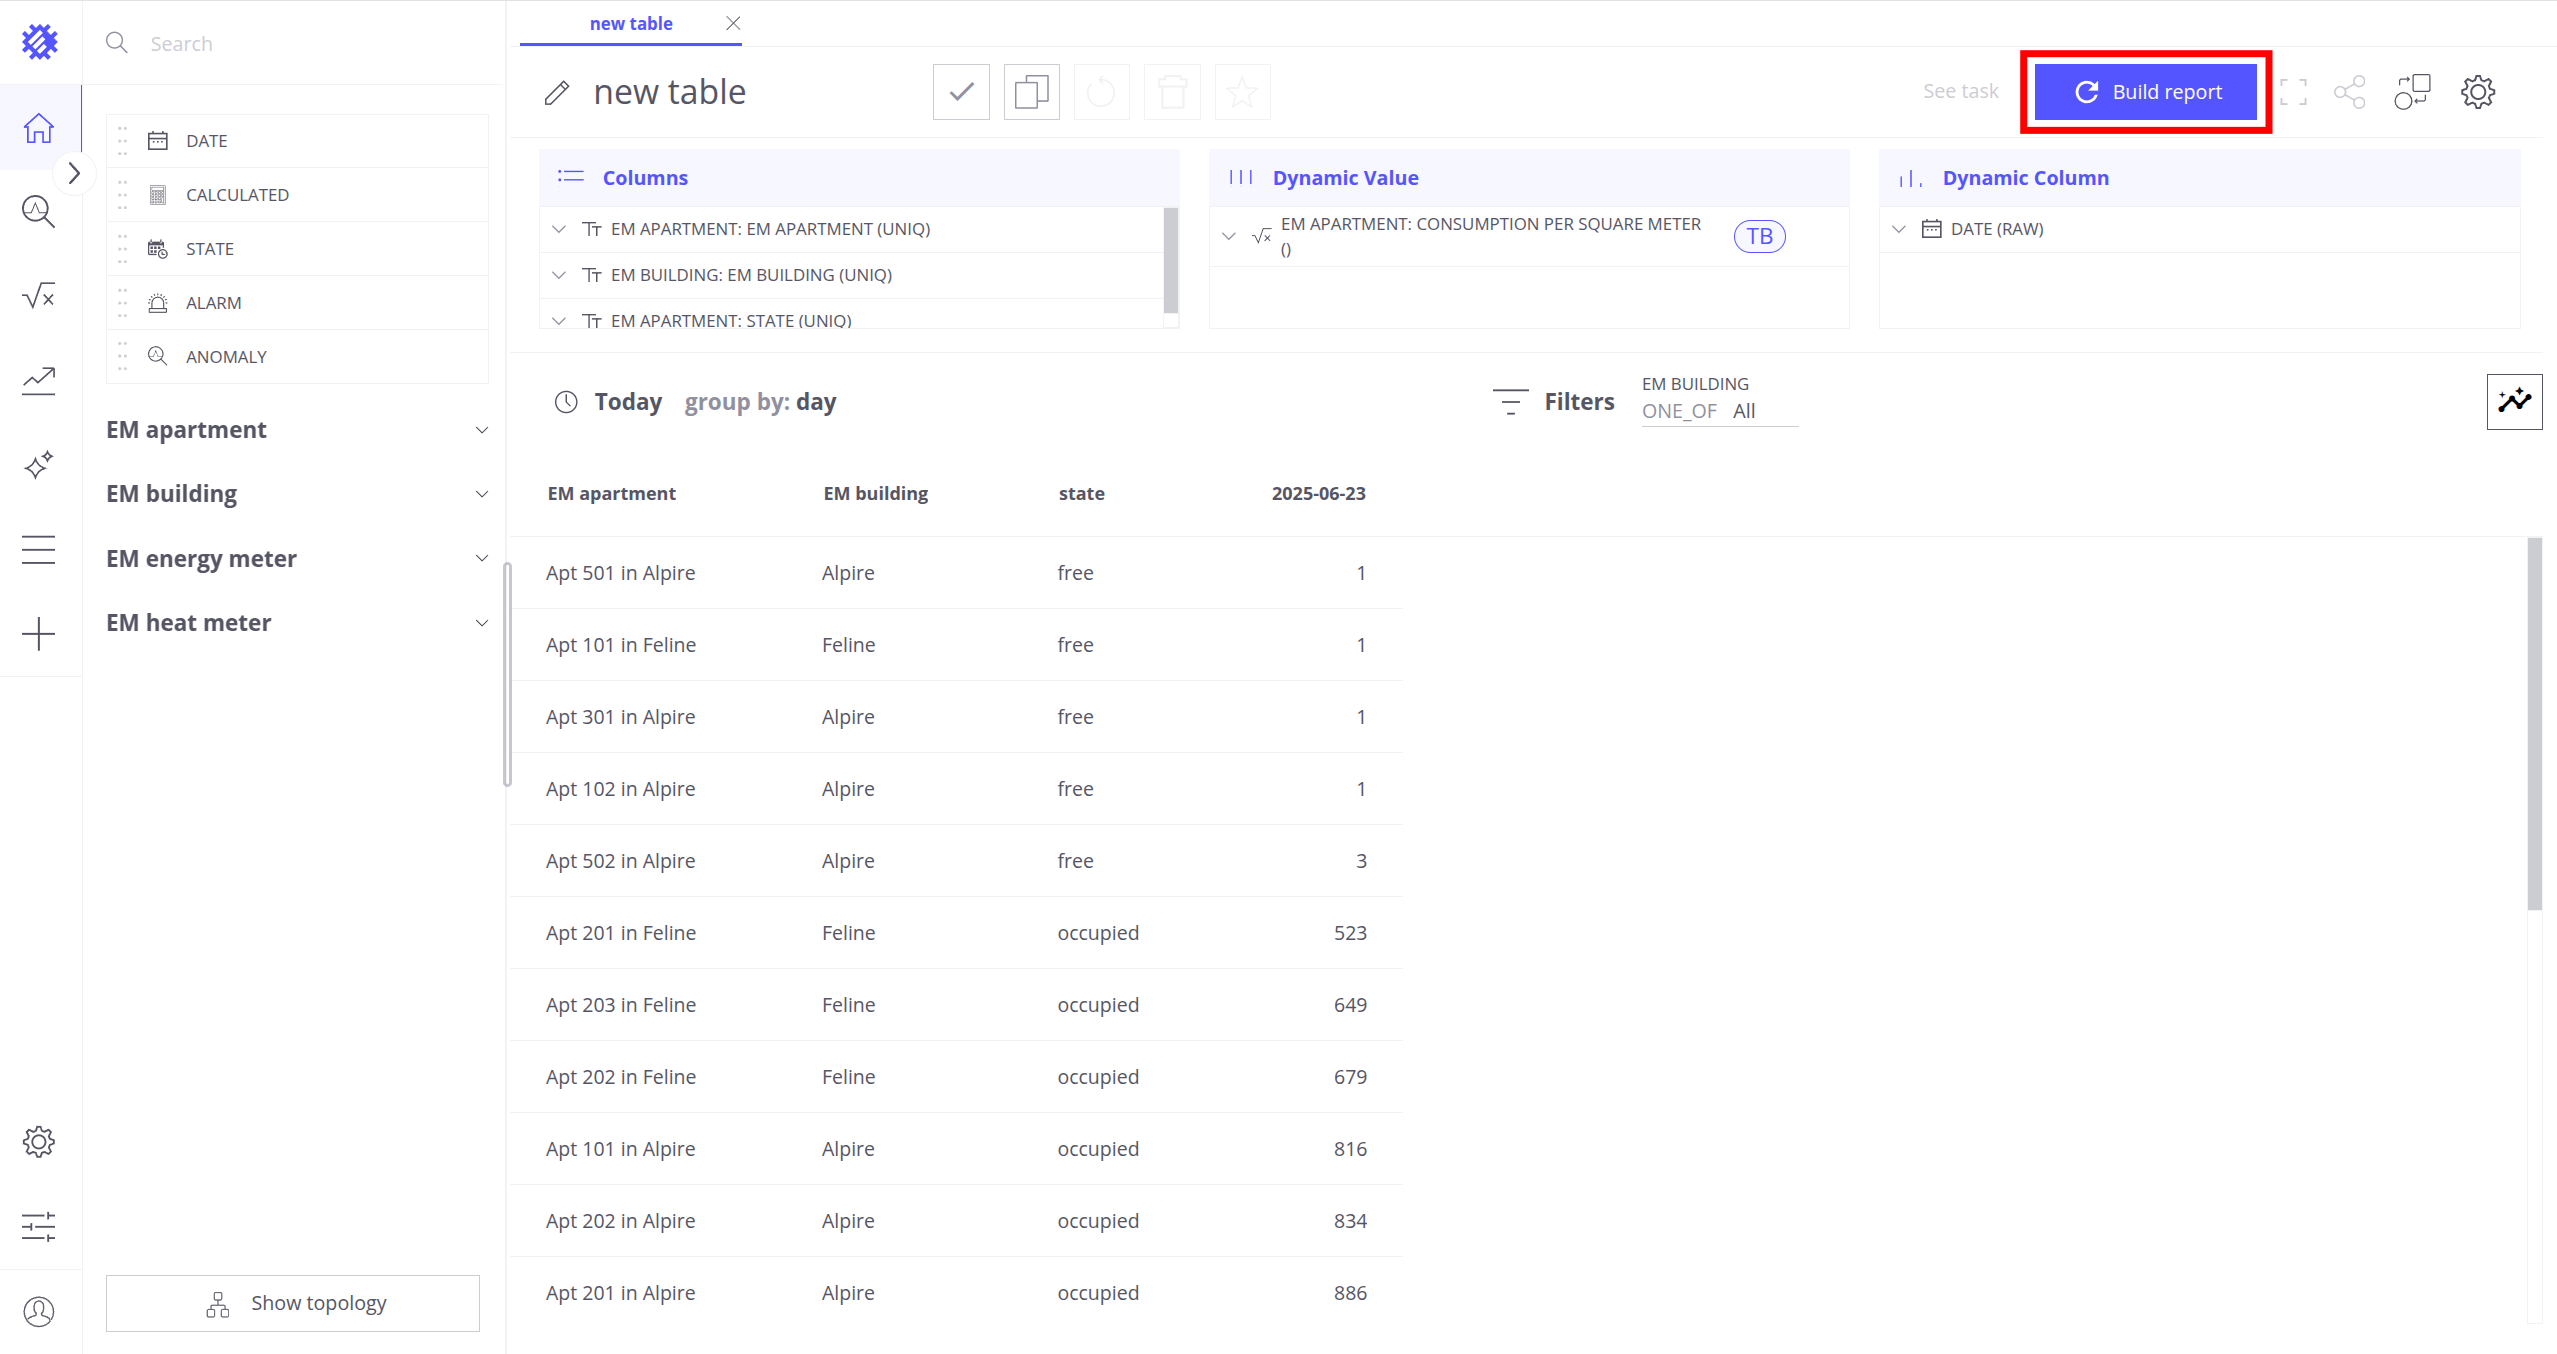
构建并保存视图:
- 点击 构建报告
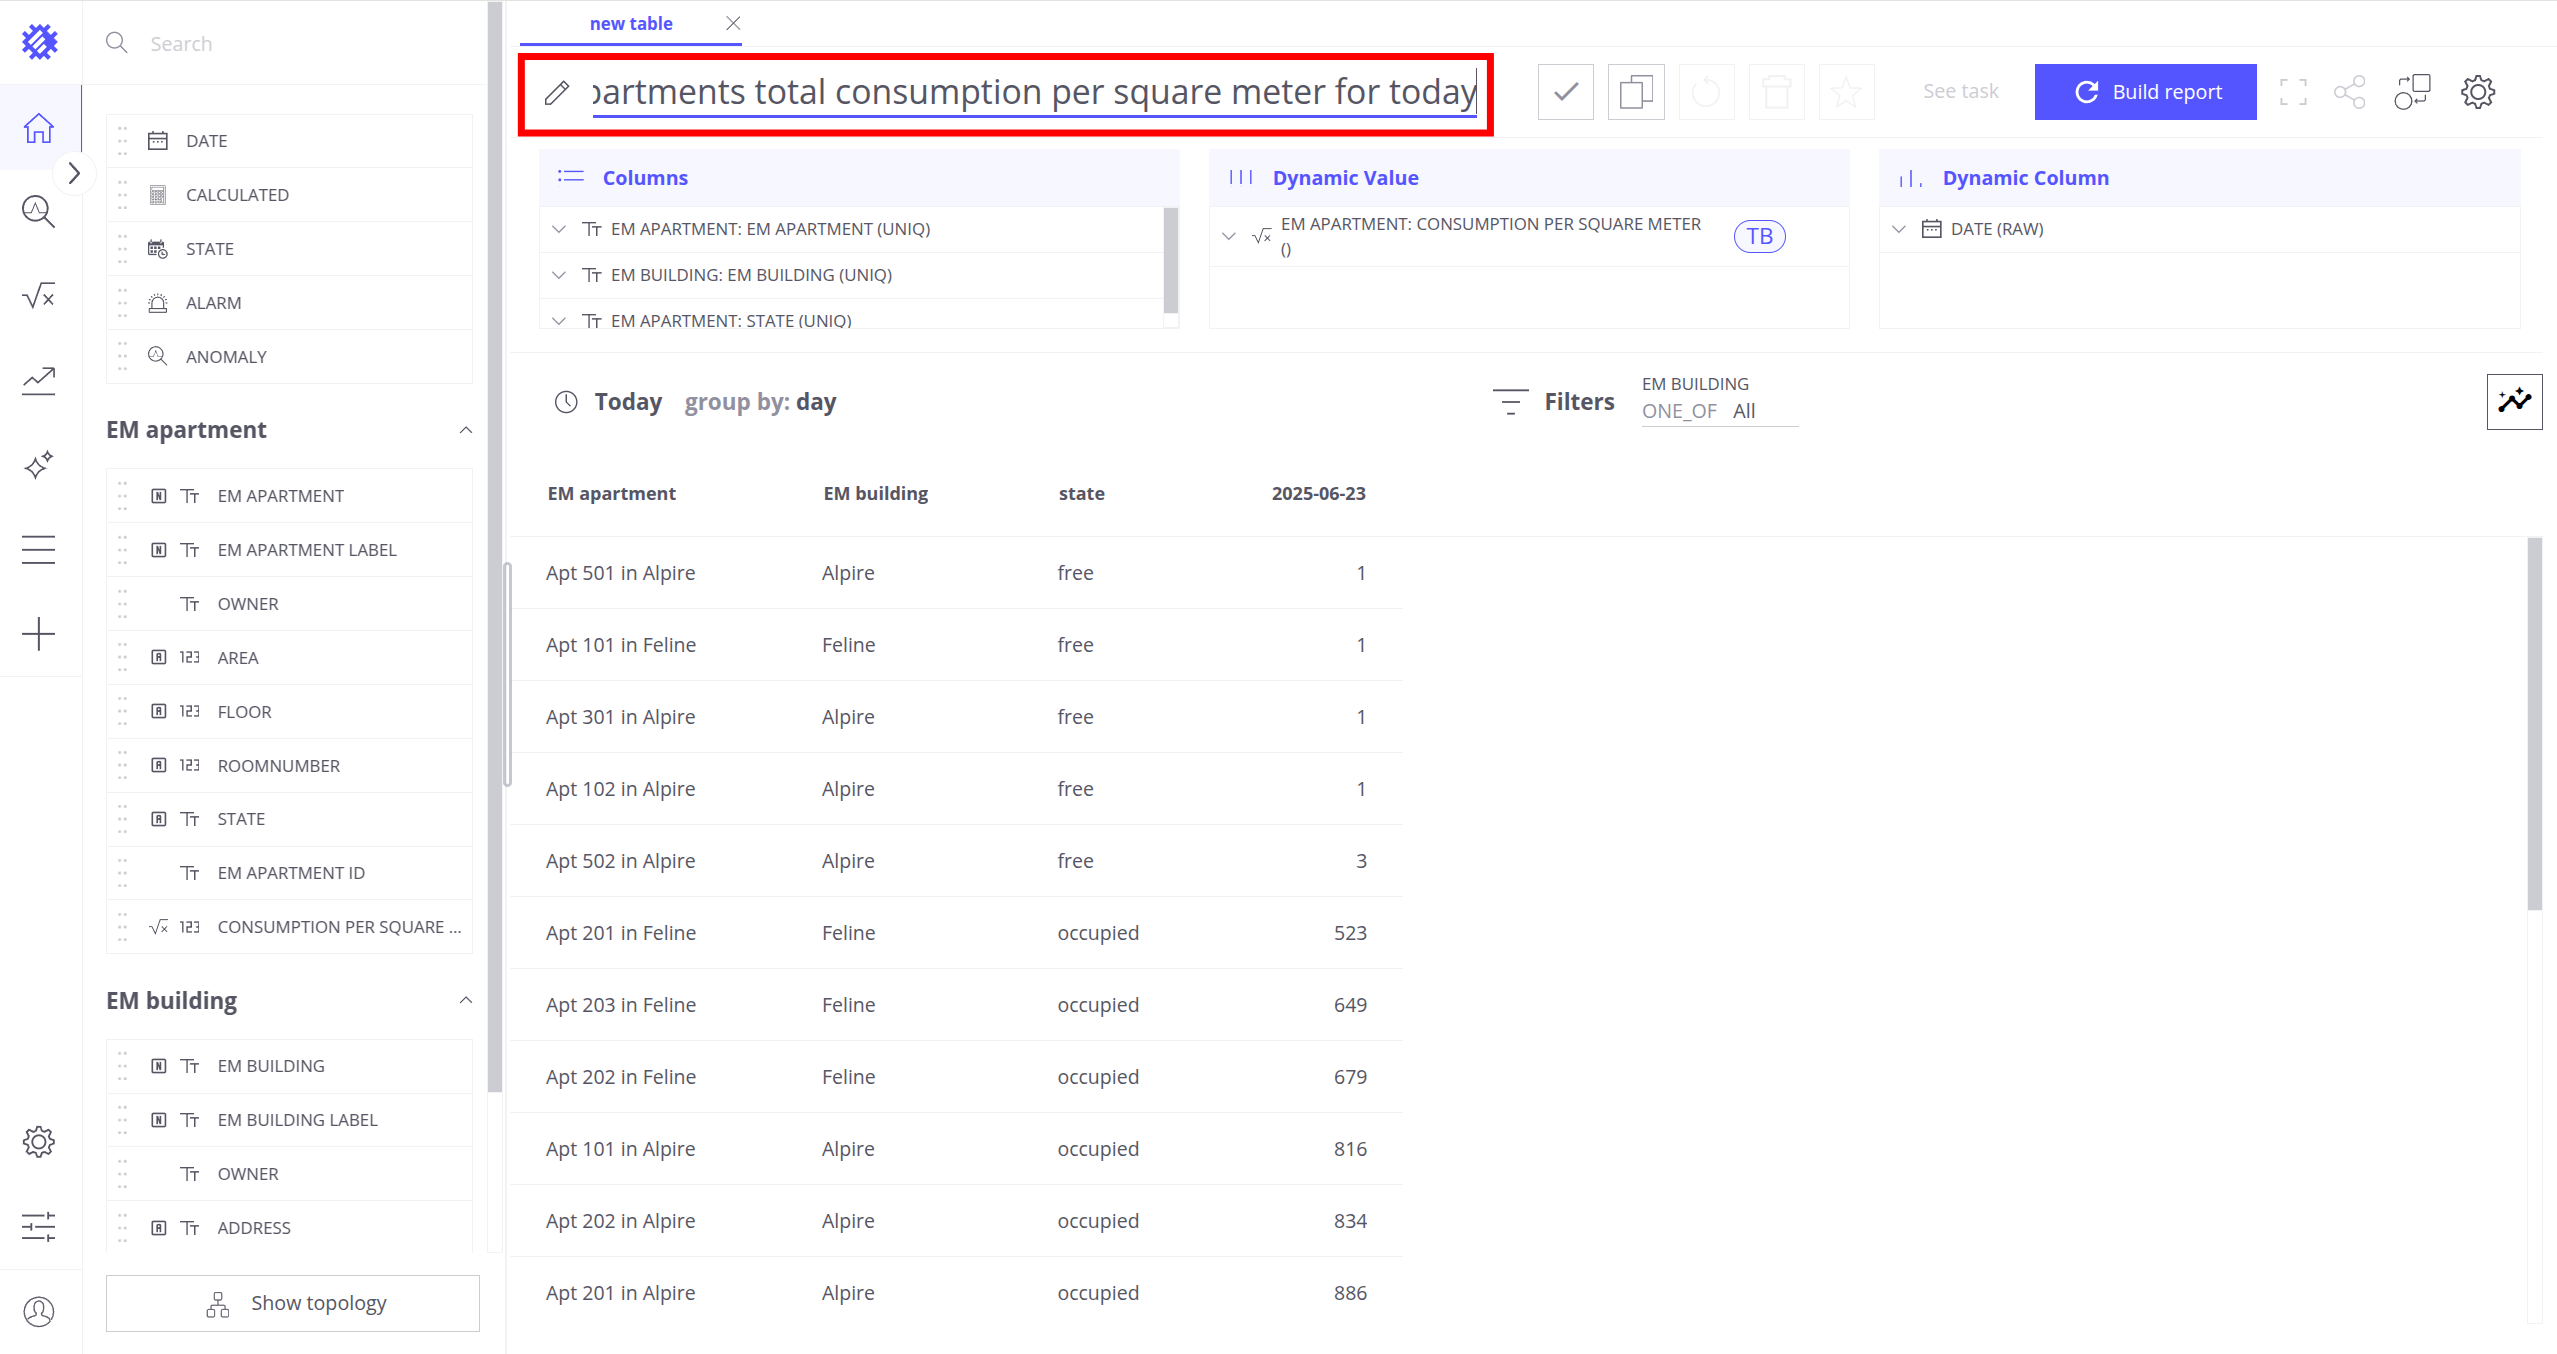
- 将视图重命名为「今日各公寓单位面积能耗」
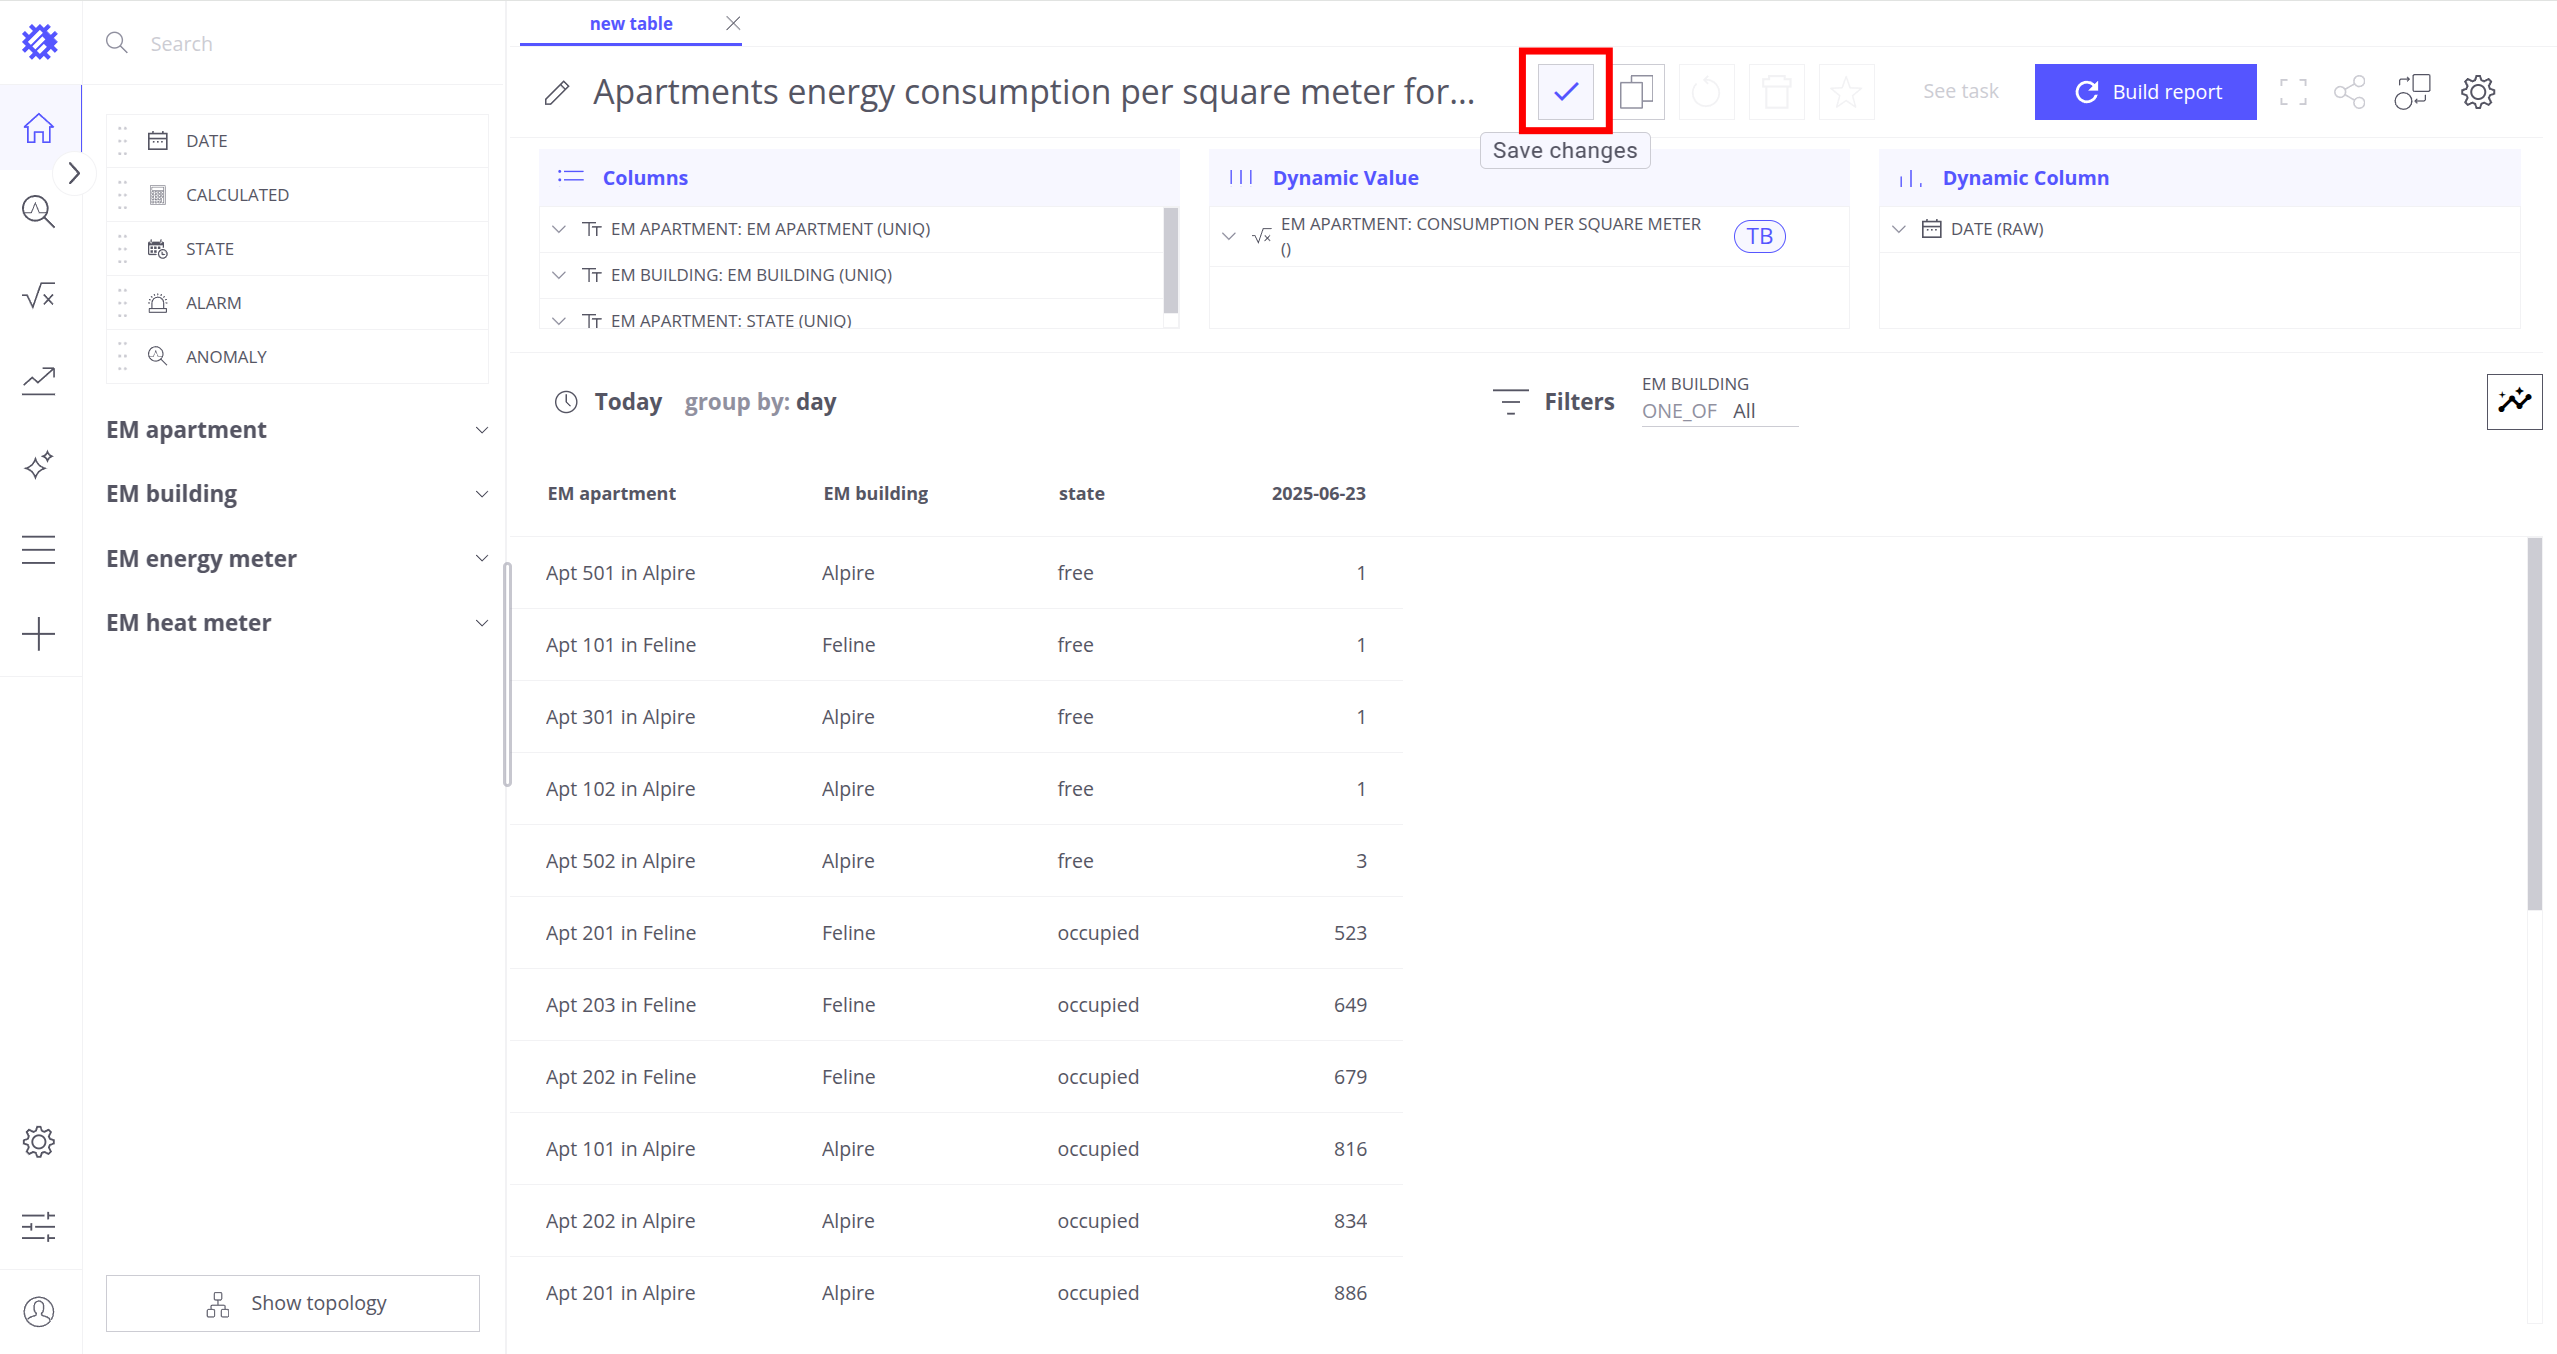
- 点击 保存更改按钮保存图表
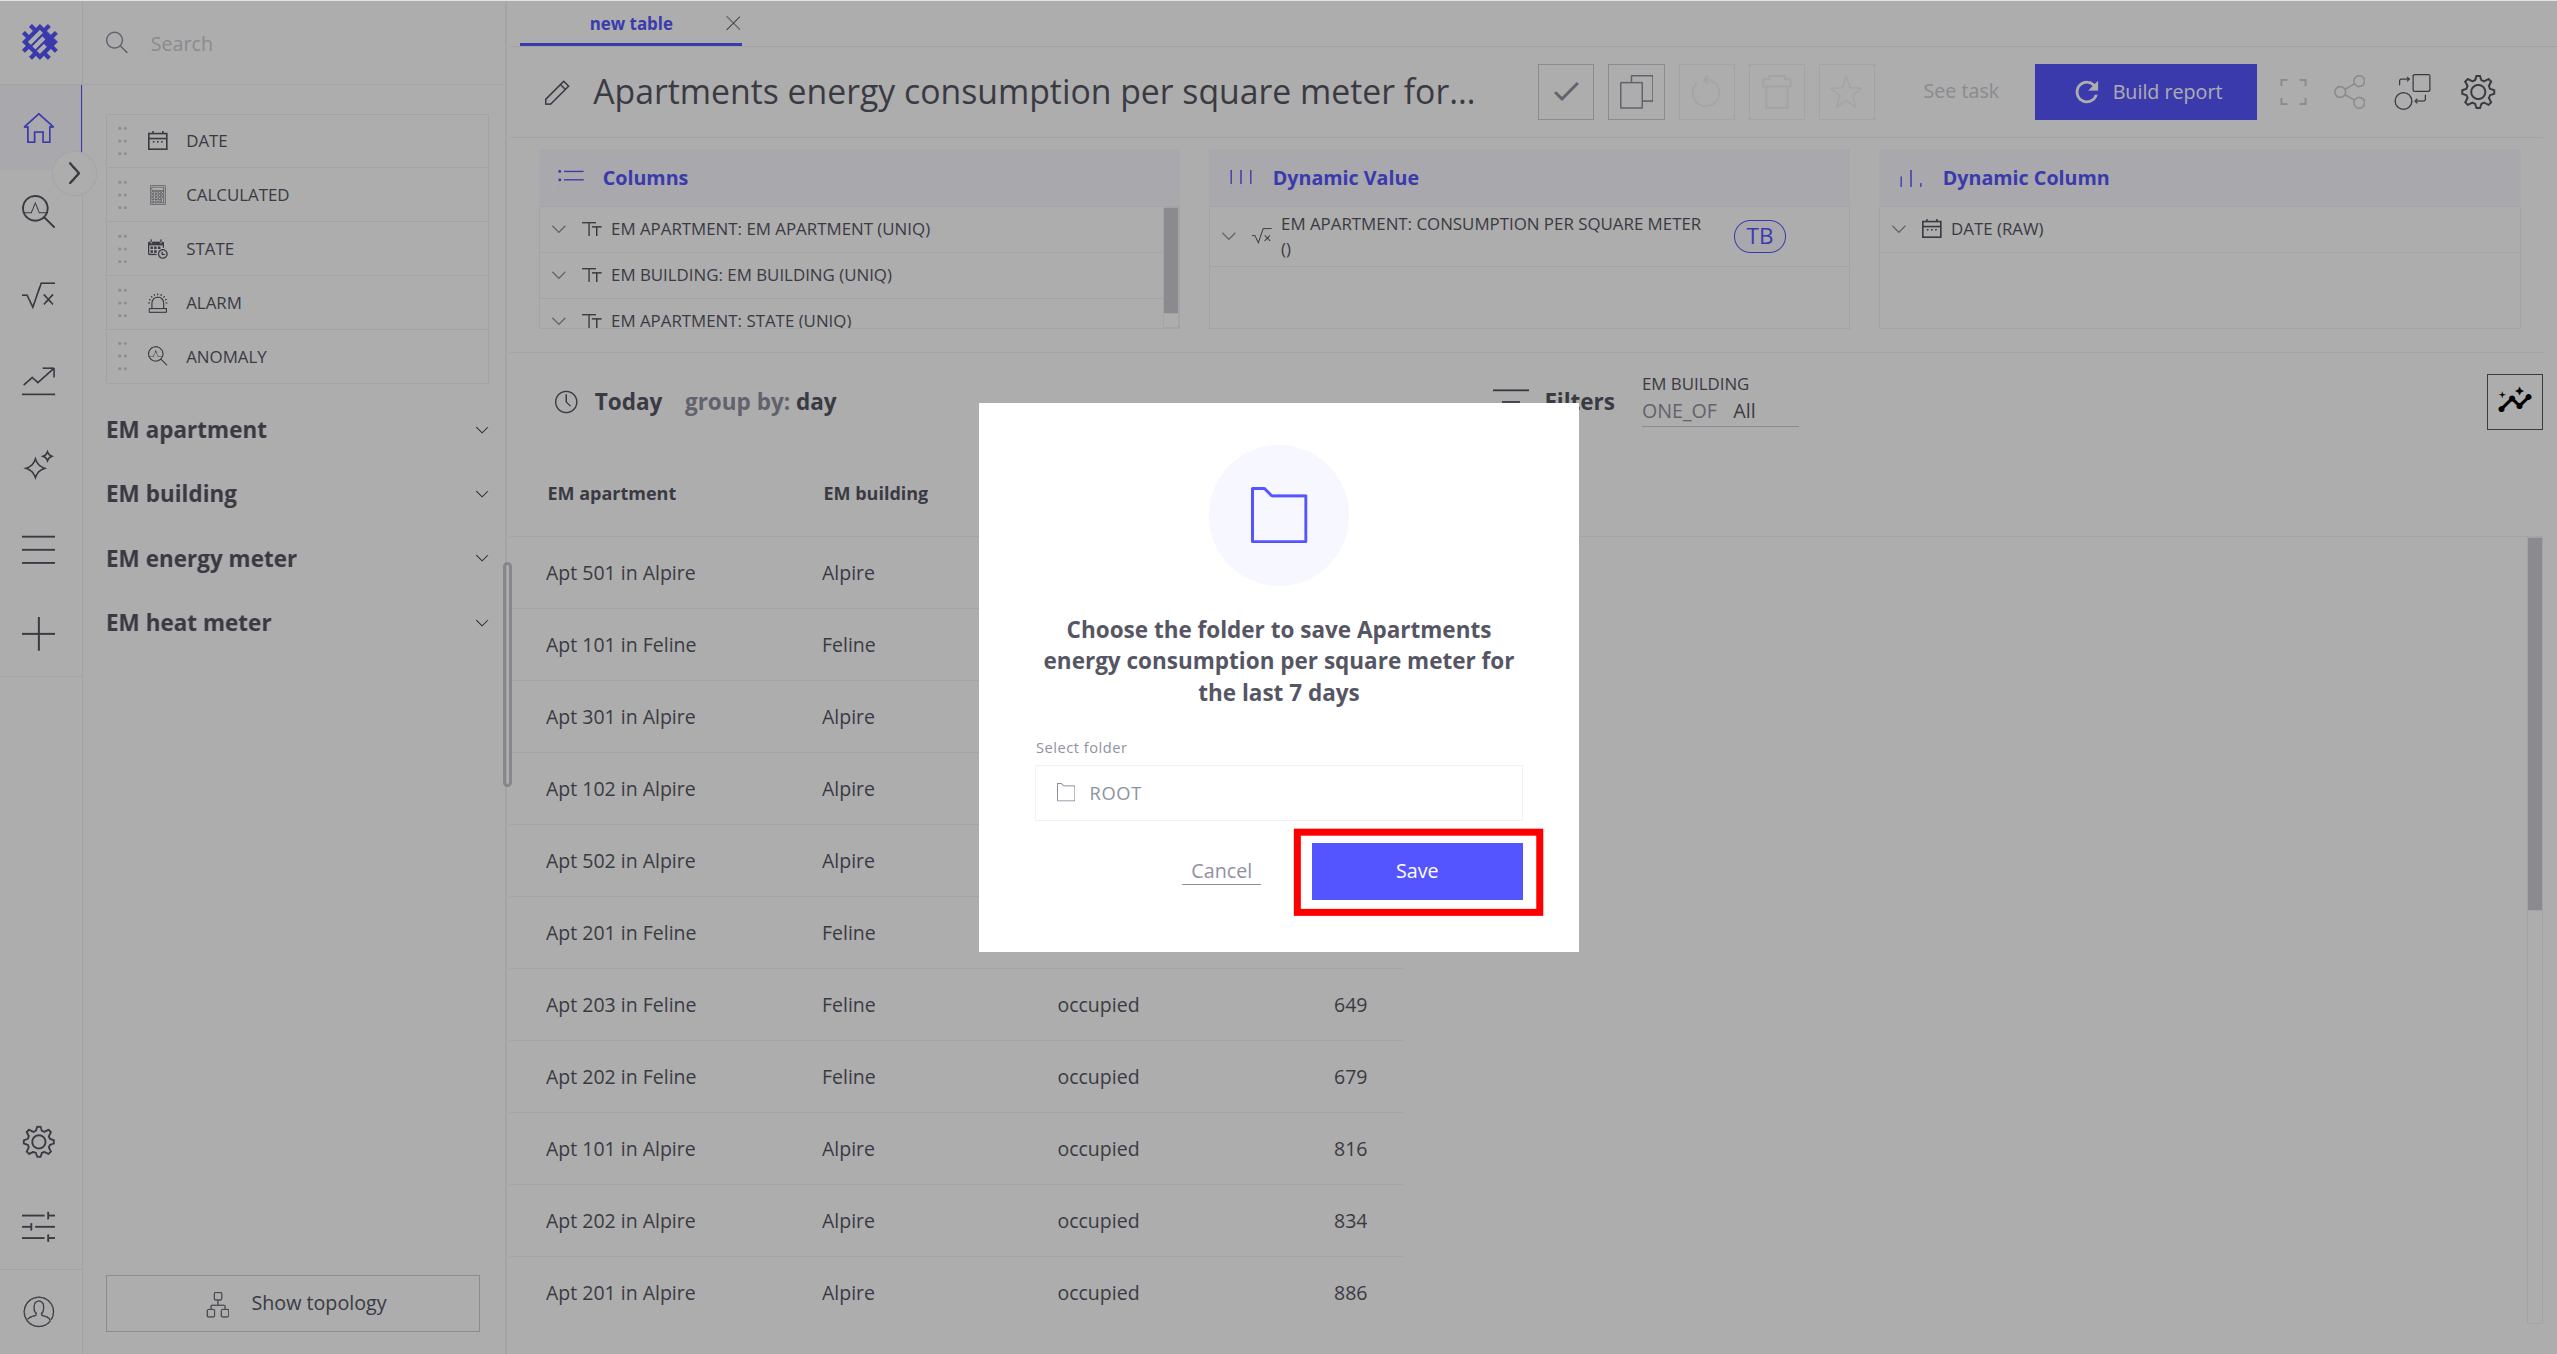
- 在弹窗中点击 保存按钮
步骤 5. 预测能耗
下一步将基于历史数据,为各楼栋创建本周能耗预测。
创建预测模型
首先创建预测模型,该模型可在多个视图中复用。
-
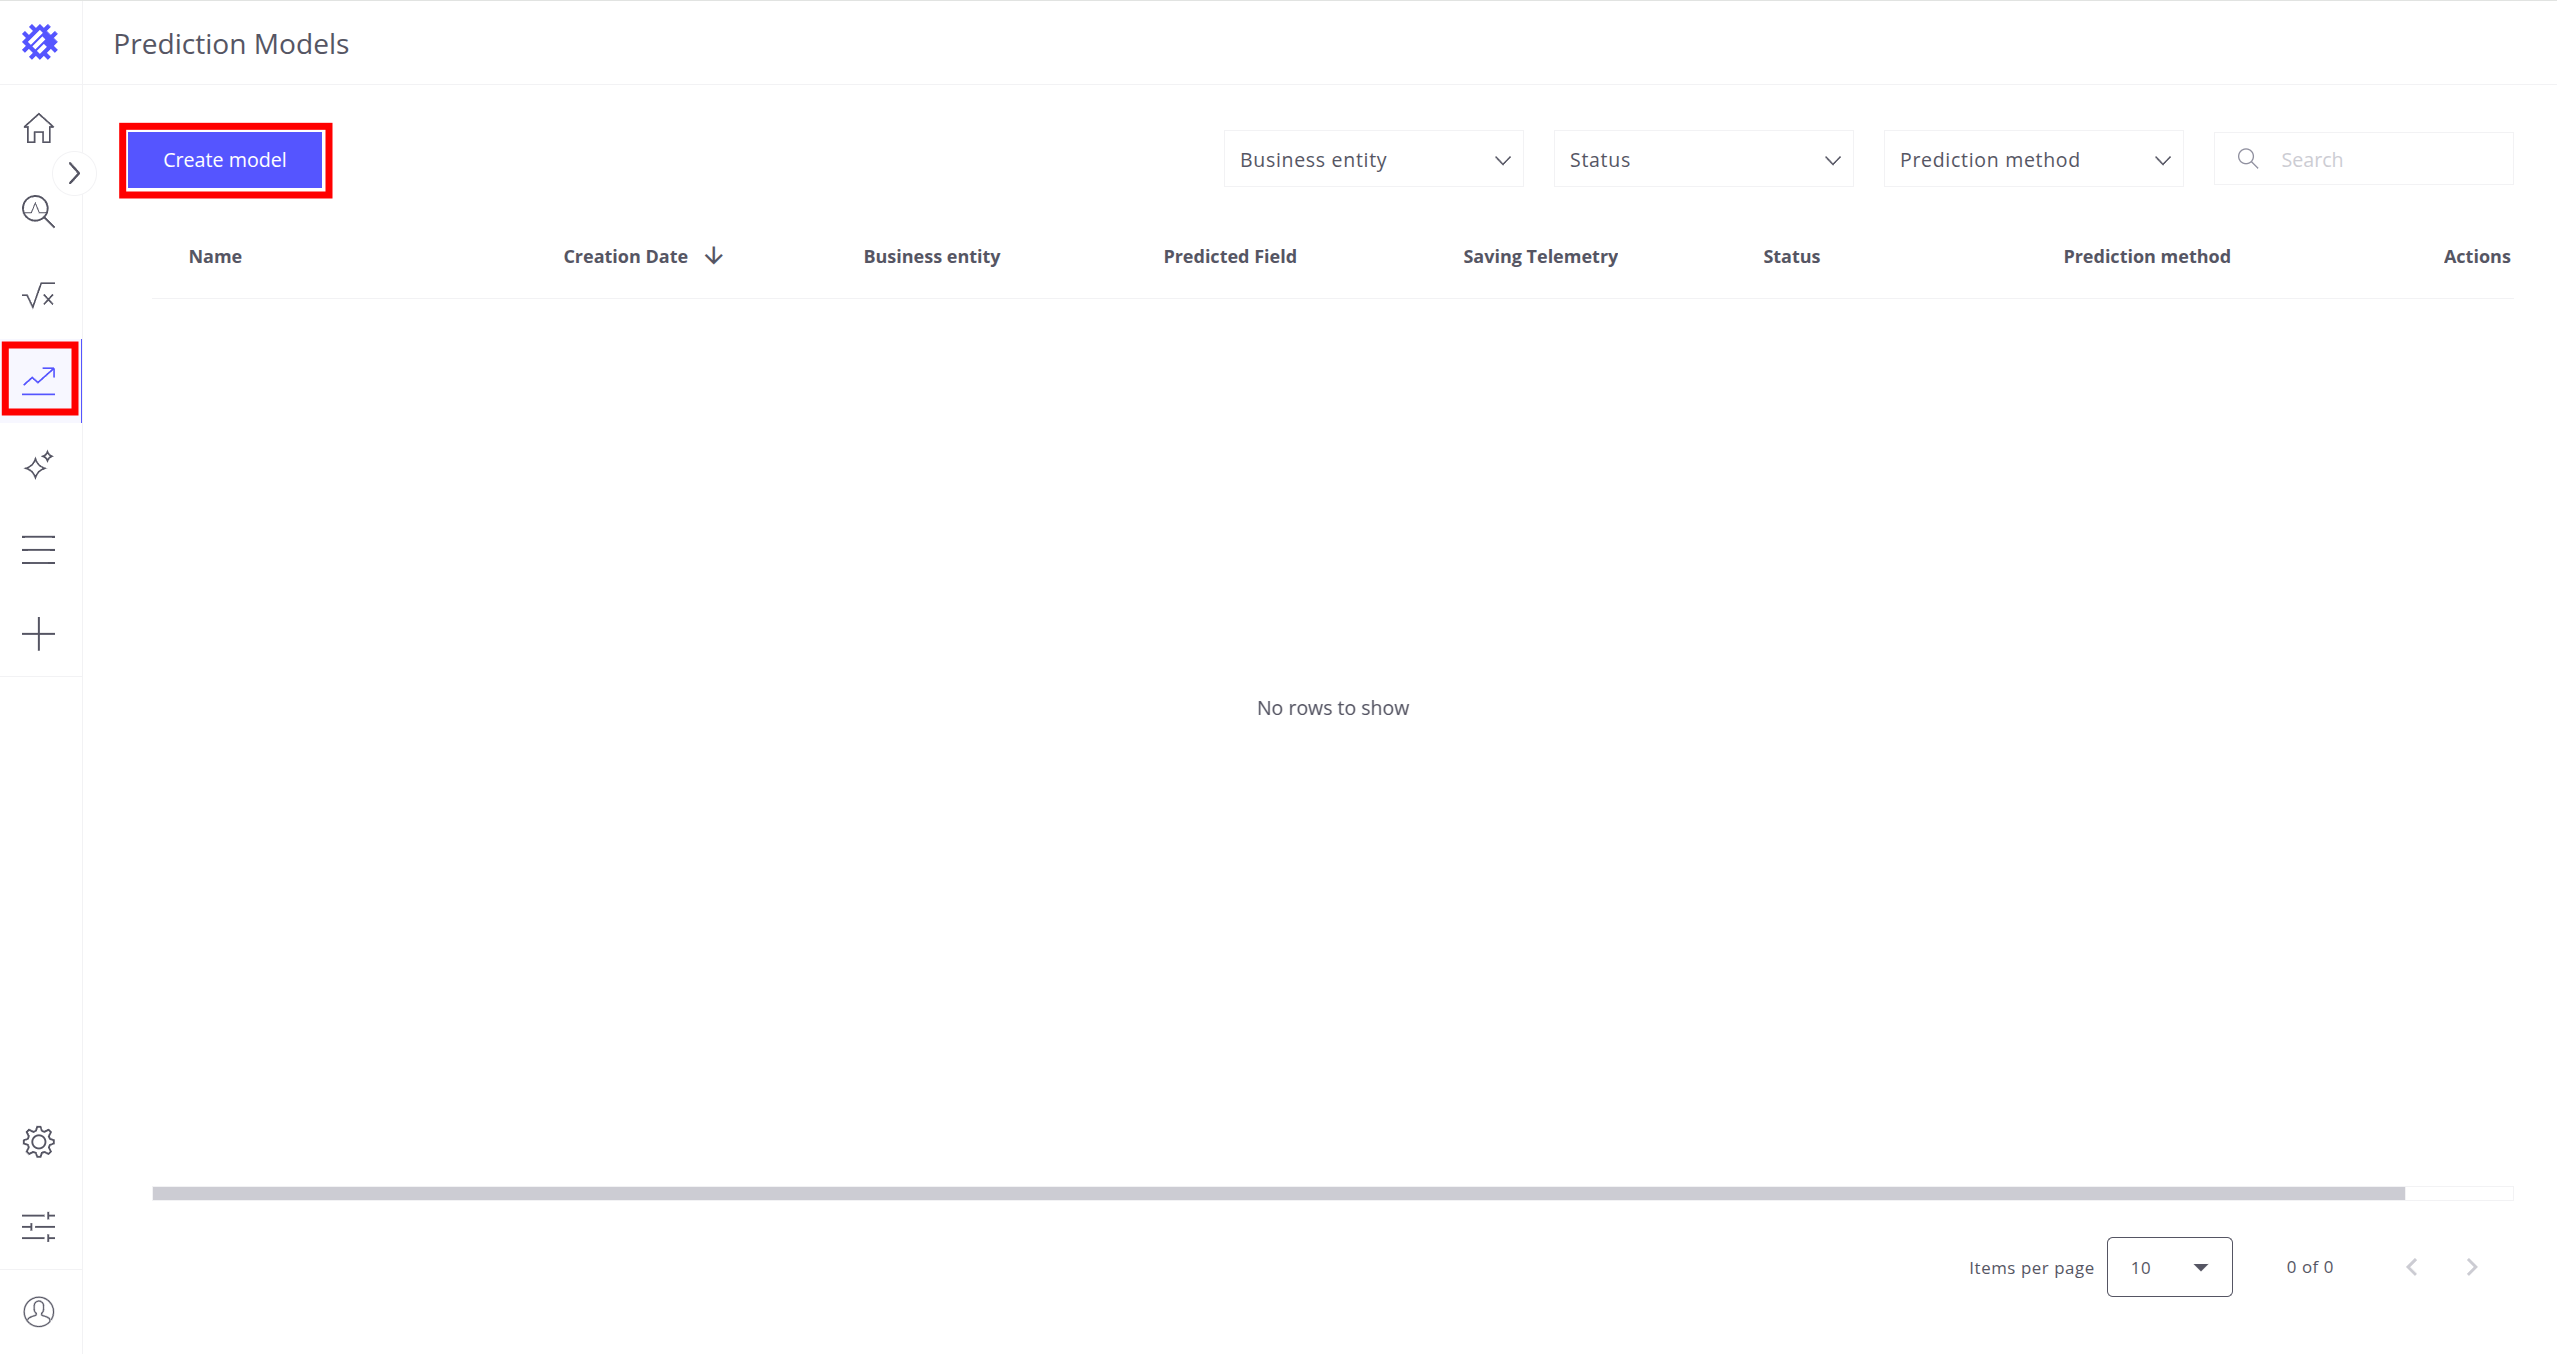
点击左侧面板的预测图标,进入 预测模型页面
- 点击 创建模型按钮
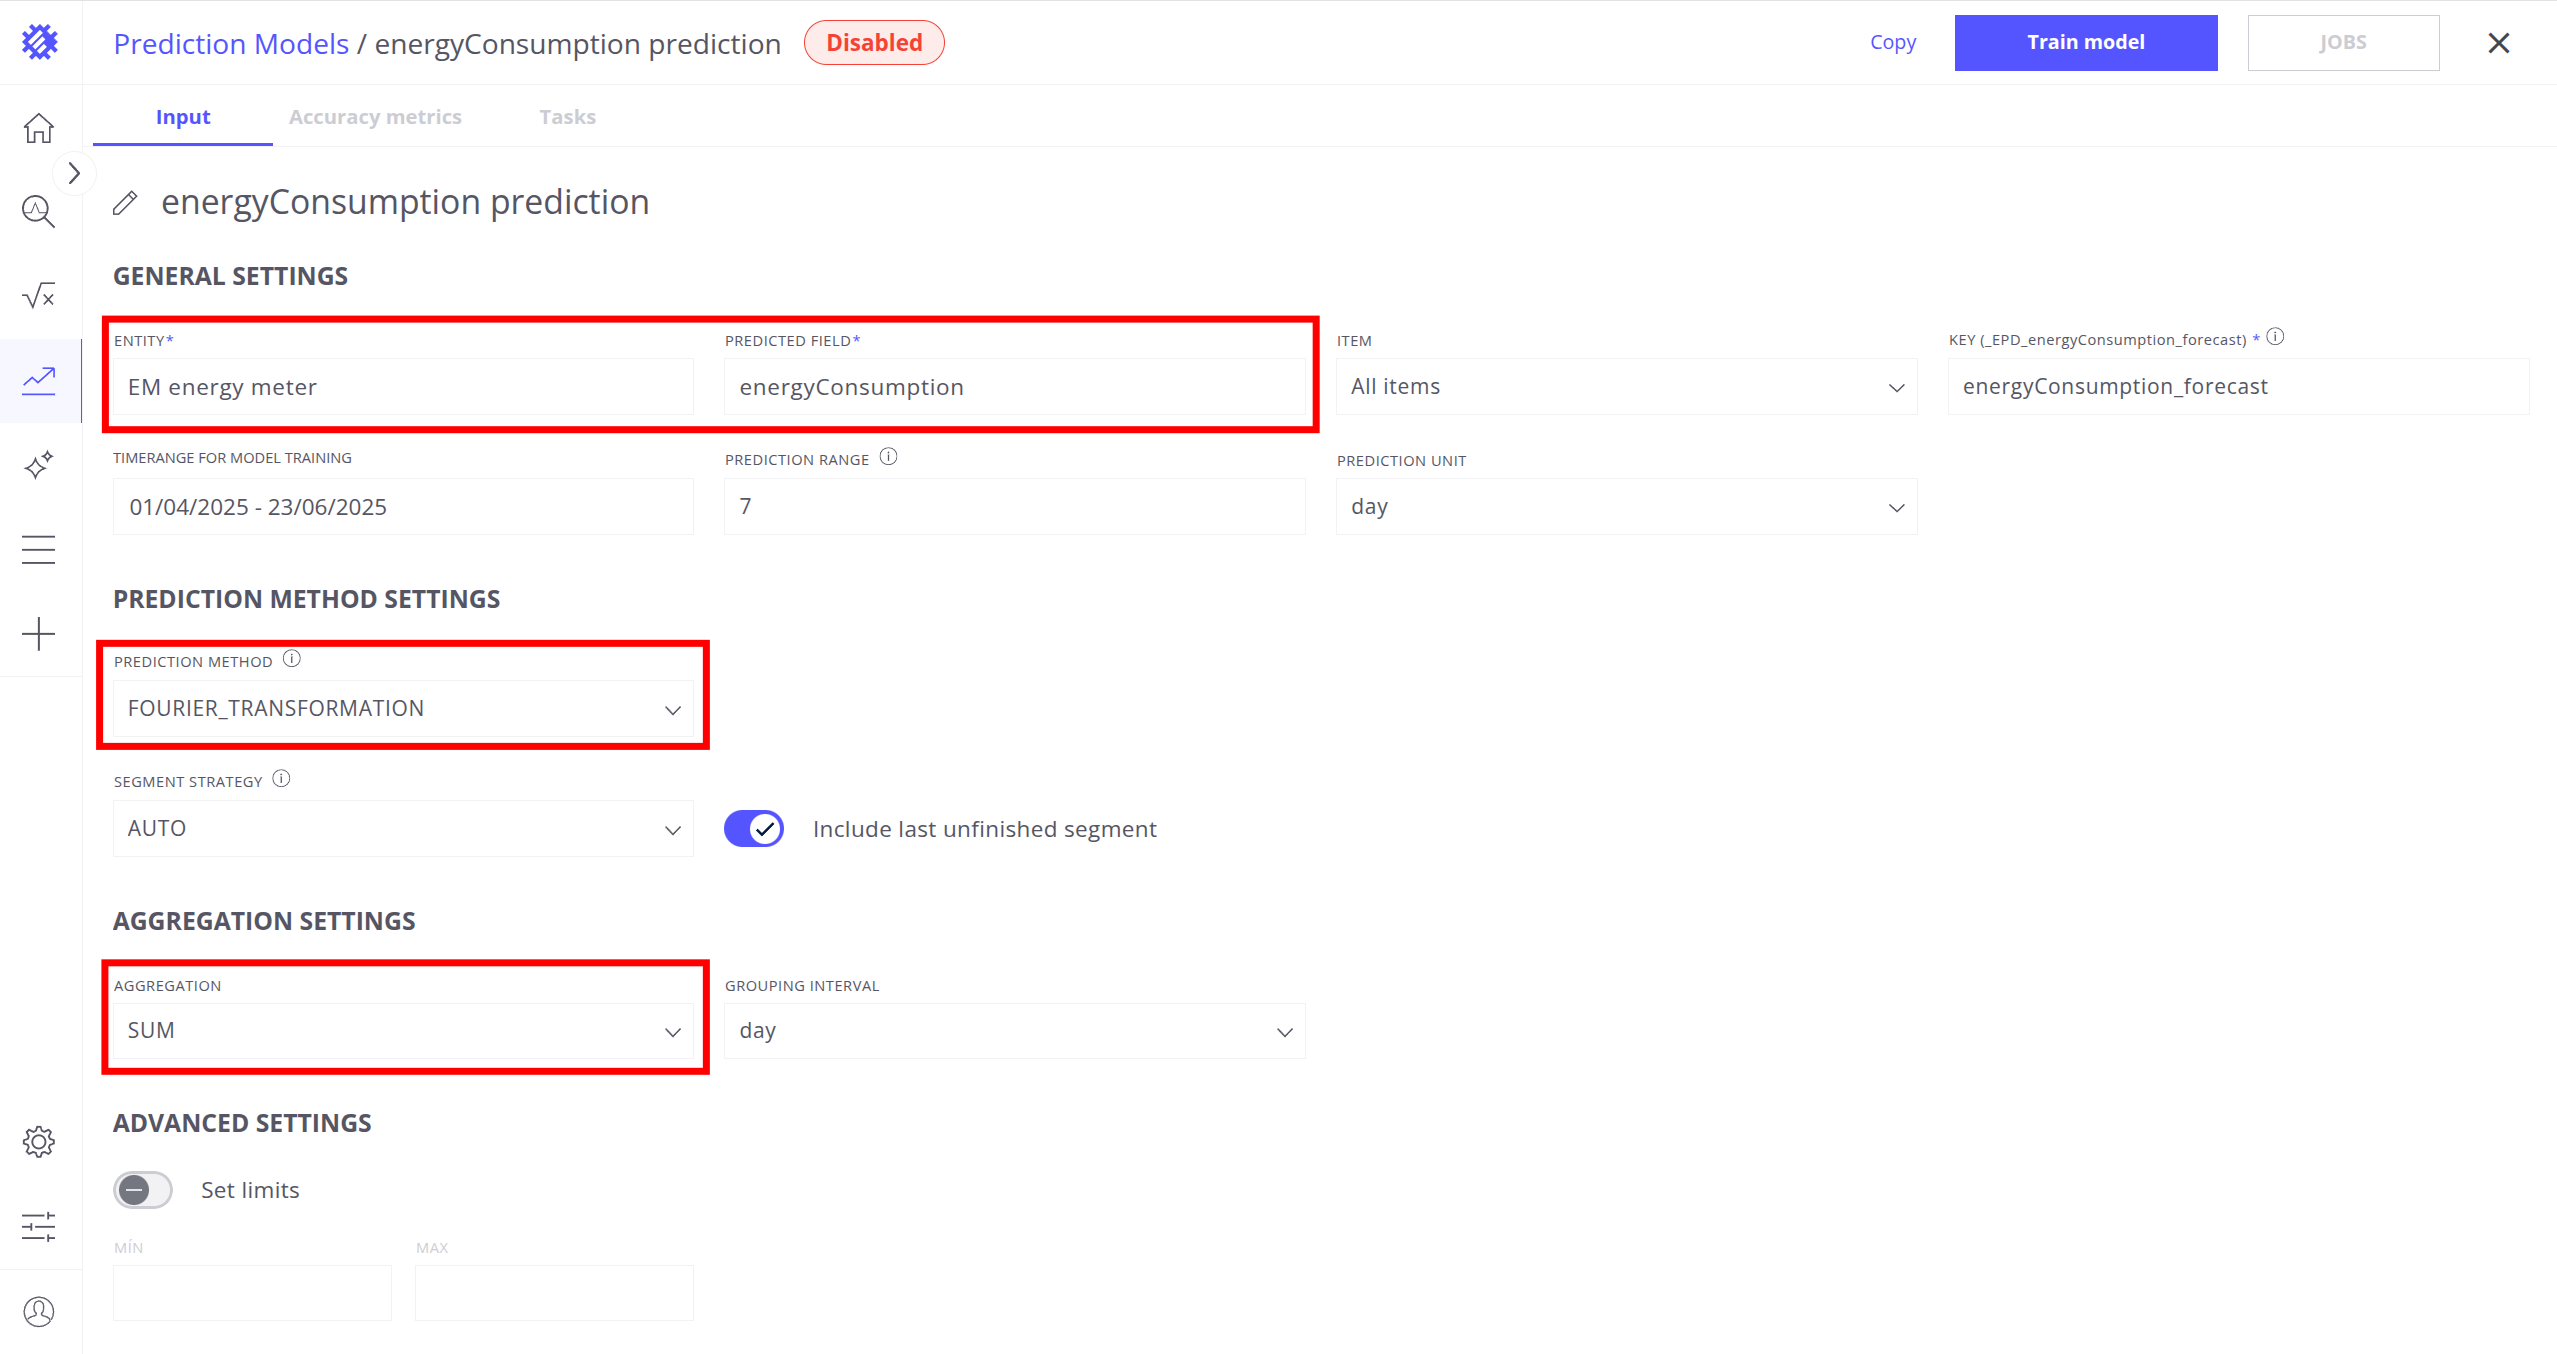
- 将实体设为
EM energy meter - 将预测字段设为
energyConsumption - 将预测方法设为
FOURIER_TRANSFORMATION - 将聚合设为
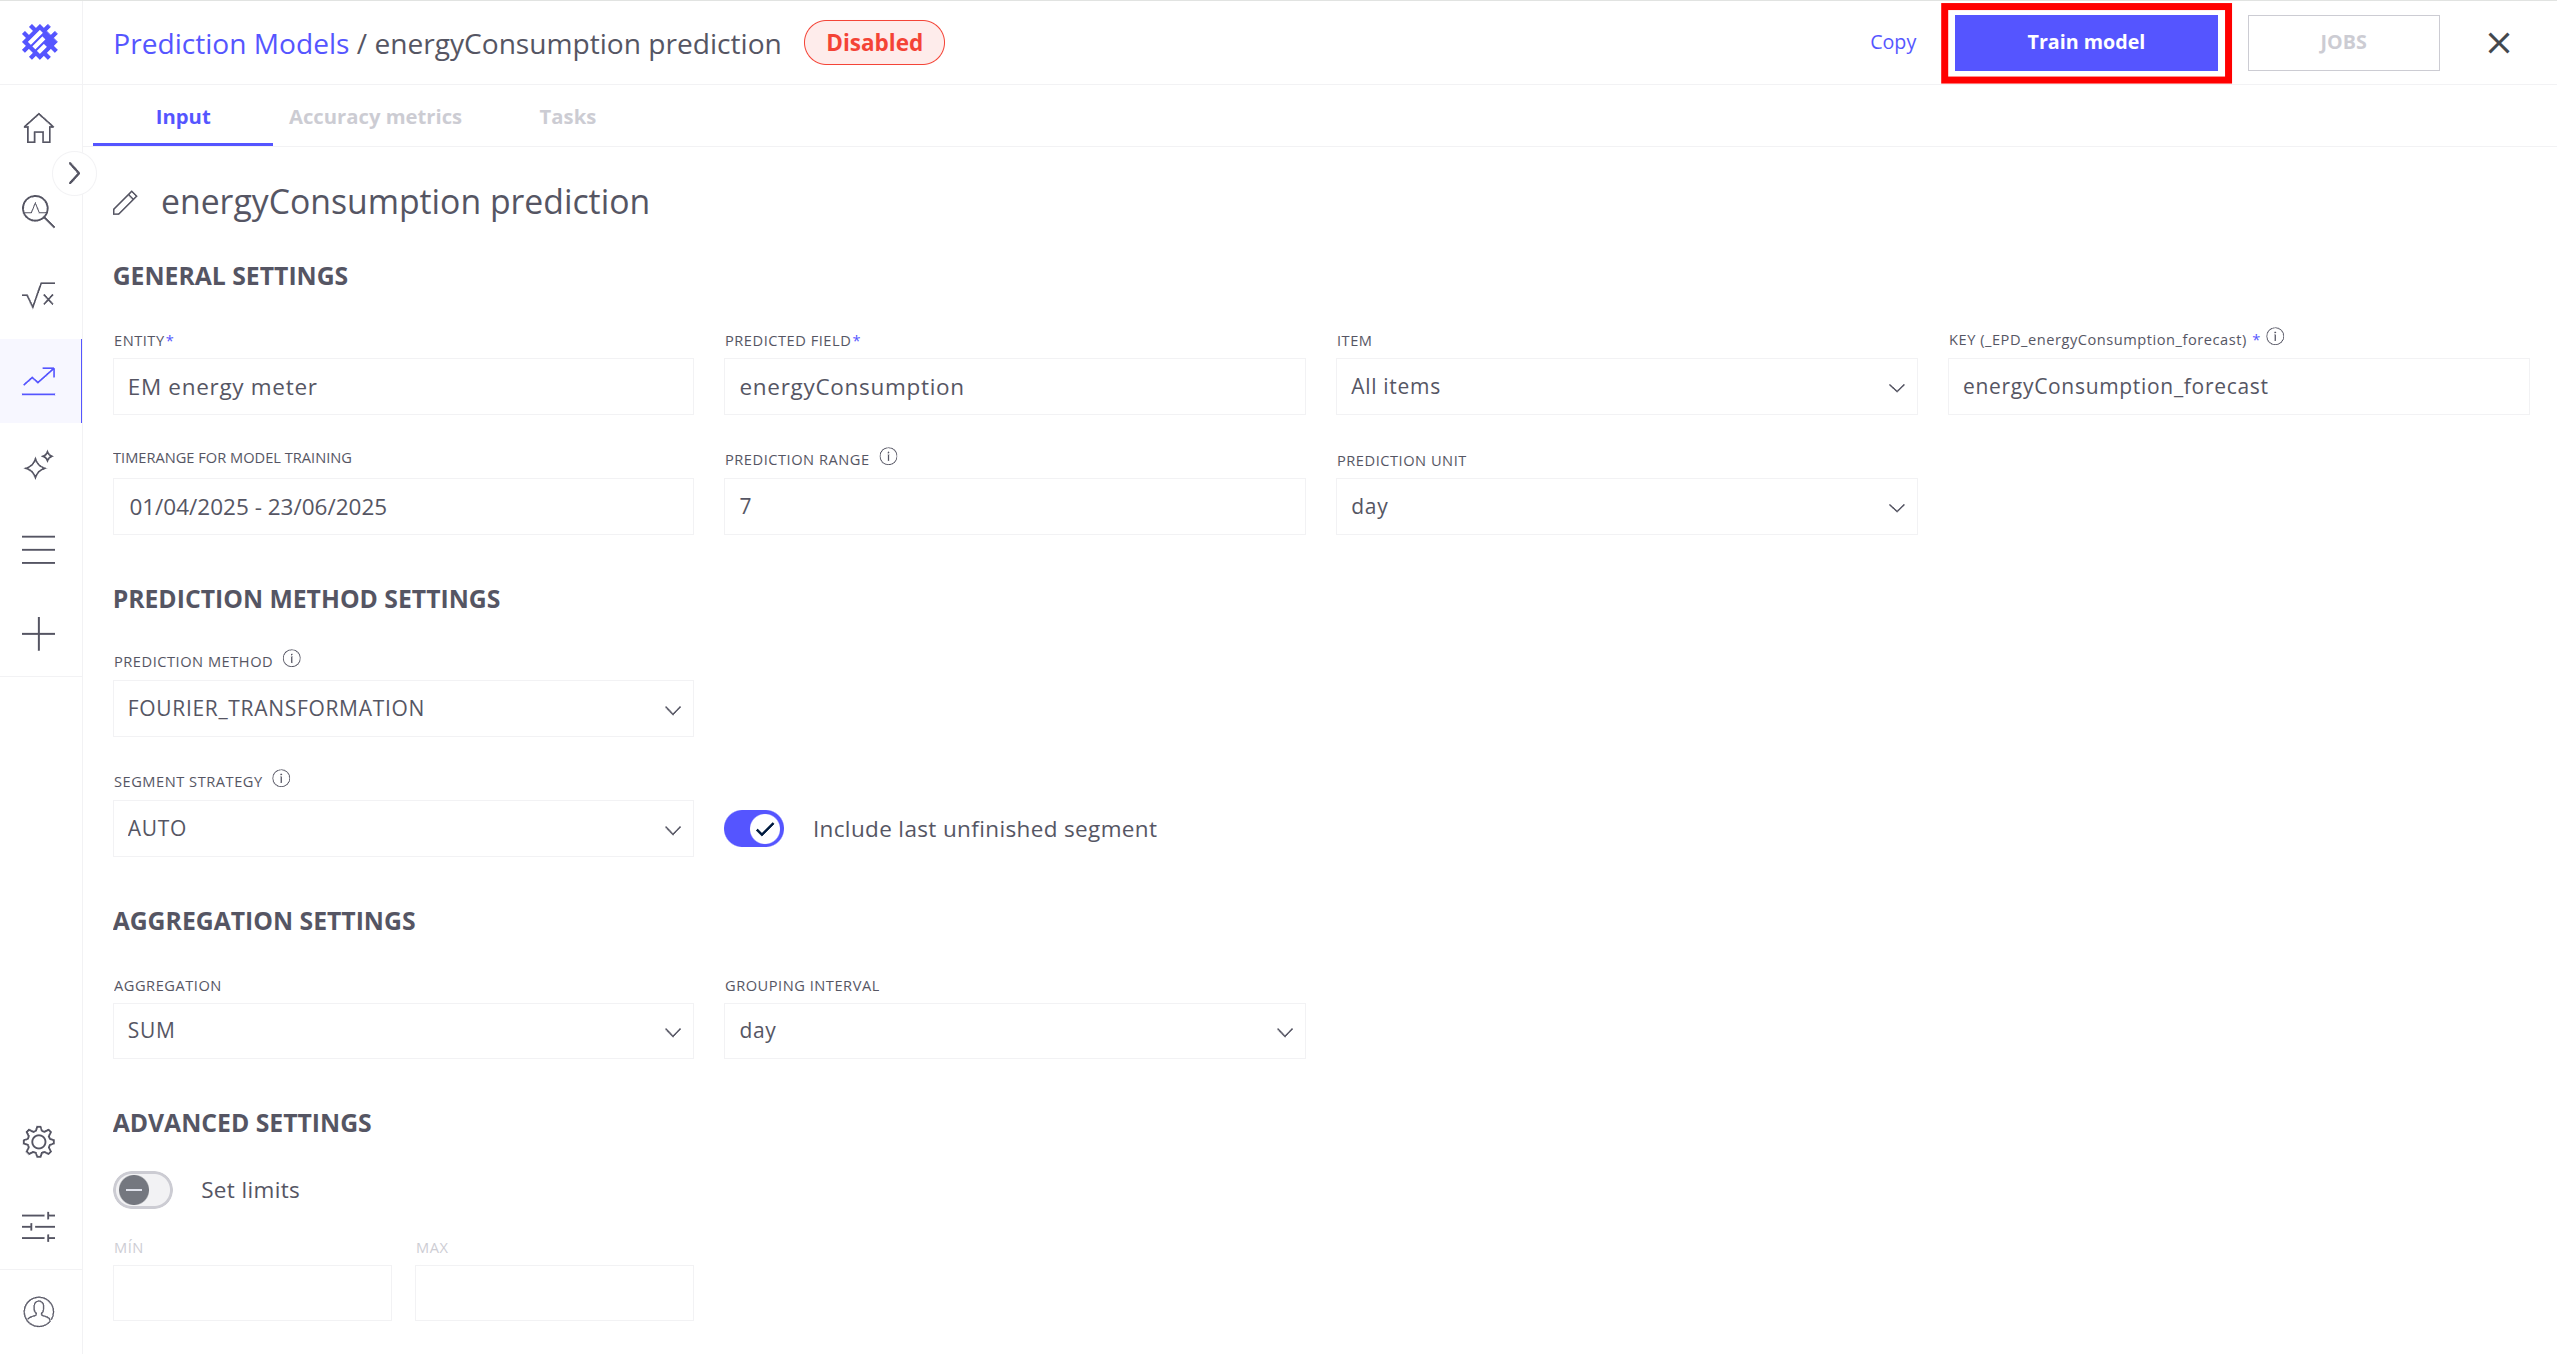
SUM - 点击 训练模型按钮,等待精度标签页显示
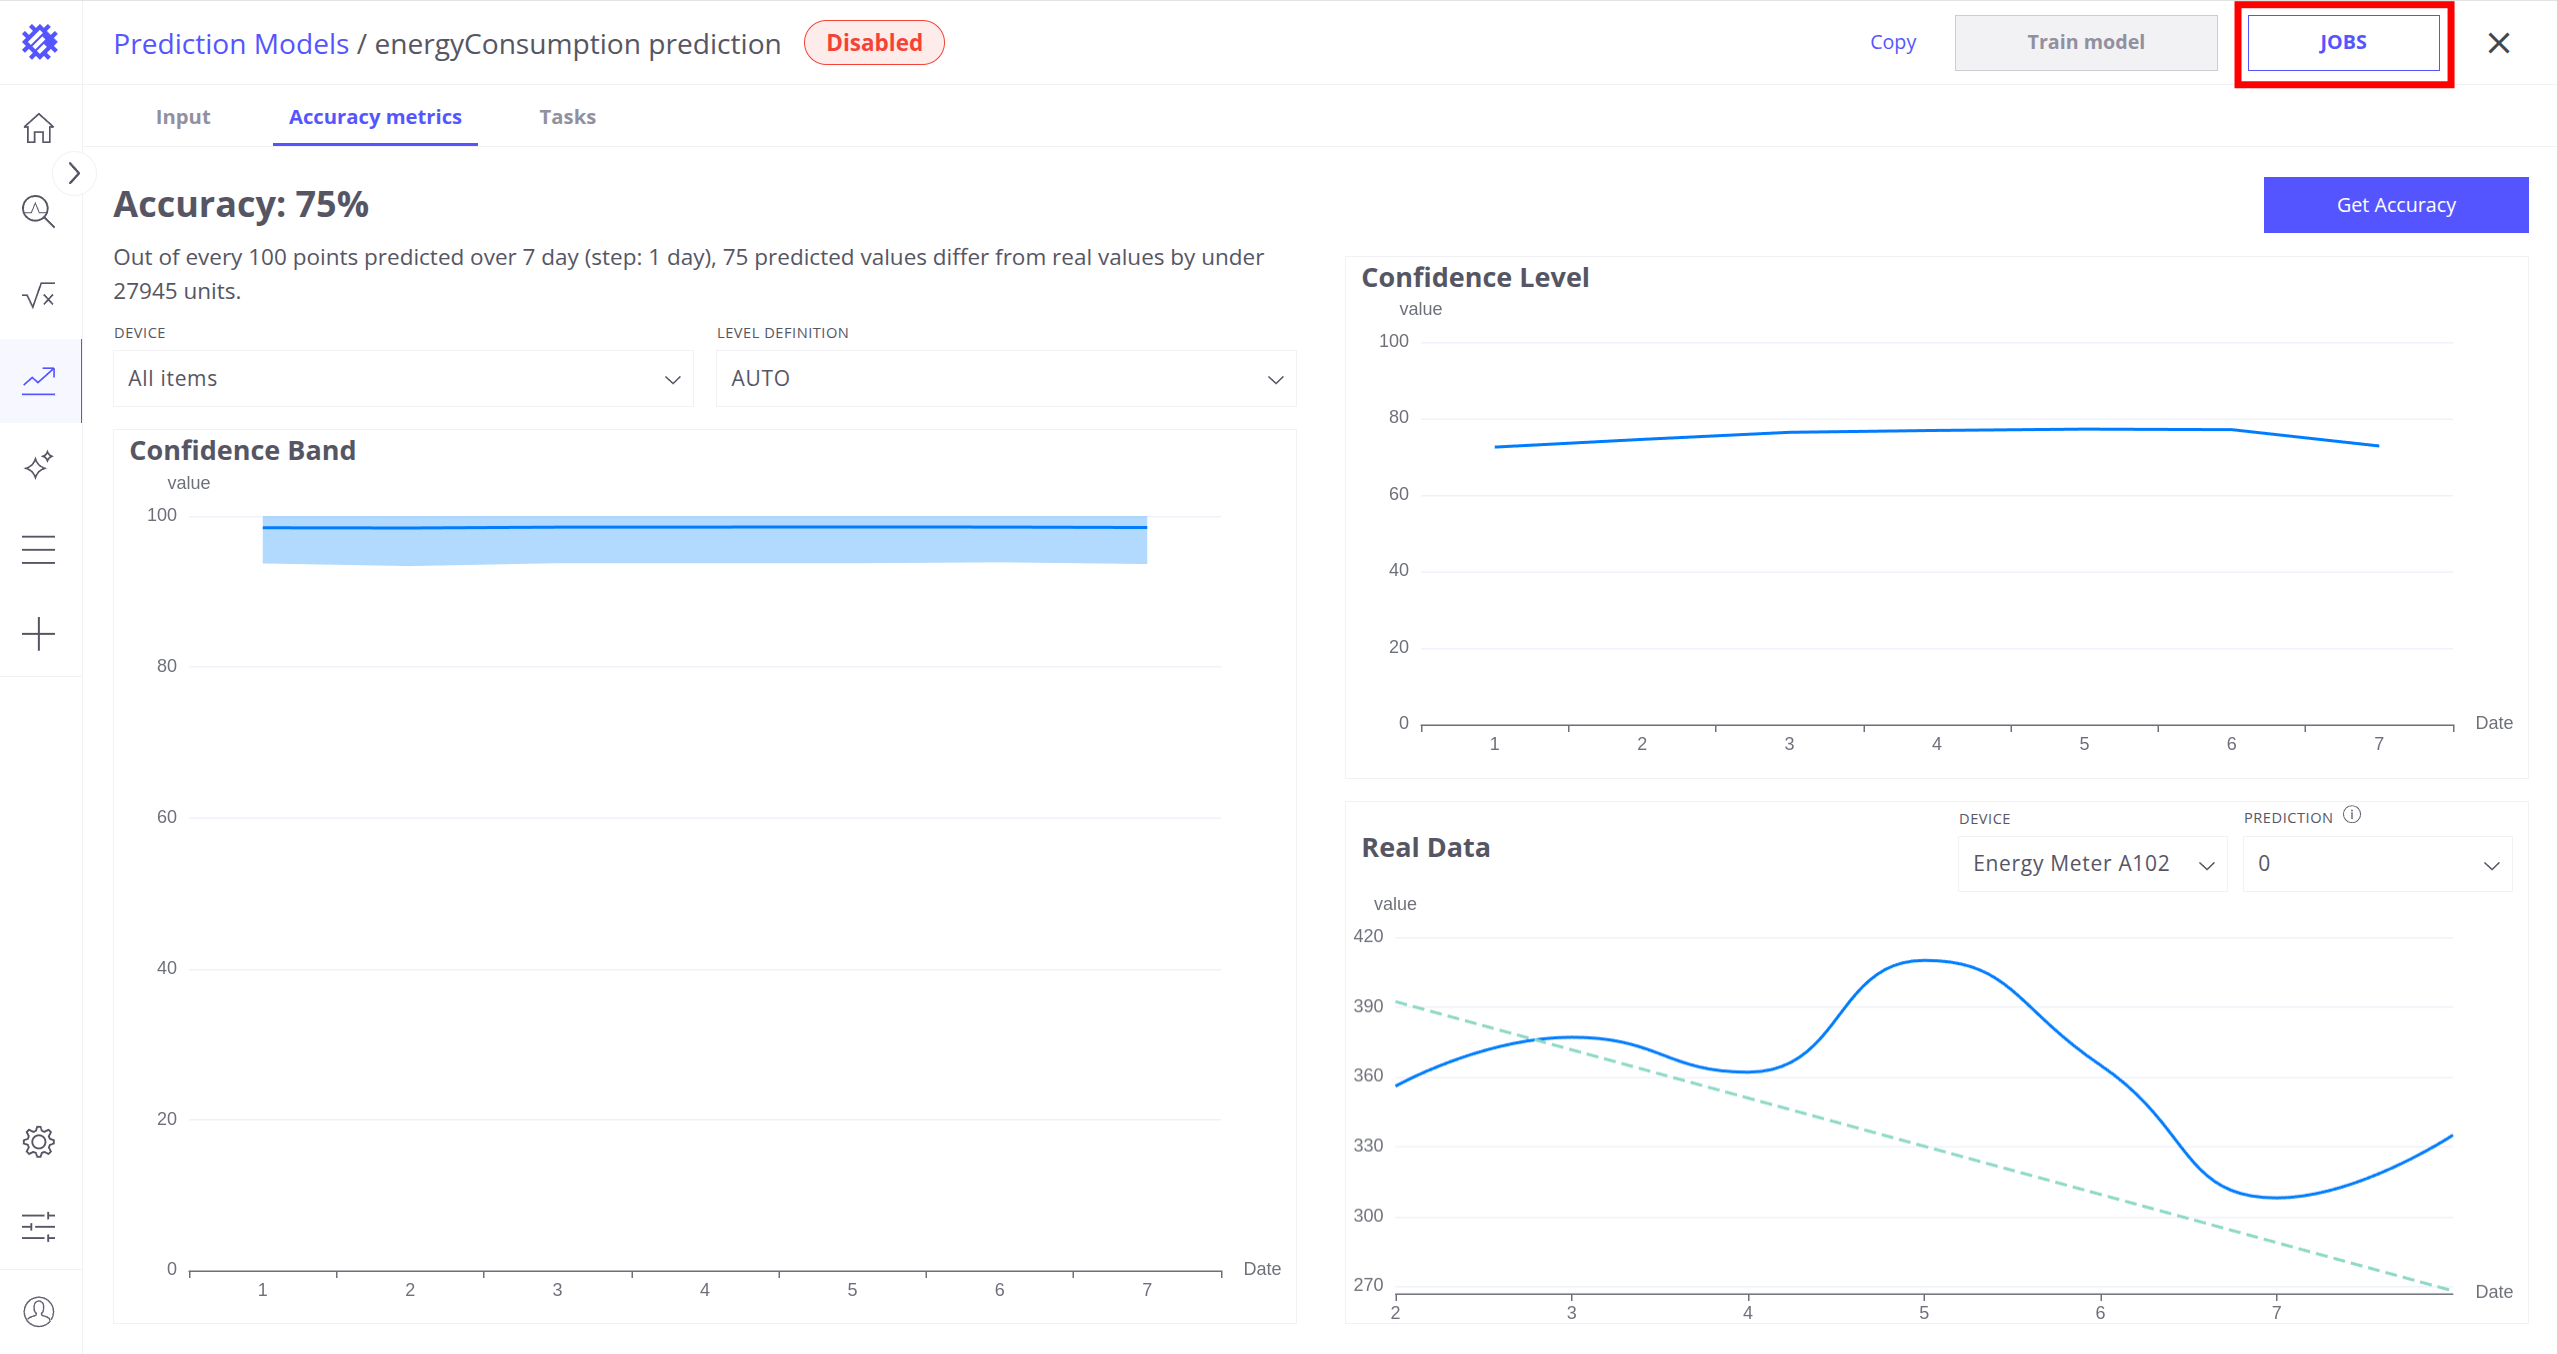
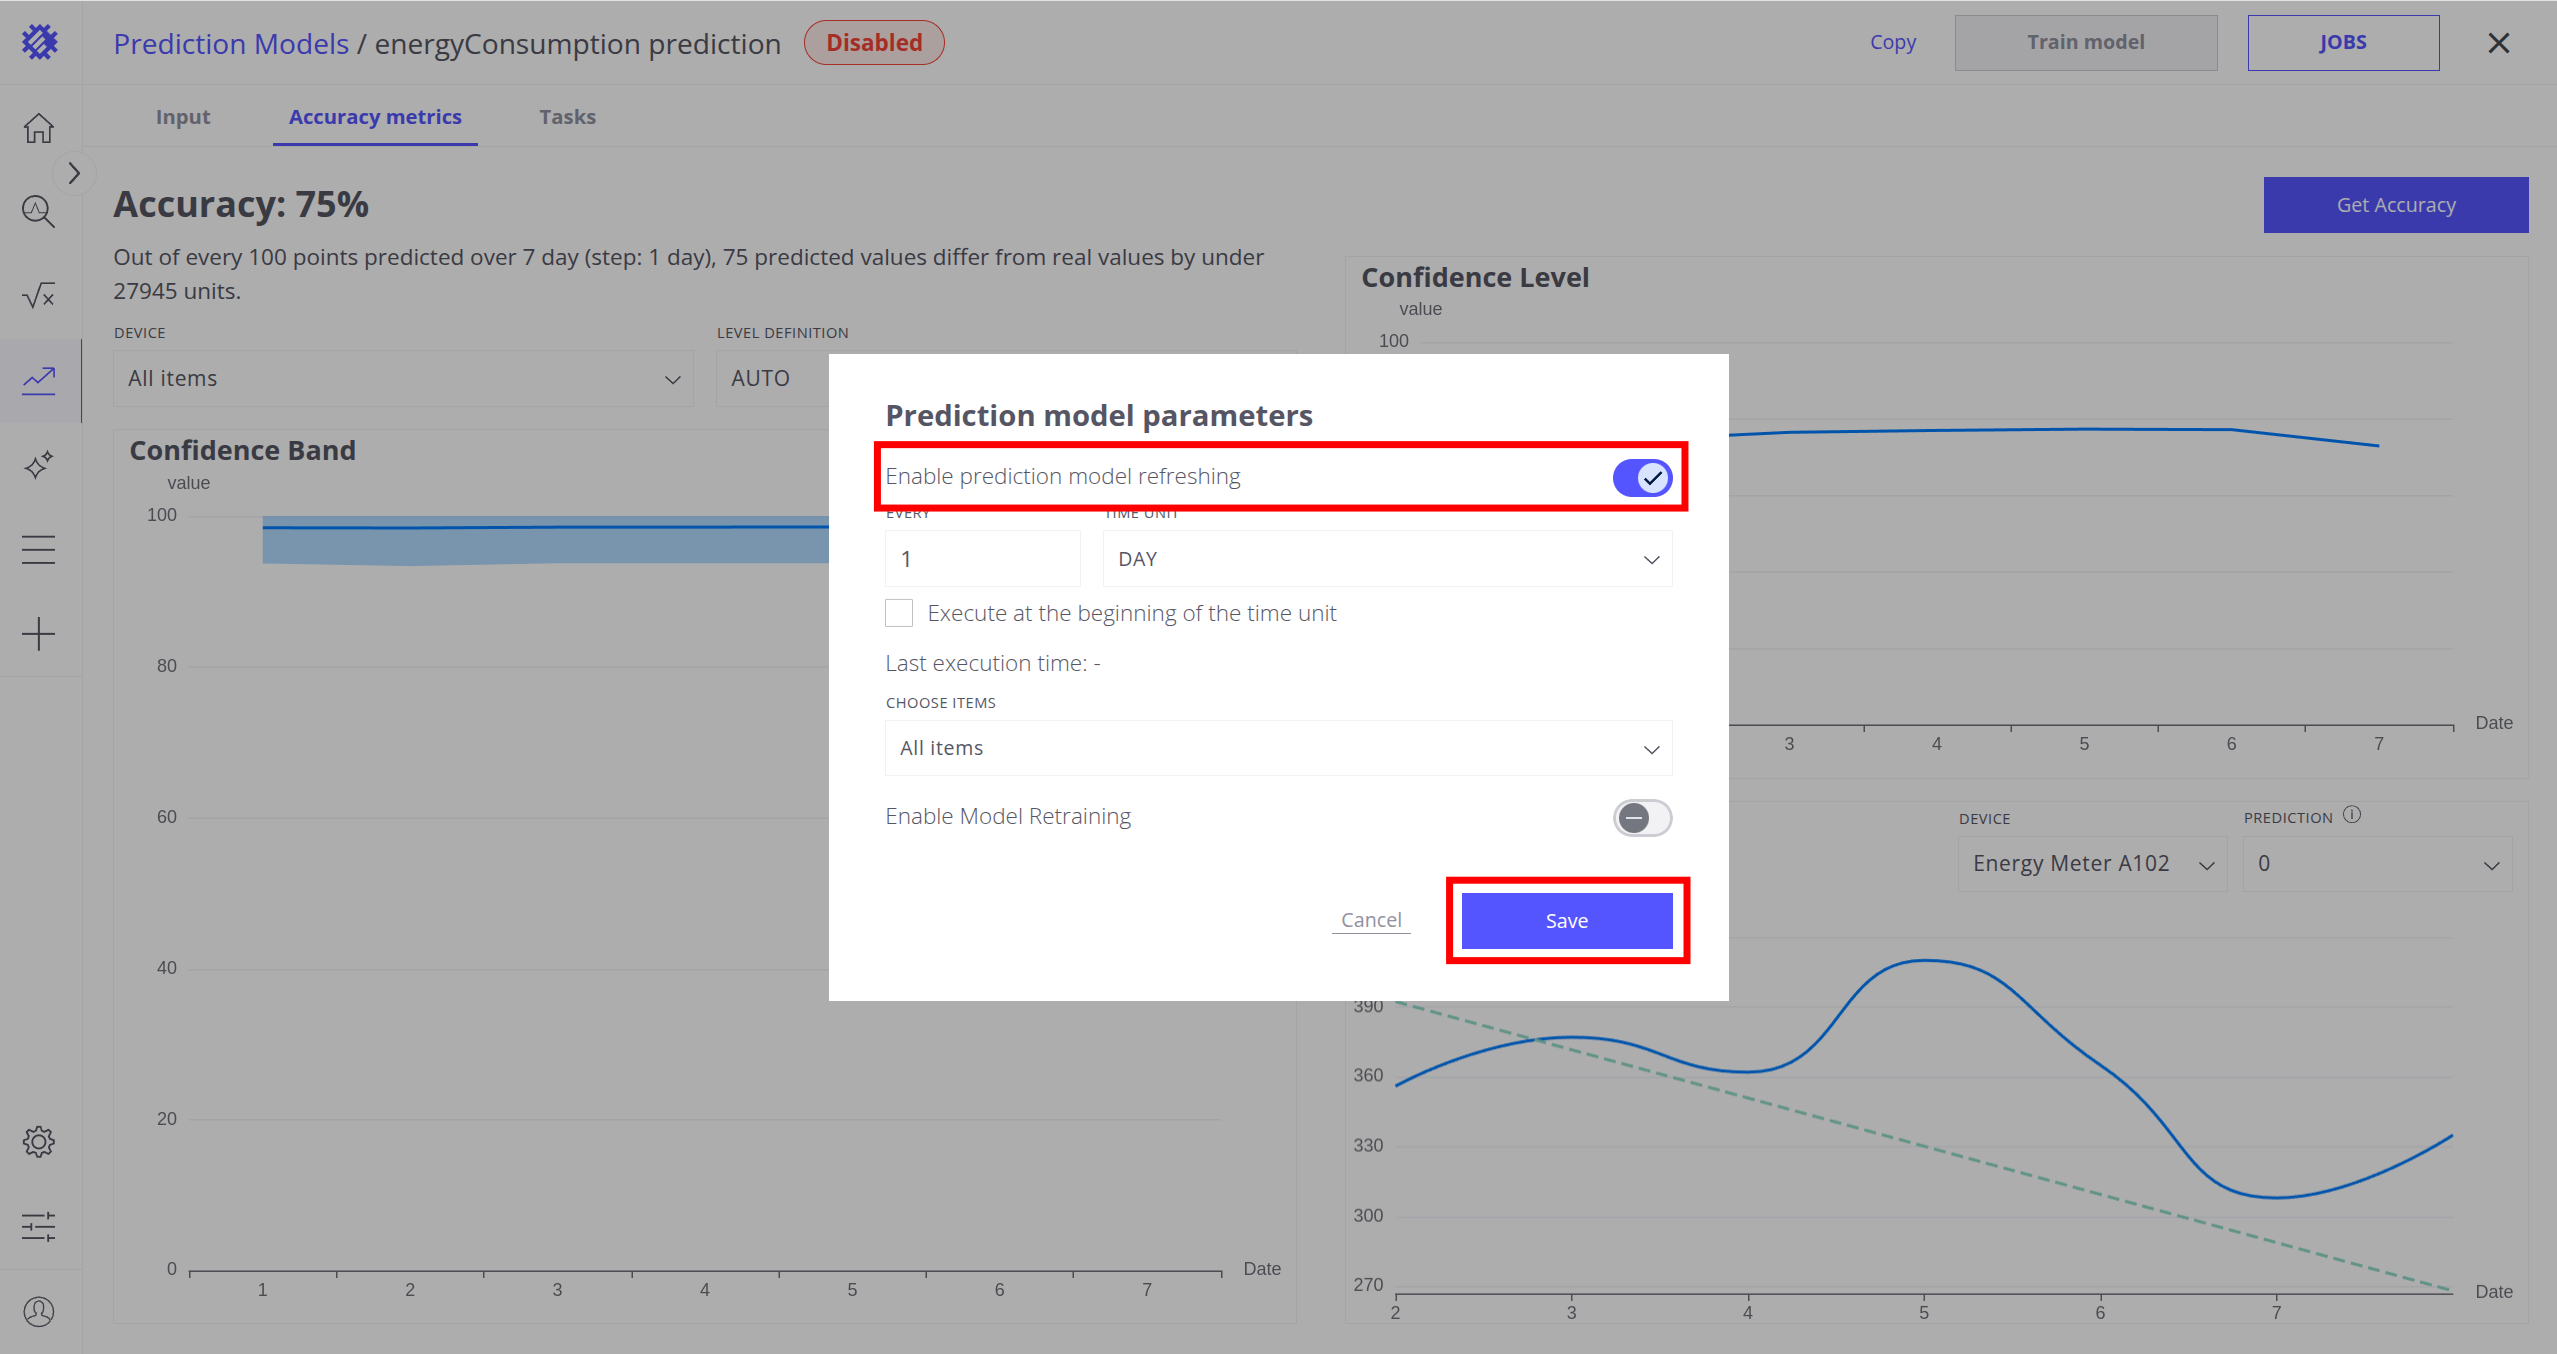
- 点击 作业按钮;在弹窗中启用预测模型刷新,并点击 保存按钮(其余属性可保持默认)
预测模型已就绪。关于预测模型的更多说明见此处。
创建带预测的视图
接下来在新建视图中使用已创建的预测模型。
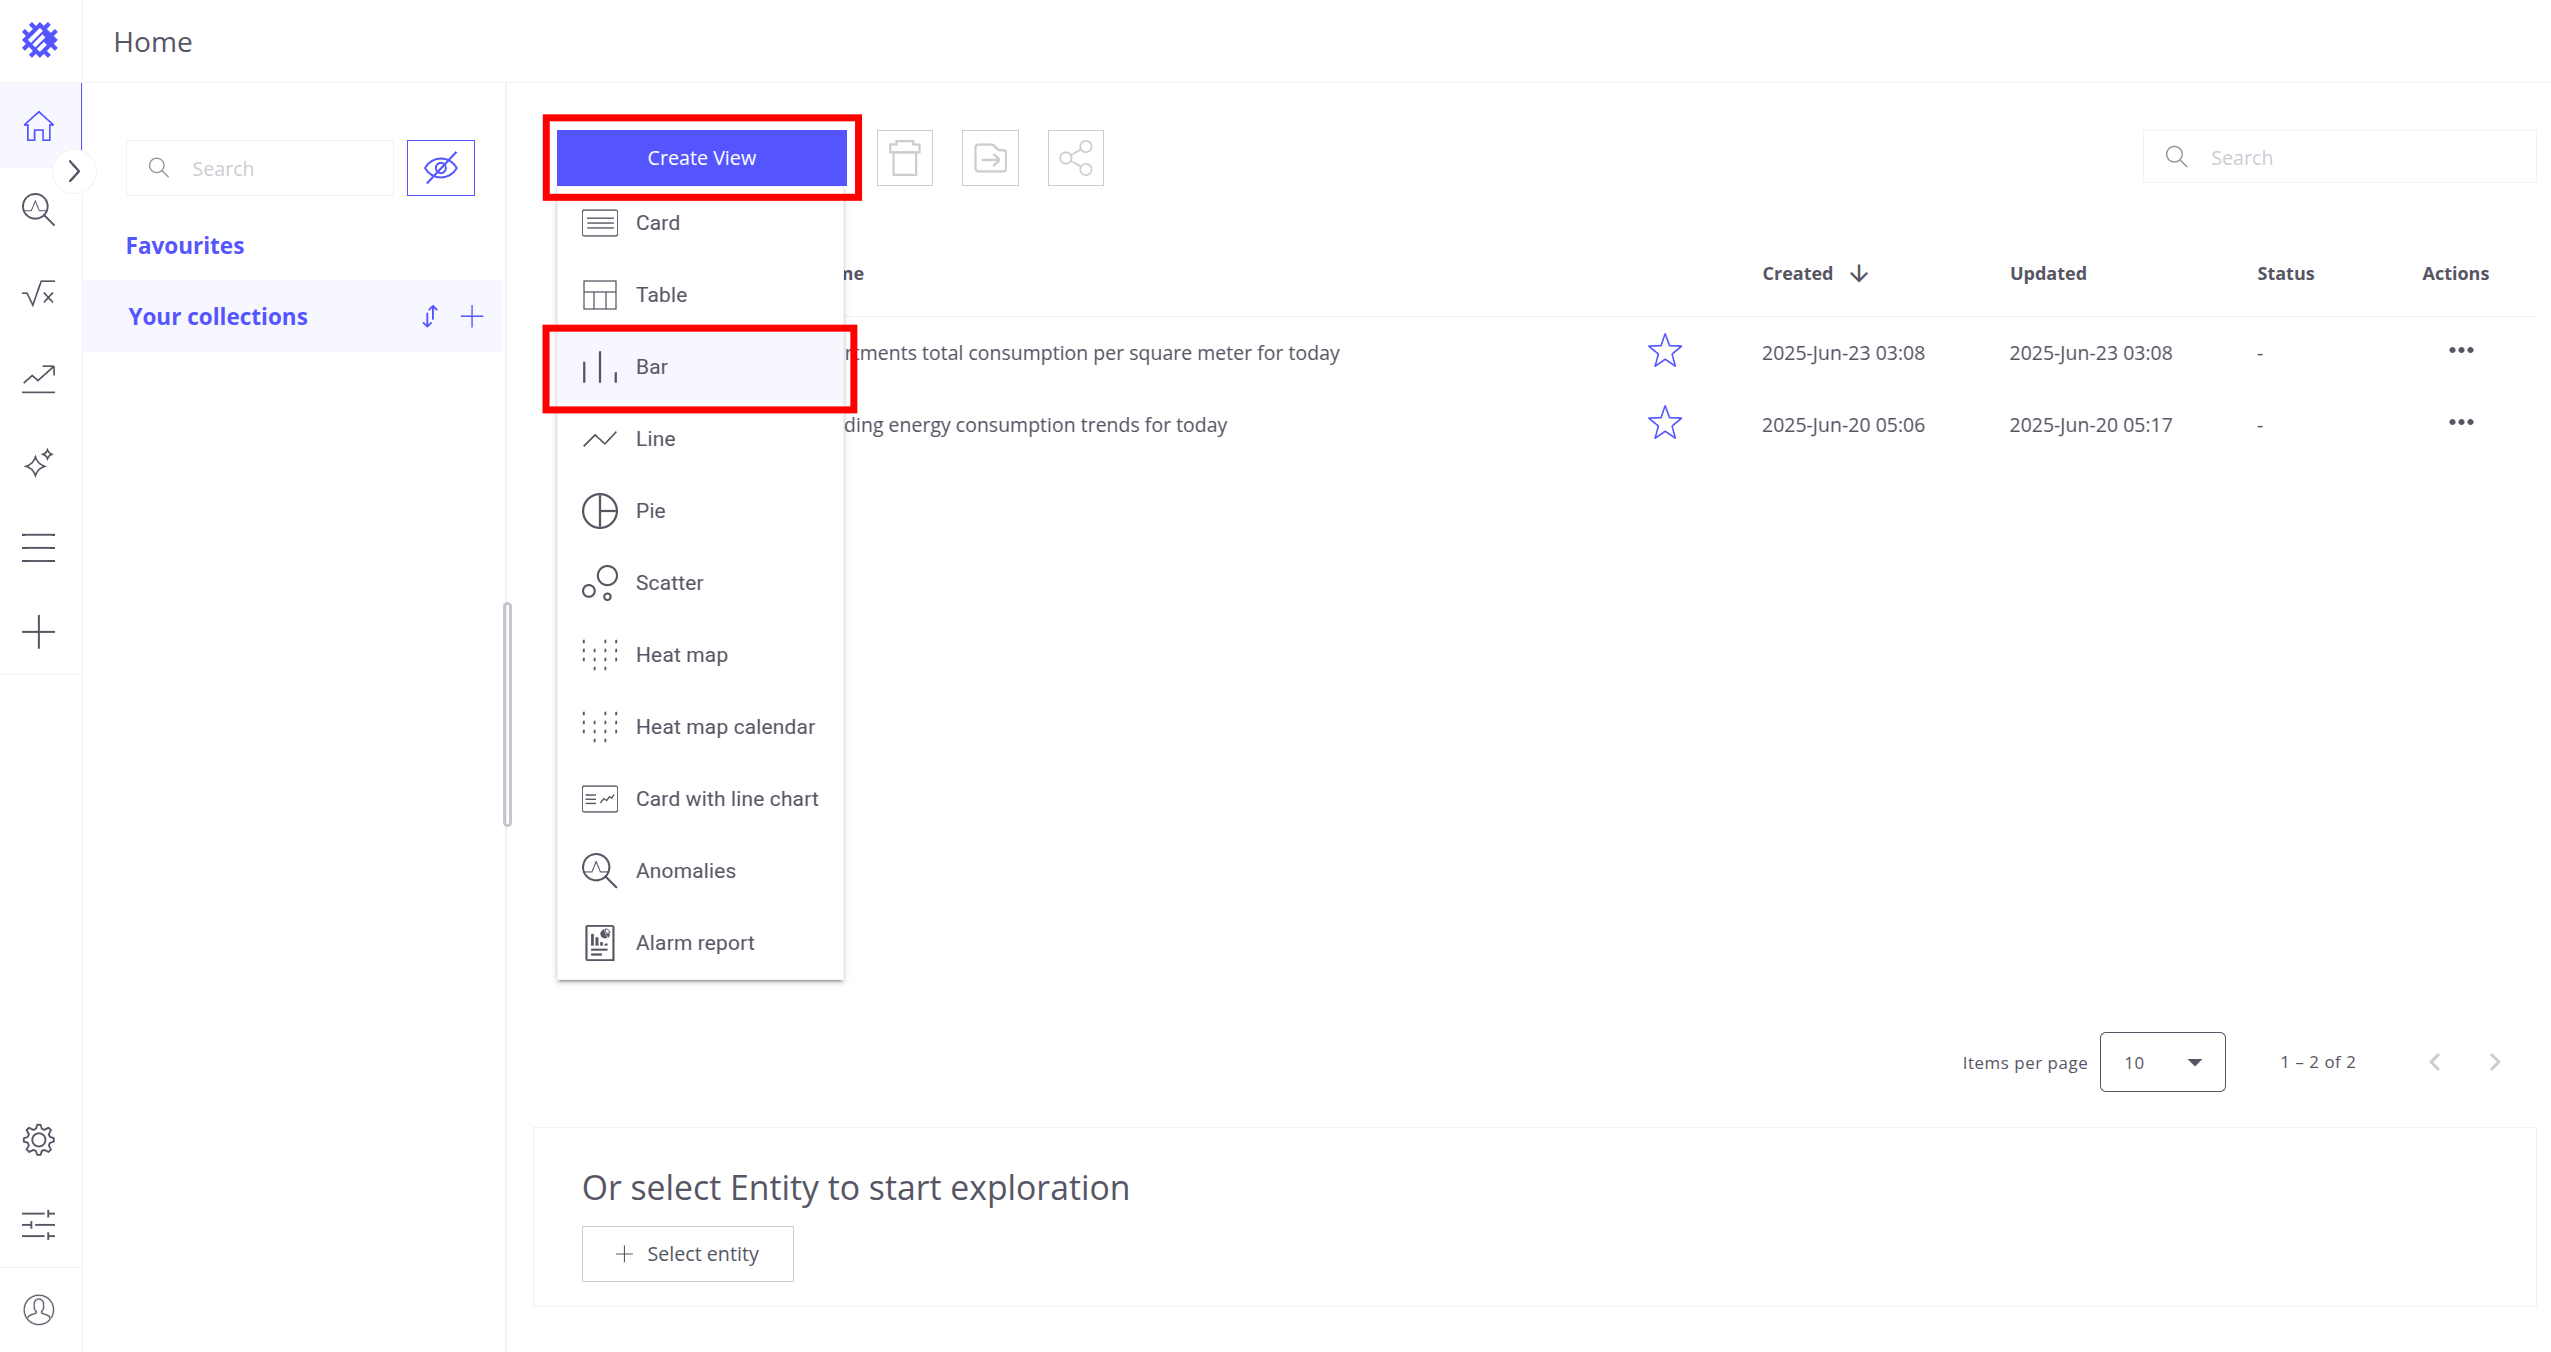
- 点击 创建视图按钮,选择 柱状图
为各区域添加所需字段:
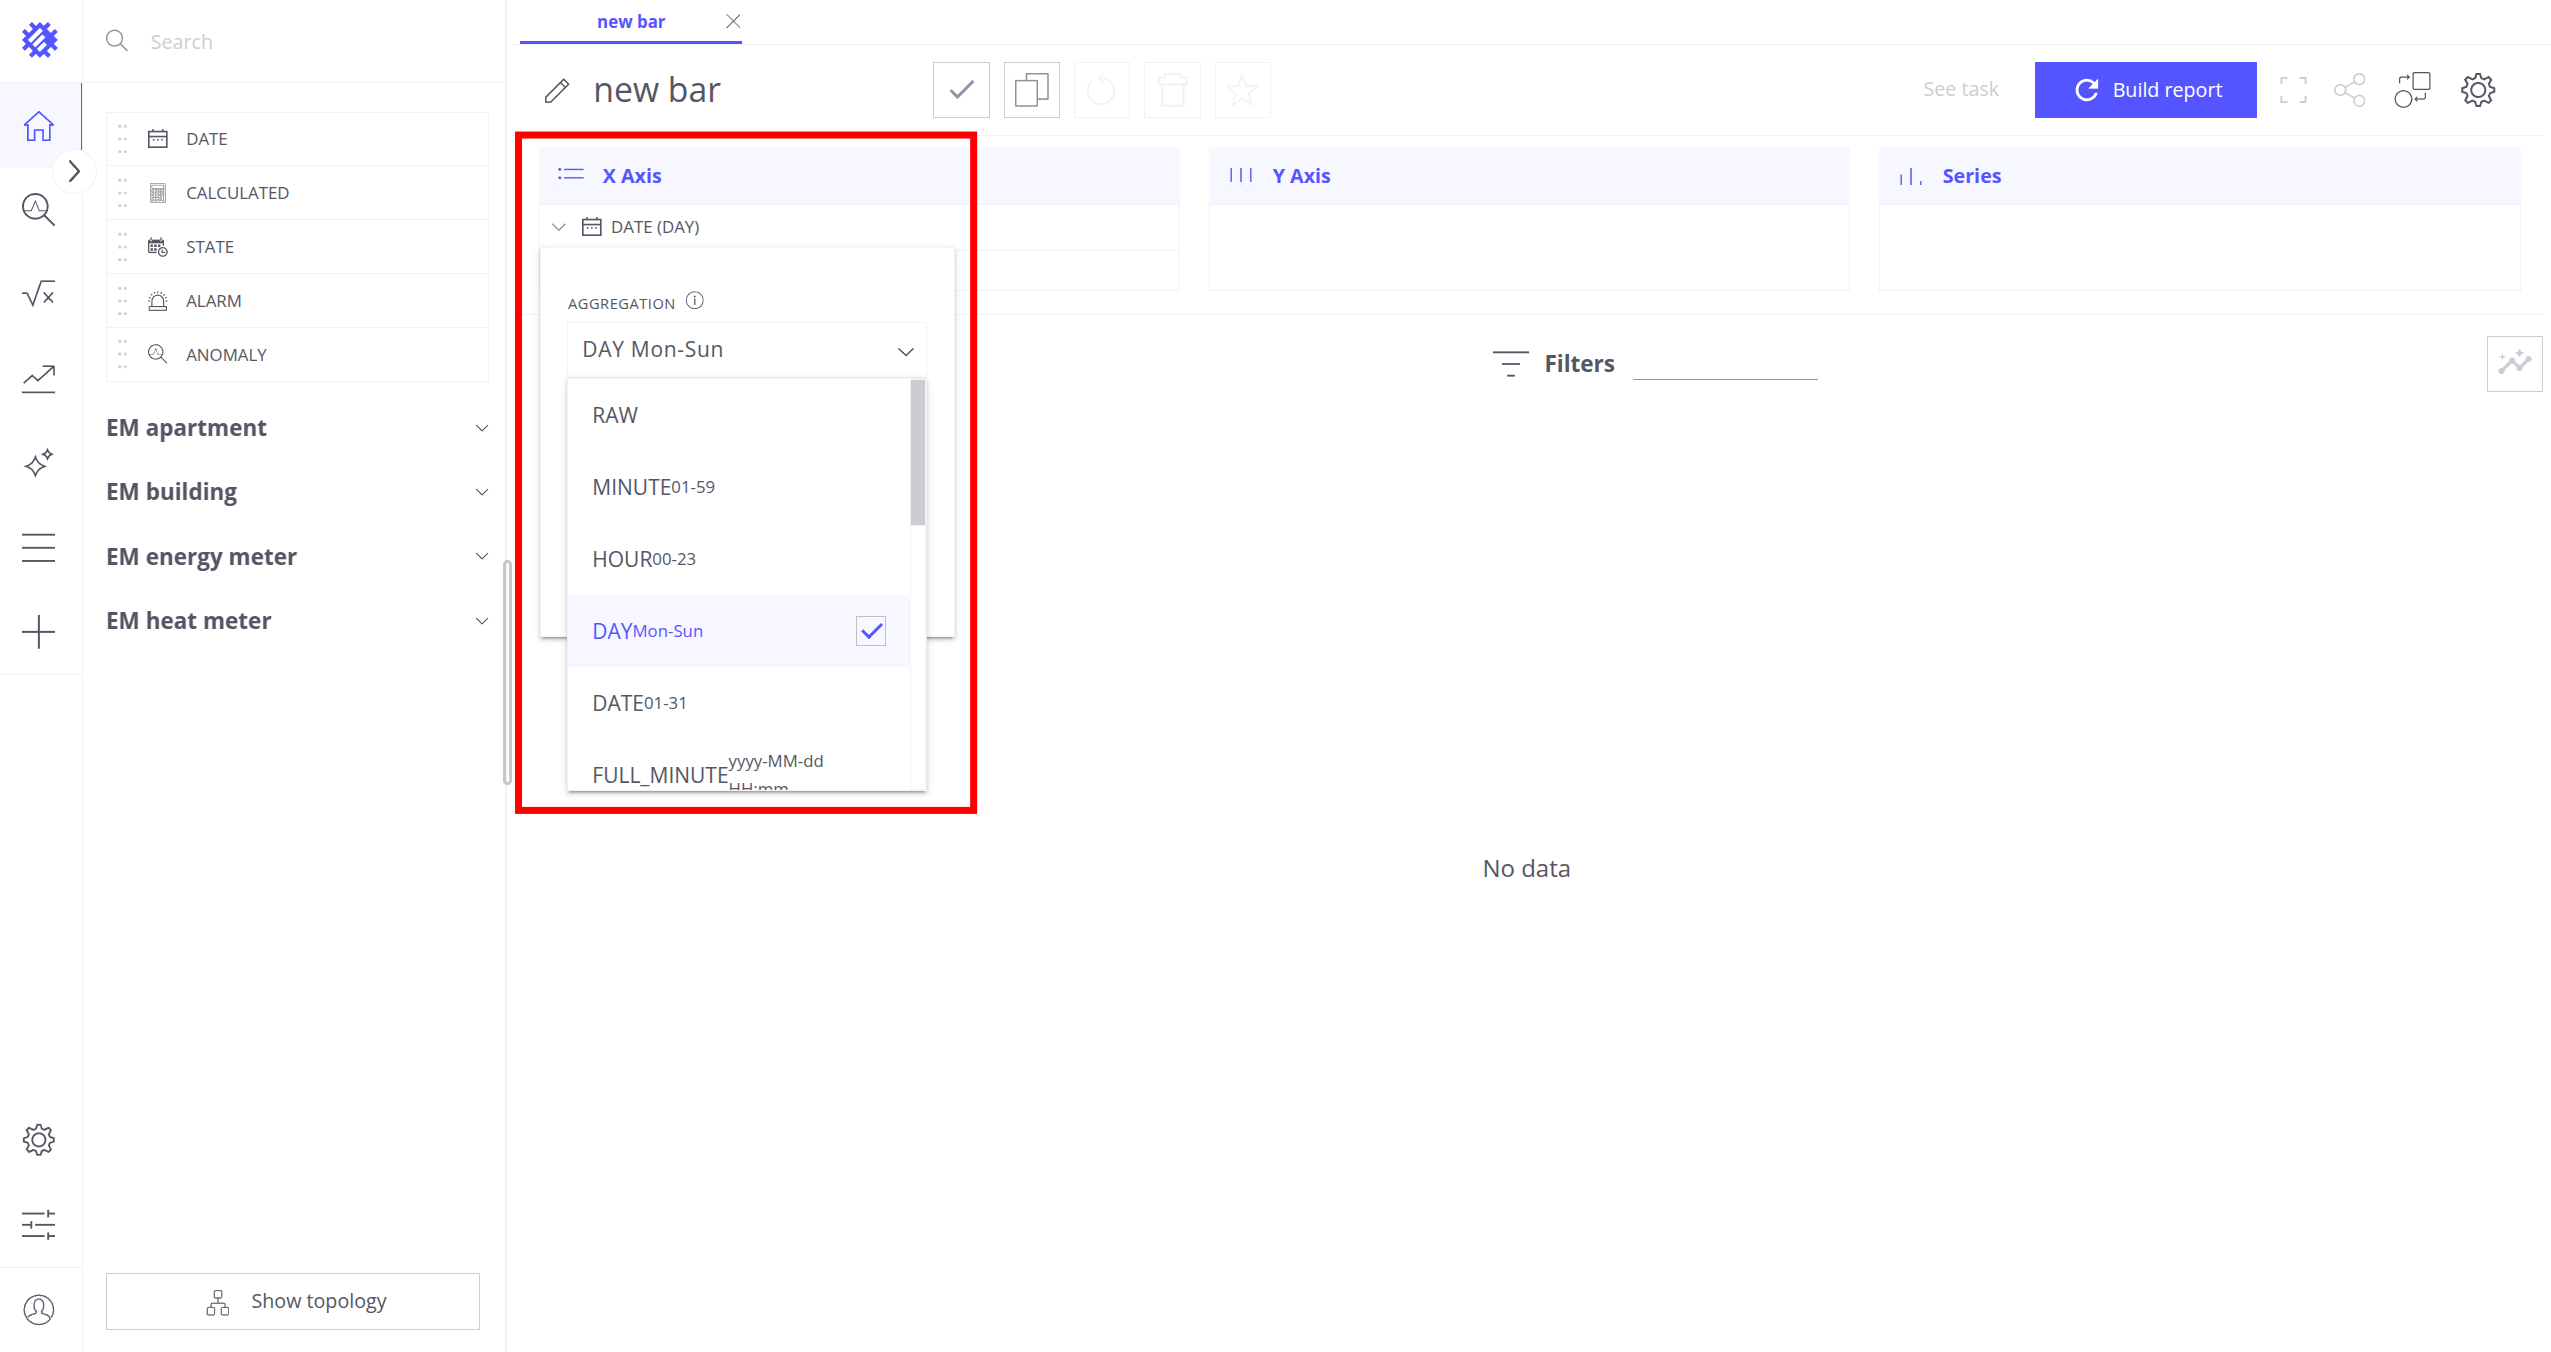
- 在 X 轴区域添加:
Date (DAY Mon-Sun)
(在 X 轴区域点击日期字段,通过下拉选择聚合方式,点击空白处关闭)
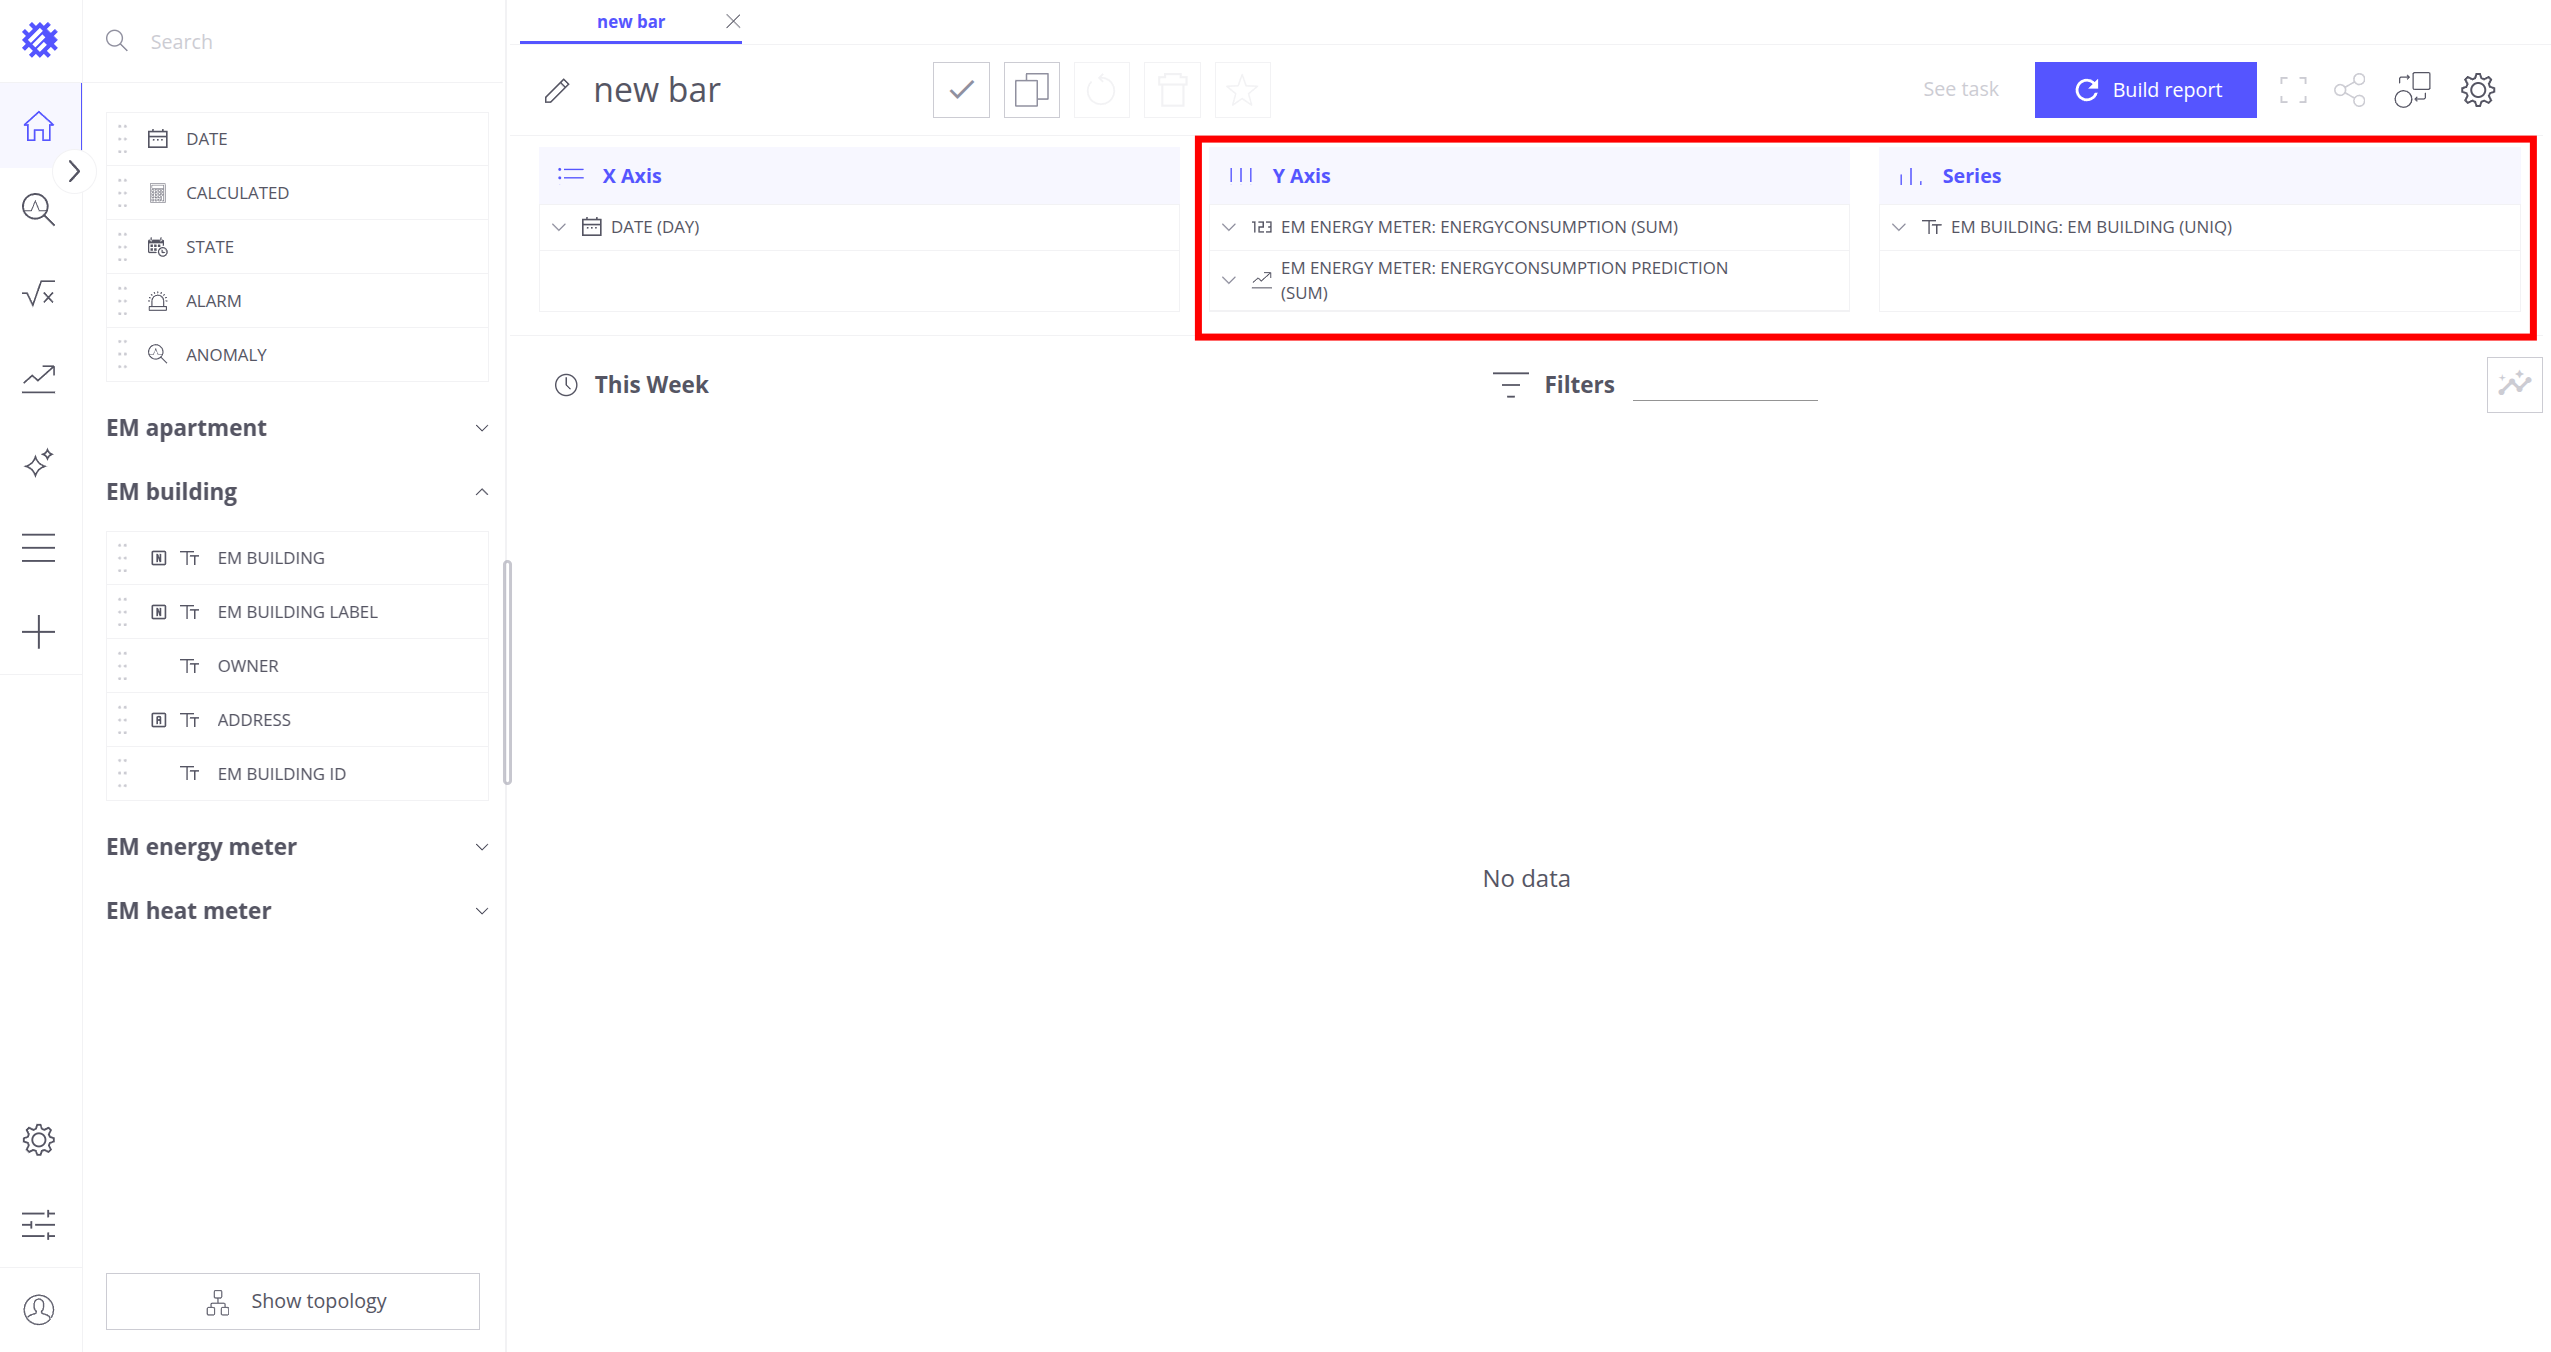
- 在 Y 轴区域添加:
EM energy meter.energyConsumptionEM energy meter.Energy Consumption Forecast(启用预测模型后该字段会显示)
- 在 系列区域添加:
EM building.EM building
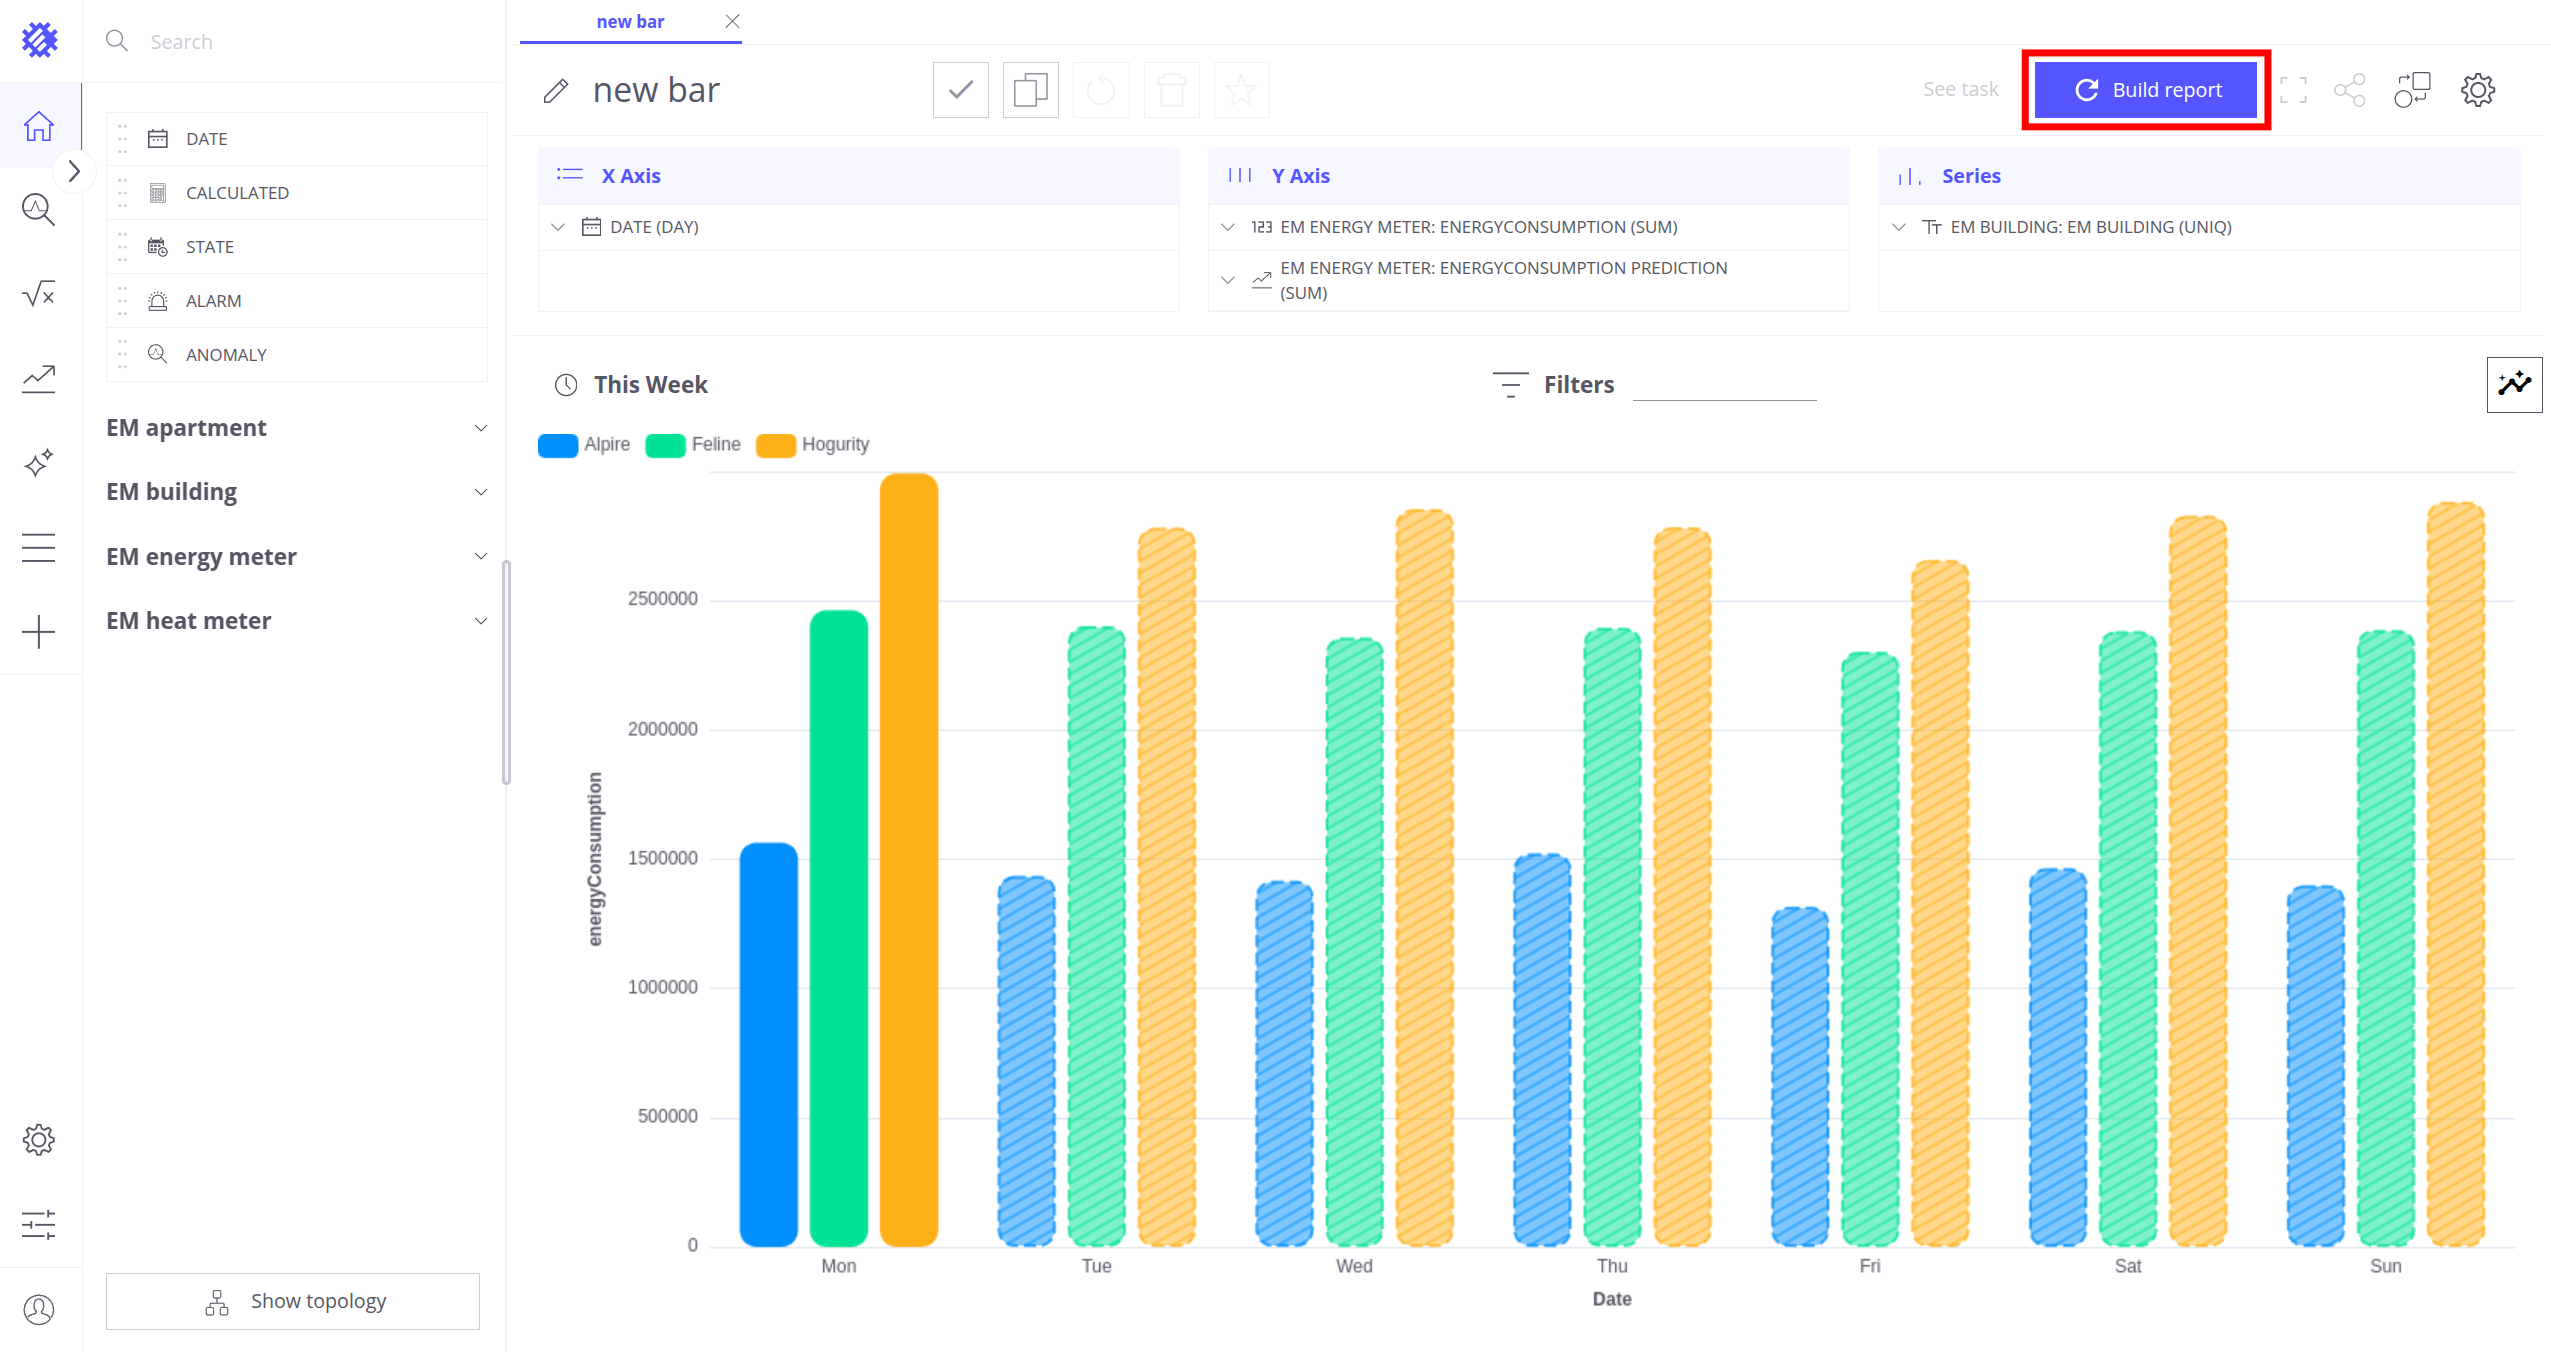
构建并保存视图:
- 点击 构建报告
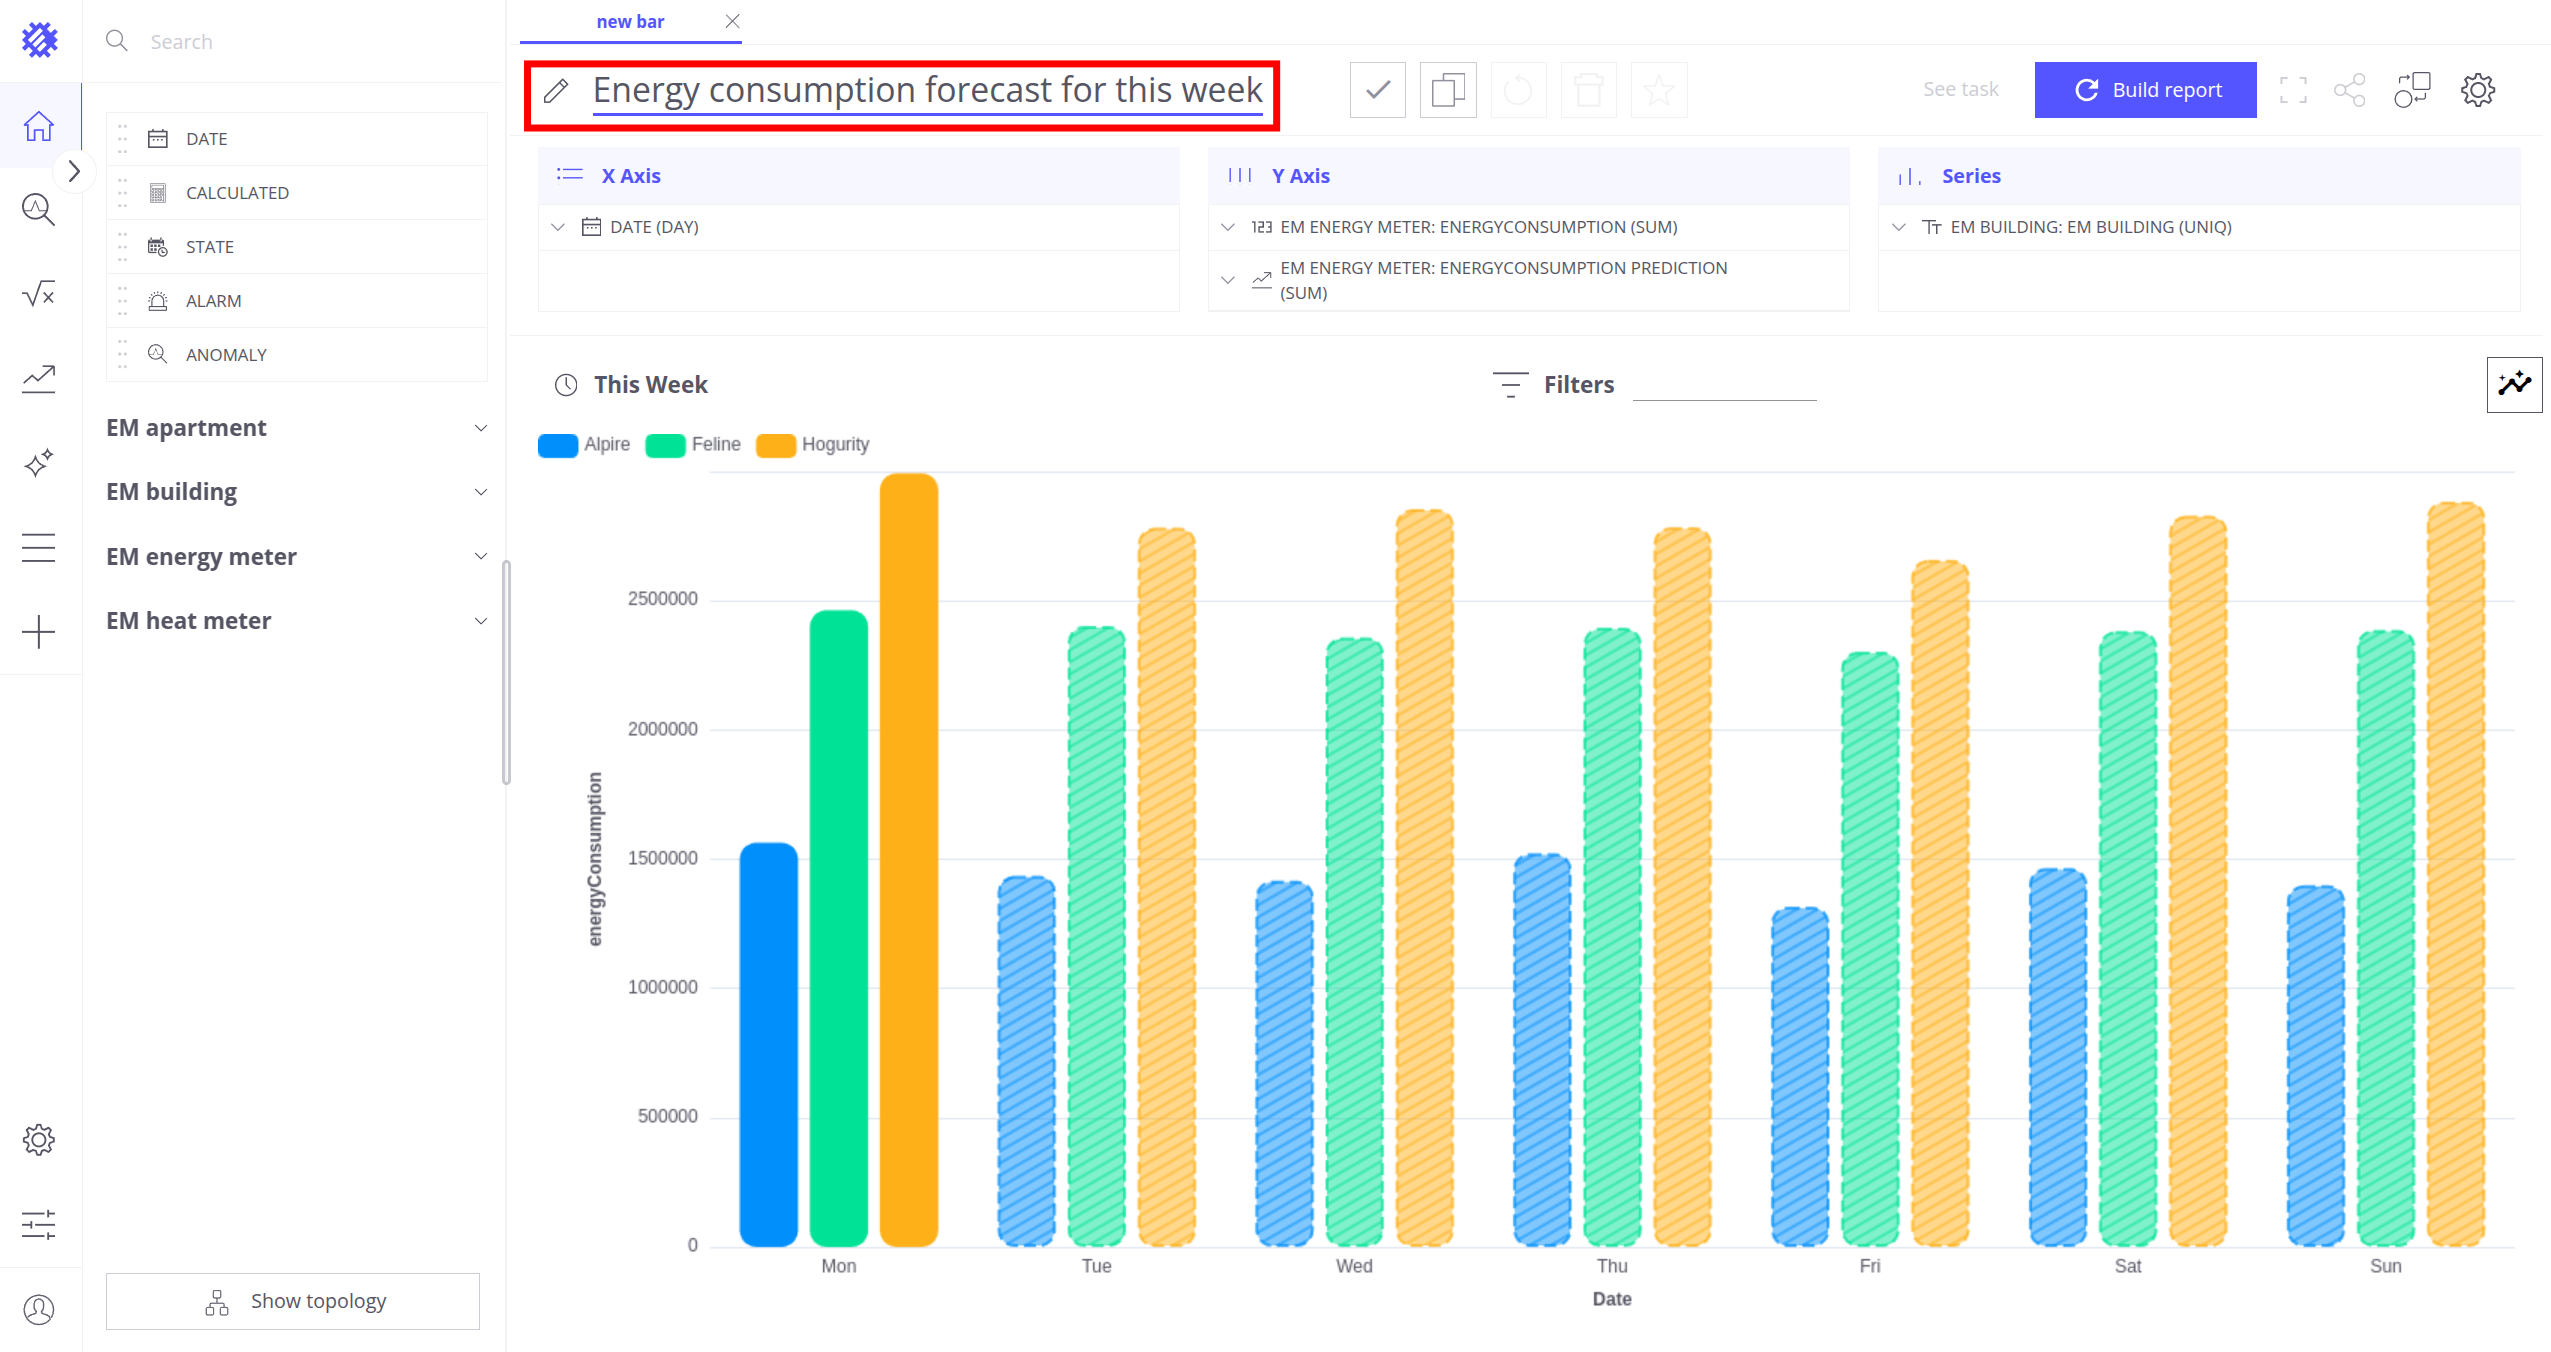
- 将视图重命名为「本周能耗预测」
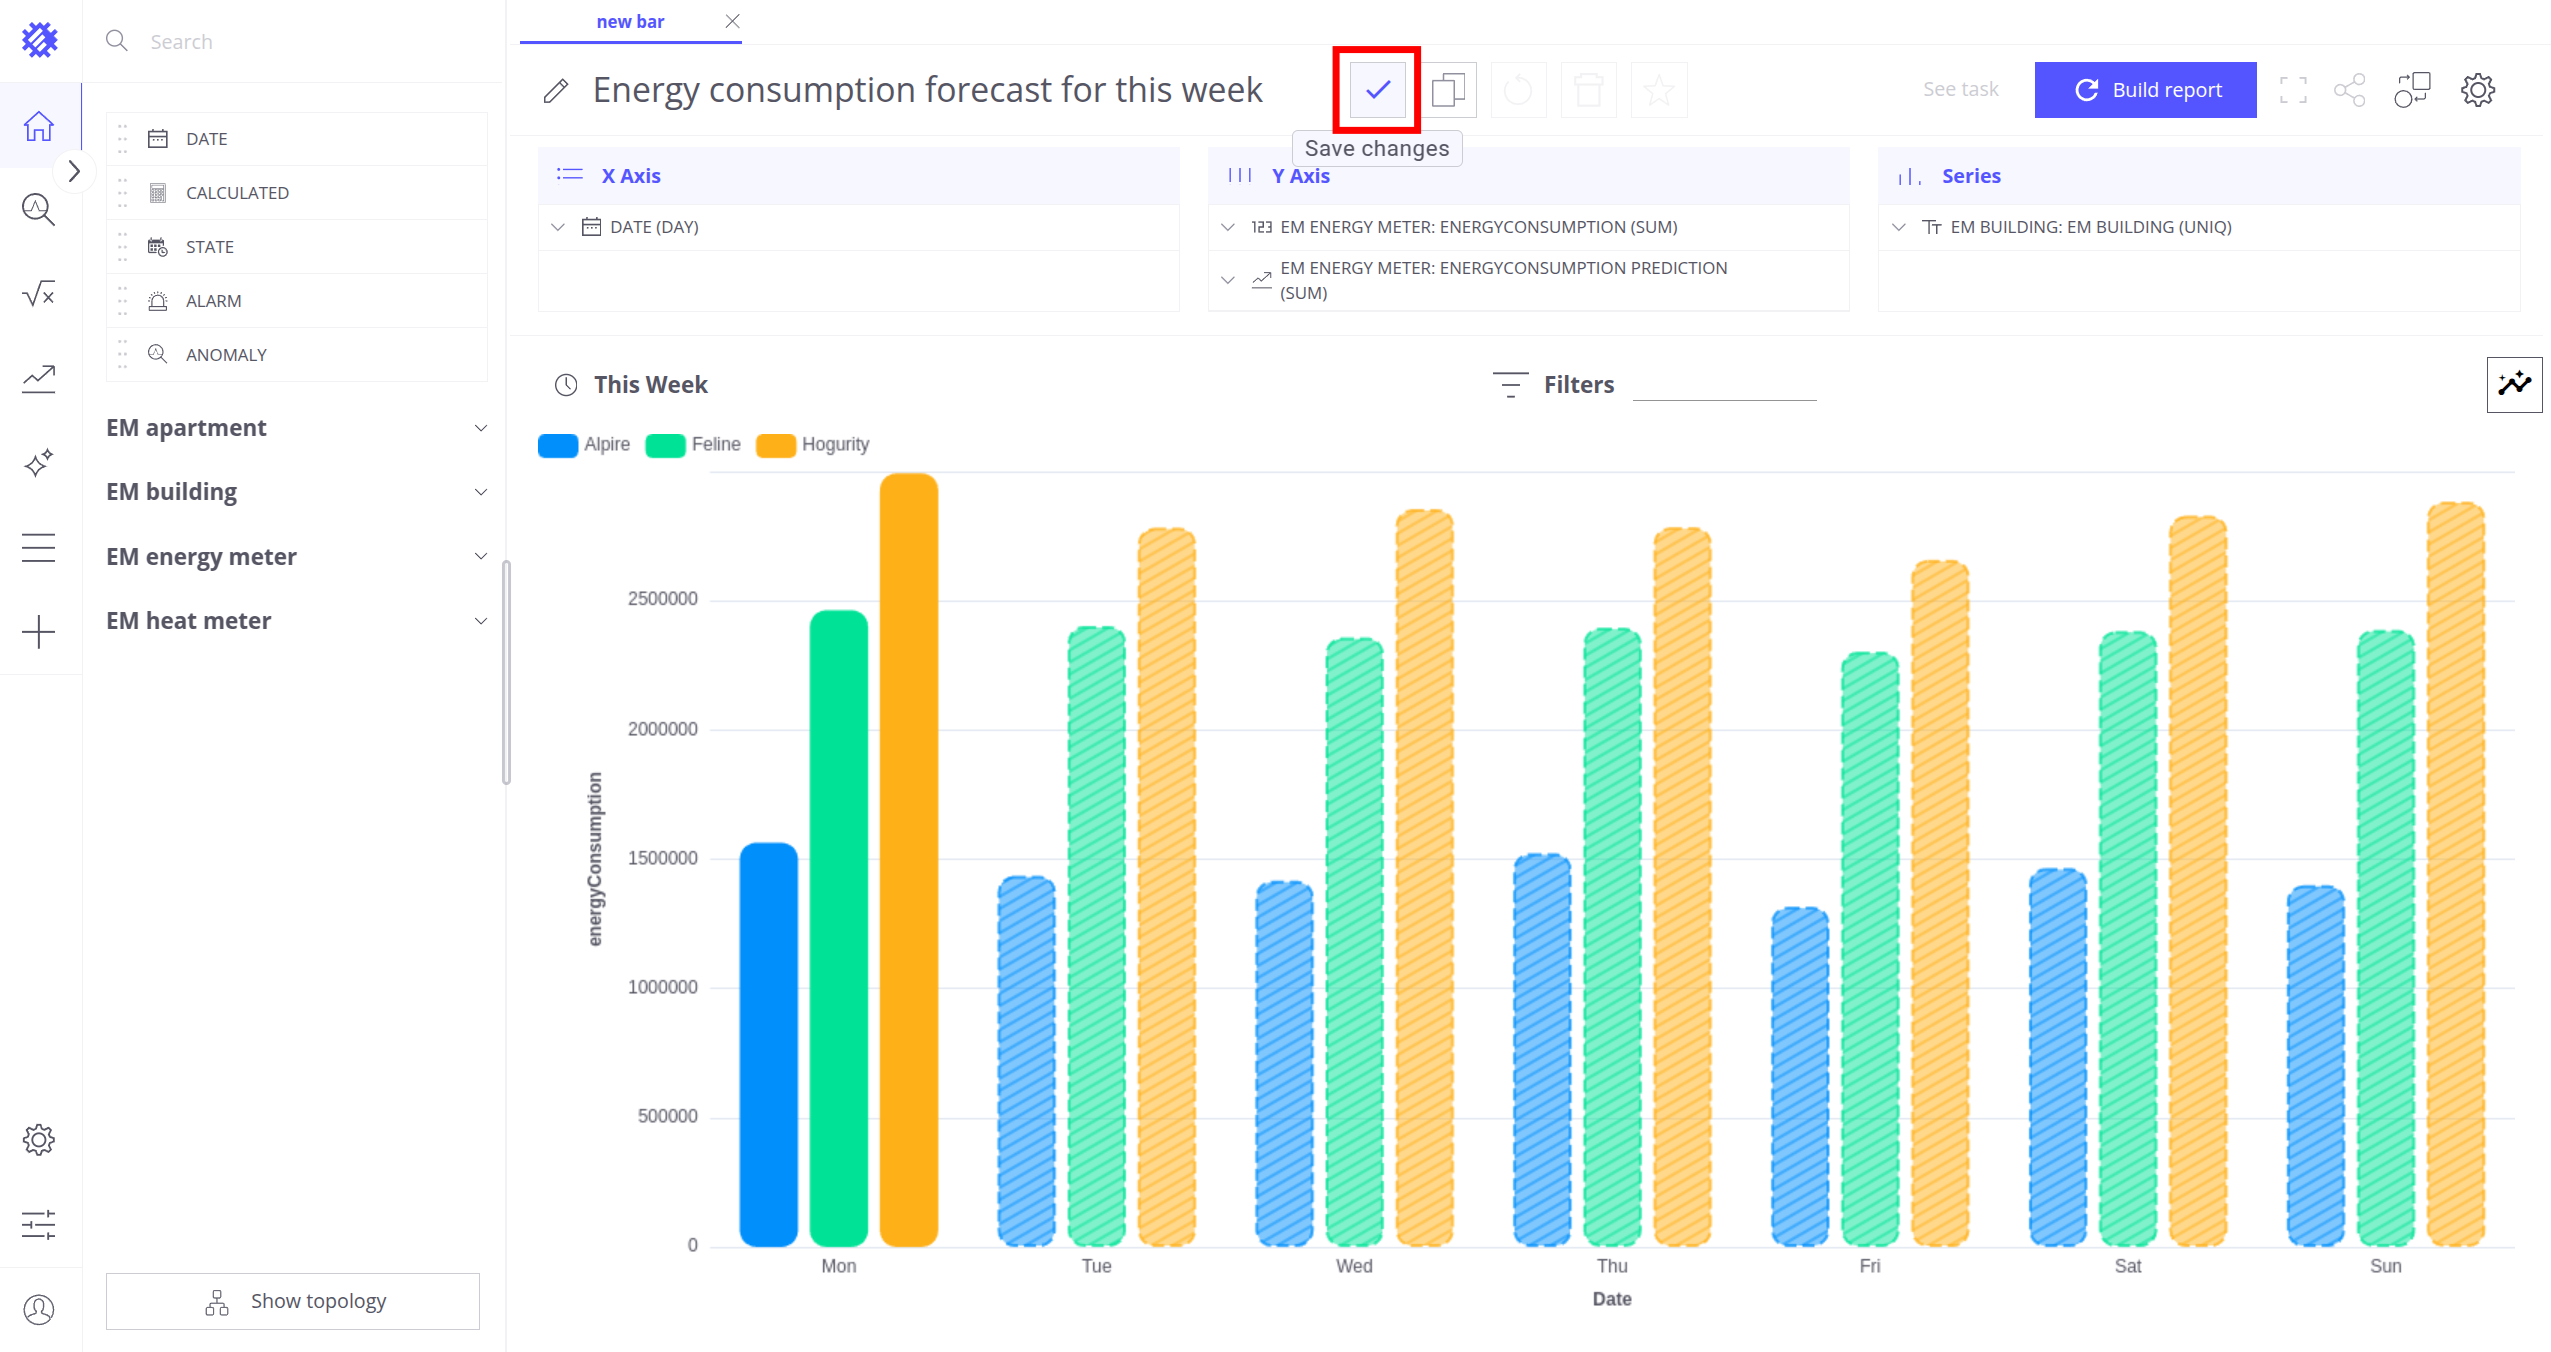
- 点击 保存更改按钮保存图表
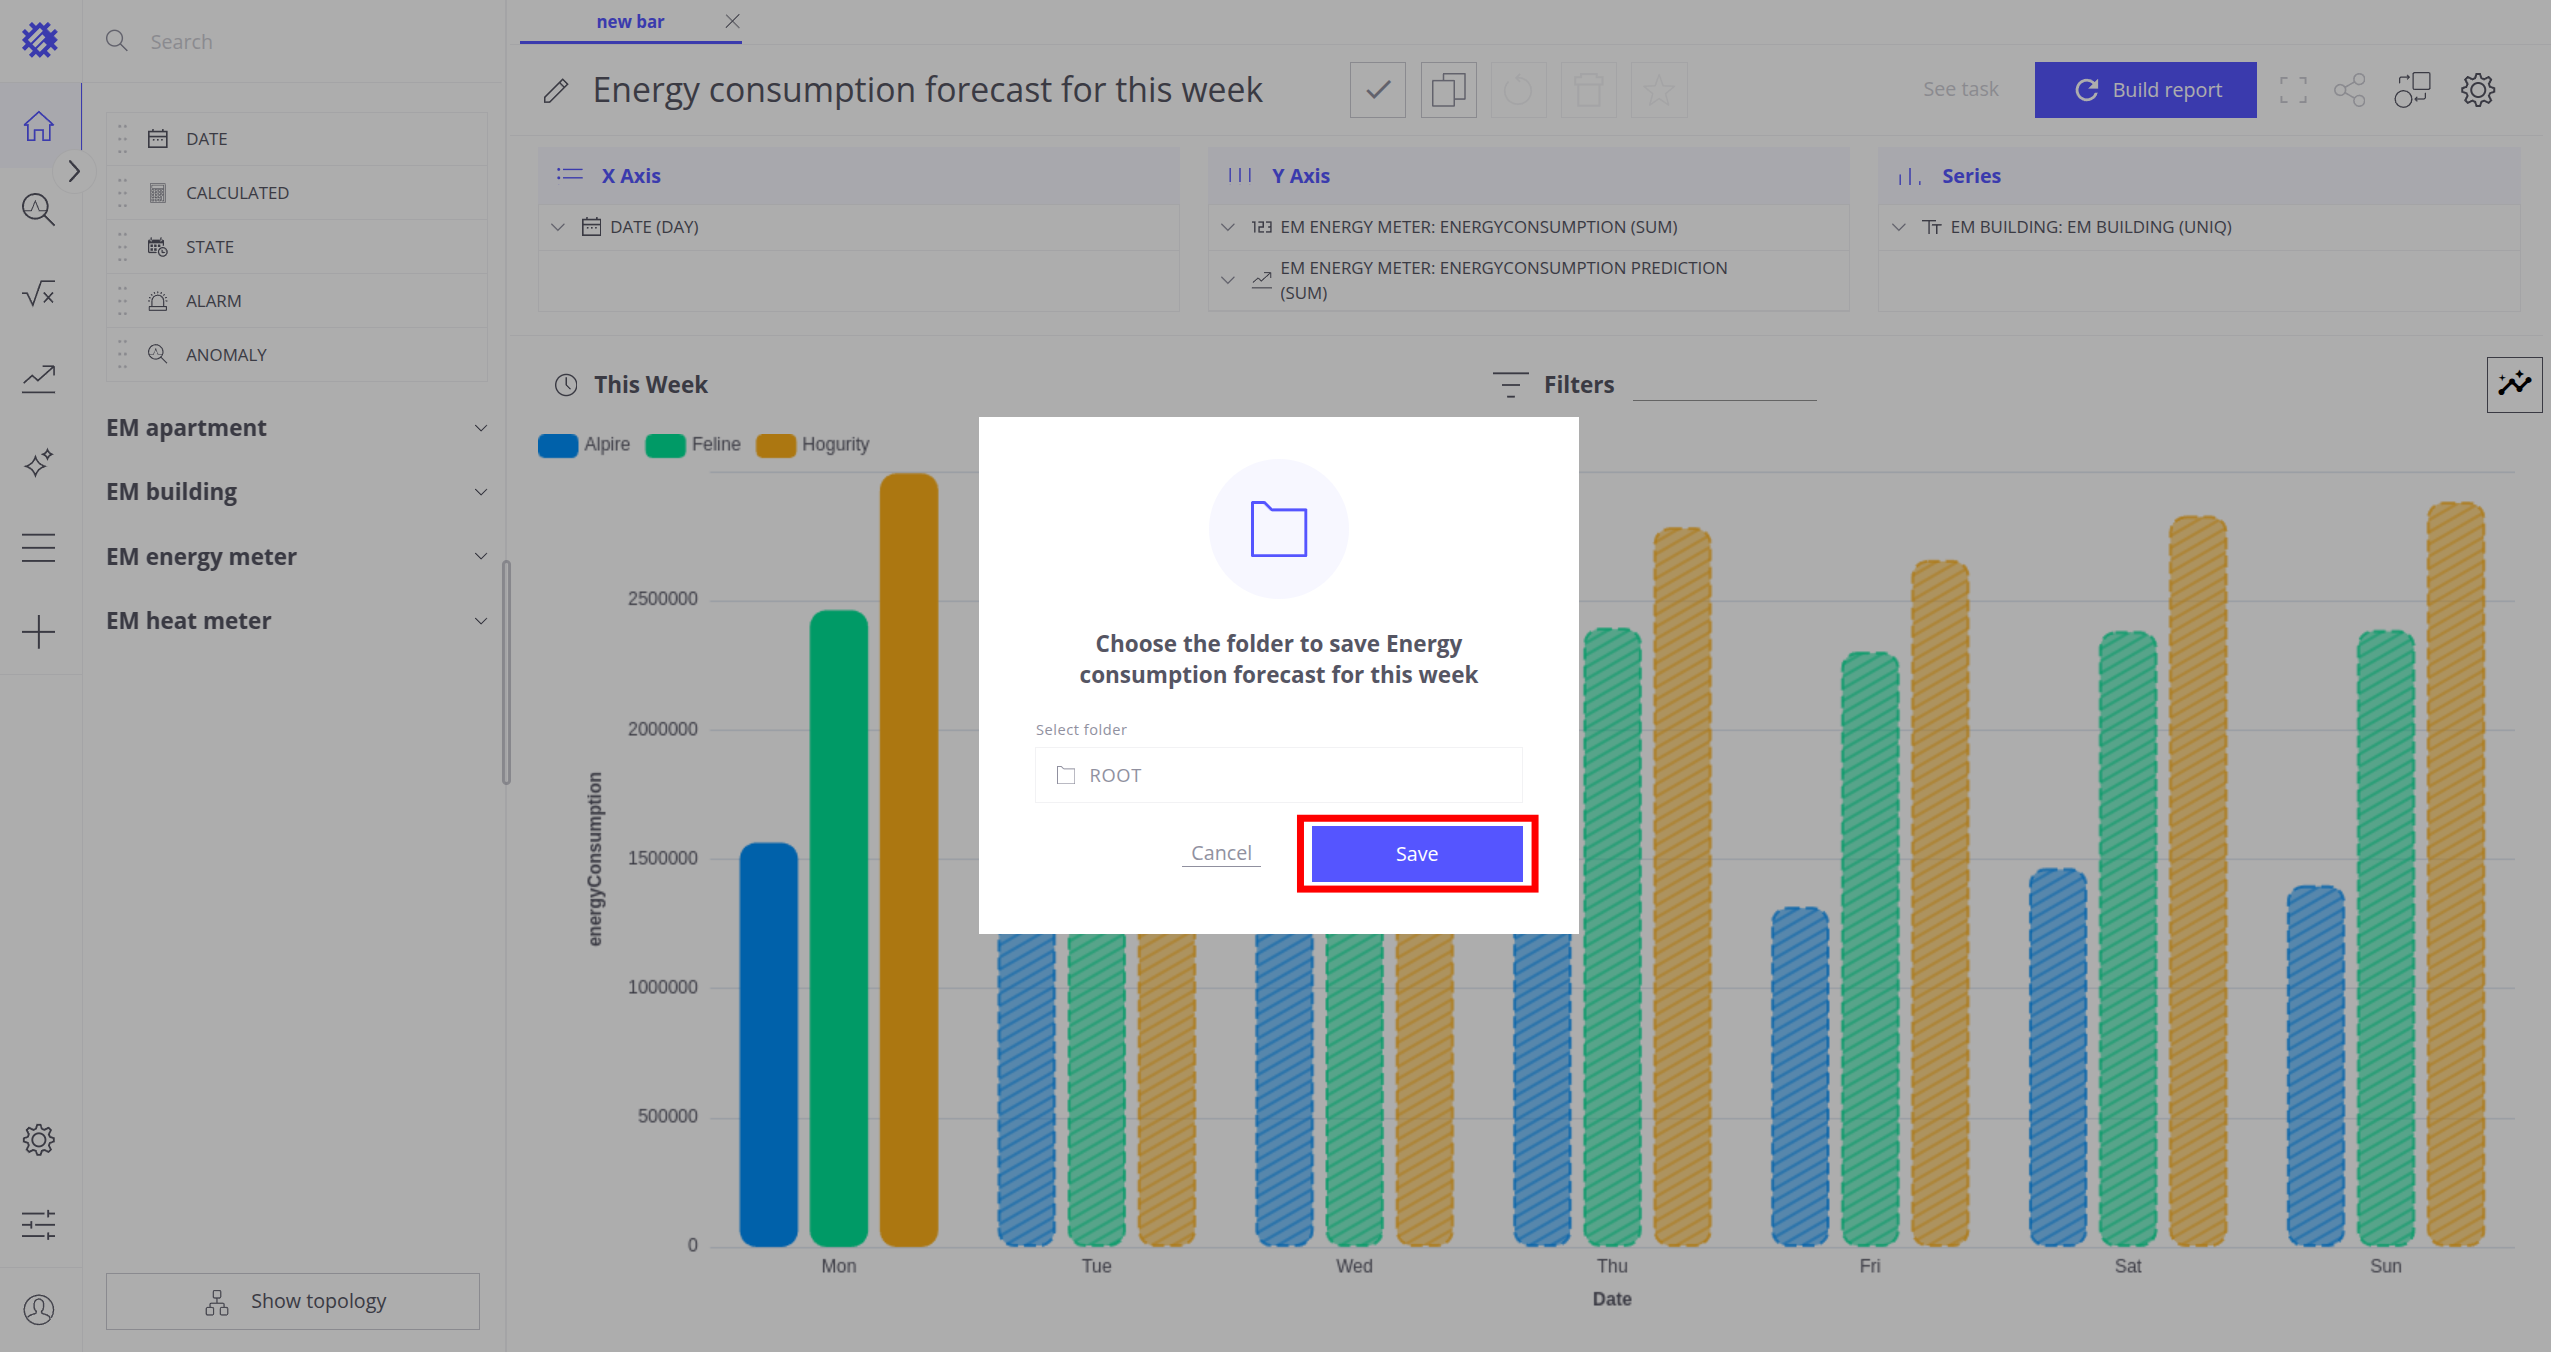
- 在弹窗中点击 保存按钮
也可尝试用折线图构建相同视图进行对比。
其中,各楼栋的历史数据以实心柱显示,预测数据以虚线显示。
步骤 6. 检测能耗异常
Trendz 提供开箱即用的异常检测功能。接下来在能耗遥测中检测异常。
-
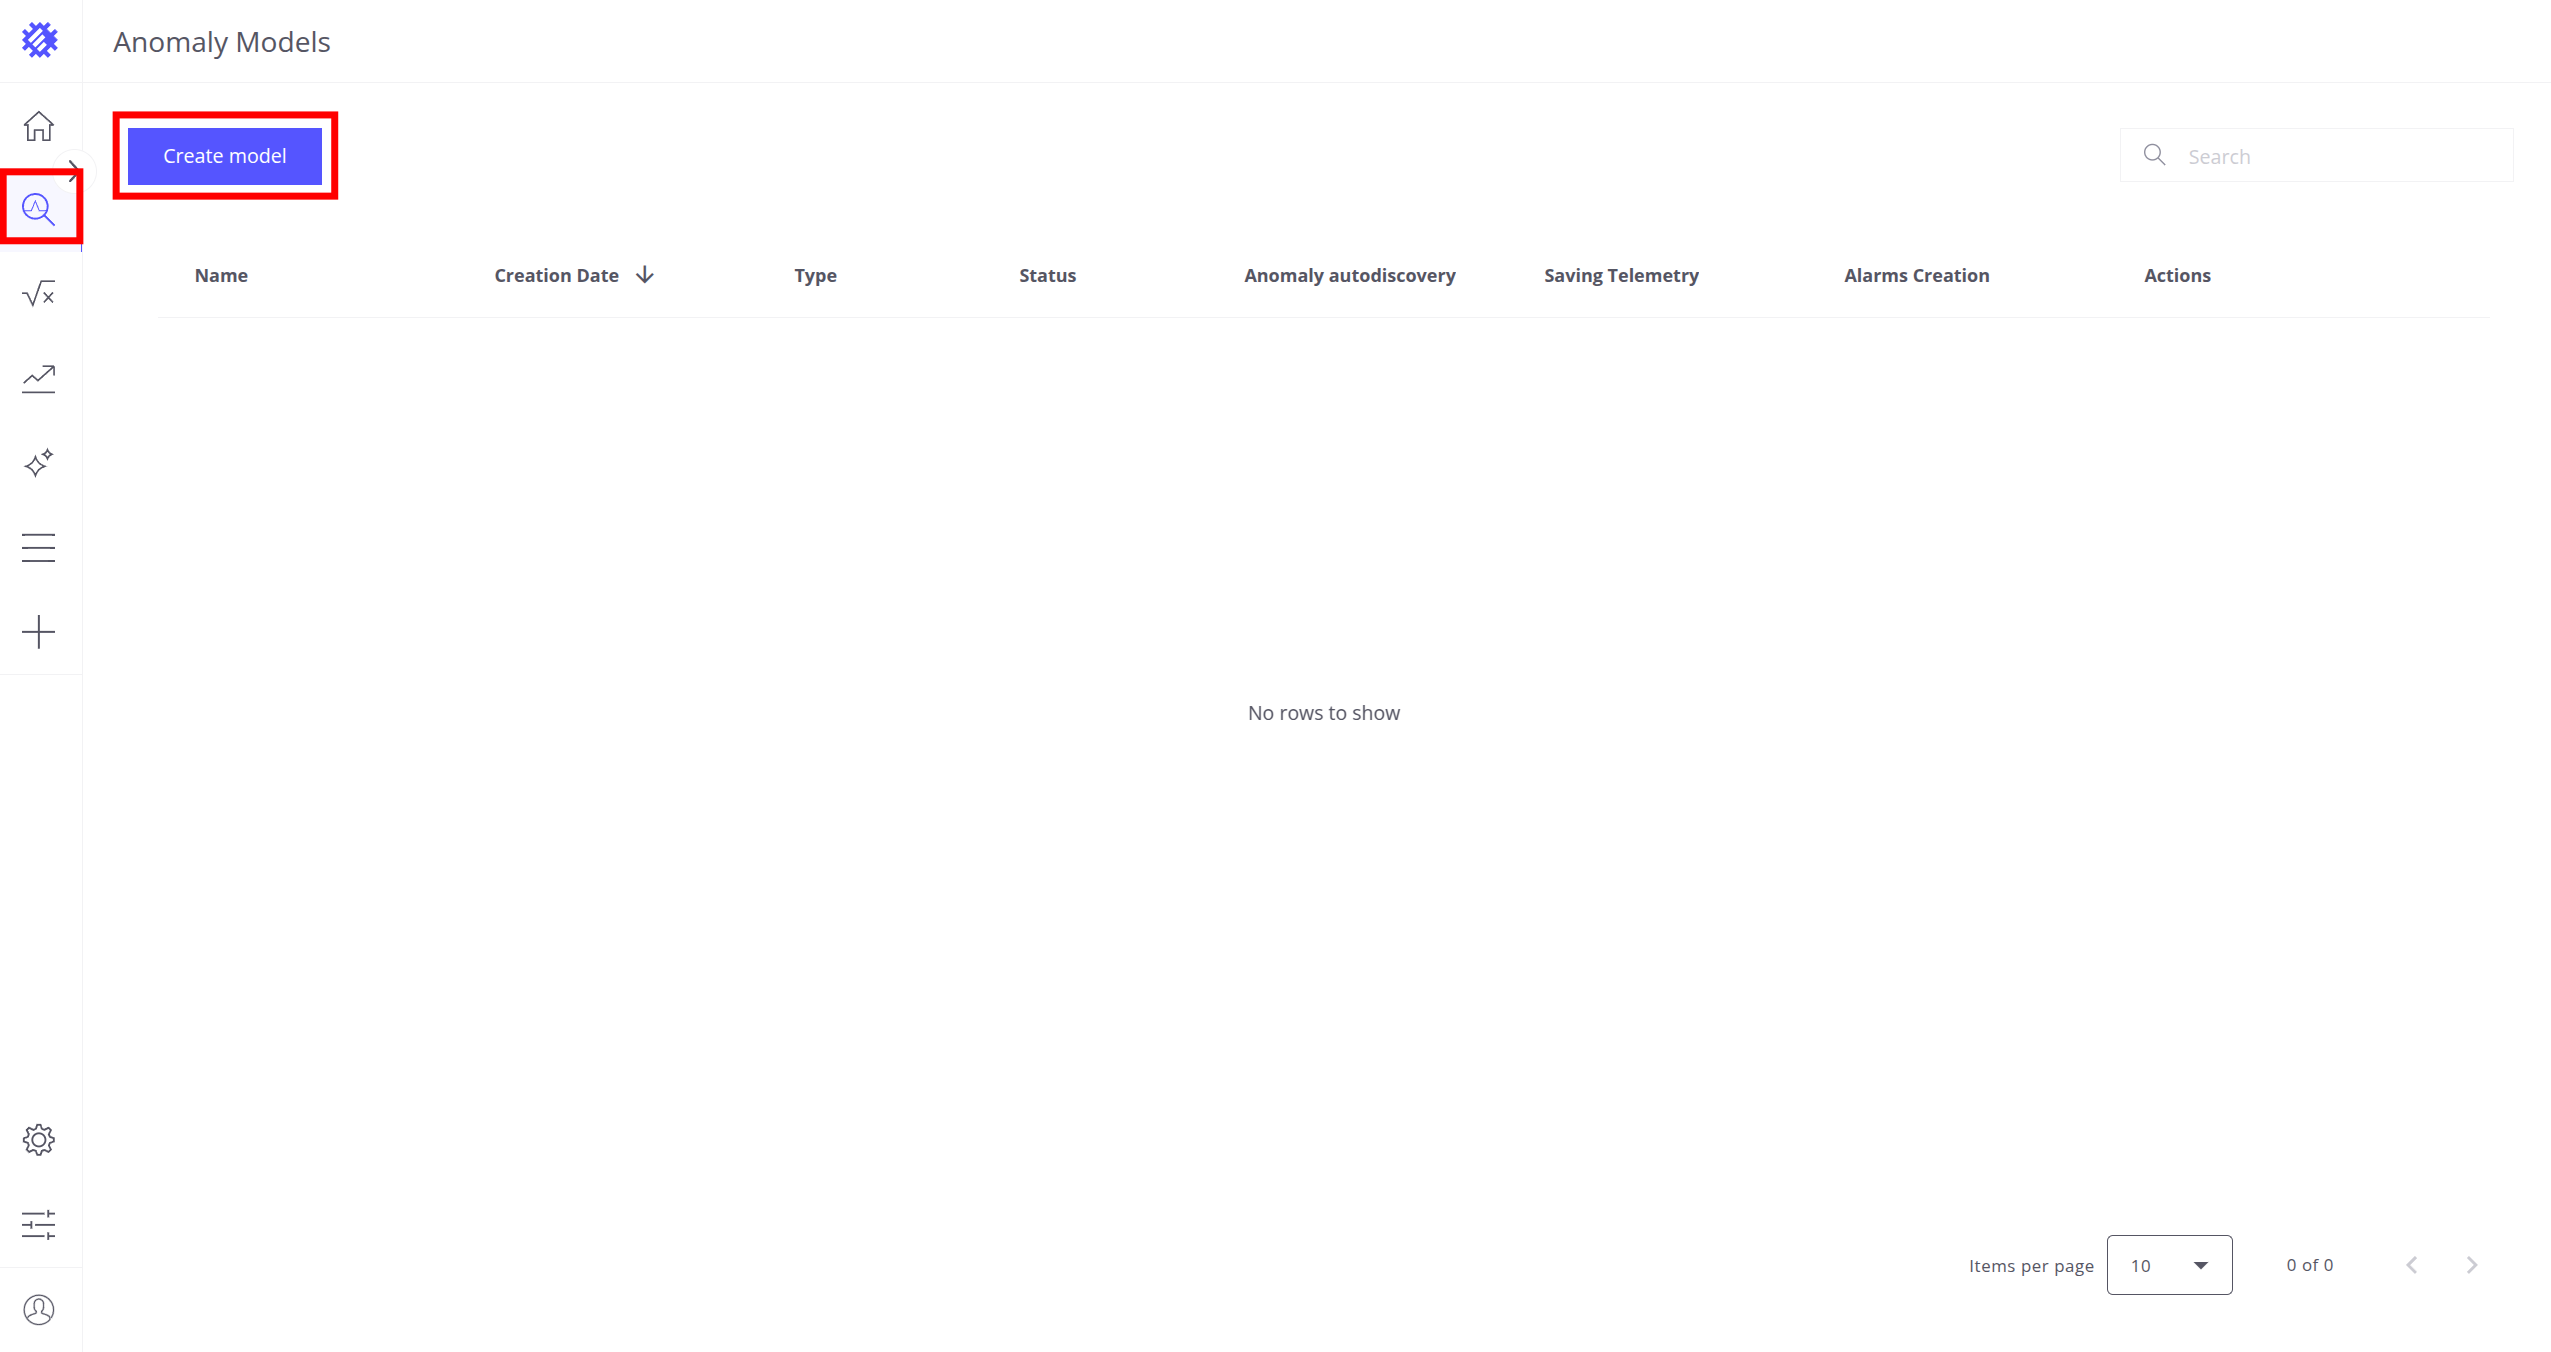
点击左侧面板的 异常图标,进入 异常模型页面
- 点击 创建模型按钮
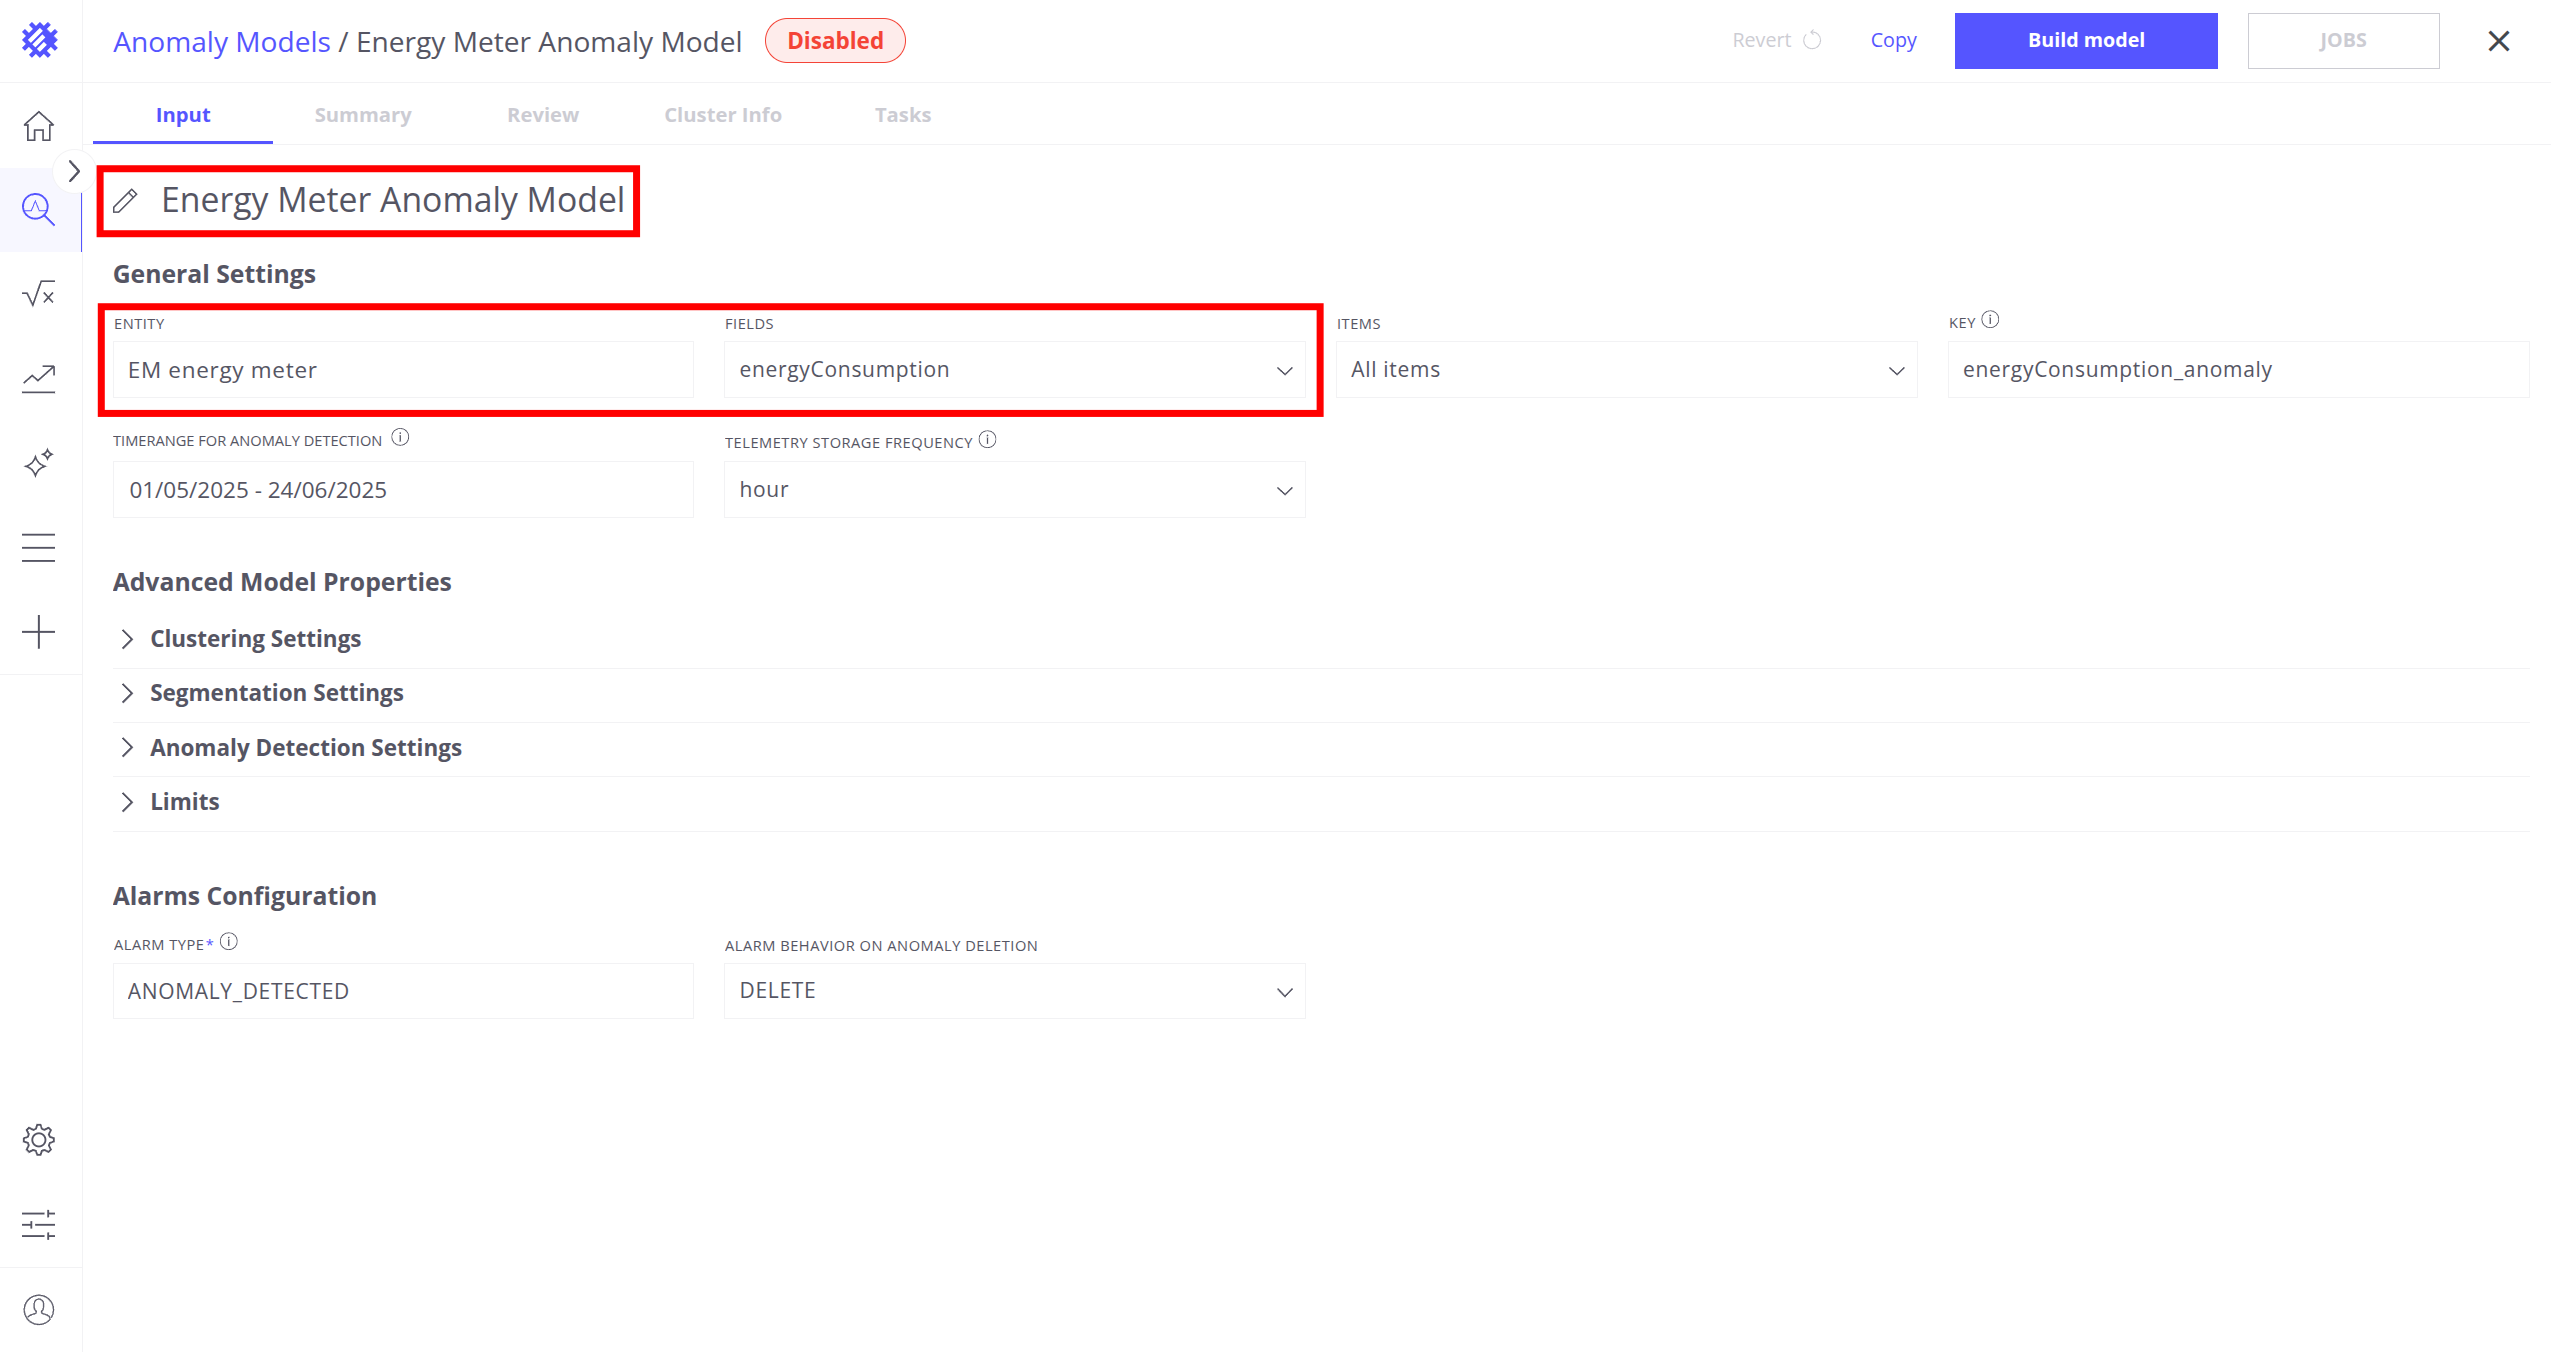
- 将实体设为
EM energy meter - 将字段仅设为
energyConsumption - 将名称设为
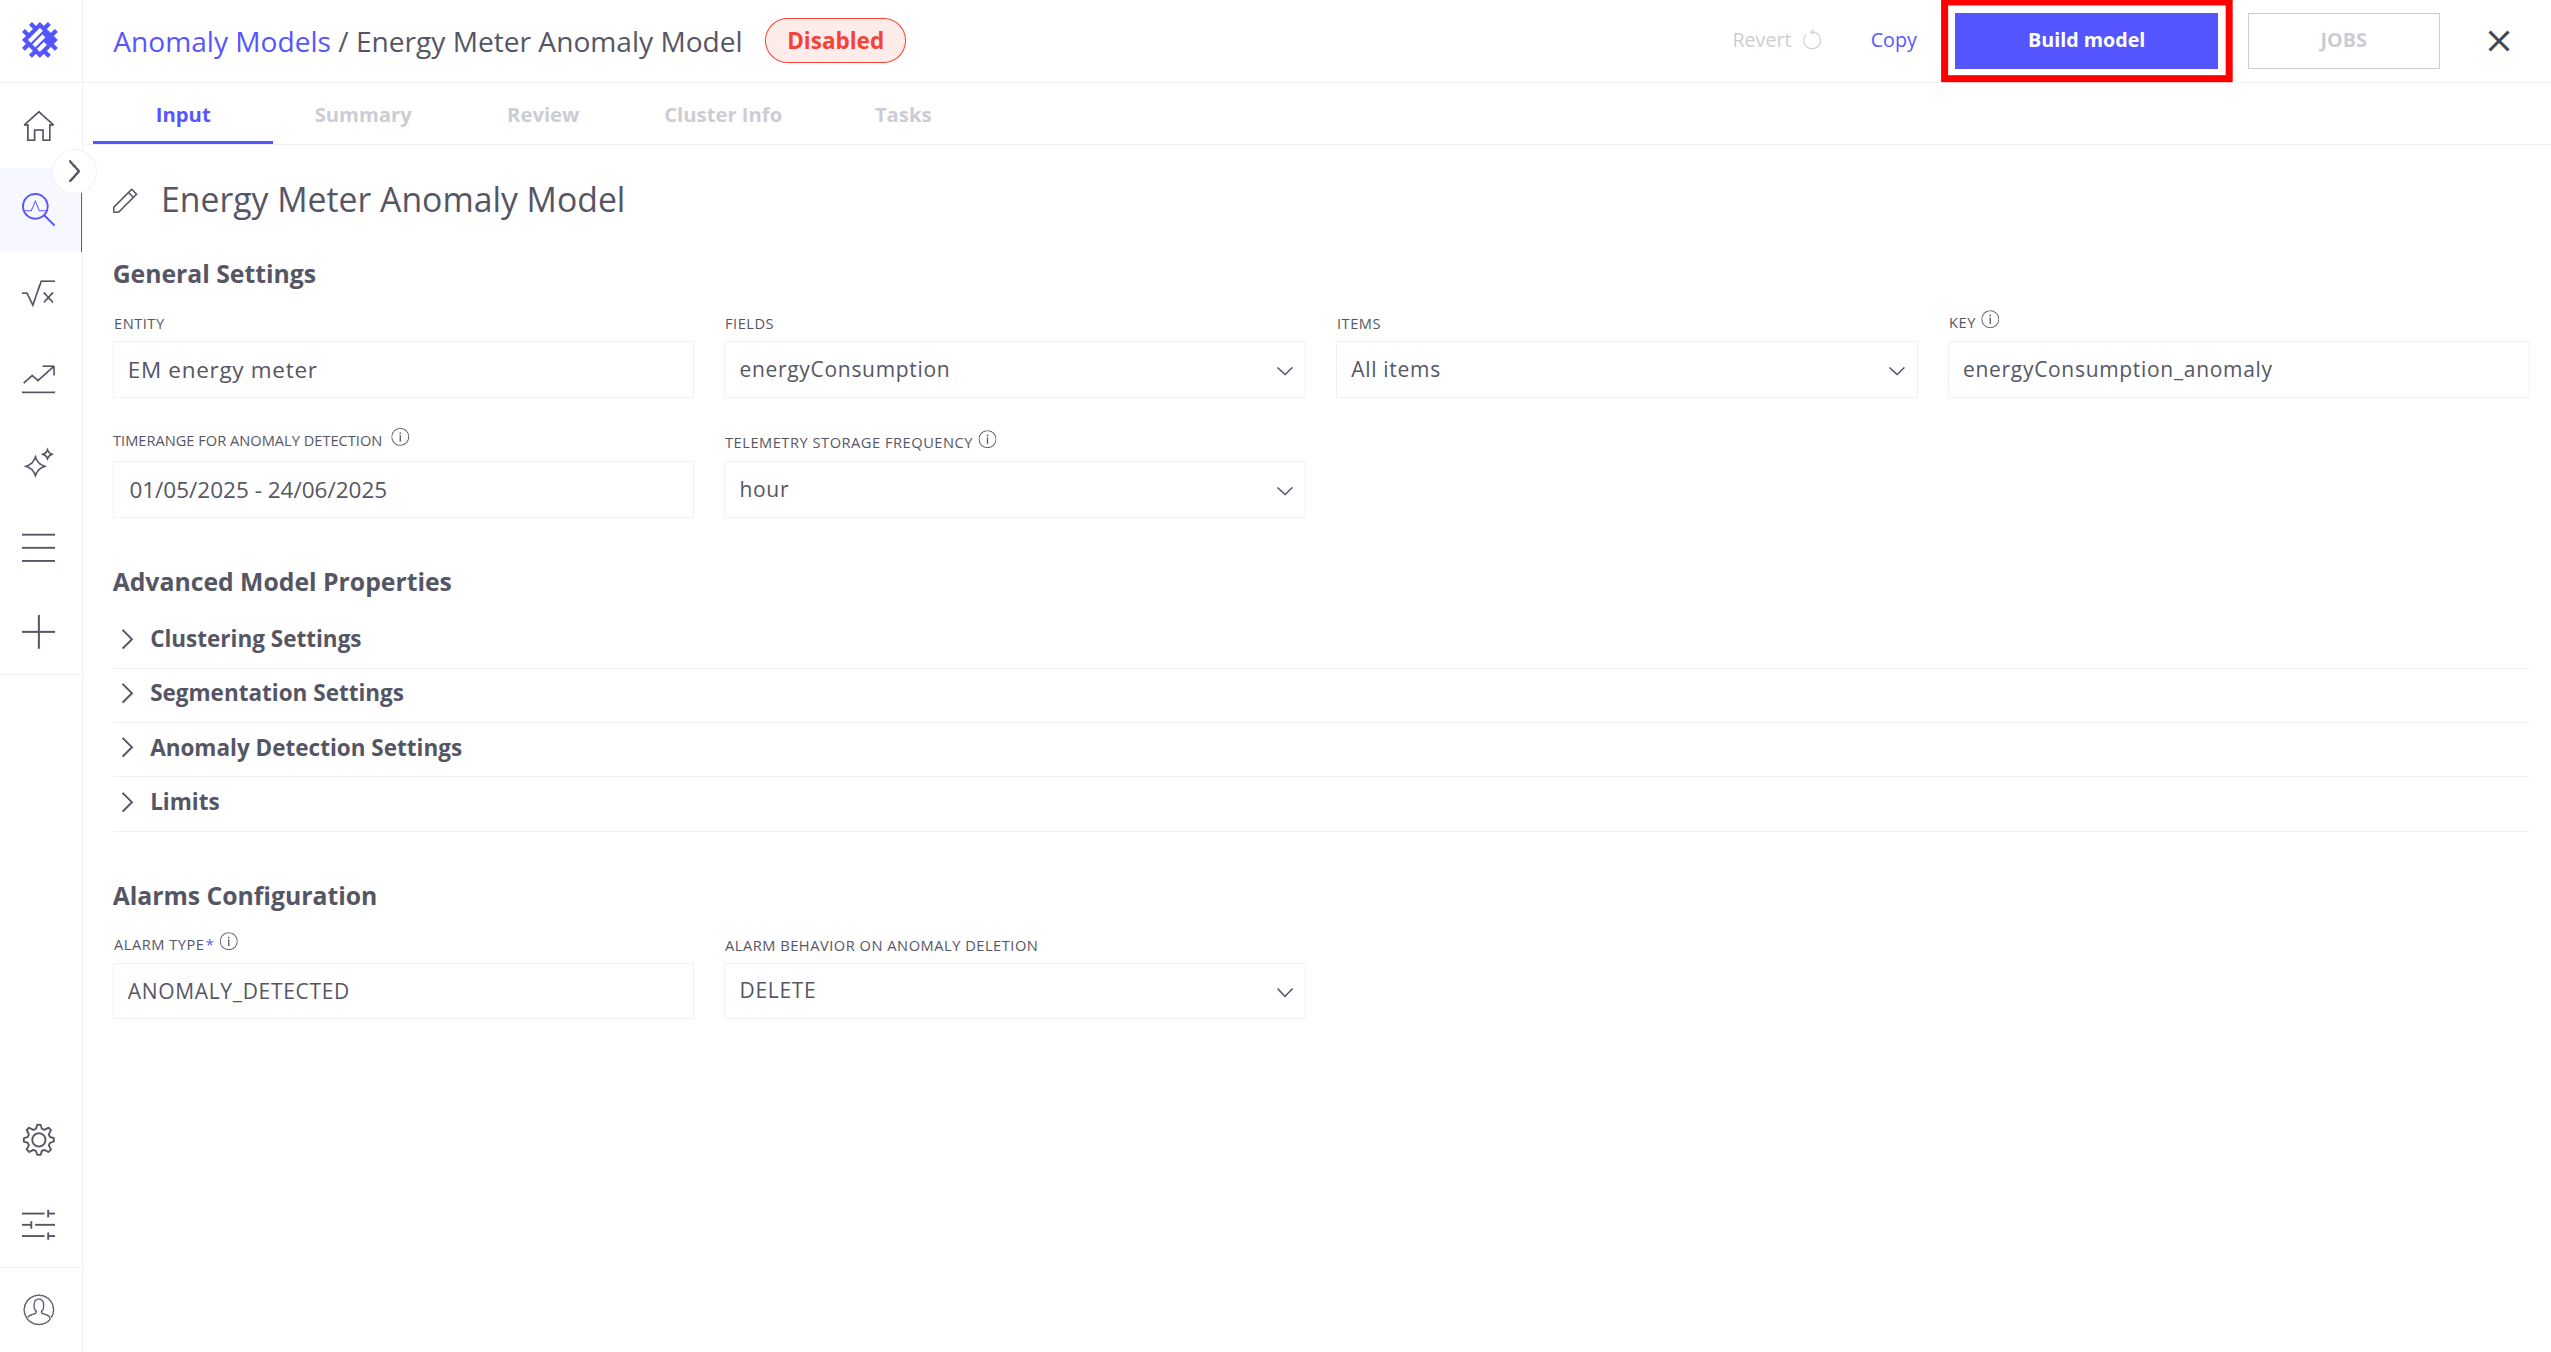
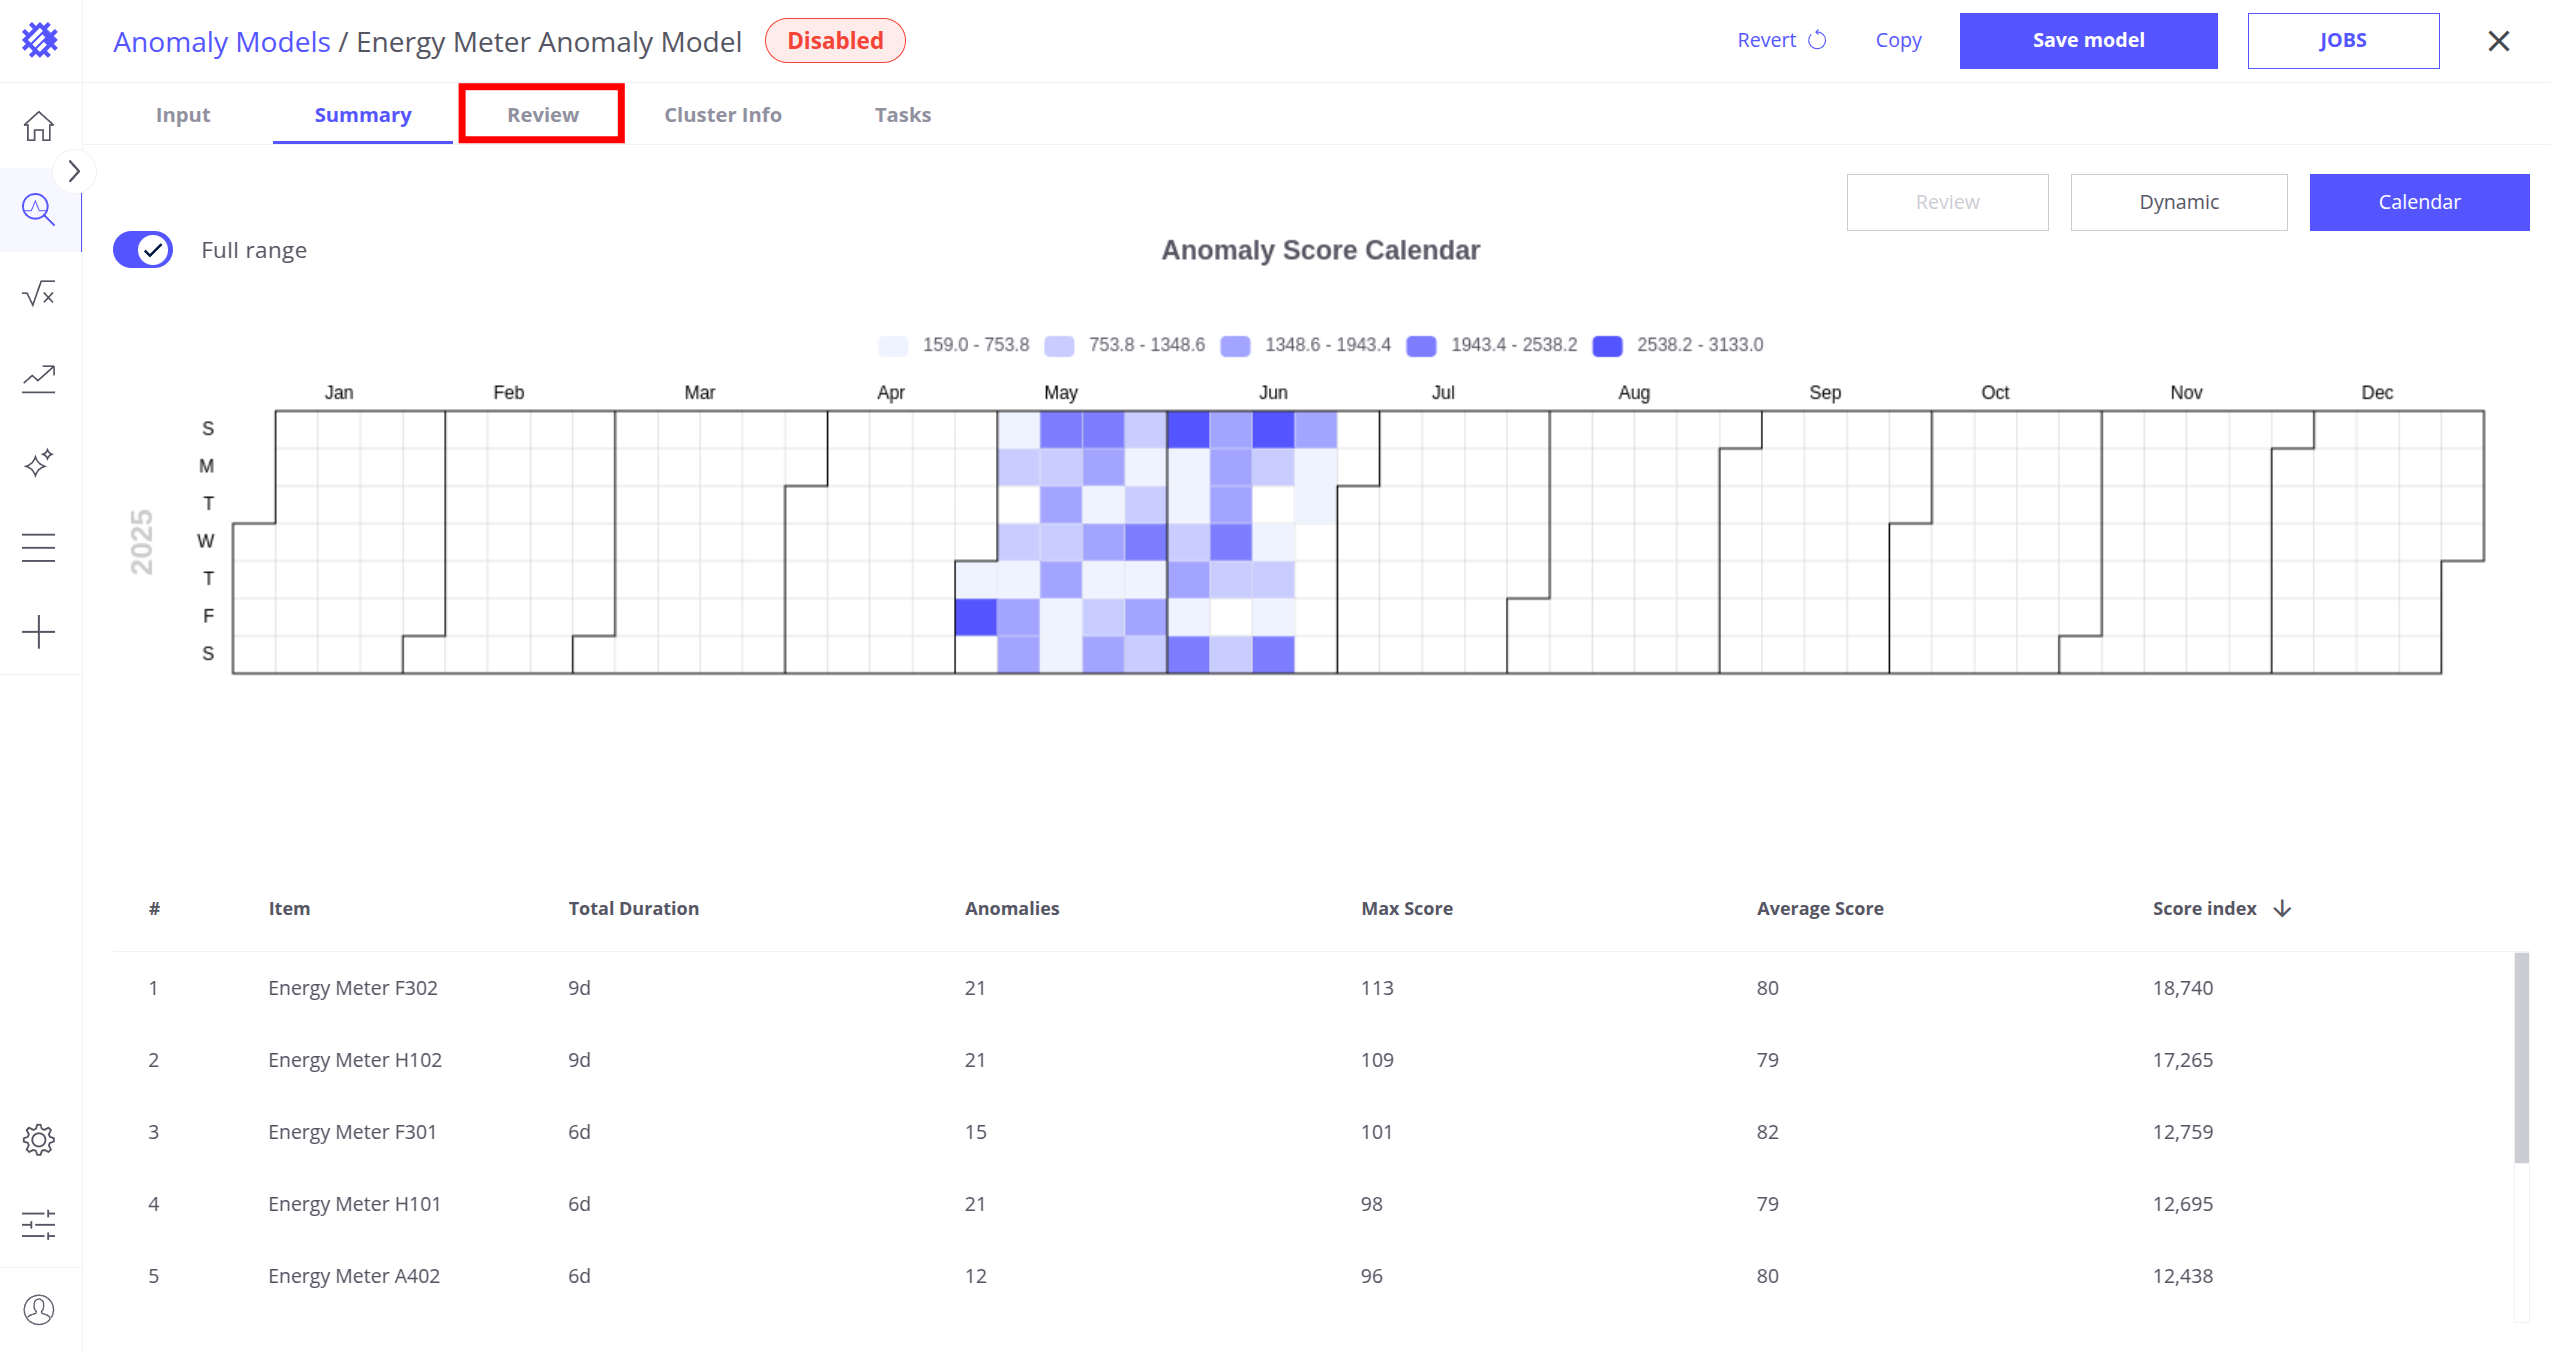
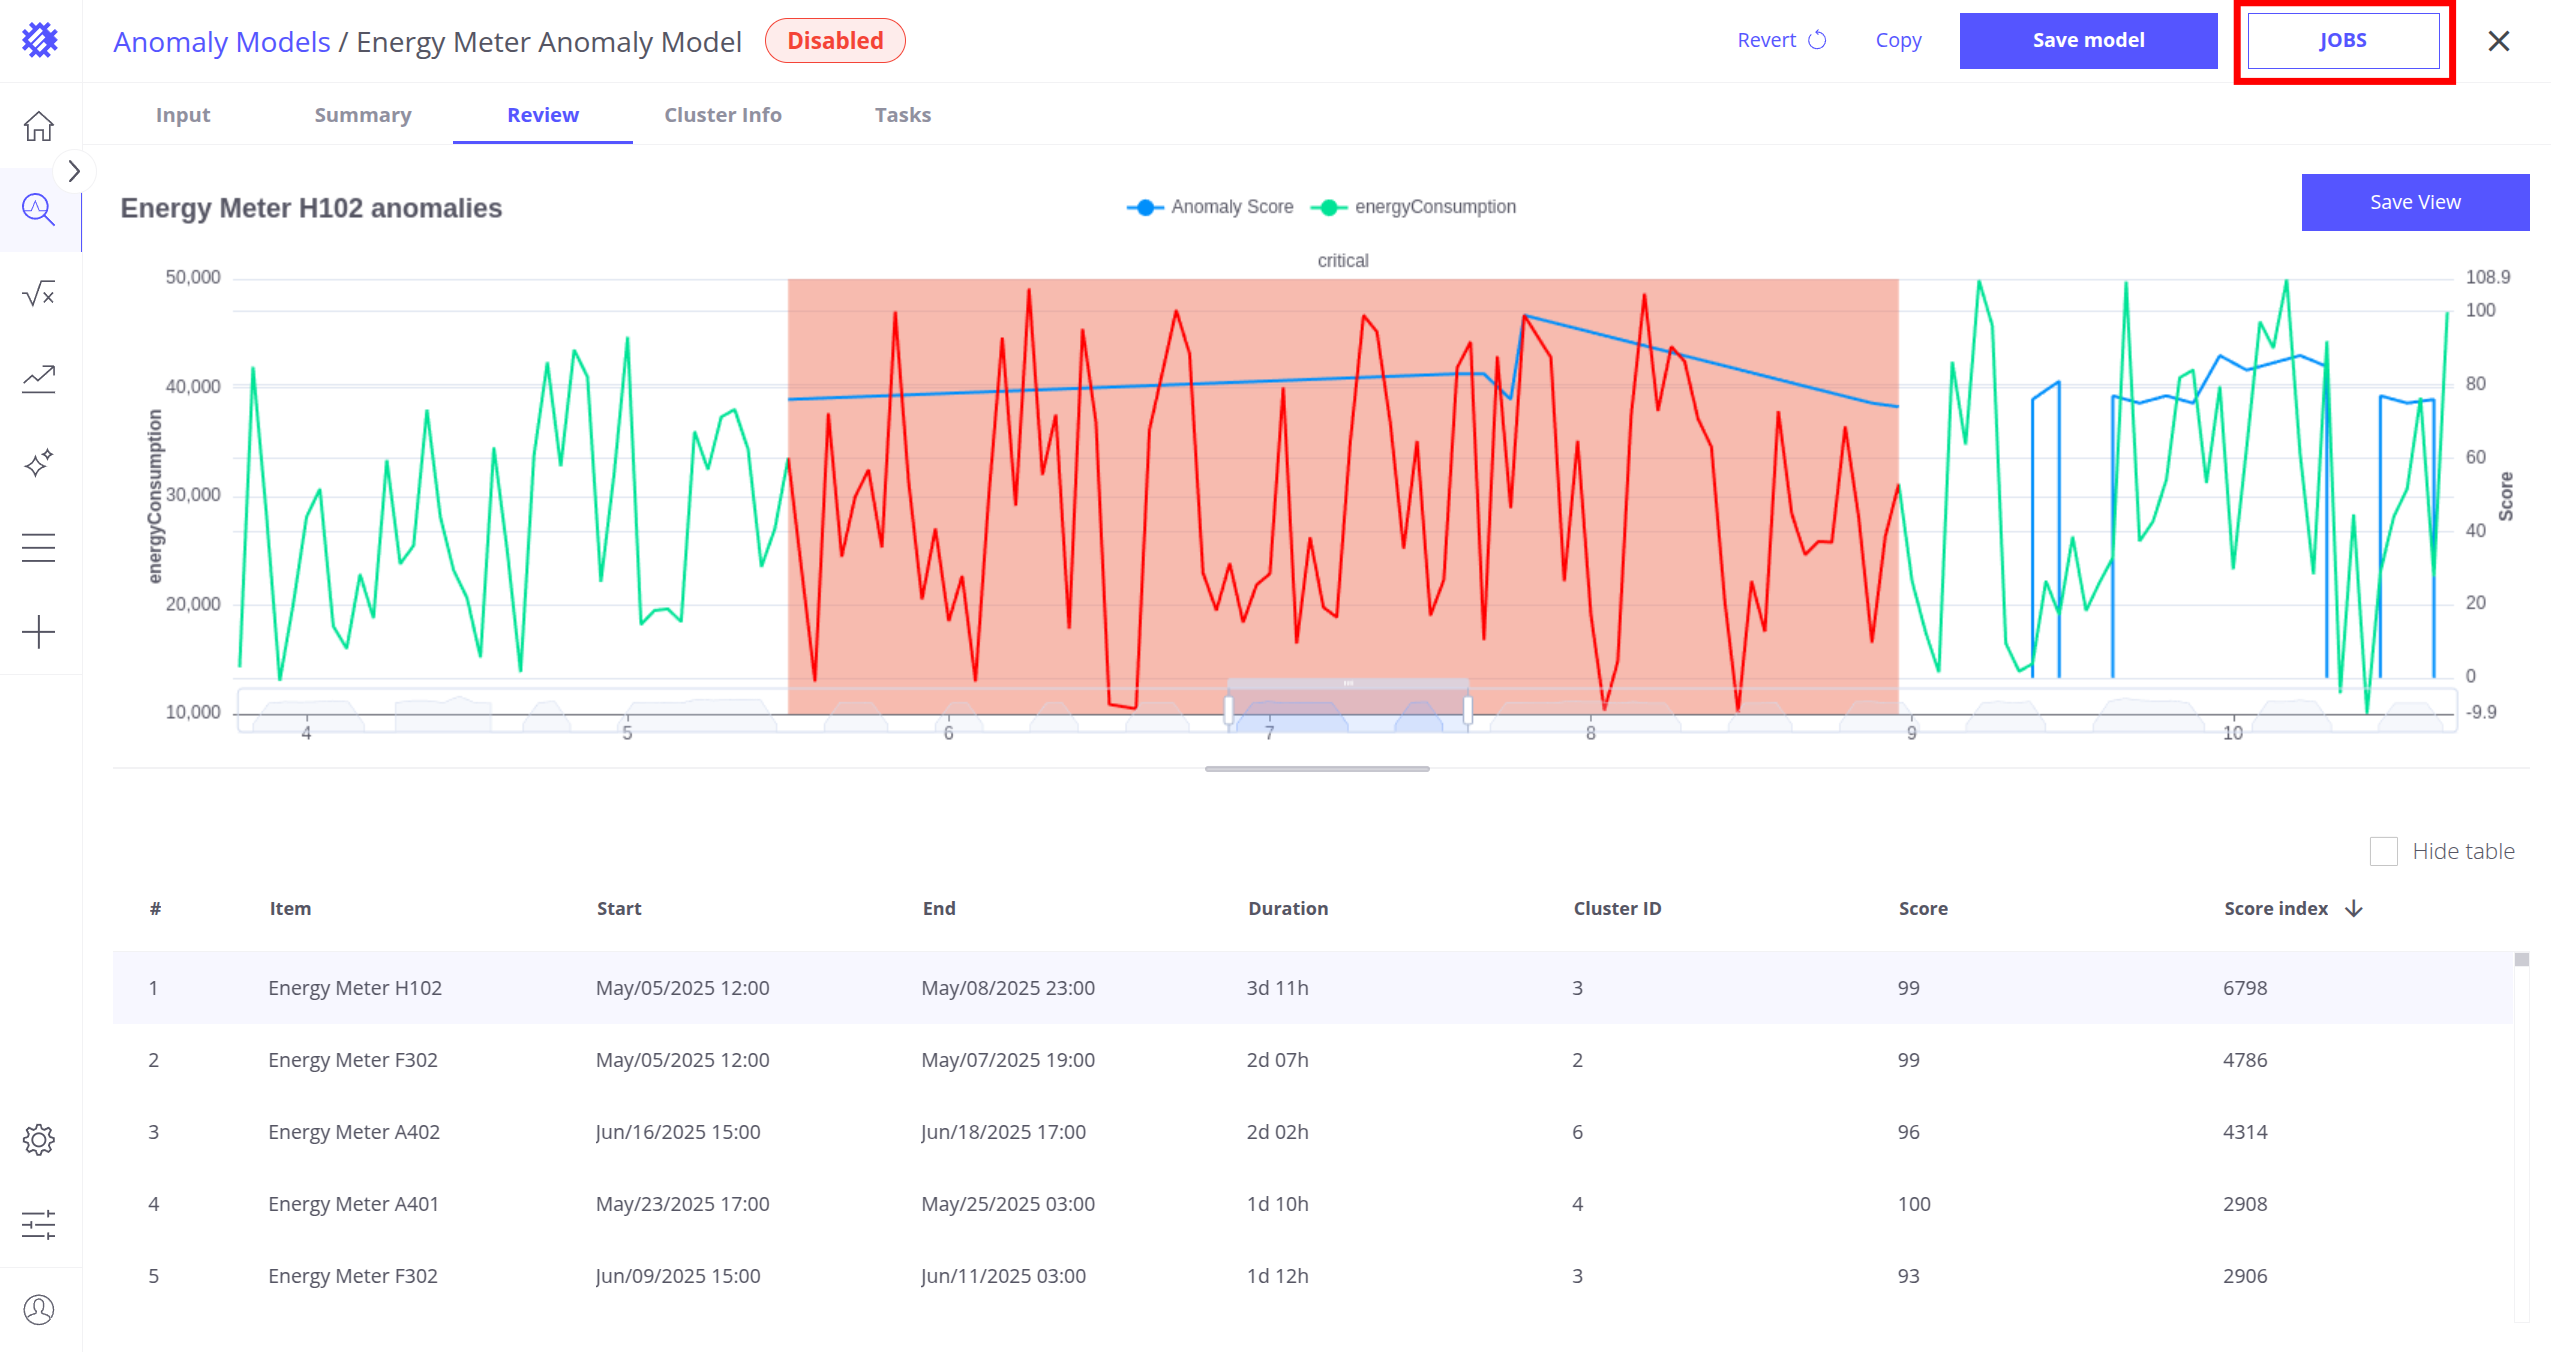
Energy Meter Anomaly Model - 点击 构建模型,进入 审核标签页,核对检测到的异常
接下来配置异常检测刷新任务,以自动检测异常并在 ThingsBoard 中创建告警:
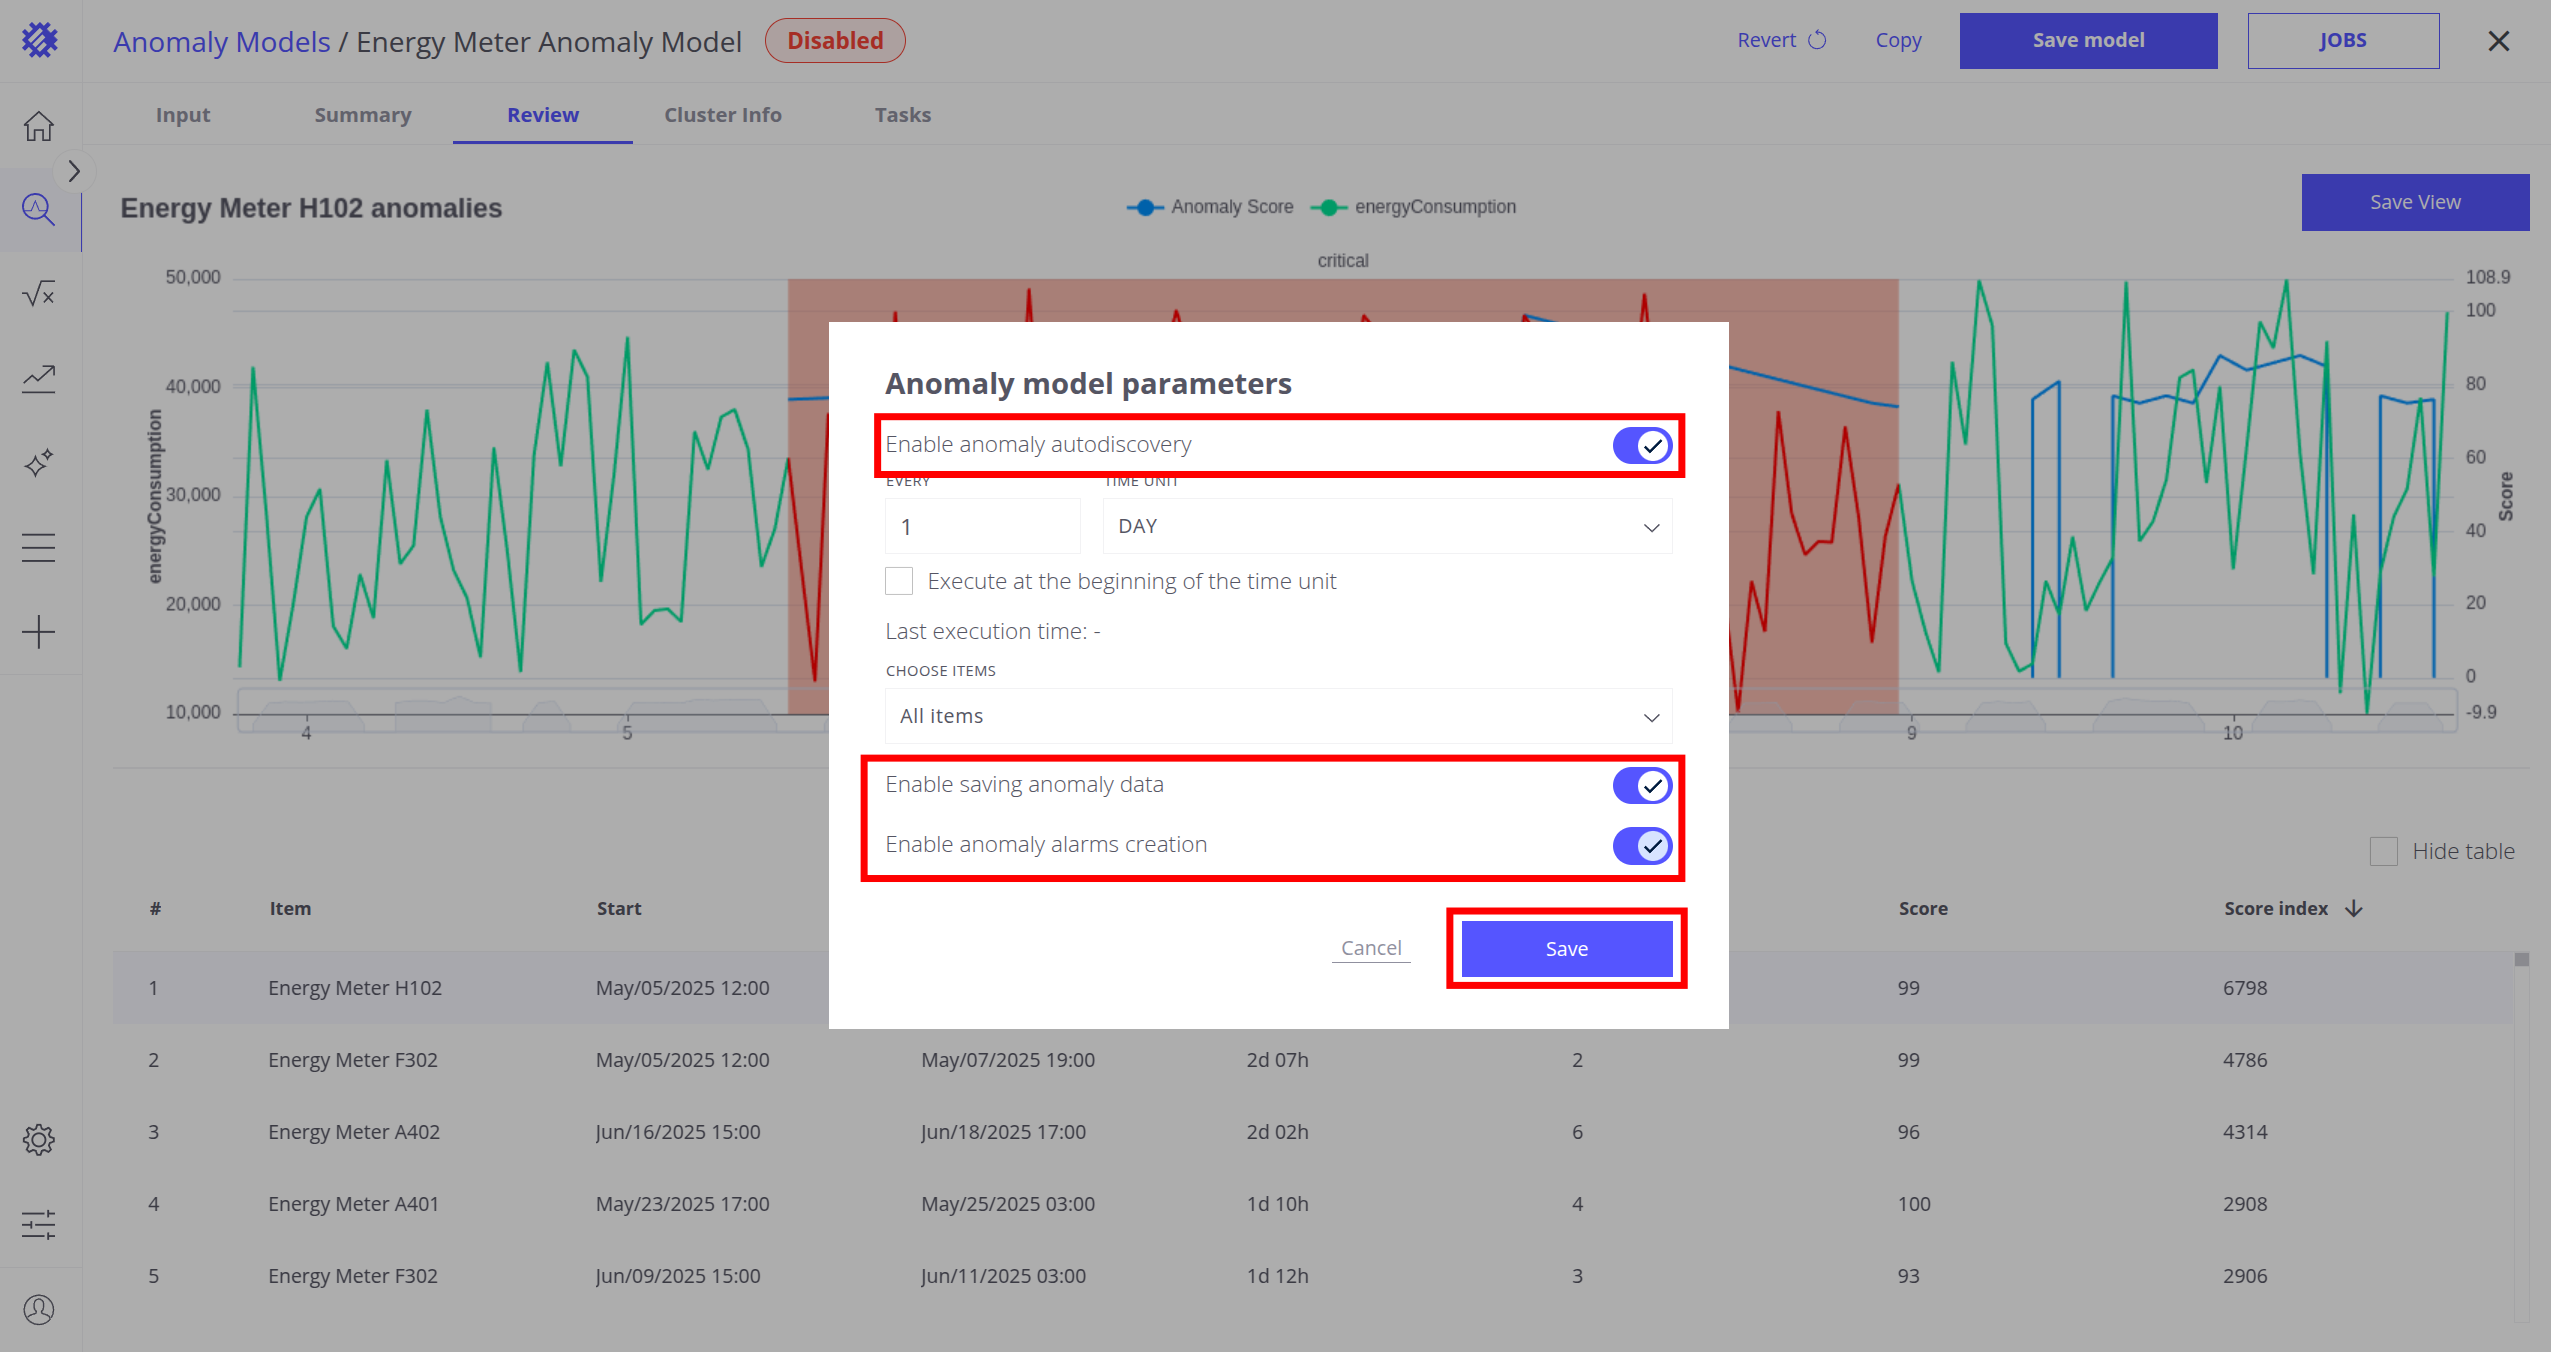
- 点击 作业按钮;在弹窗中:
- 启用异常模型刷新
- 启用异常数据保存(到 ThingsBoard)
- 启用异常告警创建(在 ThingsBoard 中)
- 点击 保存按钮
配置完成后,一旦出现异常,模型将自动检测并立即创建告警。
关于异常模型的更多说明见此处。
步骤 7. 体验 AI 助手
AI 助手可根据自然语言请求自动构建视图。
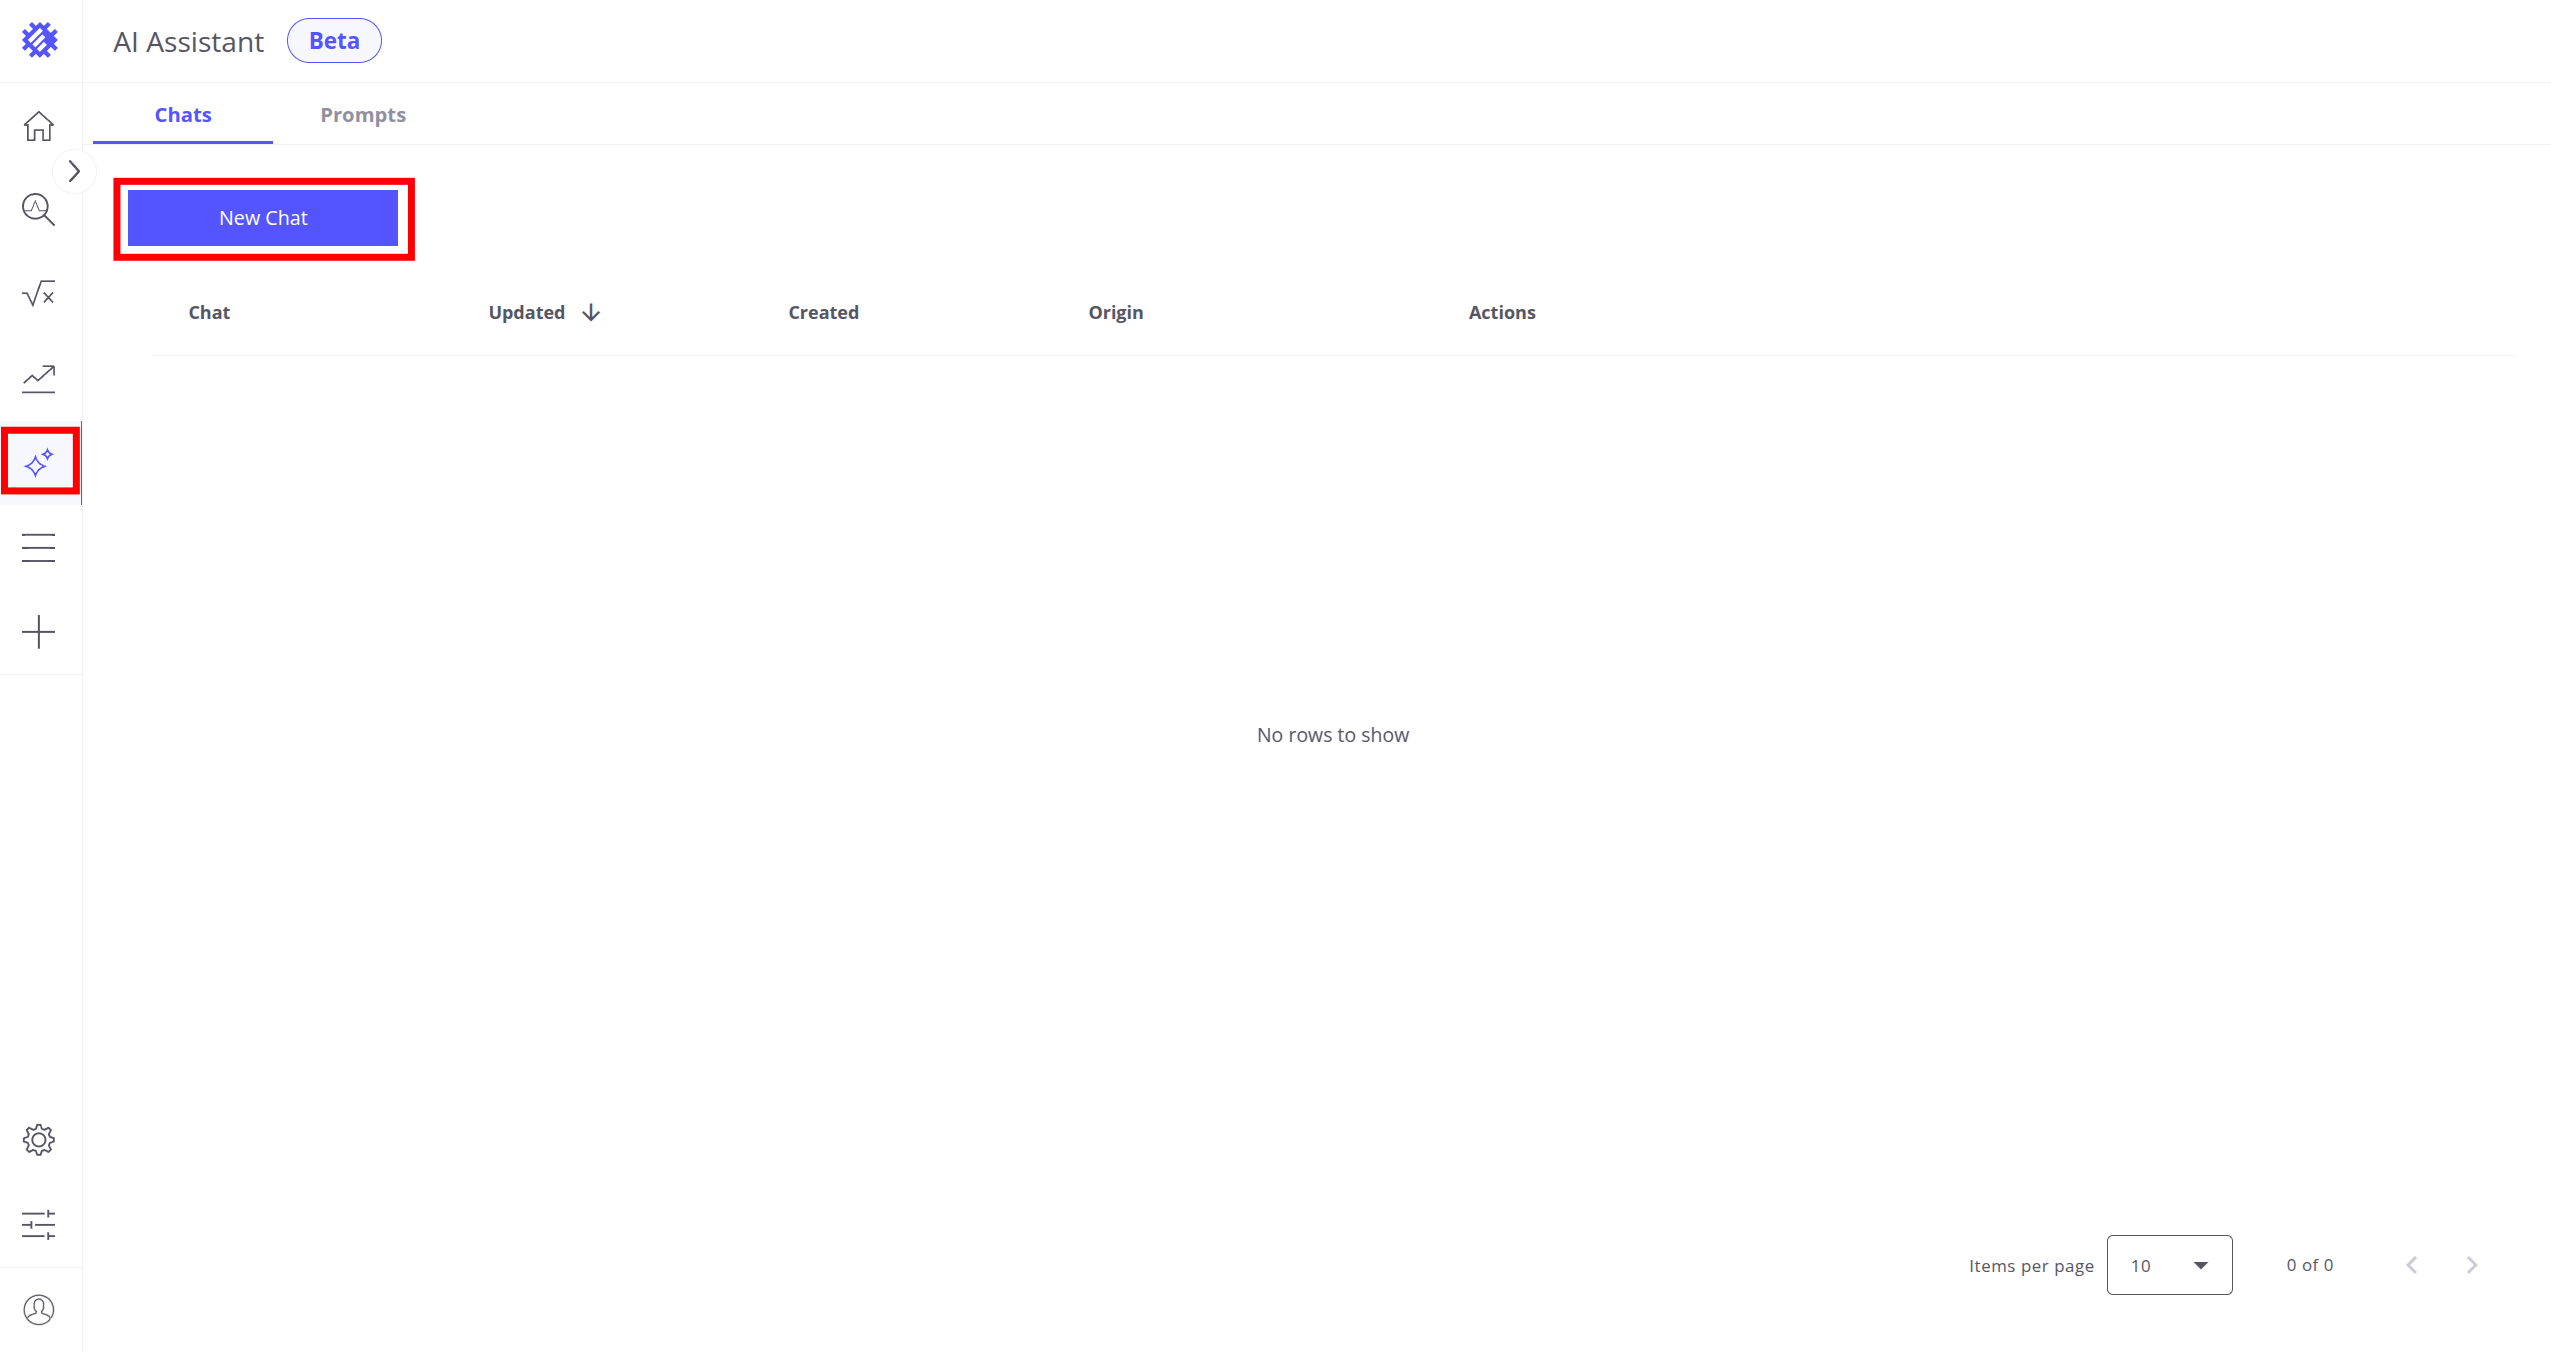
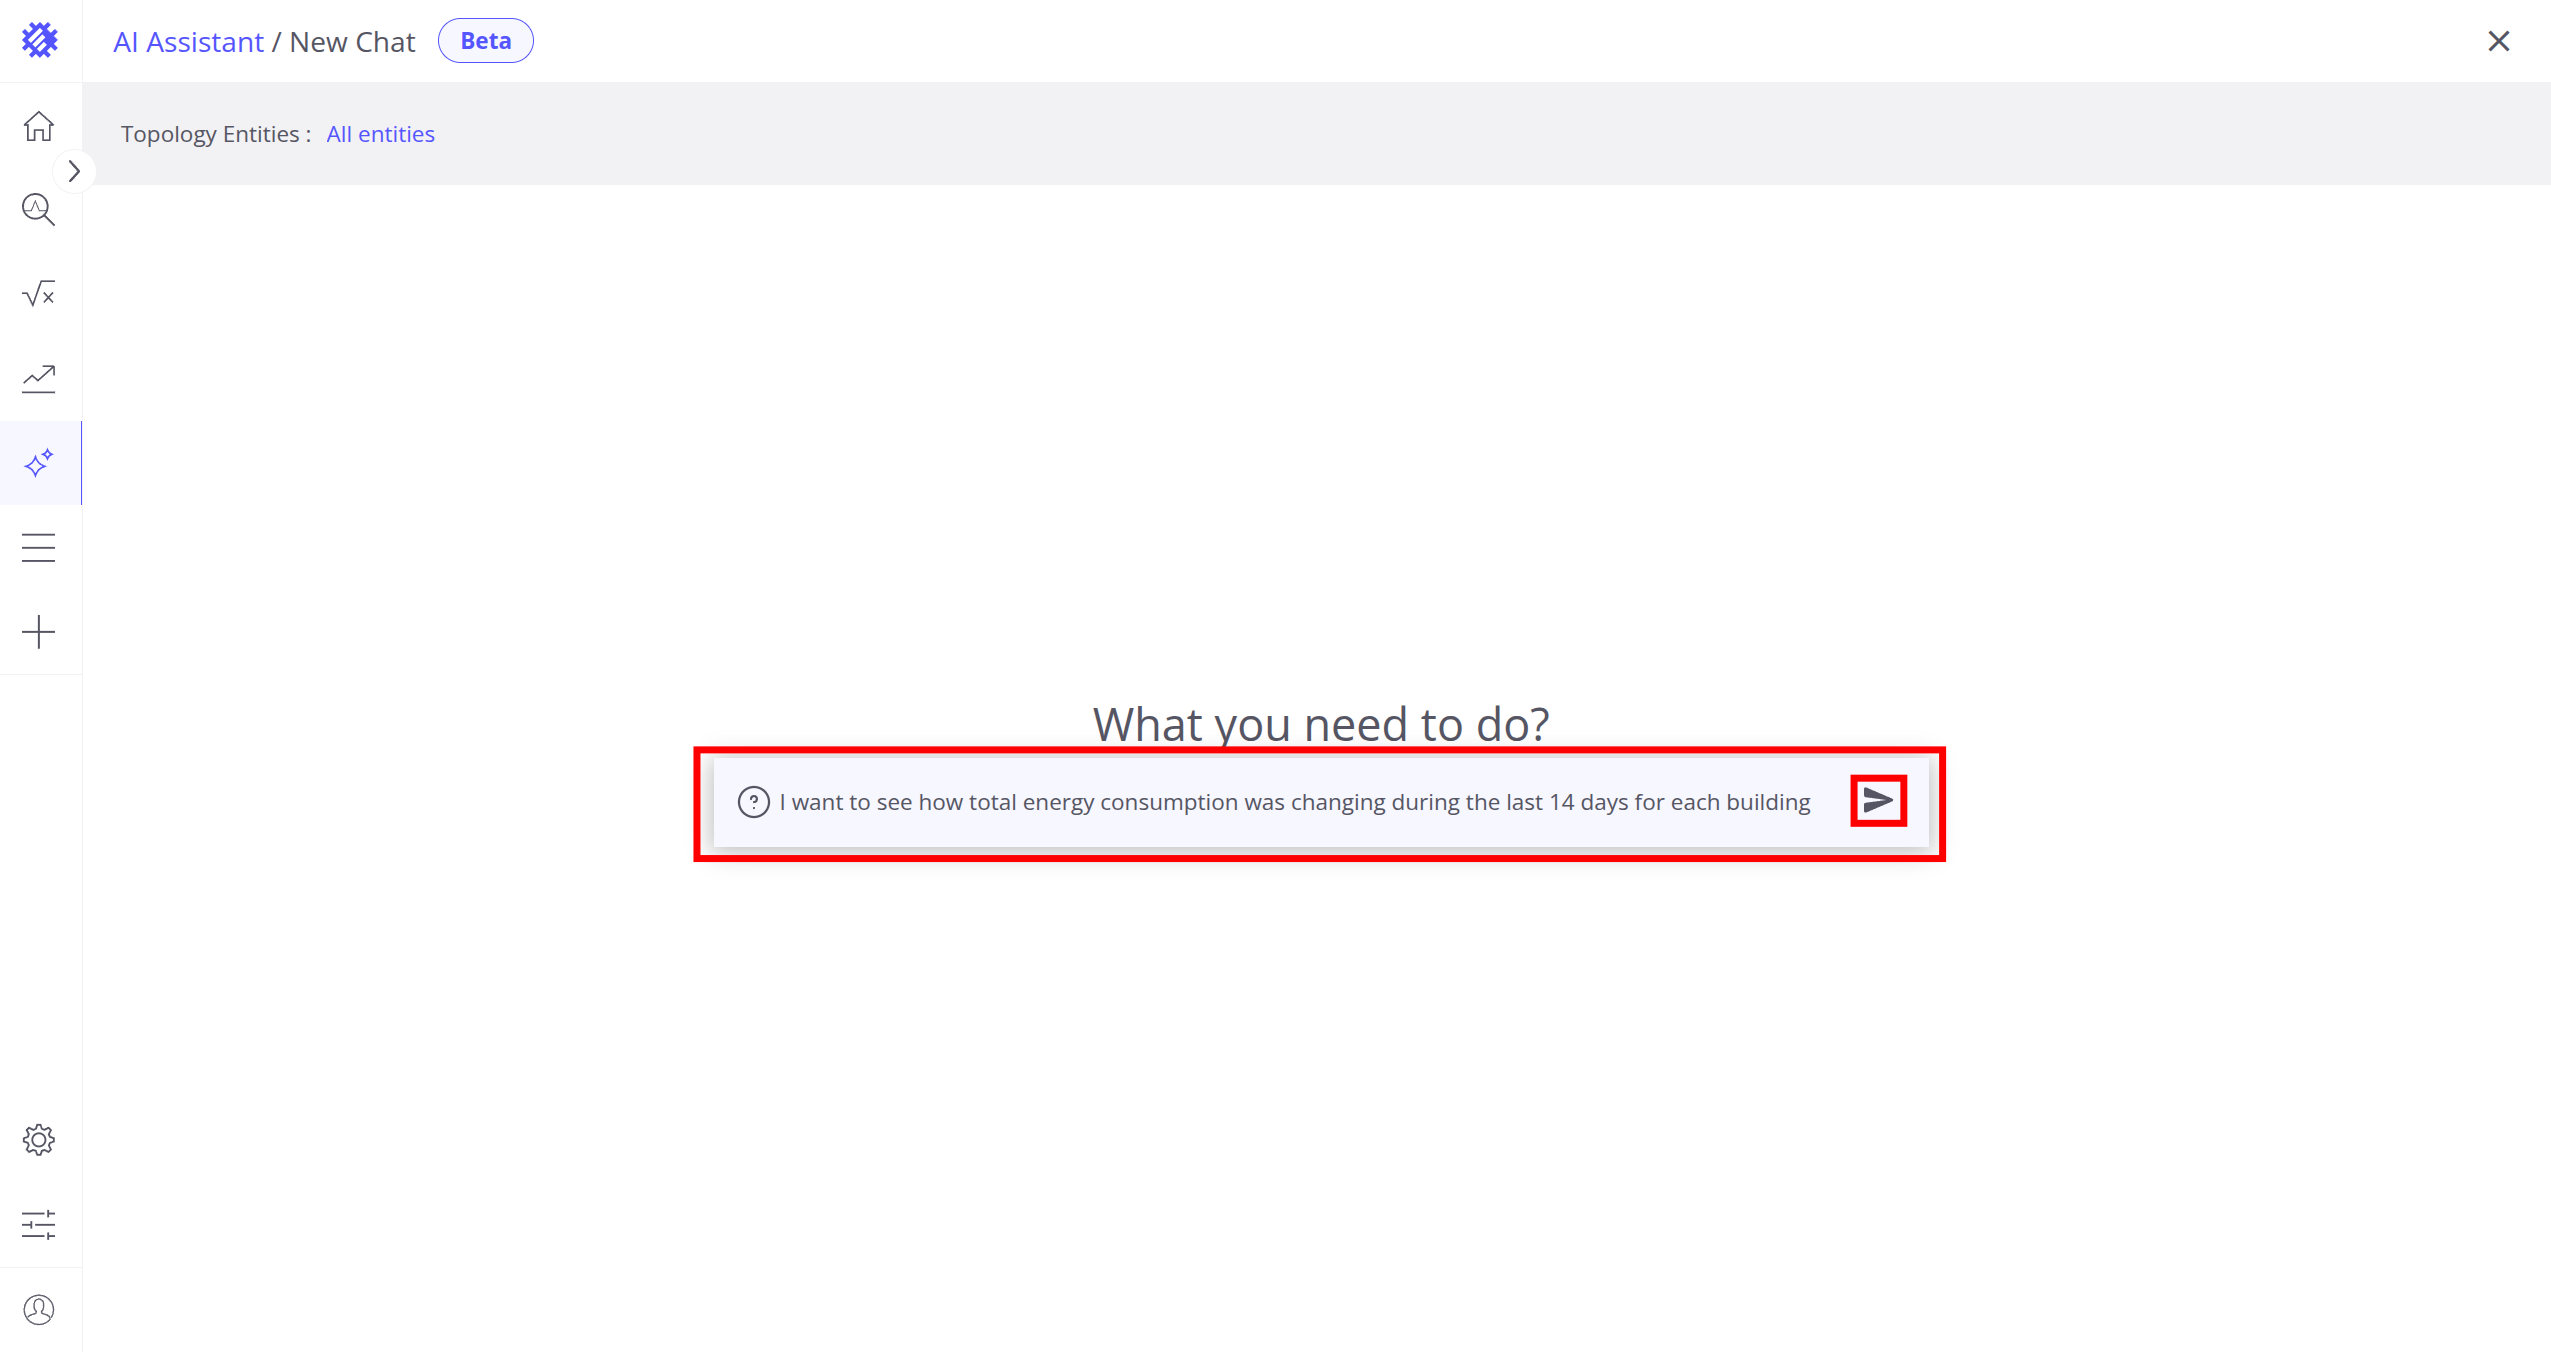
- 进入助手页面点击新建对话按钮
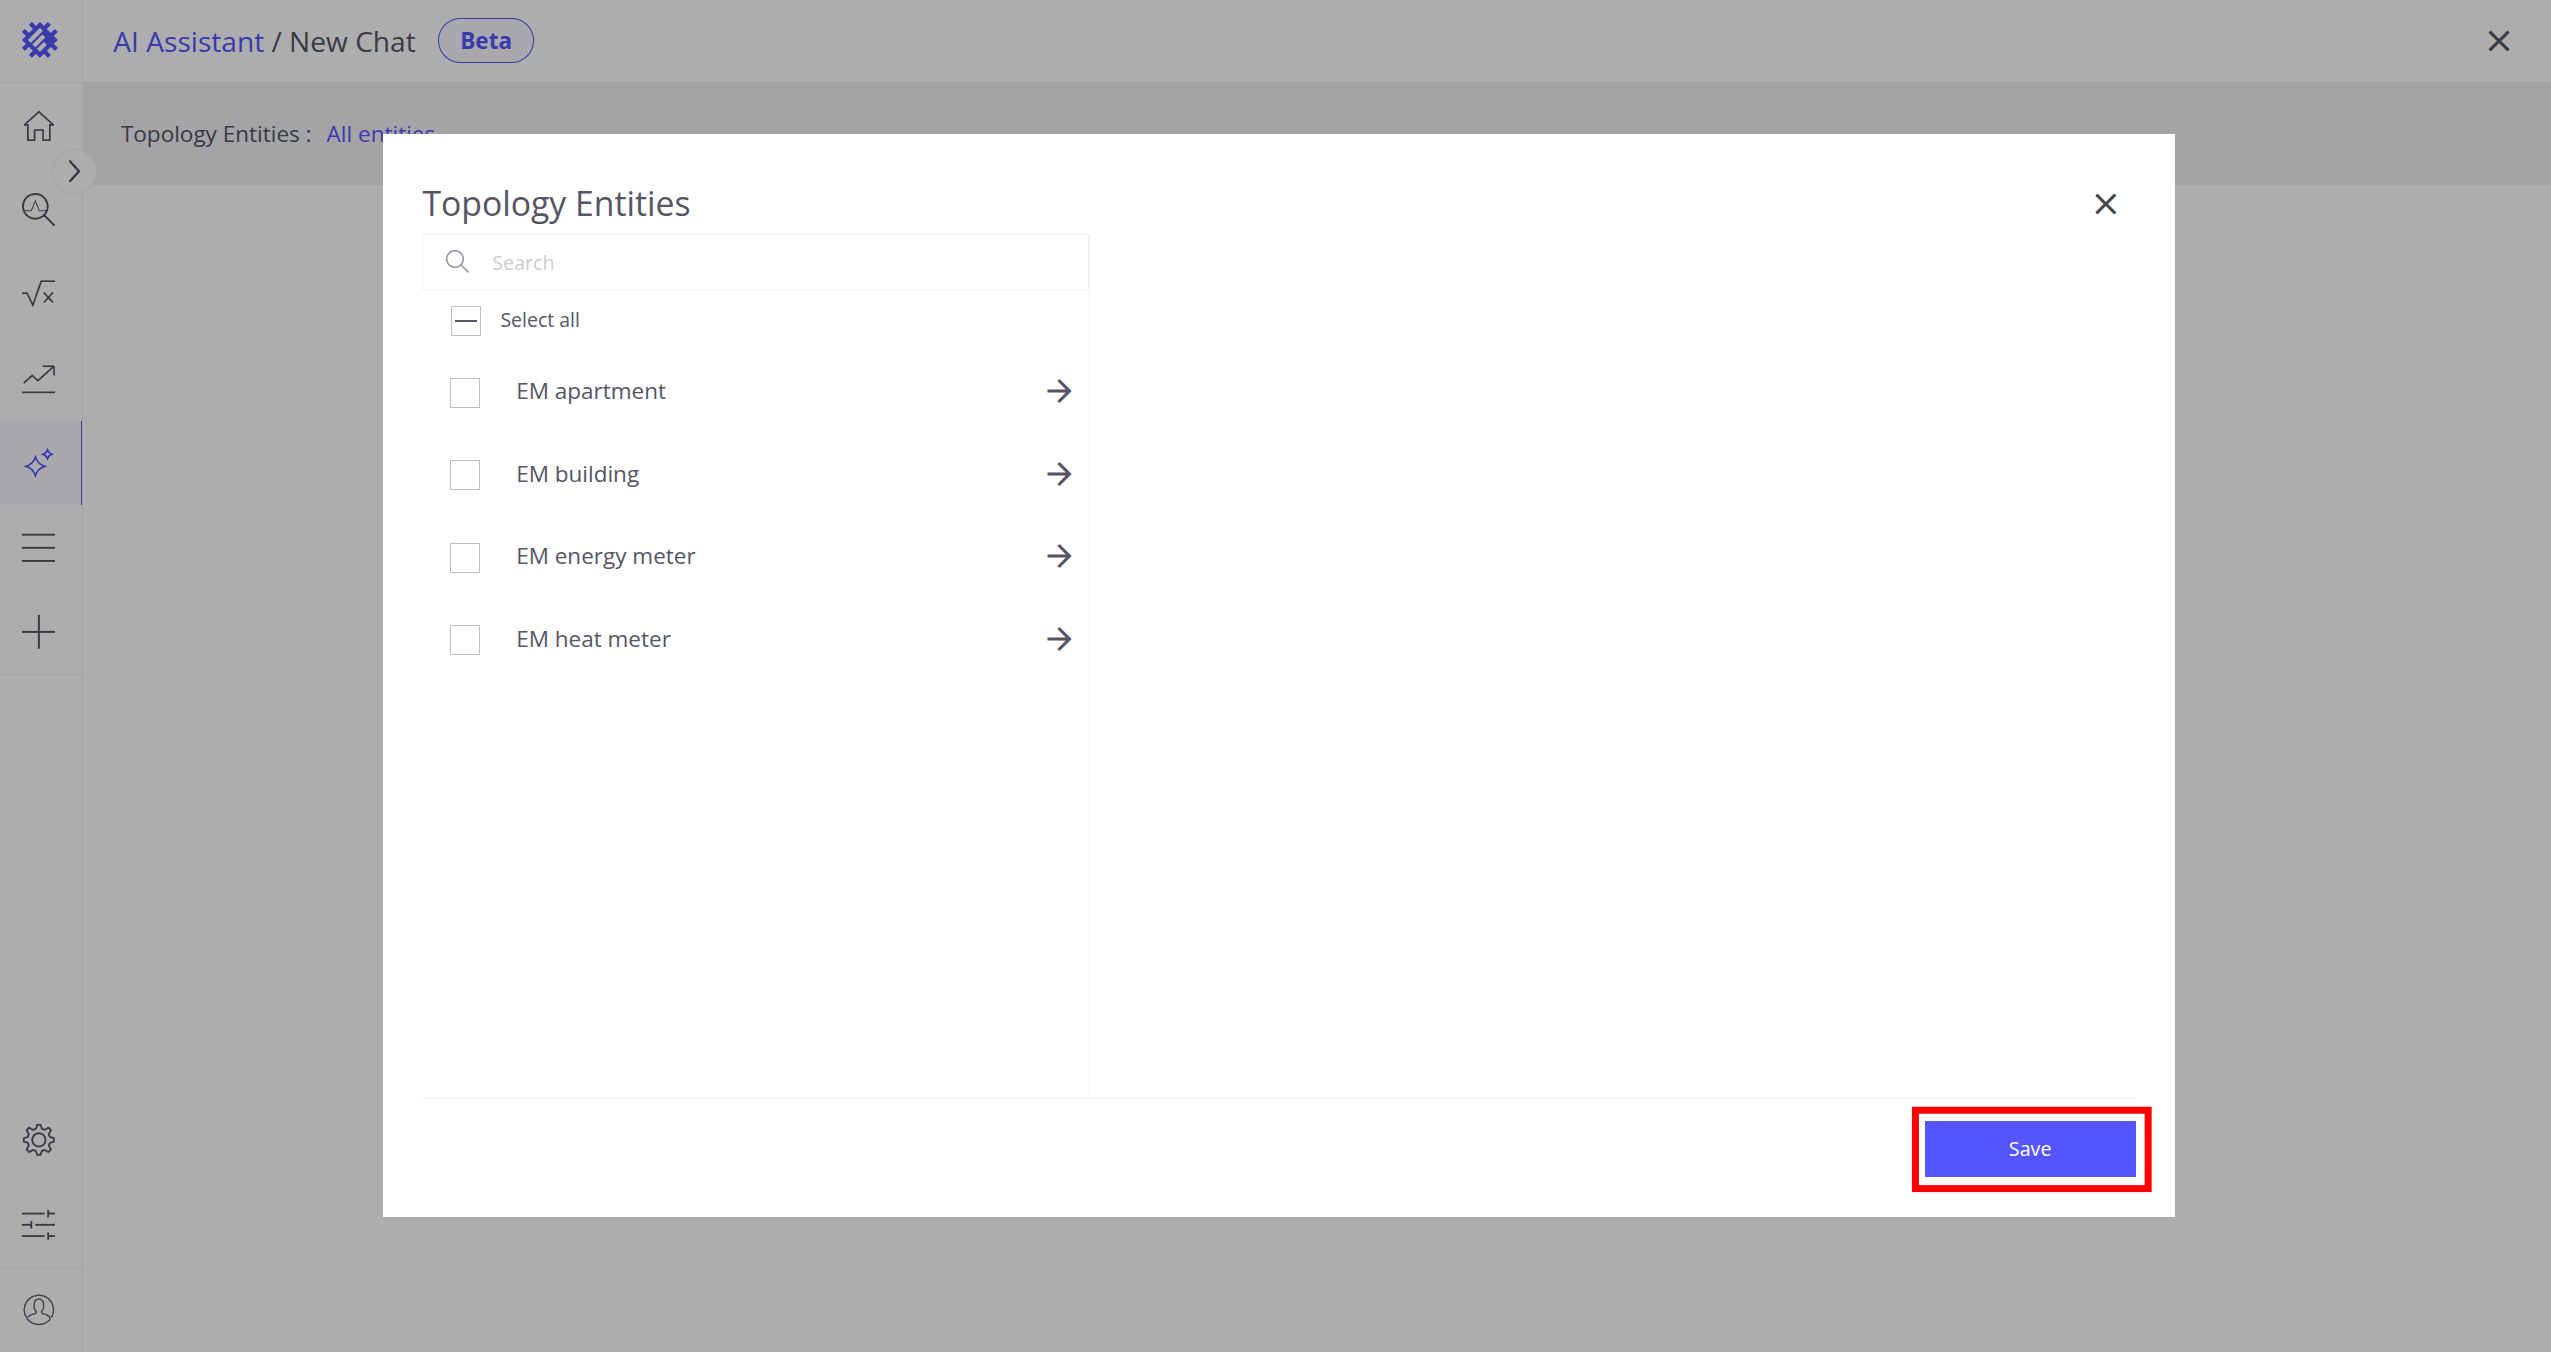
- 若提示选择拓扑实体,点击保存按钮
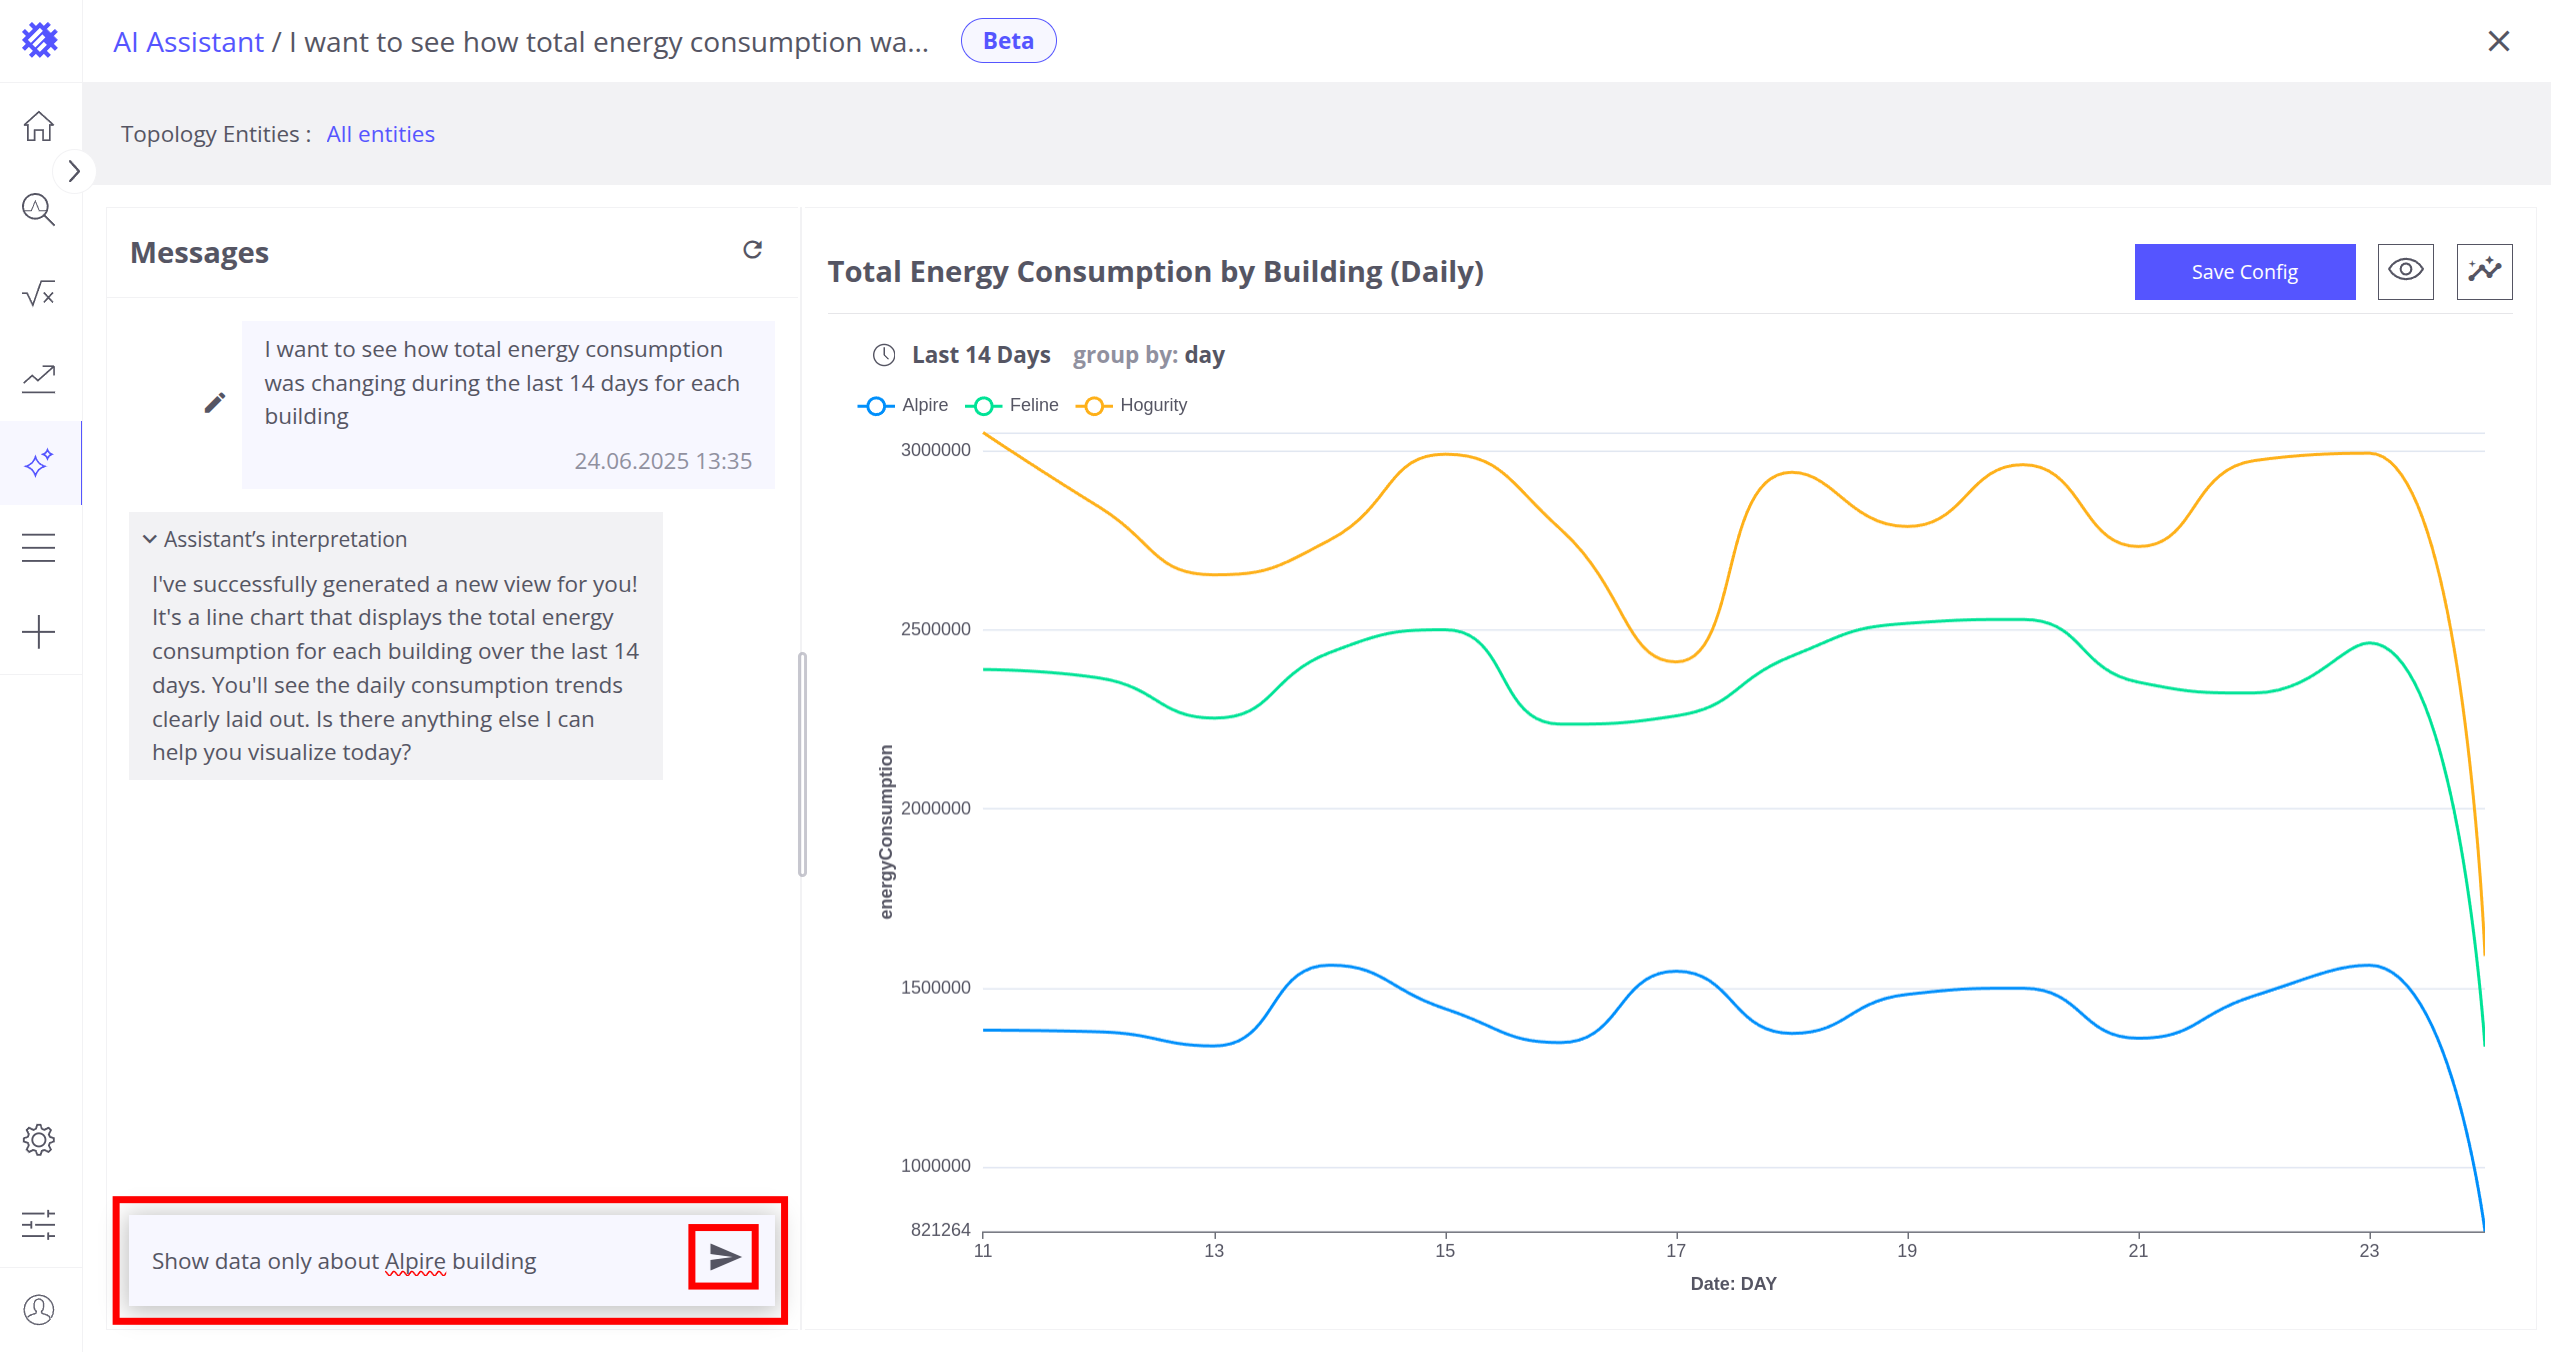
- 在聊天框中输入:「我想查看过去14天各楼栋总能耗的变化情况」
- 查看生成的可视化并验证结果
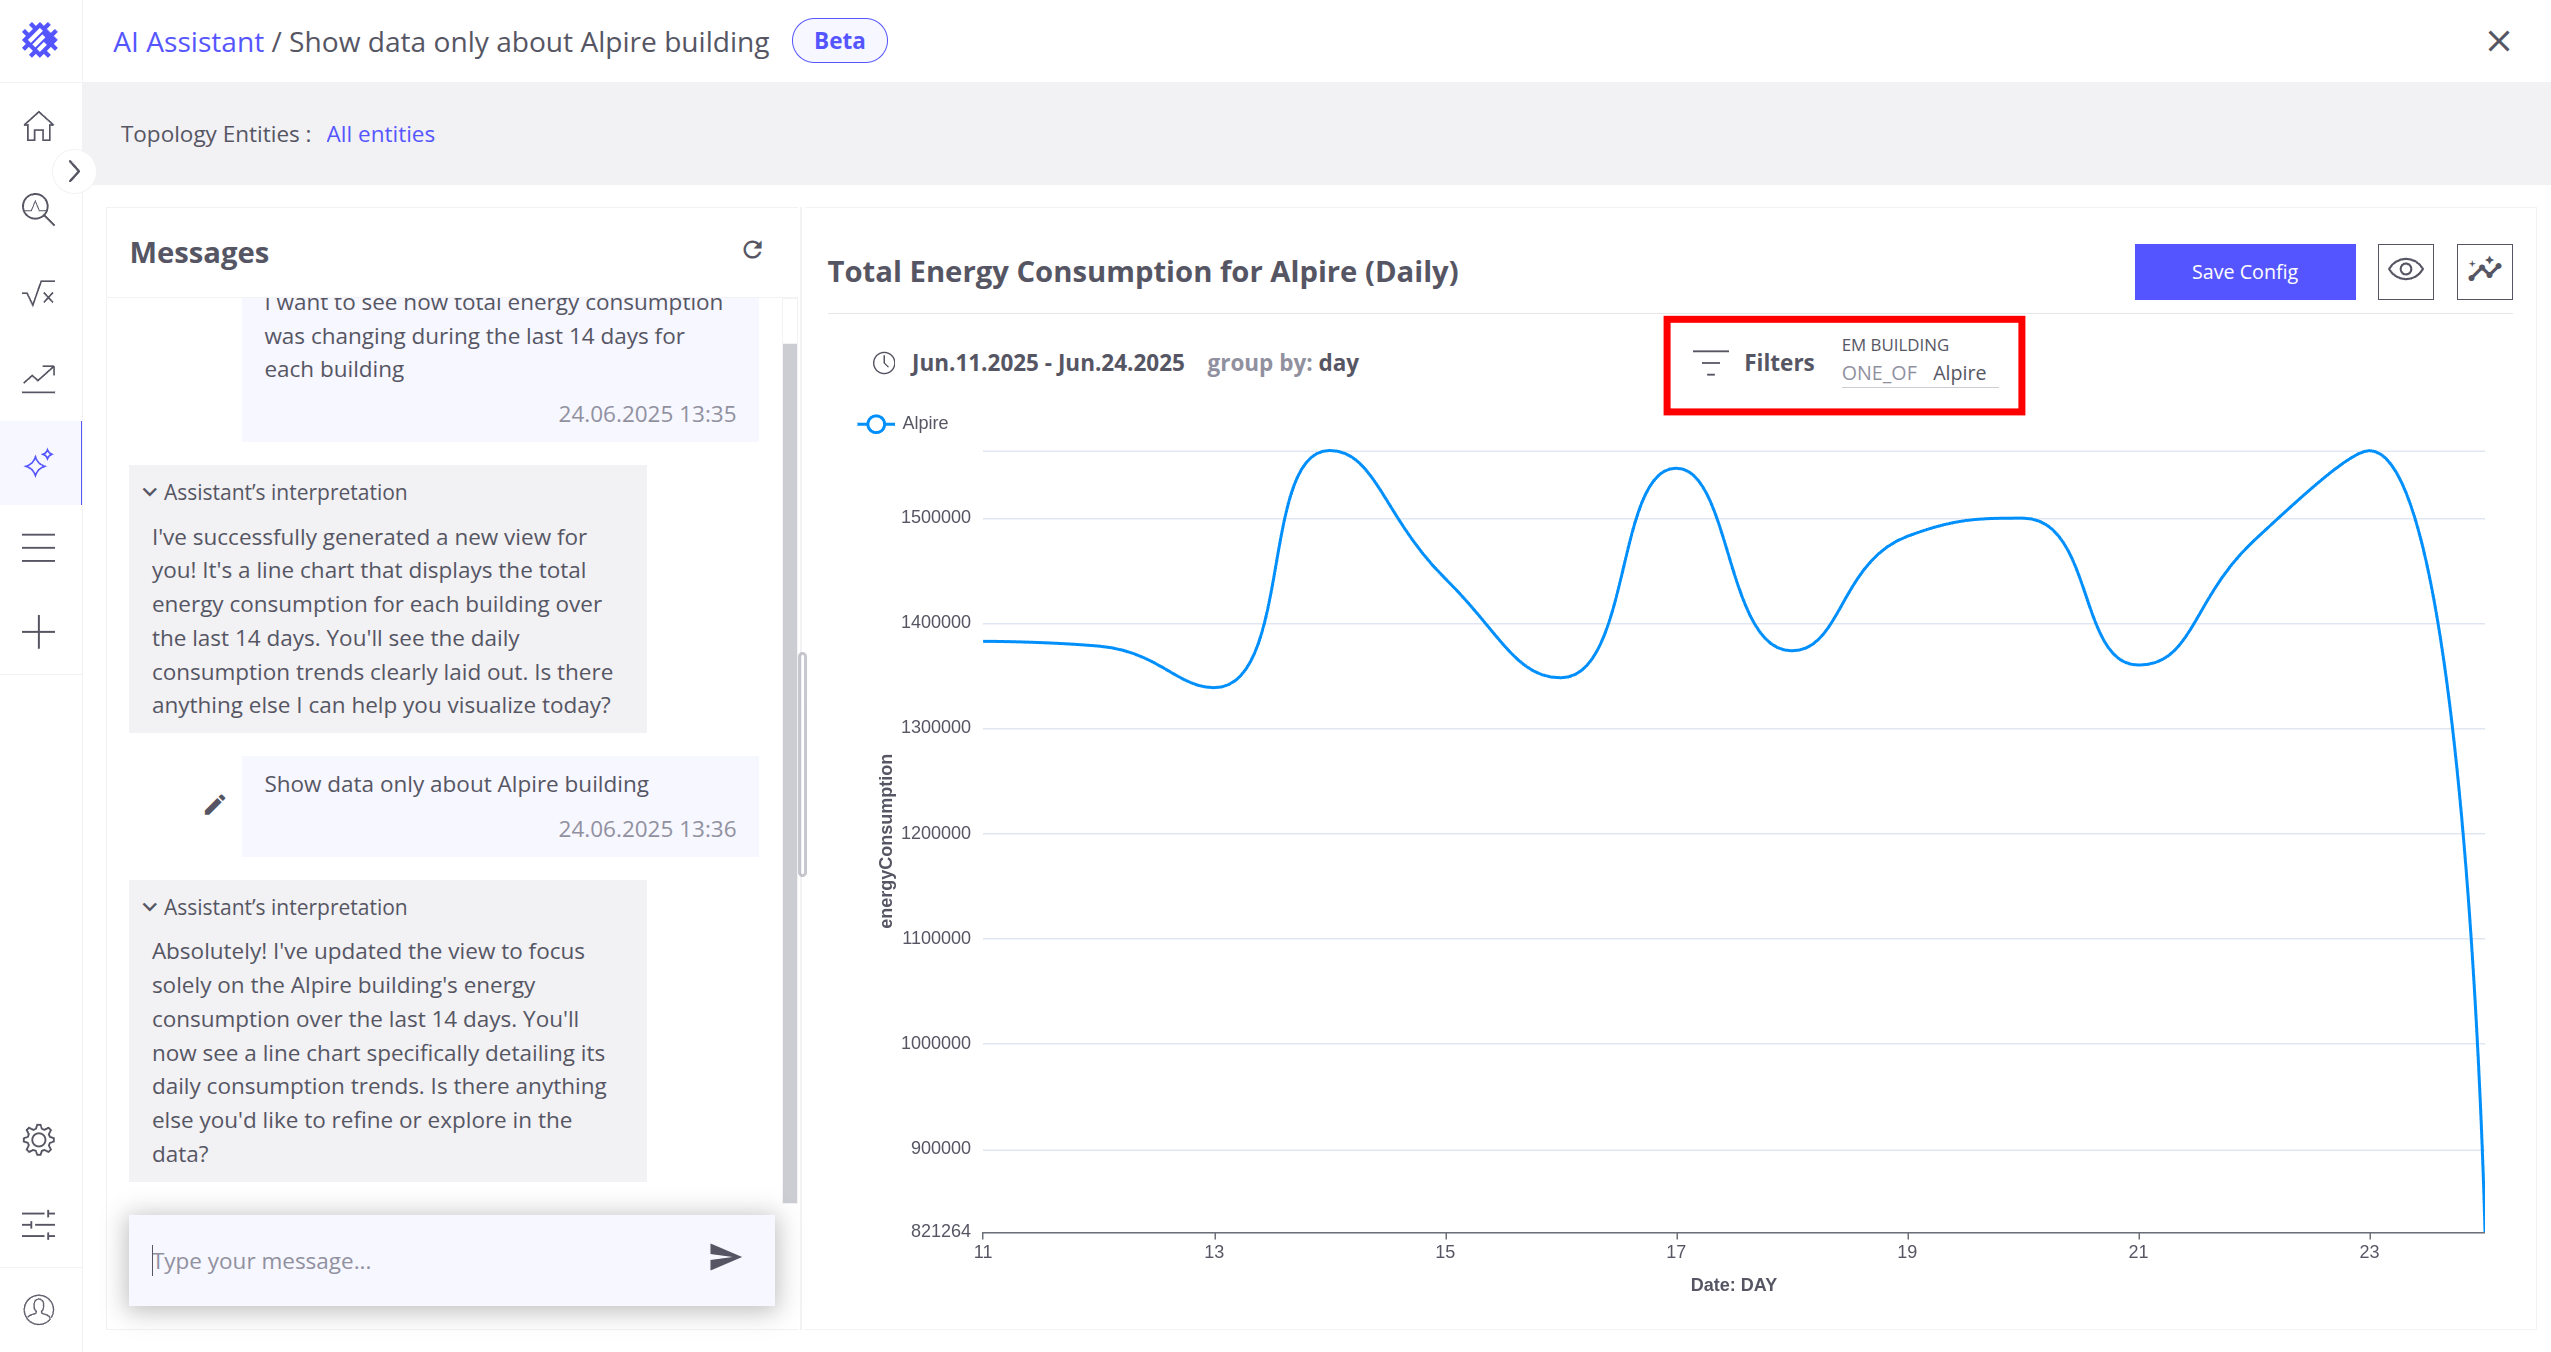
- 继续输入:「仅显示 Alpire 楼栋的数据」
- 可看到系统已自动添加楼栋筛选条件
关于AI助手的更多说明见此处。
下一步
-
安装指南 - 学习在各种操作系统上部署 Trendz。
-
指标探索器 - 学习使用 Trendz Metric Explorer 探索和创建指标。
-
异常检测 - 学习识别数据中的异常。
-
字段计算 - 了解字段计算及使用方法。
-
状态 - 学习基于原始遥测定义和分析资产状态。
-
预测 - 学习进行预测及遥测行为预测。
-
筛选器 - 学习在分析中筛选数据集。
-
可用可视化部件 - 了解 Trendz 中可用的可视化部件及配置方法。
-
分享与嵌入可视化 - 学习将 Trendz 可视化添加到 ThingsBoard 仪表盘或第三方网页。
-
AI 助手 - 学习使用 Trendz AI 功能。