
- Share via ThingsBoard dashboard
- Embed visualization on external site
- Blocked View problem
- Next Steps
All interactive visualizations created with the Trendz Analytics Platform could be shared with other users and embed on ThingsBoard Dashboards or external sites. In this guide, you will learn how to do this.
Share via ThingsBoard dashboard
You can share created visualizations or even provide a self-service interface for your users by adding Trendz widgets on ThingsBoard dashboards. Follow 2 simple steps to make it:
Import Trendz widget bundle
For ThingsBoard 3.4+ and Trendz 1.9+
- Go to Trendz settings page - http://{my-domain}/trendz/settings
- Navigate to Trendz Widget Bundle Management section
- Press Upload bundle to ThingsBoard button to add Trendz widget library to the ThingsBoard.
For ThingsBoard 3.3+ and Trendz 1.8+
Starting from ThingsBoard 3.3 and Trendz 1.8 - Trendz widgets can be natively embedded into the ThingsBaord dashboard. Native Trendz widgets works much faster compared to original Trendz widgets that are based on iFrame.
Add native Trendz library into ThingsBaord extensions:
- Download Native Trendz Library
- Deploy library into ThingsBoard extension directory
1
2
3
4
5
6
scp trendz-tb-lib-1.8.0-SNAPSHOT.jar ubuntu@${THINGSBOARD_SERVER}:~/.

ssh ${THINGSBOARD_SERVER}

sudo cp trendz-tb-lib-1.0.0-SNAPSHOT.jar /usr/share/thingsboard/extensions/
sudo chown thingsboard:thingsboard /usr/share/thingsboard/extensions/trendz-tb-lib-1.0.0-SNAPSHOT.jar
- Restart ThingsBoard service to apply changes
1
sudo service thingsboard restart
Import Native Trendz widgets bundle
- Download Native_Trendz_widgets_bundle
- Login as Tenant Administrator into ThingsBoard and go to Widget Library
- Press Add new widget bundle and select import widget bundle
- Import downloaded widget bundle
For ThingsBoard 3.0 - 3.2
- Download a Trendz_widgets_bundle V3
- Login as Tenant Administrator into ThingsBoard and go to Widget Library
- Press Add new widget bundle and select import widget bundle
- Import downloaded widget bundle
For ThingsBoard 2.x
- Download a Trendz_widgets_bundle V2
- Login as Tenant Administrator into ThingsBoard and go to Widget Library
- Press Add new widget bundle and select import widget bundle
- Import downloaded widget bundle
This bundle contains 3 widgets:
- Trendz View Static- allow adding saved Trendz visualizations into ThingsBoard dashboards
- Trendz View - with filter alias- similar to previous but also support dashboard aliases for resolving entities
- Trendz Builder - Trendz Visualization Builder for providing self-service interface to your end-users, so they can create their own analysis using ThingsBoard dashboard.
Note: If after importing Trendz Widget Bundle into ThingsBoard, widgets do not work and white screen with error displayed - double-check that correct bundle was imported. Widget API in ThingsBoard v2.x and v3.x is different. Ensure that you downloaded bundle for the correct ThingsBoard version.
Add visualization on ThingsBoard Dashboard
Once widgets bundle imported and you already have saved Trendz Visualization - follow next steps to add them on the dashboard:
- In Trendz, open required visualization
- Press Share button, sharable URL will be copied into the clipboard
- Open required ThingsBoard Dashboard and press Edit button
- Select Trendz View Static widget from Trendz Bundle and add it on the Dashboard
- Switch to Advanced tab of the widget and insert the copied URL from step 1
- Save dashboard
Use Dashboard alias in Trendz View
In this case you want to conect standard ThingsBoard widgets located on the dashboard with Trendz View. You can do this using ThingsBoard dashboard aliases and Trendz View - with filter alias from Trendz widget Bundle.
Example: we have 10 Machine devices in ThingsBoard. We want to create a dashboard that will show all Machine devices in a list and once device selected - other widget on the dashboard should show details about selected device. In total we will have 2 widgets on the dashboard:
- Entity List - will show list of devices
- Trendz view - line chart that will show temperature of selected device
On ThingsBoard side we setup a dashboard and add 2 widgets. Detailed instruction how to do this is not part of this tutorial, so here are brief steps:
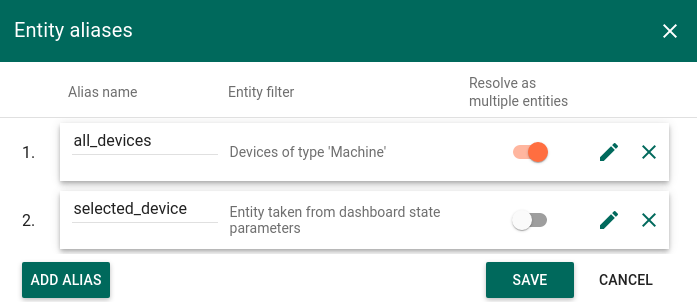
- Create all_devices alias that resolves all devices with type Machine
- Create selected_device alias with type entity form dashboard state - this alias hold reference to selected device
- Add Entity List widget and use all_devices alias as a datasource
- Configure On row click action that will save selected device to selected_device alias
- Save dashboard
On Trendz View side:
- Open view in Trendz
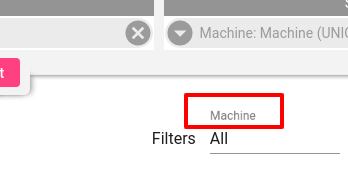
- Add Machine field to filter section - it will allow us to filter Machines by name
- Save View
- Copy Link to this view
Return to ThingsBoard Dashboard:
- Edit dashboard
- Add Trendz View - with filter alias from Trendz widget Bundle to the dashboard
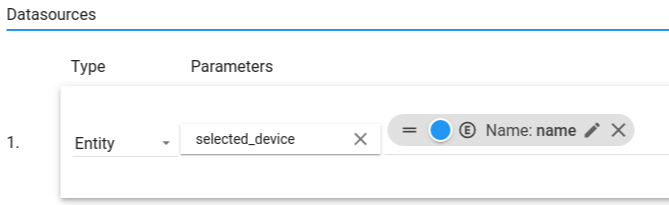
- Set selected_device as a datasource for Trendz View
- Use name as a key from alias
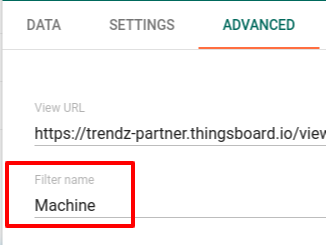
- Switch to Advanced tab
- Insert link to view into View URL
- Insert Machine into Filter Name - content of this field should be the same as it typed in Trendz View Filter
- Save Dashboard
Now, every time when selected_device alias updated, value if its Entity Name would be inserted into Trendz View filter.
If multiple filters configured in Trendz View - system will match required filter by name.
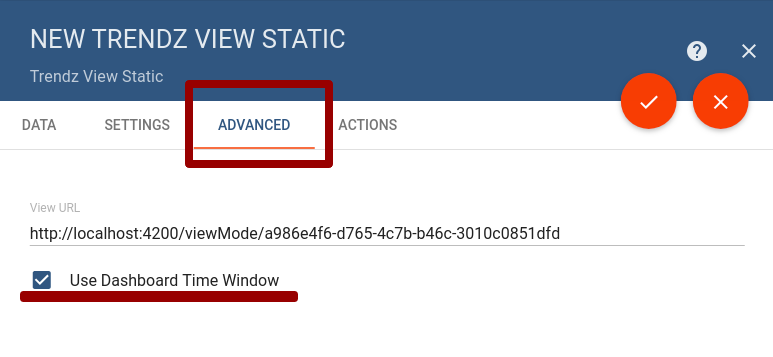
Use Dashboard time window
By default, all Trendz visualizations use individual time range. However you can change this behavior and configure widget to toke time from ThingsBoard Dashboard. This option available for both, Static Trendz widget and for Trendz View with aliases.
- Open Dashboard Edit Mode
- Select required Trendz Widget
- Switch to Advanced Tab
- Enable checkbox Use Dashboard Time Window
Configure OnRowClock action
Trendz Table view support onRowClick action. You can configure what should happen when user click on a Row in a table. For example you can save entity to the Dashboard state alias or open new dashboard state.
To enable row click event:
- Add Trendz Table View on ThingsBoard dashboard.
- Open widget edit mode and switch to Actions tab.
- Press Add action button.
- In Action source field select On row click.
- Proceed standard widget action configuration.
Each row has multiple fields from on or multiple devices/assets. It means that 1 row can be connected with multiple items. If you want to use ‘onRowClick’ action - you need to define what item is selected when row clicked.
- Open View Settings in Trendz View edit mode.
- Open View Mode fields section.
- Select required Device/Asset type in Row click entity dropdown.
- Save changes.
Configure Date selected action
Configure Switch Field action
Embed visualization on external site
You can also embed Trendz visualization into your web site by adding iFrame that points to required visualization.
Add iFrame on your site with the following URL http://{TRENDZ_URL}/viewMode/{VIEW_ID}?jwt={JWT_TOKEN}. Where:
- TRENDZ_URL - url of Trendz service
- VIEW_ID - ID of saved visualization inside Trendz
- JWT_TOKEN - ThingsBoard JWT token that should be used to authenticate in the ThingsBoard
Blocked View problem
If HTTPS was not enabled for Trendz it is possible that visuals shared on 3rd party websites or on ThingsBoard Dashboard would be blank.
The problem is that most browser block mixed content requests: if ThingsBoard use HTTPS and Trendz does not - browser will block requests to Trendz. You can find detailed error in browser console.
For fixing this - you need to enable HTTPS for Trendz UI. Find details how to do this in Trendz installation guide.
Next Steps
-
Getting started guide - These guide provide quick overview of main Trendz features.
-
Installation guides - Learn how to setup ThingsBoard on various available operating systems.
-
Calculated Fields - Learn about Calculated fields and how to use them.
-
States - Learn how to define and analyse states for assets based on raw telemetry.
-
Group and Aggregate data - Learn how to group and aggregate data in Trendz.
-
Prediction - Learn how to make forecasts and predict telemetry behavior.
-
Filters - Learn how filter dataset during analysis.
-
Available Visualizations - Learn about visualization widgets available in Trendz and how to configure them.
