- Function 标签页
- 输入标签页
- Output 标签页
- 任务标签页
- Examples
- Saving and Editing Calculations
- Using Calculations in View Fields
- Disabled Calculation
- 下一步
字段计算是 Trendz 中用于 KPI 监控和预测的强力功能。可应用统计函数、基于输入数据创建新数据项,并实时完成计算。 这确保ThingsBoard数据库中的数据不会被破坏或承受额外负载。Trendz 提供用于创建和管理这些字段计算的工具,支持复杂计算和自定义公式,用于数据分析与可视化。 此外,可将计算结果作为遥测存储到 ThingsBoard,提升数据的可用性和集成性。
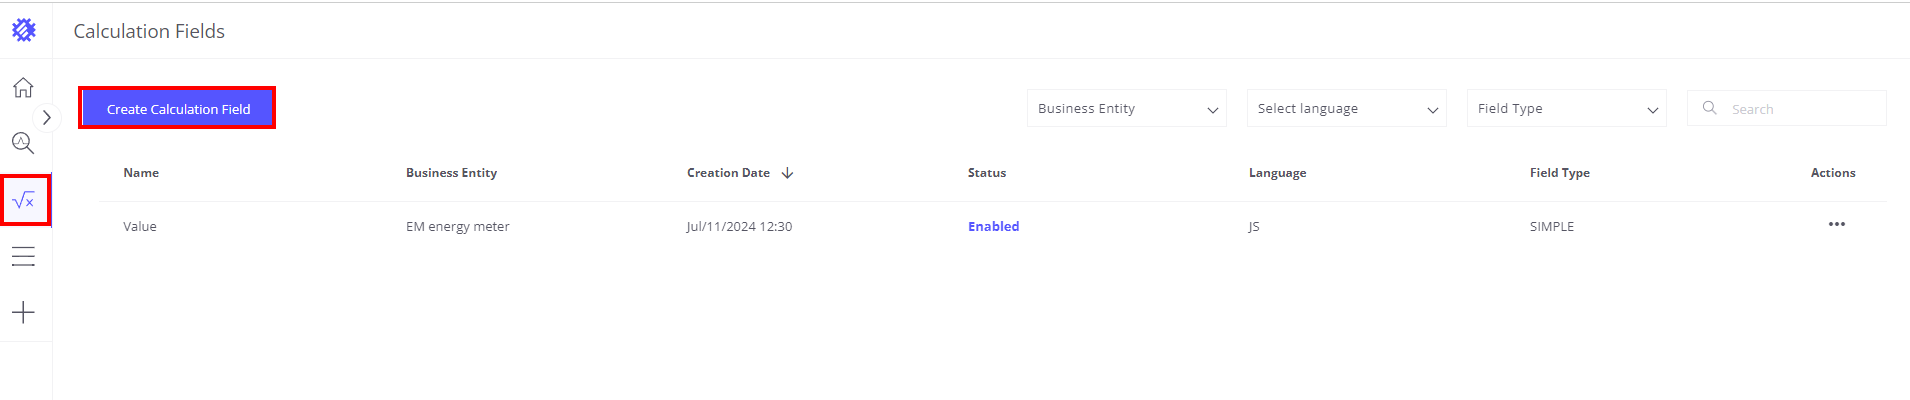
访问字段计算工具:点击工作区左侧标有 “Calculation Fields” 的 √x 图标。
该区域中,表格列出所有已创建的字段计算及主要信息。可对任意字段进行打开、修改或其他操作。 要创建新字段计算,点击 “Create Calculation Field” 按钮。
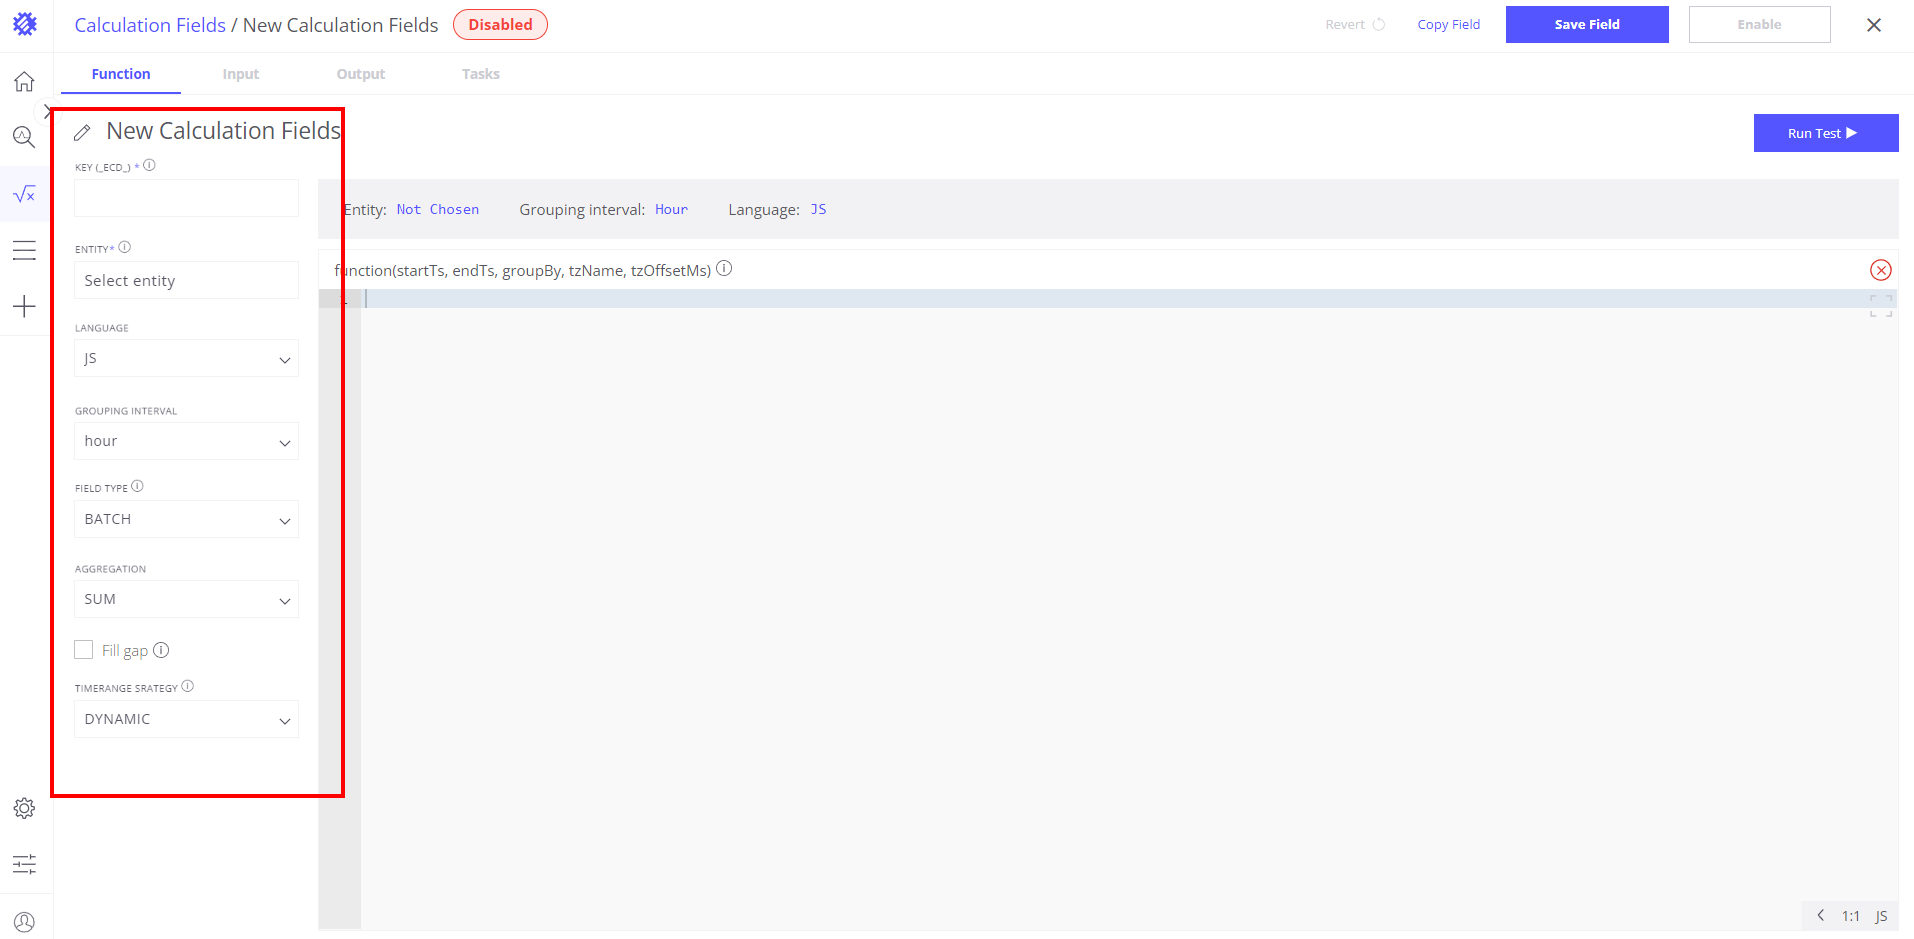
Function 标签页
在 Function 标签页中可配置影响数据计算的参数,各选项含义如下:
KEY: 计算结果在ThingsBoard中保存时使用的标识符,带前缀 _ECD_。(必填)
ENTITY: 字段计算所关联的业务实体,影响实体设置、可视化和筛选。(必填)
LANGUAGE: 计算函数使用的脚本语言,可选 JavaScript(默认)或 Python。
- JavaScript: 使用 ECMAScript 5.1 编写转换函数。
- Python: 支持 Python 3.8 及 Flask、NumPy、Pandas 等库。
GROUPING INTERVAL: 数据分组的时间间隔(如小时、天、周、月)。
FIELD TYPE:
- Simple: 每次处理一个值。
- Batch: 处理整段原始遥测数组。
AGGREGATION: 数据聚合方式,可选 AVG、SUM、LATEST、MIN、MAX、COUNT、UNIQ 等。
对分组后的数据应用聚合函数,详见聚合说明。
Fill Gap: 以不同方式填补缺失遥测,具体在 TIME UNIT 和 STRATEGY 中设置。
TIMERANGE STRATEGY: 刷新任务时的数据加载策略:
- Dynamic Strategy: 自上次计算以来加载新数据。
- Fixed Strategy: 每次使用预设时间范围。
字段计算的函数编写说明见对应文档。可按需启用批处理模式以使用聚合数据或原始数据。
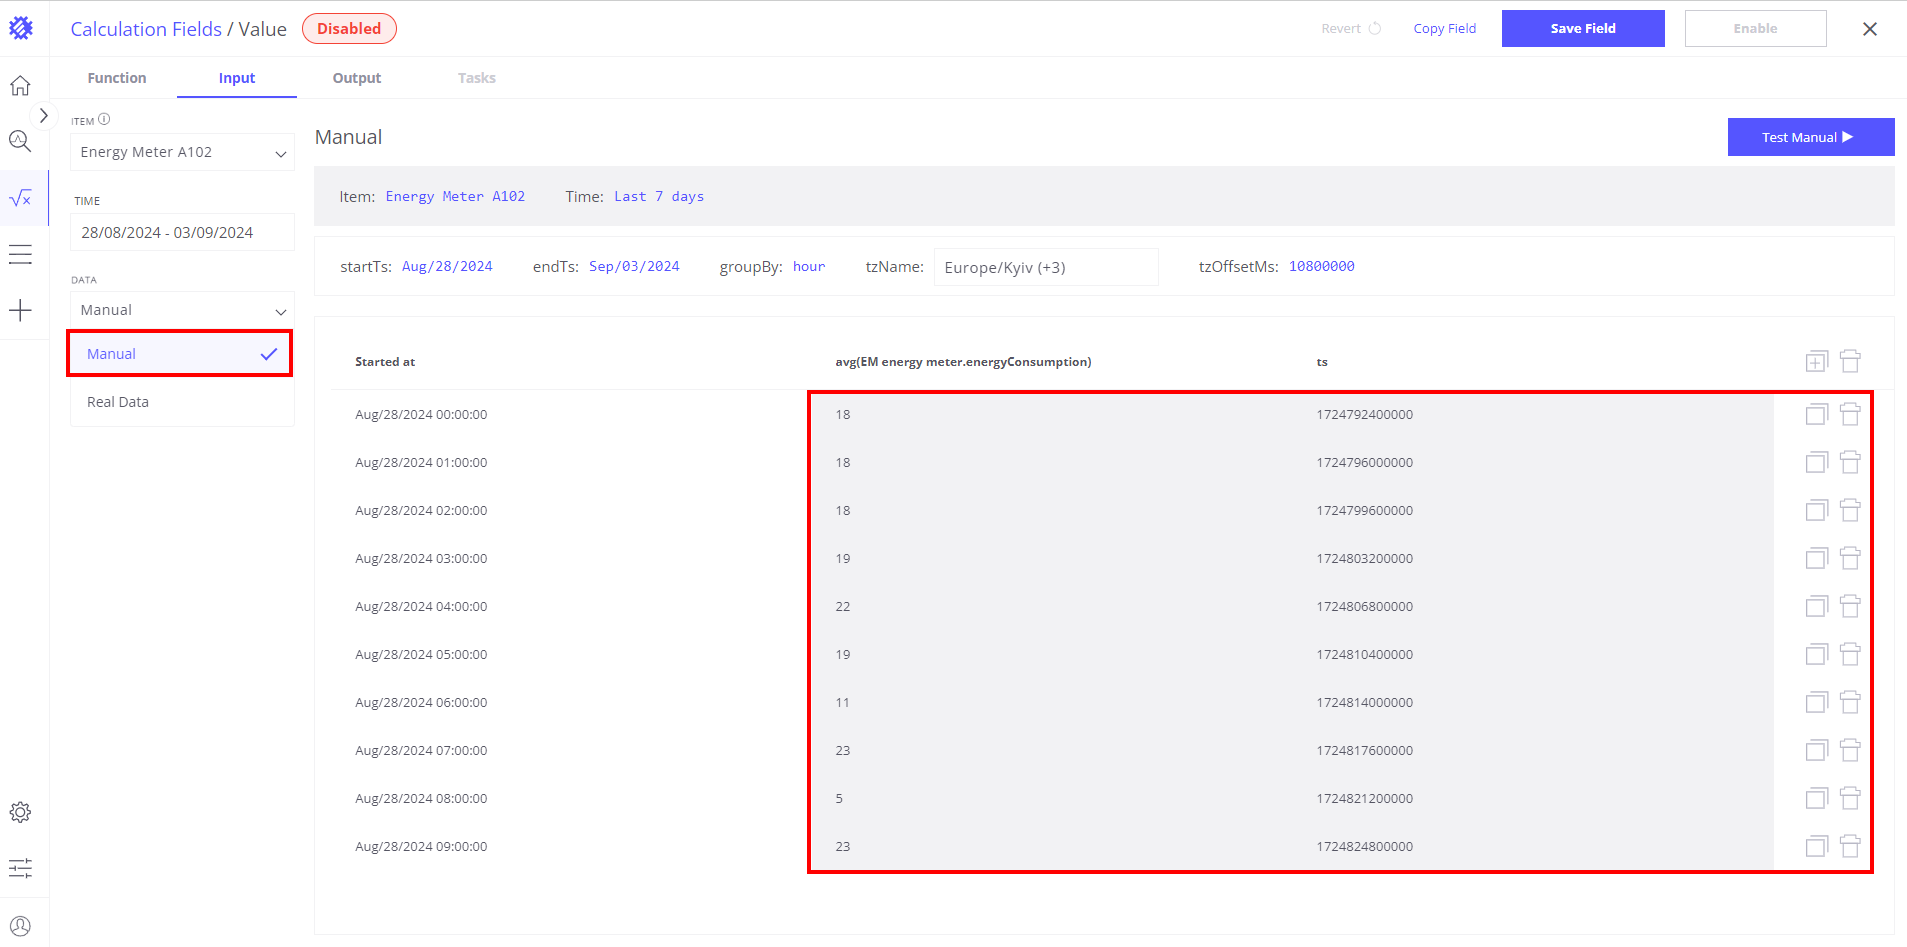
输入标签页
输入部分允许您定义和理解将用于计算的数据。以下是各字段的详细说明:
数据字段:
- 真实数据: 显示基于指定参数的只读输入数据。
- 手动: 允许自定义数据输入用于测试。手动输入的数据可以删除、复制或修改。可编辑的字段背景为灰色。
主要字段:
- startTs(开始时间戳): 定义计算的开始时间。
- endTs(结束时间戳): 定义计算的结束时间。
- groupBy: 设置数据分组的时间间隔。
- tzName(时区名称): 选择时区。
- zOffsetMs(时区偏移量(毫秒)): 按本地时区调整数据。
此设置确保数据定义正确,从而实现准确的计算和有用的洞察。
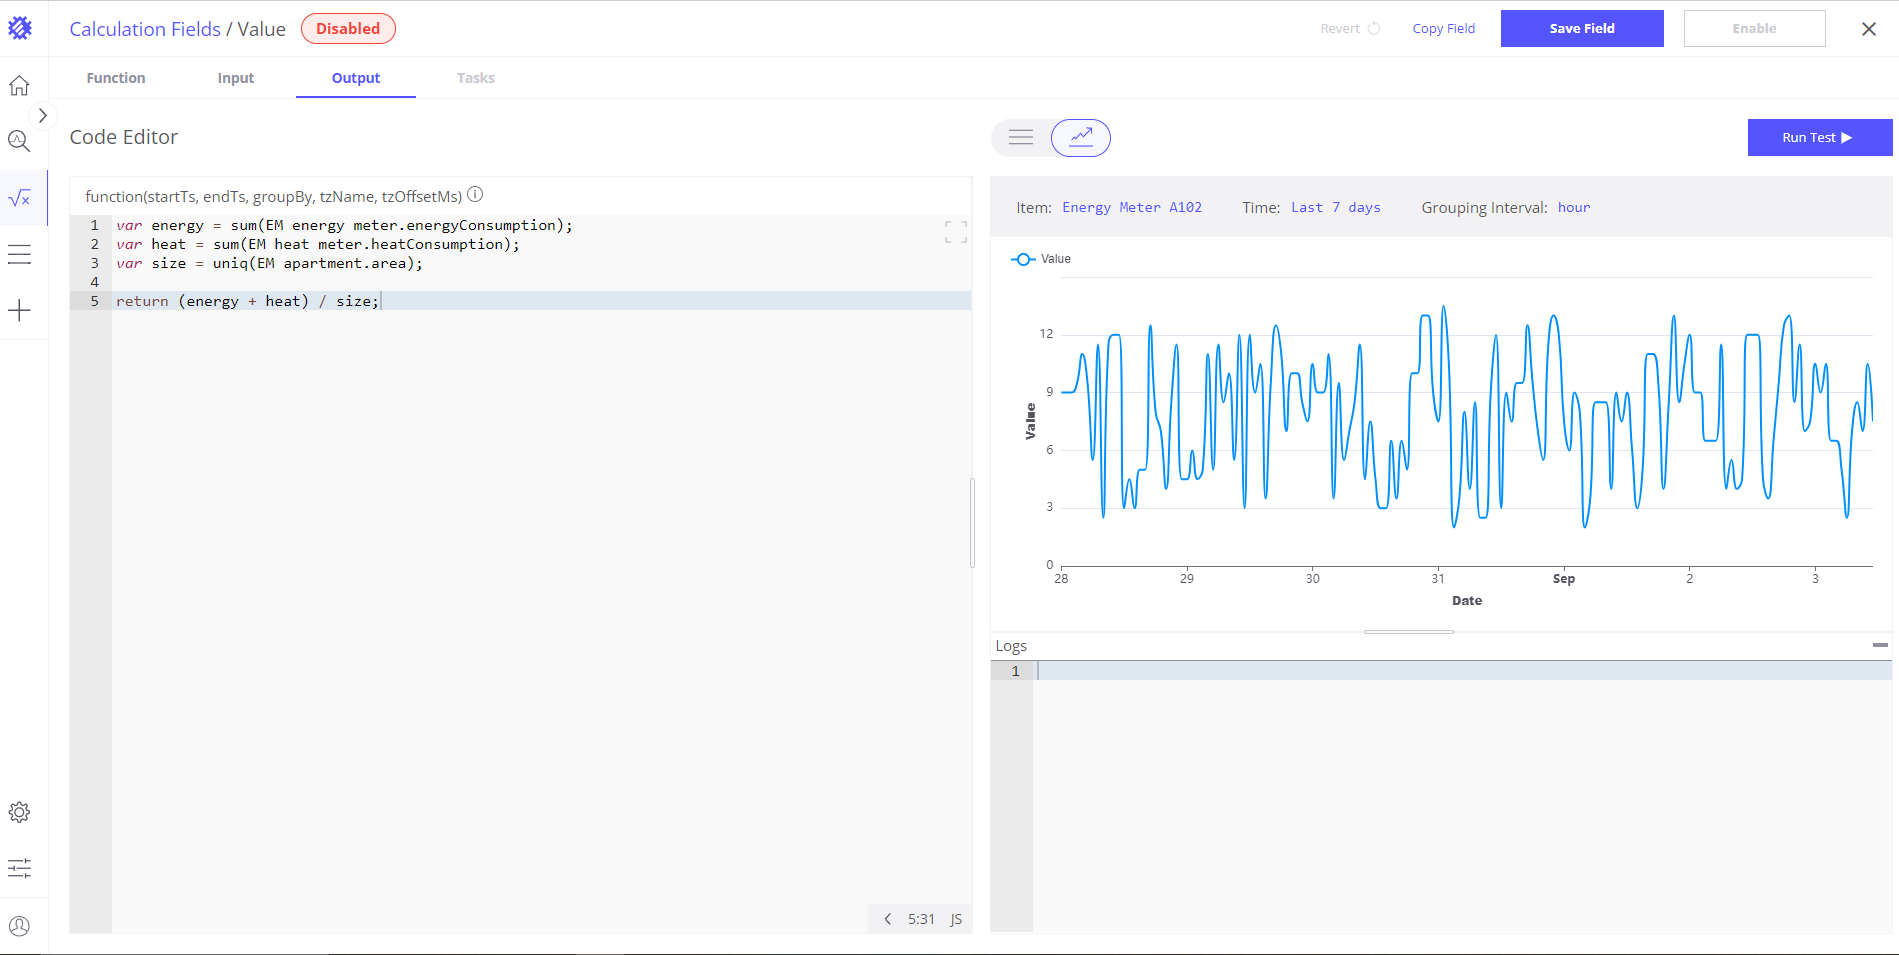
Output 标签页
点击「Run test」后进入 Output 标签页,包含以下模式:
Function: 修改已定义的计算逻辑用于测试。
Output Data: 查看计算结果(简单值或数组),可以表格或折线图展示。
Logs: 显示与浏览器控制台类似的日志。
任务标签页
任务标签页展示该字段计算下所有已发起任务及其状态(已完成、进行中或待执行)。更详细的任务管理说明见文档对应章节。
Examples
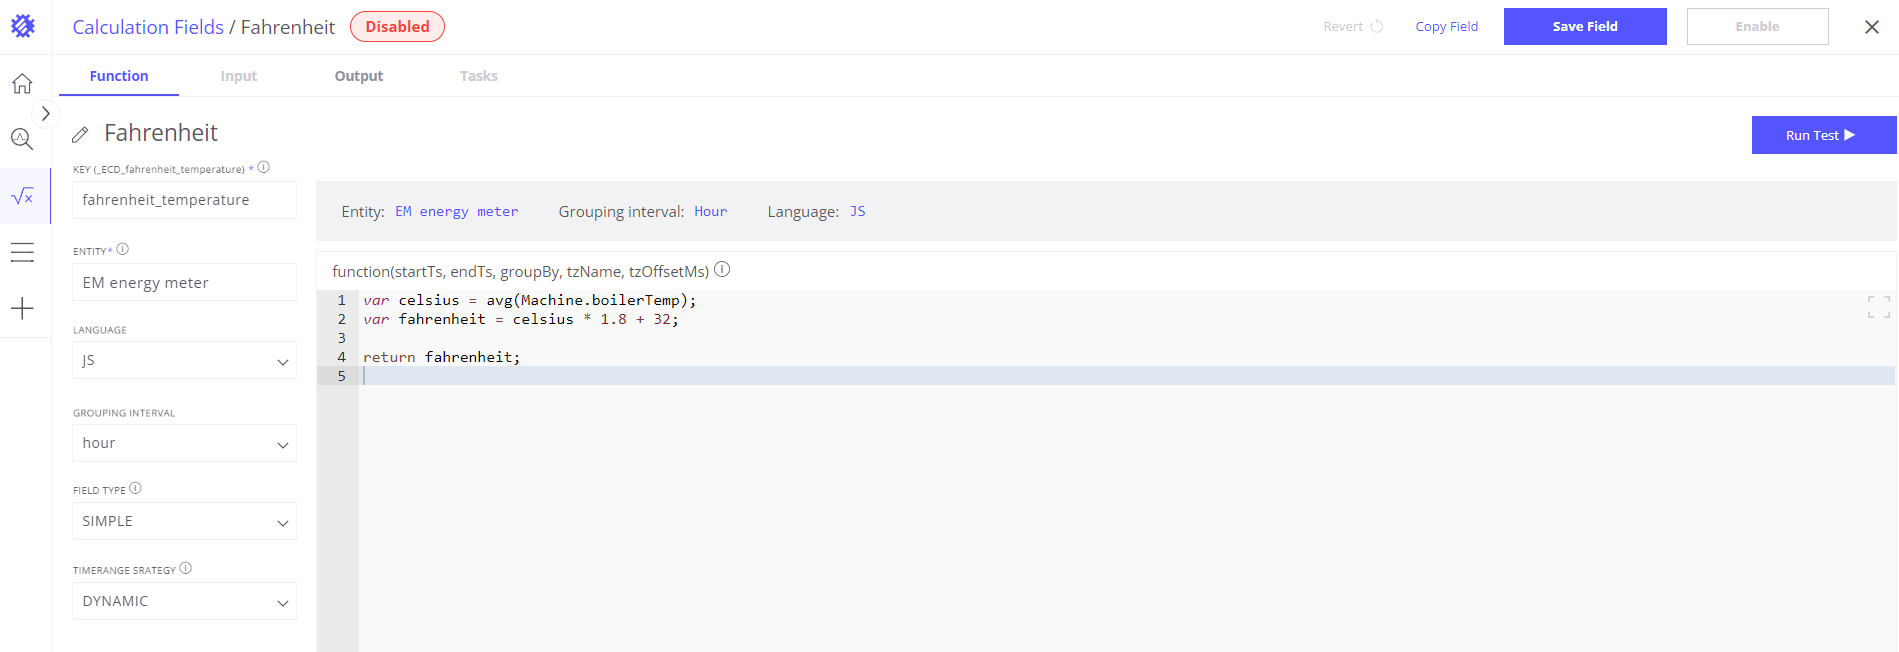
Simple calculation
Let’s assume that sensor submit boiler temperature in Celsius and we want convert it to Fahrenheit:
1
2
3
var celsius = avg(Machine.boilerTemp);
var fahrenheit = celsius*1.8 + 32;
return fahrenheit;
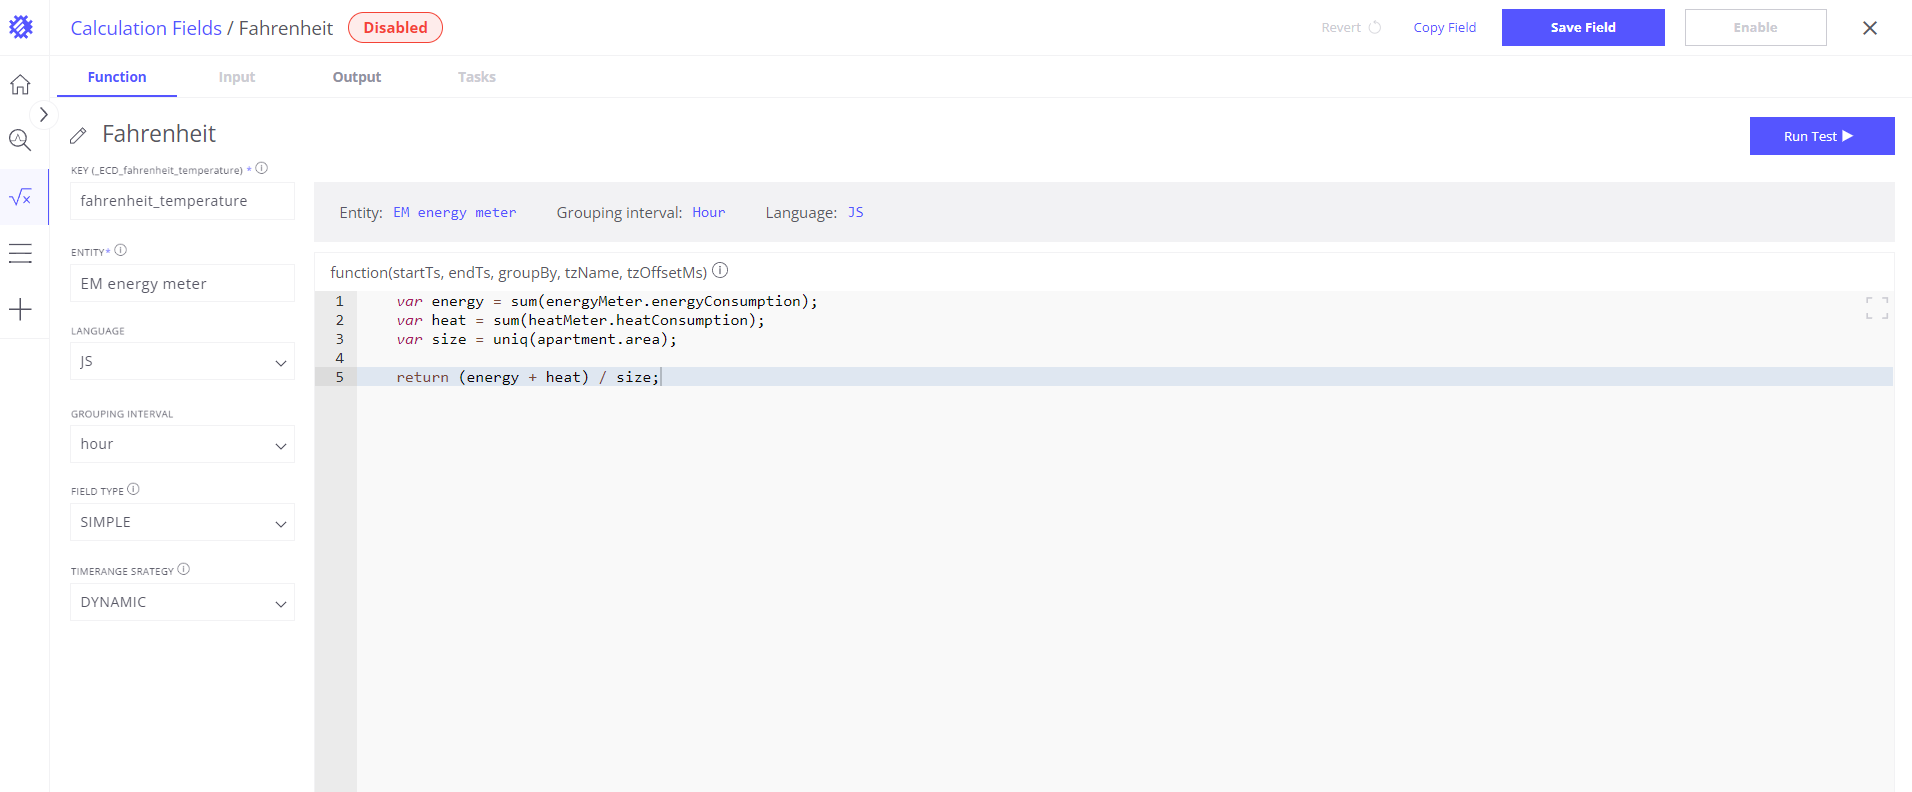
Multiple fields for calculation
In this example we have Apartment asset that has 2 sensors installed - HeatMeter and EnergyMeter. Both sensors submit how much energy was consumed. Also Apartment has area attribute that contains apartment size. We want calculate total energy consumed by HeatMeter and EnergyMeter in Apartment per square meter. Let’s break it to subtasks:
- Get amount of energy consumed by HeatMeter - heatConsumption telemetry
- Get amount of energy consumed by EnergyMeter - energyConsumption telemetry
- Get Appartment size - area attribute
- Sum heatConsumption and energyConsumption
- Devide it by area
1
2
3
4
5
var energy = sum(energyMeter.energyConsumption);
var heat = sum(heatMeter.heatConsumption);
var size = uniq(apartment.area);

    return (energy + heat) / size;
Get original field value
Before applying transformation you need to get a reference to the original field value. Here is an example how to do this:
1
var temp = avg(Machine.temperature);
- avg() - aggregation function
- Machine - Entity Name (it can be Asset Type or Device Type)
- temperature - Field Name
All 3 parts are required, you can not access original field value without aggregation function.
If original field value is an attribute, entity name or owner name - you should use uniq() aggregation function.
Saving and Editing Calculations
After creating a calculated field, you can save it for future use by clicking the “Save Field” button located in the upper right corner. The saved field will appear in the list of business entities within the view fields, using the specified name from the calculation. If a field with the same name or key already exists, the system will notify you of the duplicate.
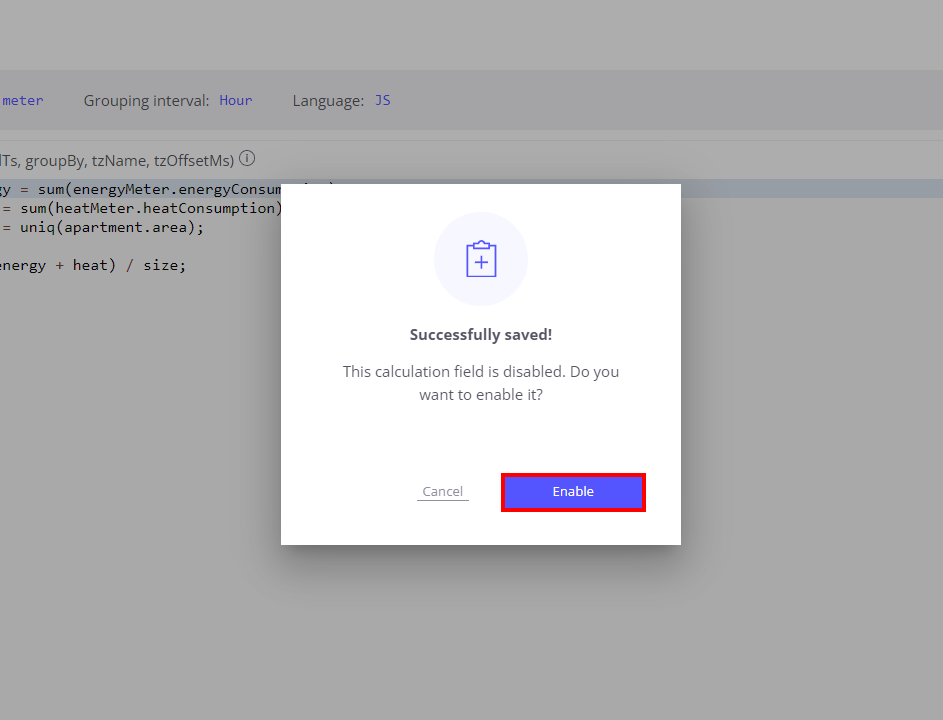
Enabling Calculated Fields
During the saving process, you have the option to “Enable” the calculated field. When enabled, the calculated field will be recorded as telemetry in ThingsBoard with the specified parameters.
For more details, refer to the Save Metric to ThingsBoard section.
Modifying and Re-Saving Calculations
Once saved, you can modify your calculations as needed. Here’s how the process works:
Modifying the Calculation:
- Access the Calculation: Navigate to the specific calculation you want to adjust. You can make changes to the formula, update parameters, or modify data sources.
Re-Saving the Calculation:
- Save Changes: After making modifications, save the calculation again.
Applying Changes to View Fields:
- Prompt for Update: Upon re-saving, Trendz will prompt you to apply these changes across all view fields based on this calculation, ensuring consistency in data representation.
- Automatic Update: If you choose to apply the changes, all relevant view fields will automatically update with the new logic or parameters.
Handling Enabled Calculations:
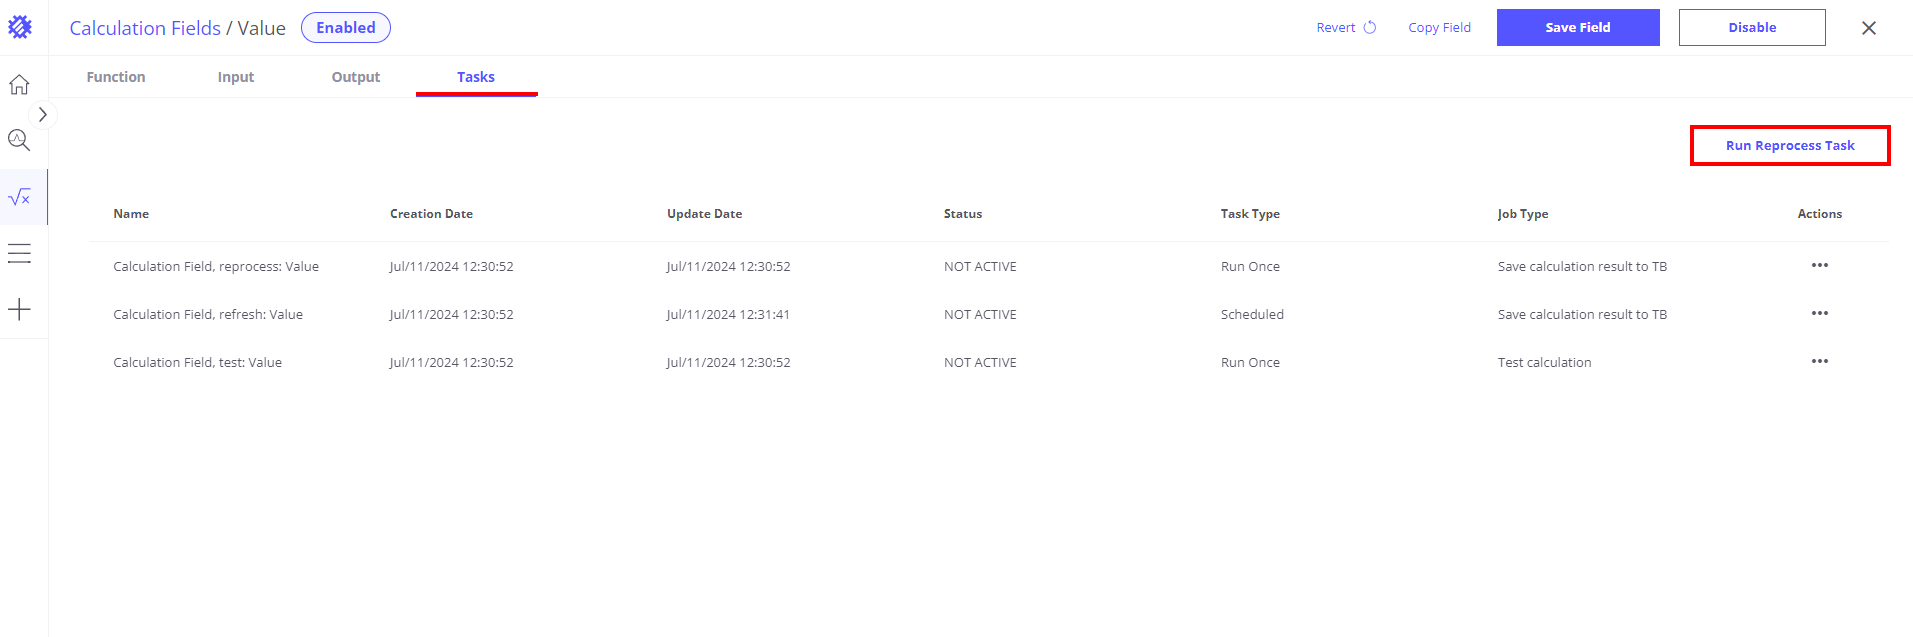
- Reprocess Task: If the calculation was enabled and you modify and re-save it, you will need to run the Reprocess Task to apply the updated logic to historical data.
- Future Data: Without running the Reprocess Task, the updated calculation only applies to new data recorded after re-saving, leaving historical data unchanged.
- How to Run the Reprocess Task: Go to the Tasks tab and click the “Run Reprocess Task” button to apply the updated calculation to all relevant historical data.
This functionality ensures seamless management of calculations, consistently reflecting updates across all areas where the calculation is applied.
Using Calculations in View Fields
Once you have created and saved a calculation in Trendz, it can be used in view fields to enhance data representation and analysis. Here’s how to effectively use these calculations:
Accessing the Calculations in View Fields
- Business Entities List: Calculations created by a tenant will appear in the list of business entities under the name provided during creation. This allows for easy selection and integration into view fields.
- Telemetry Display for Customers: Once enabled, the calculated data becomes visible to end users as telemetry. It will be displayed under the key name defined in the calculation, making it accessible in dashboards and widgets.
Using the Calculation in Views
Simply select the desired calculation to include it in the view field. The data generated by this calculation will now be part of the visual representation in the selected view.
Using Real-Time (RT) and ThingsBoard (TB) Data
- ThingsBoard Data (TB): Calculations saved as telemetry in ThingsBoard can be displayed in view fields for historical or periodically updated data. These calculations update according to the schedule set in the task settings.
- Real-Time Data (RT): For immediate data needs, real-time calculations can be utilized. Note that RT calculations might take longer to process than batch-calculated data.
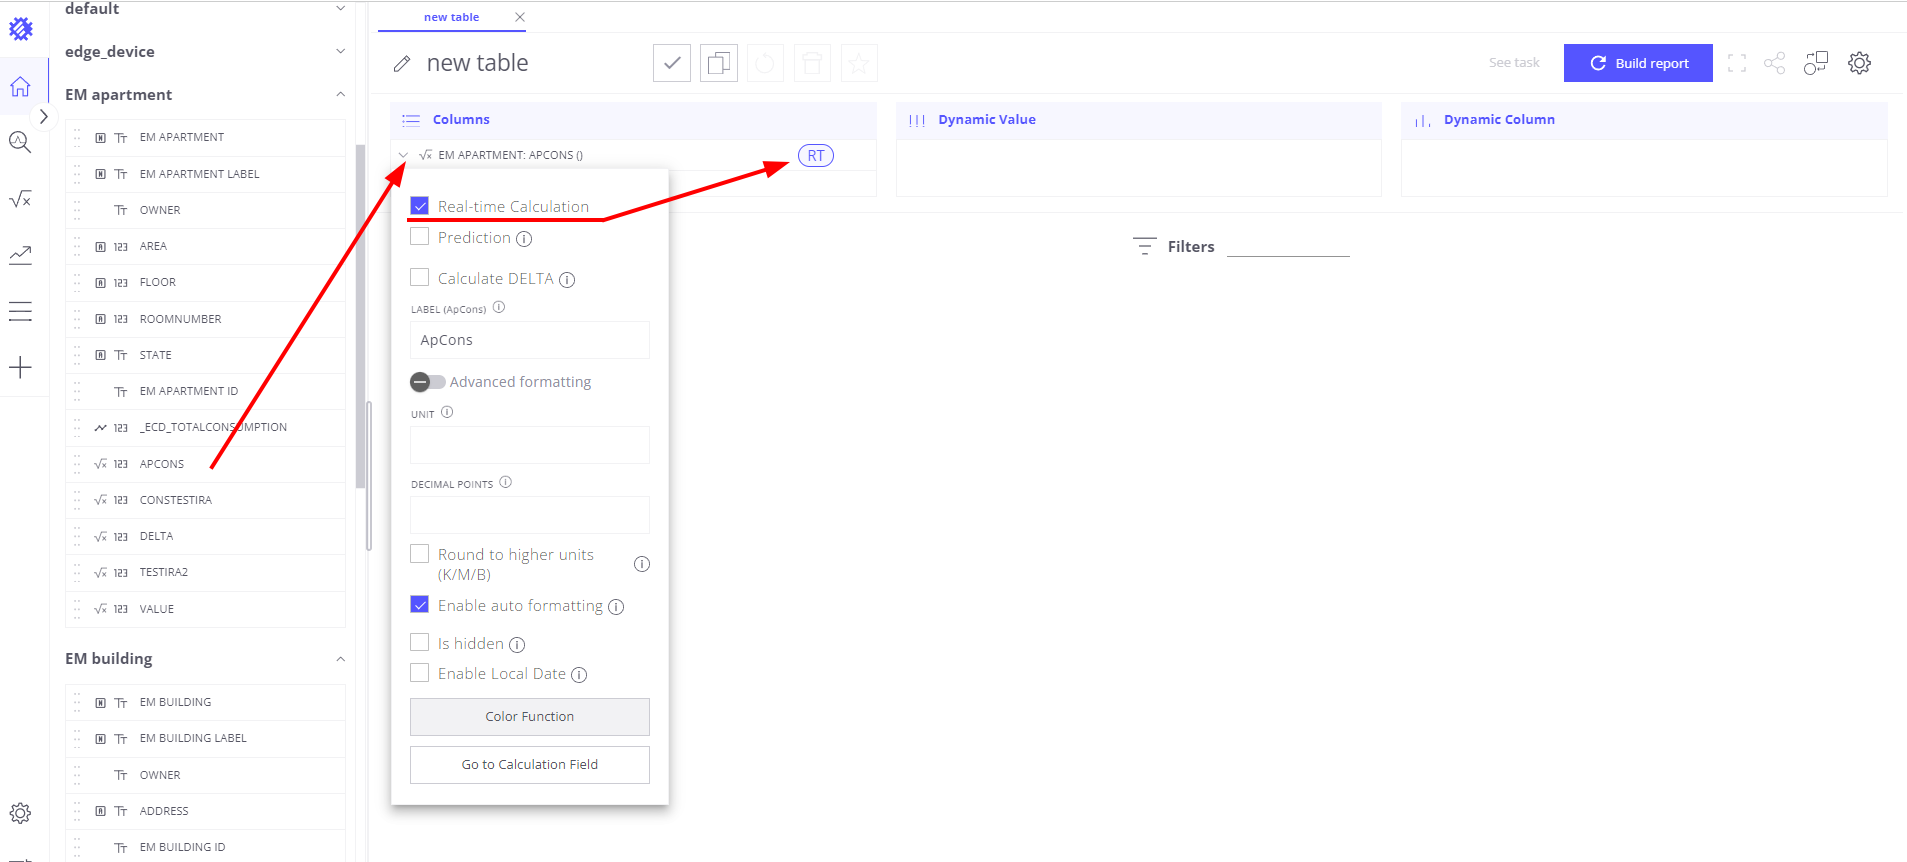
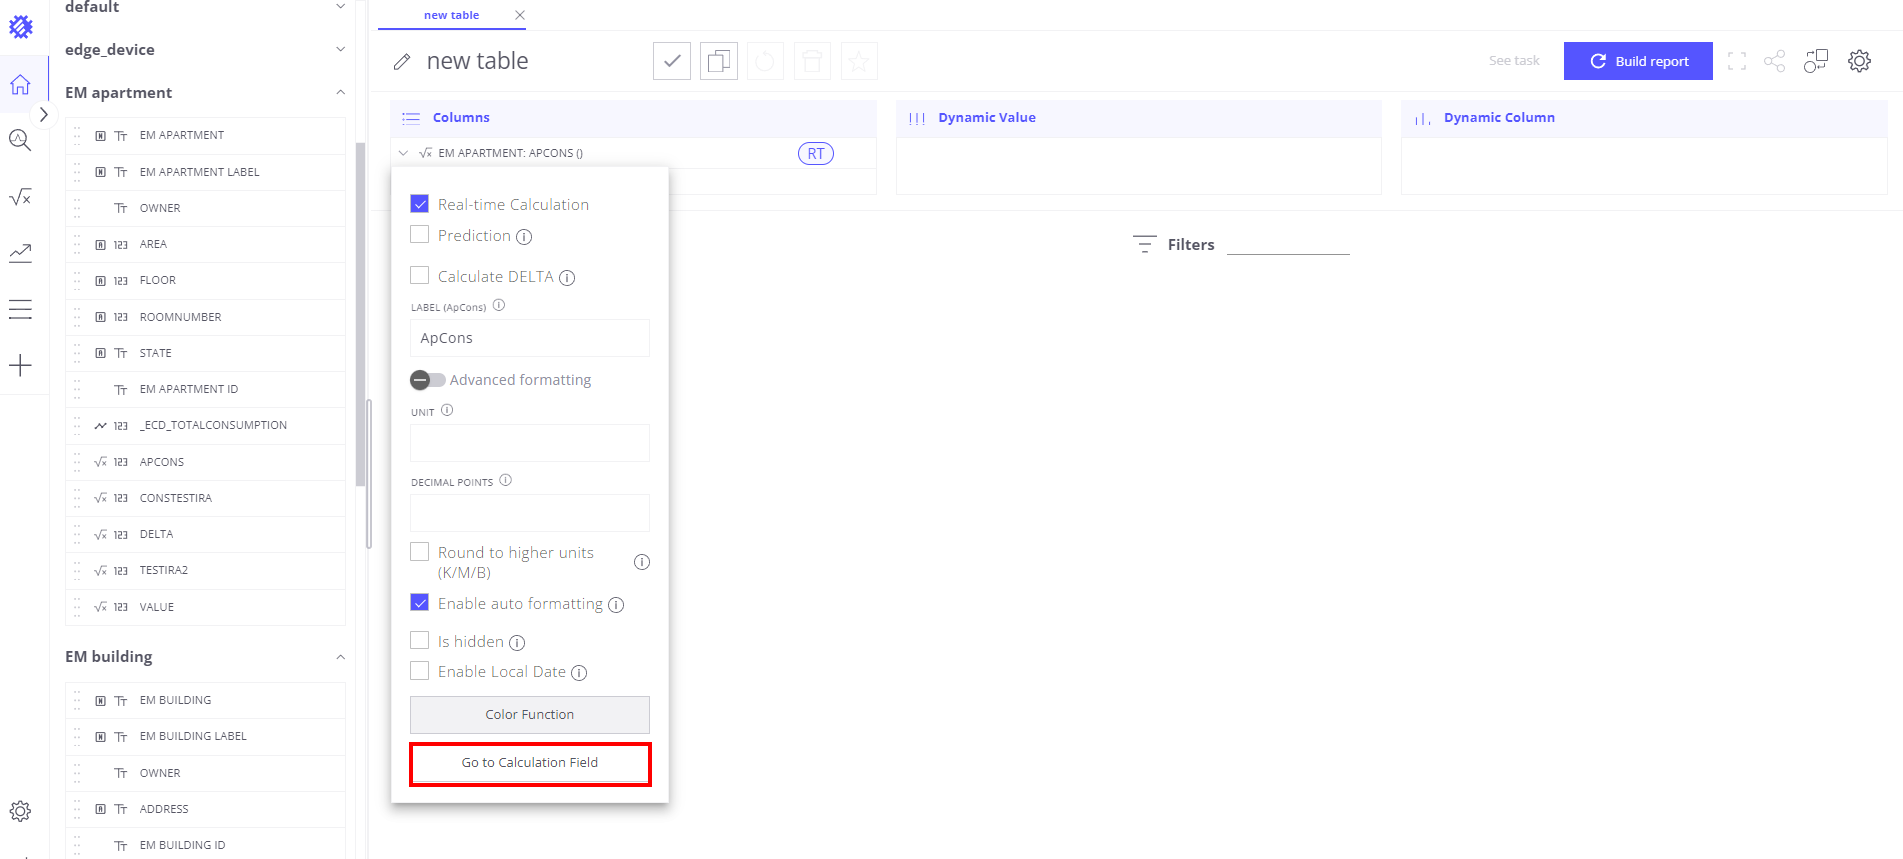
Editing and Managing Calculations:
To adjust or manage a calculation after adding it to a view field, access the calculation settings directly from the view field configuration by pressing the “Go to calculation field” button.
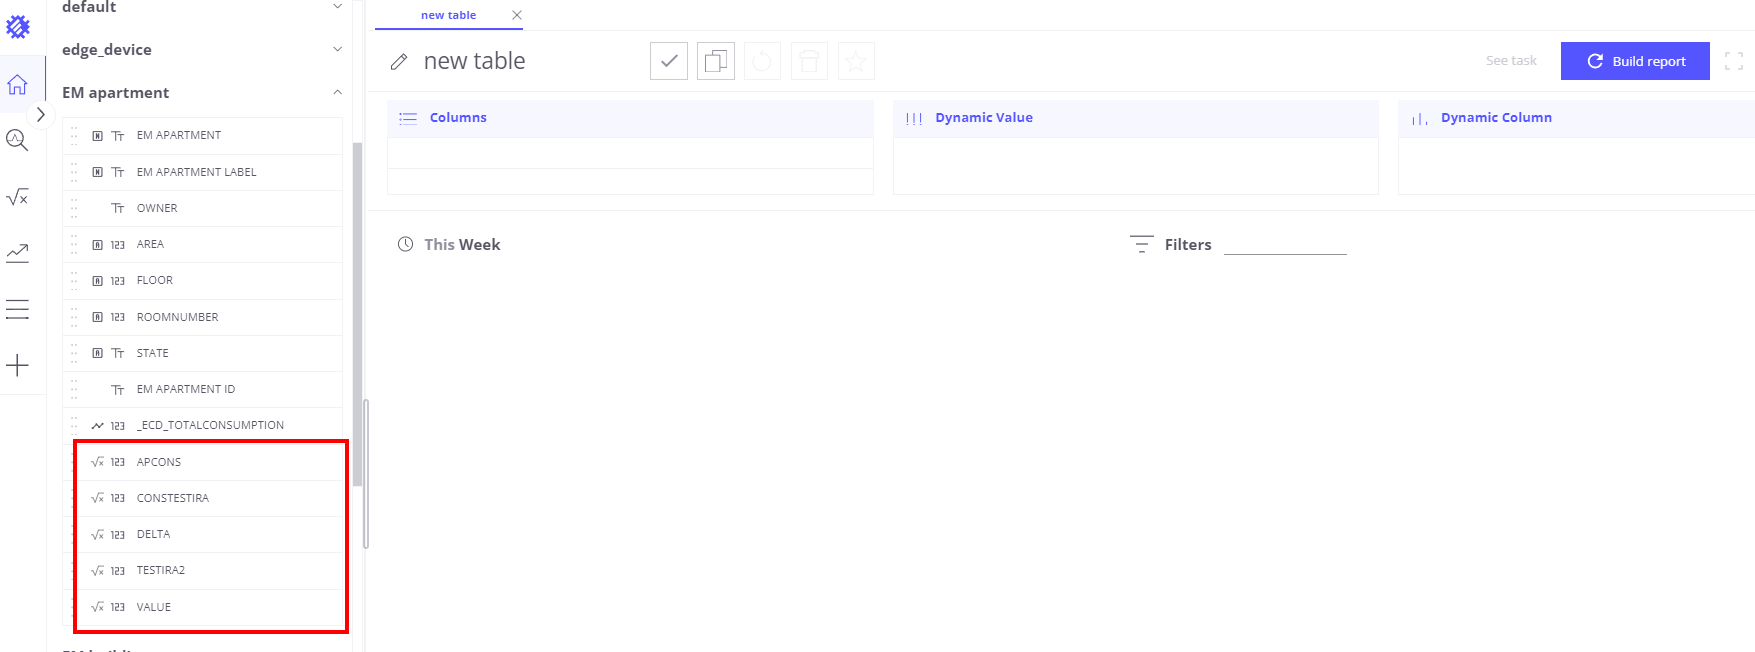
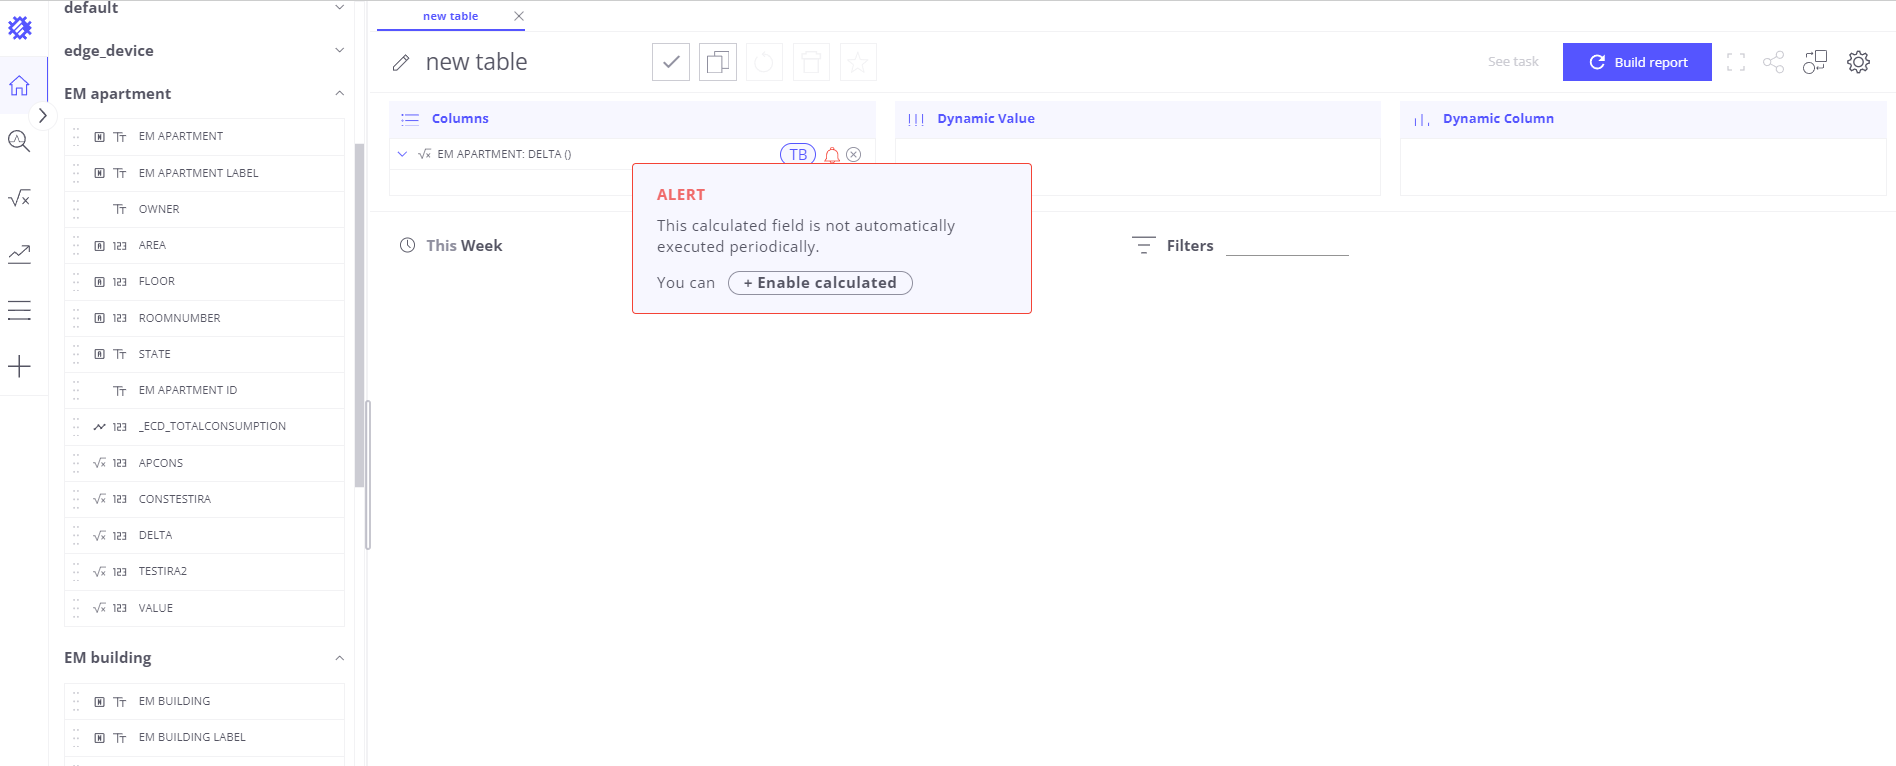
Disabled Calculation
If a calculated field is disabled isn’t saved in ThingsBoard as telemetry, it will appear normally in the list of business entity fields. However, when you drag this field into the chart-building area, a red bell icon will appear next to it. By clicking on the red bell icon, you can go directly to the created calculated field, where you can enable it as telemetry.
By following these steps, you can effectively use created calculations within view fields, making sure your data analysis is both complete and exact.
下一步
-
快速入门指南 - 快速了解 Trendz 主要功能。
-
安装指南 - 学习在各种操作系统上部署 Trendz。
-
指标探索器 - 学习使用 Trendz Metric Explorer 探索和创建指标。
-
异常检测 - 学习识别数据中的异常。
-
状态 - 学习基于原始遥测定义和分析资产状态。
-
预测 - 学习进行预测及遥测行为预测。
-
筛选器 - 学习在分析中筛选数据集。
-
可用可视化部件 - 了解 Trendz 中可用的可视化部件及配置方法。
-
分享与嵌入可视化 - 学习将 Trendz 可视化添加到 ThingsBoard 仪表盘或第三方网页。
-
AI 助手 - 学习使用 Trendz AI 功能。