- 前置条件
- Step 1. Connecting Device and Sending Telemetry Data
- Step 2. Creating Dashboard and Configuring Widgets
- Step 3. Pushing Data From Edge to Cloud
- Step 4. Provisioning Entities From Edge to Server
- Step 5. Provisioning Entities From Server to Edge
- Your Feedback
- 下一步
本教程将带您了解ThingsBoard Edge平台的基础知识,并介绍最常用的功能。通过本教程,您将学习如何:
- 在您的设备上安装并运行ThingsBoard Edge。
- 连接本地设备,如温度传感器。
- 将数据从设备传输到Edge,再从Edge传输到ThingsBoard Cloud。
- 创建和配置实时仪表盘。
为保持简洁,我们将跳过冗长的描述。如需更详细的信息,请查阅 「什么是ThingsBoard Edge」文章并浏览其他文档。
前置条件
要运行 ThingsBoard Professional Edition Edge,需具备支持 Edge 功能的活跃 ThingsBoard Professional Edition 账号。
注册 ThingsBoard Cloud 账号,这是最简单的入门方式。在本教程后续内容中,该URL将称为 SERVER_URL。 请使用ThingsBoard Cloud 租户凭据登录。 |
|
您可以安装ThingsBoard Professional Edition本地Server。请参阅 ThingsBoard安装指南。 可通过 http://localhost:8080 访问本地Server。在本教程中,我们将该URL称为 SERVER_URL。请使用以下凭据登录:
|
Edge 硬件要求
ThingsBoard Edge 的硬件要求取决于连接设备数量及与平台界面的交互强度。 为获得最佳性能,建议如下:
- 至少 1GB RAM(轻负载): 适用于与平台界面交互较少(如 dashboards 和设备管理)及少于 100 台连接设备的场景。
- 至少 4GB RAM(重负载): 适用于与平台频繁交互及单台机器连接 100 台以上设备的场景。
部署新 Edge 实例
要创建新的 Edge:
-
登录 ThingsBoard PE 实例,进入 Edge Management > Instances 区域。点击右上角 ”+” 图标并选择 “Add new edge”。
-
输入要创建的 Edge 名称,如 “My New Edge”。如需要,更新 cloud endpoint。
- 若 Edge 运行在 Docker 容器中,不要使用 “localhost” 作为endpoint,应使用 ThingsBoard PE 所在且 Edge 容器可访问的机器 IP 地址,如 http://10.7.2.143:8080。
- 若使用 ThingsBoard Cloud,则无需修改此设置。
- 点击 “Add” 按钮以确认添加 Edge instance。
-
新 Edge 已创建,将出现在列表顶部(默认按创建时间排序)。
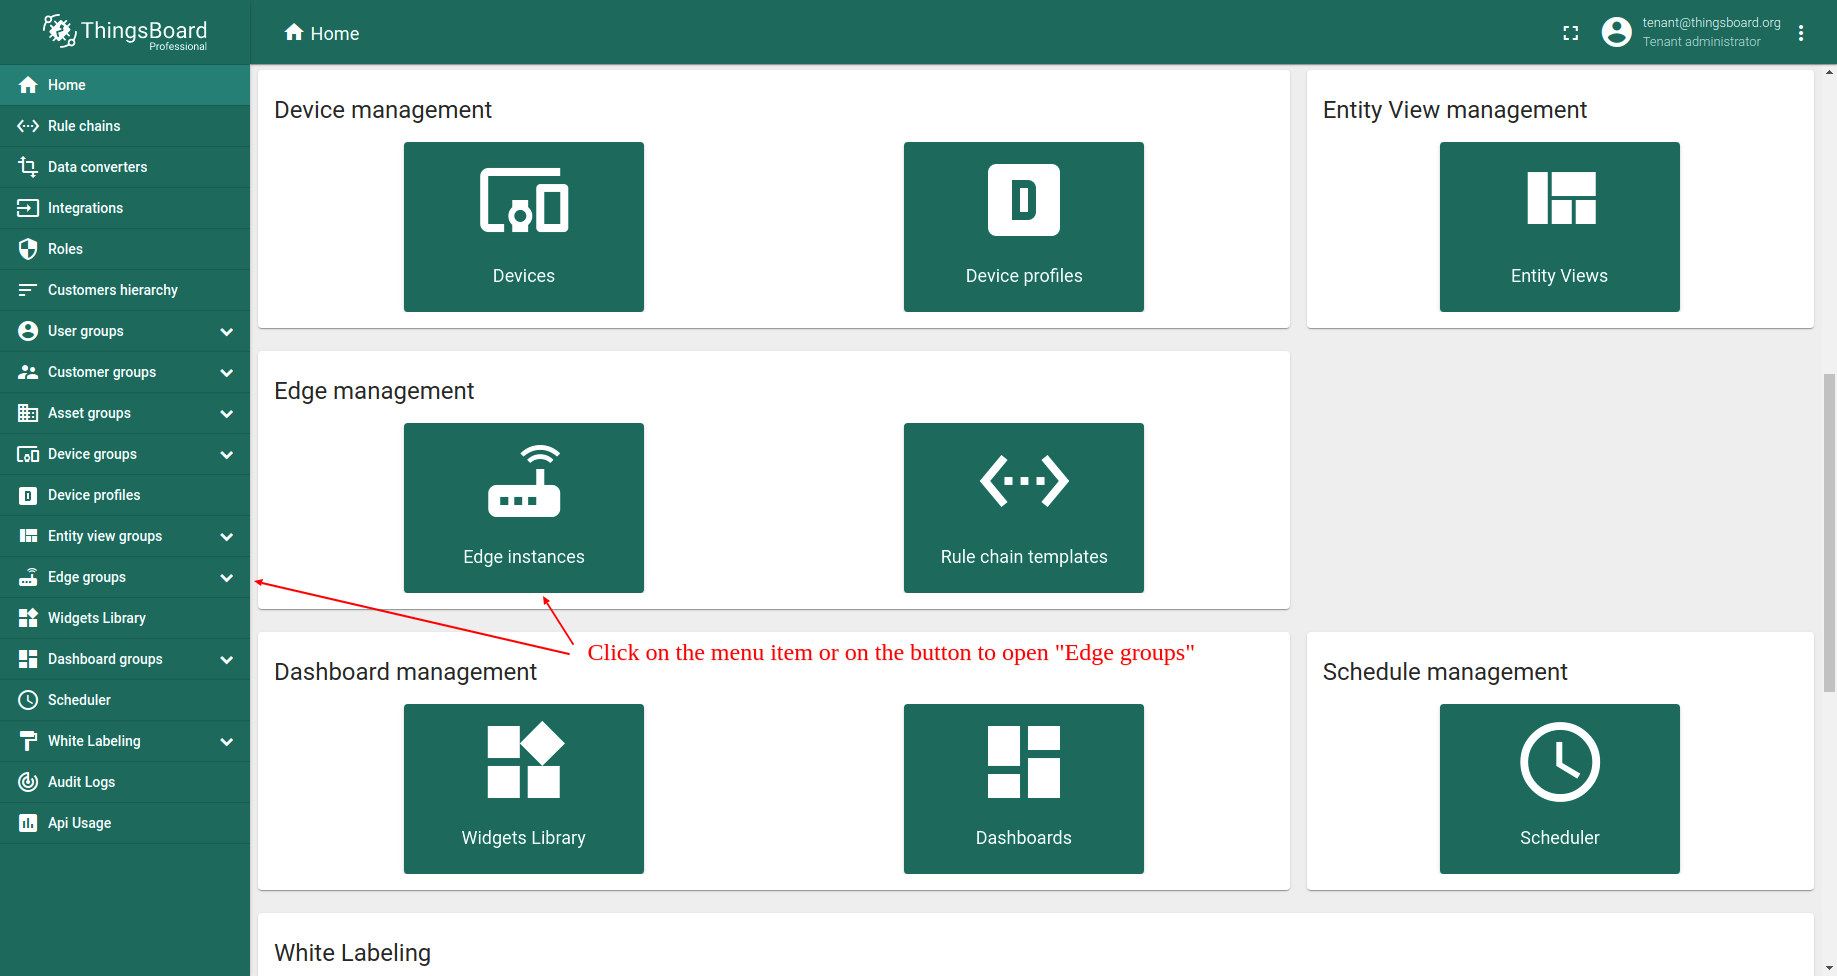
登录 ThingsBoard PE 实例,进入 Edge Management > Instances 区域。点击右上角 ”+” 图标并选择 “Add new edge”。
{:target="_blank"}中,不要使用 "localhost" 作为endpoint,应使用 ThingsBoard PE 所在且 Edge 容器可访问的机器 IP 地址,如 http://10.7.2.143:8080。
若使用 ThingsBoard Cloud,则无需修改此设置。
点击 "Add" 按钮以确认添加 Edge instance。](/images/pe/edge/installation-add-edge-item-2.png)
输入要创建的 Edge 名称,如 “My New Edge”。如需要,更新 cloud endpoint。
- 若 Edge 运行在 Docker 容器中,不要使用 “localhost” 作为endpoint,应使用 ThingsBoard PE 所在且 Edge 容器可访问的机器 IP 地址,如 http://10.7.2.143:8080。
- 若使用 ThingsBoard Cloud,则无需修改此设置。
- 点击 “Add” 按钮以确认添加 Edge instance。
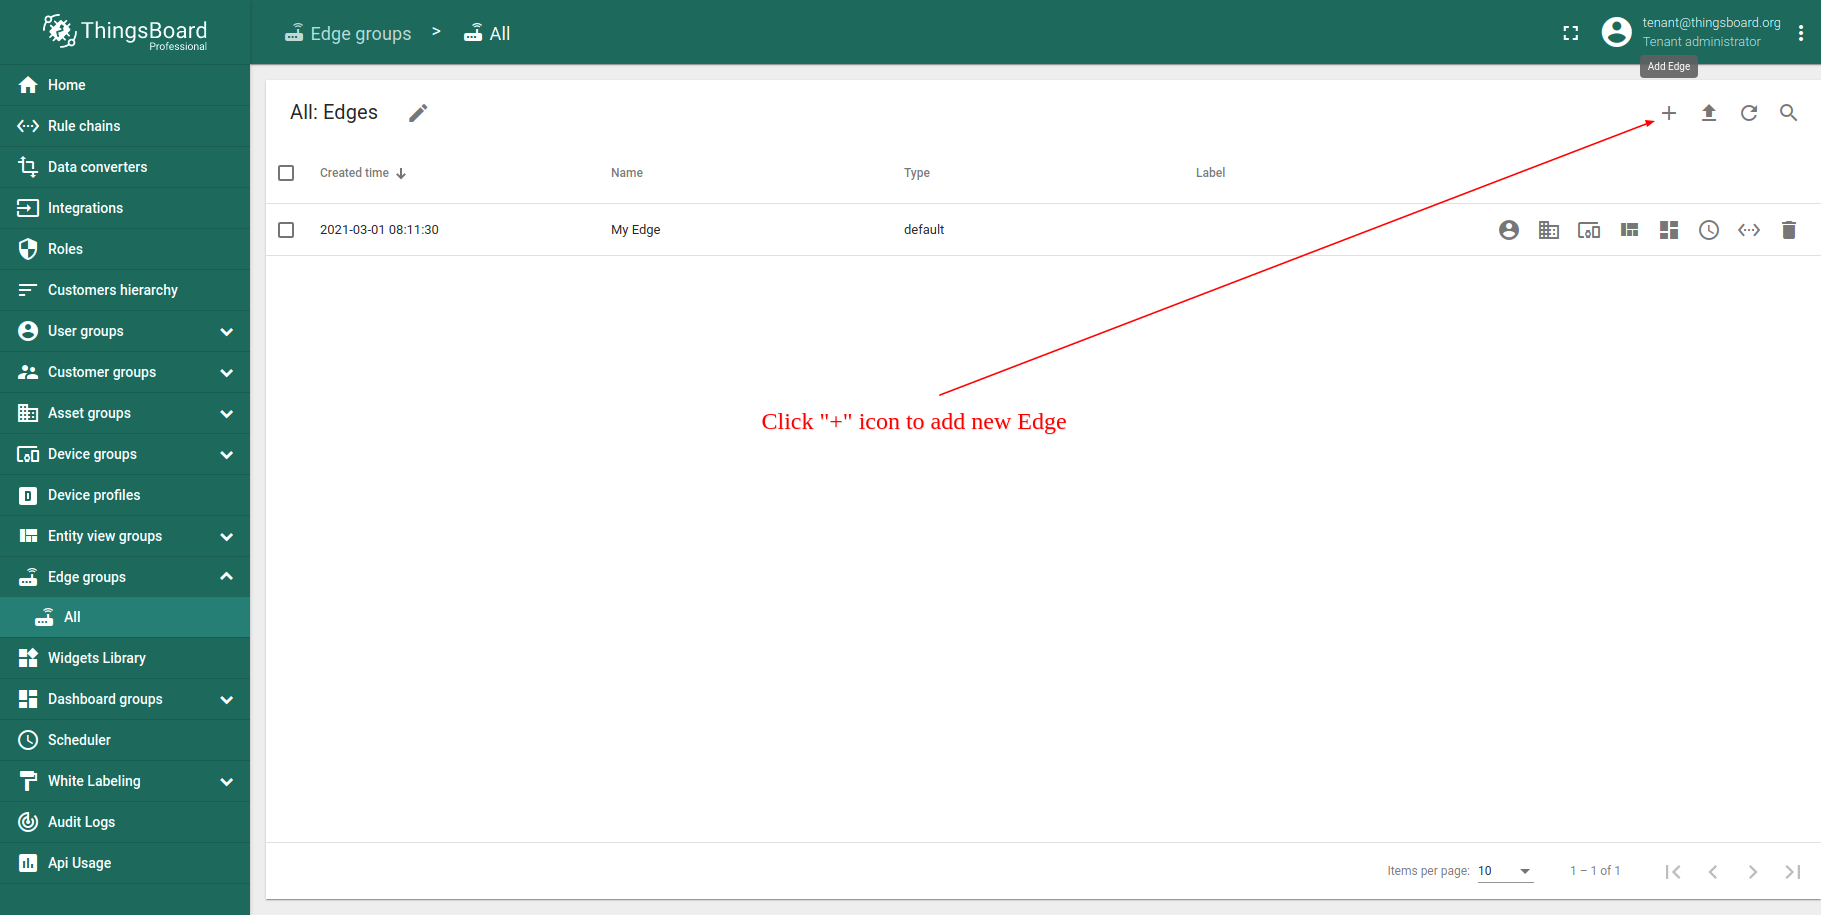
新 Edge 已创建,将出现在列表顶部(默认按创建时间排序)。
Edge安装与配置
使用ThingsBoard Server预配置说明进行引导式安装
Edge 实例创建后,即可使用安装说明。
每个 Edge 都有包含重要凭证(如 Edge Secret、Edge Key 等)的预设配置。要访问这些配置:
-
点击 Edge 实体打开其详情。
-
点击 「Install & Connection Instructions」 按钮。
-
按说明安装 Edge 并连接到服务器。

点击 Edge 实体打开其详情。

点击 「Install & Connection Instructions」 按钮。

按说明安装 Edge 并连接到服务器。
如因任何原因无法访问和/或使用Edge预设配置,请参阅 手动安装说明。
访问用户界面:URL与凭据
Edge安装完成后,您可通过 http://localhost:8080 访问界面。 在本教程后续内容中,该URL将称为 EDGE_URL。 请使用您的 ThingsBoard Cloud 租户凭据登录。 |
Edge安装完成后,您可通过 http://localhost:18080 访问界面。 在本教程后续内容中,该URL将称为 EDGE_URL。 请使用与 SERVER_URL 相同的凭据登录:
|
目前,Edge 不支持用于登录的 OAuth 2.0。 若希望通过OAuth 2.0 用户凭据访问Edge,需在 ThingsBoard Server 上为该用户分配密码。
若Edge安装时将HTTP bind port修改为18080,请通过 http://localhost:18080 访问 ThingsBoard Edge 实例。
Step 1. Connecting Device and Sending Telemetry Data
在ThingsBoard中,设备是生成遥测数据的核心实体,这些数据被存储和处理以供仪表盘和分析使用。 ThingsBoard还提供虚拟设备shell,用于代表物理设备发送遥测数据以便进行测试。
要在Edge上添加新设备,请登录您的ThingsBoard Edge实例(EDGE_URL)并按以下步骤操作:
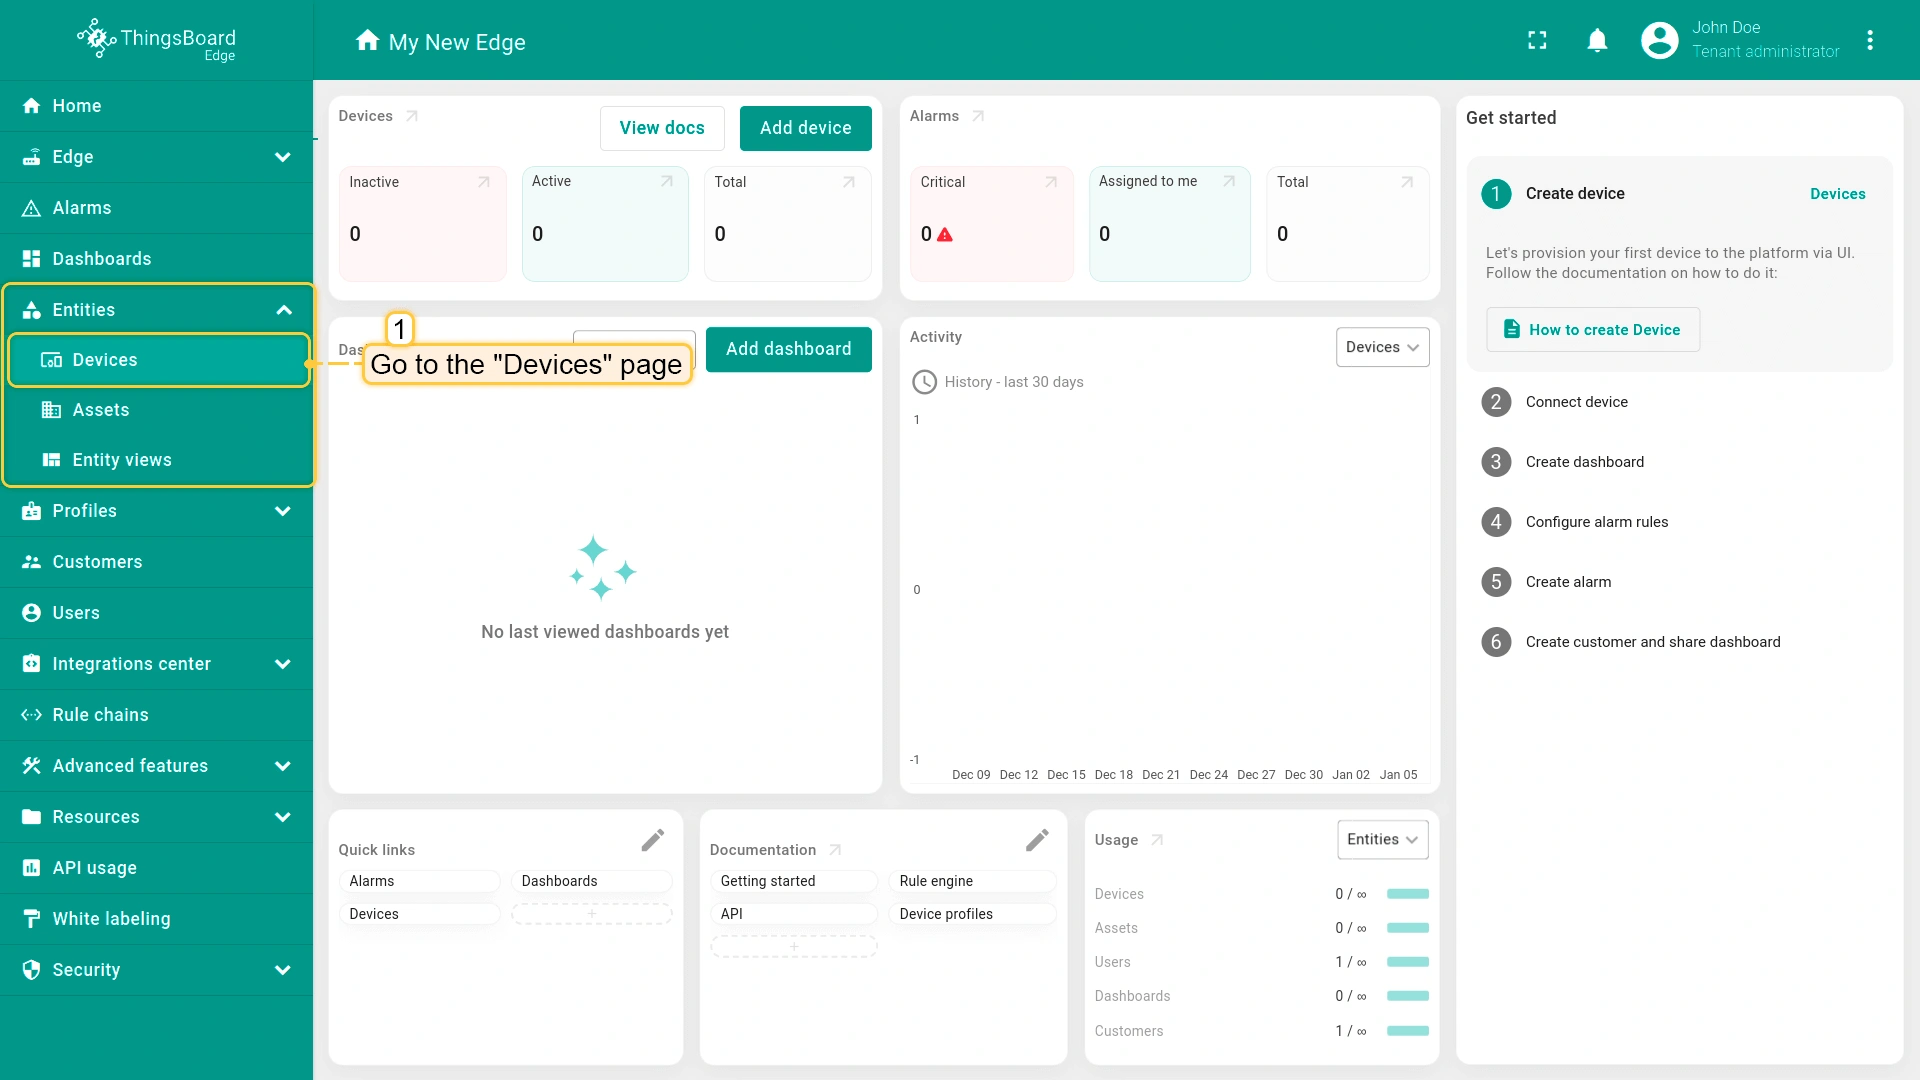
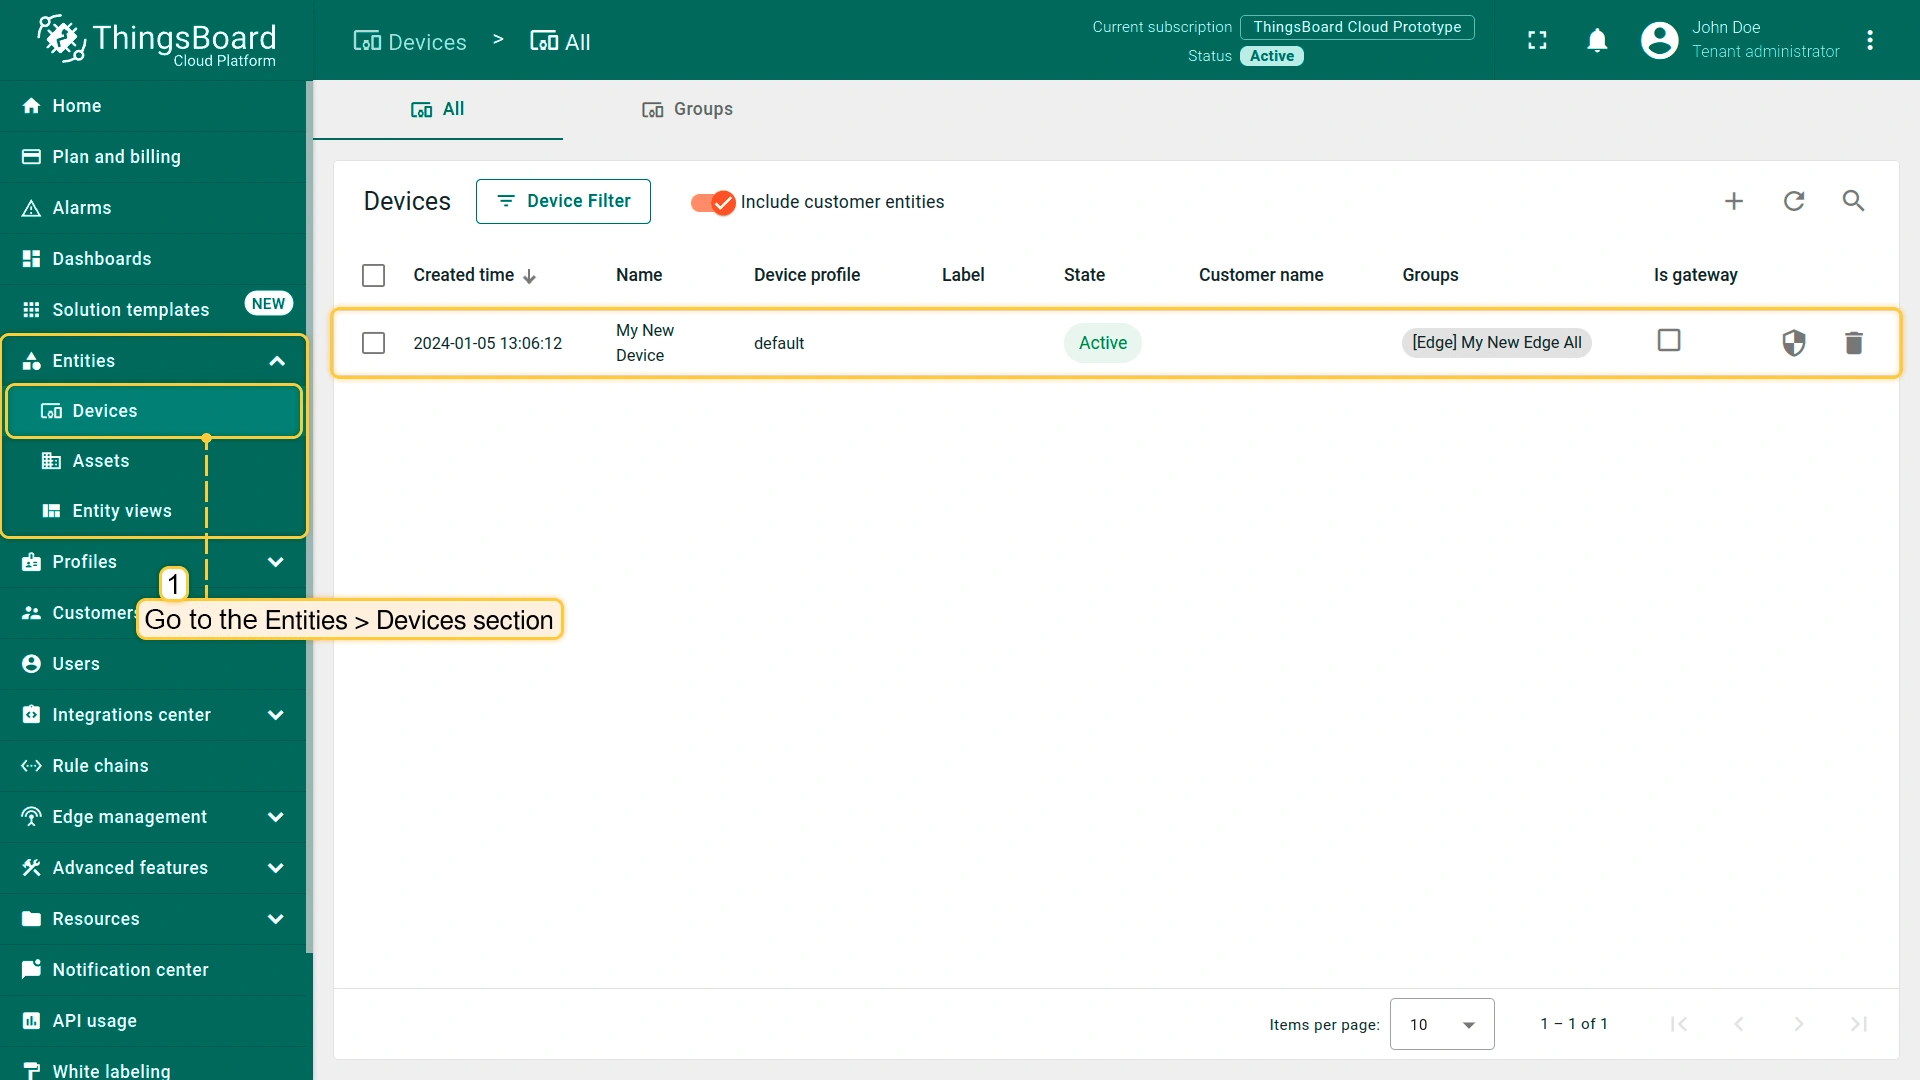
- Go to the Entities > Devices section.
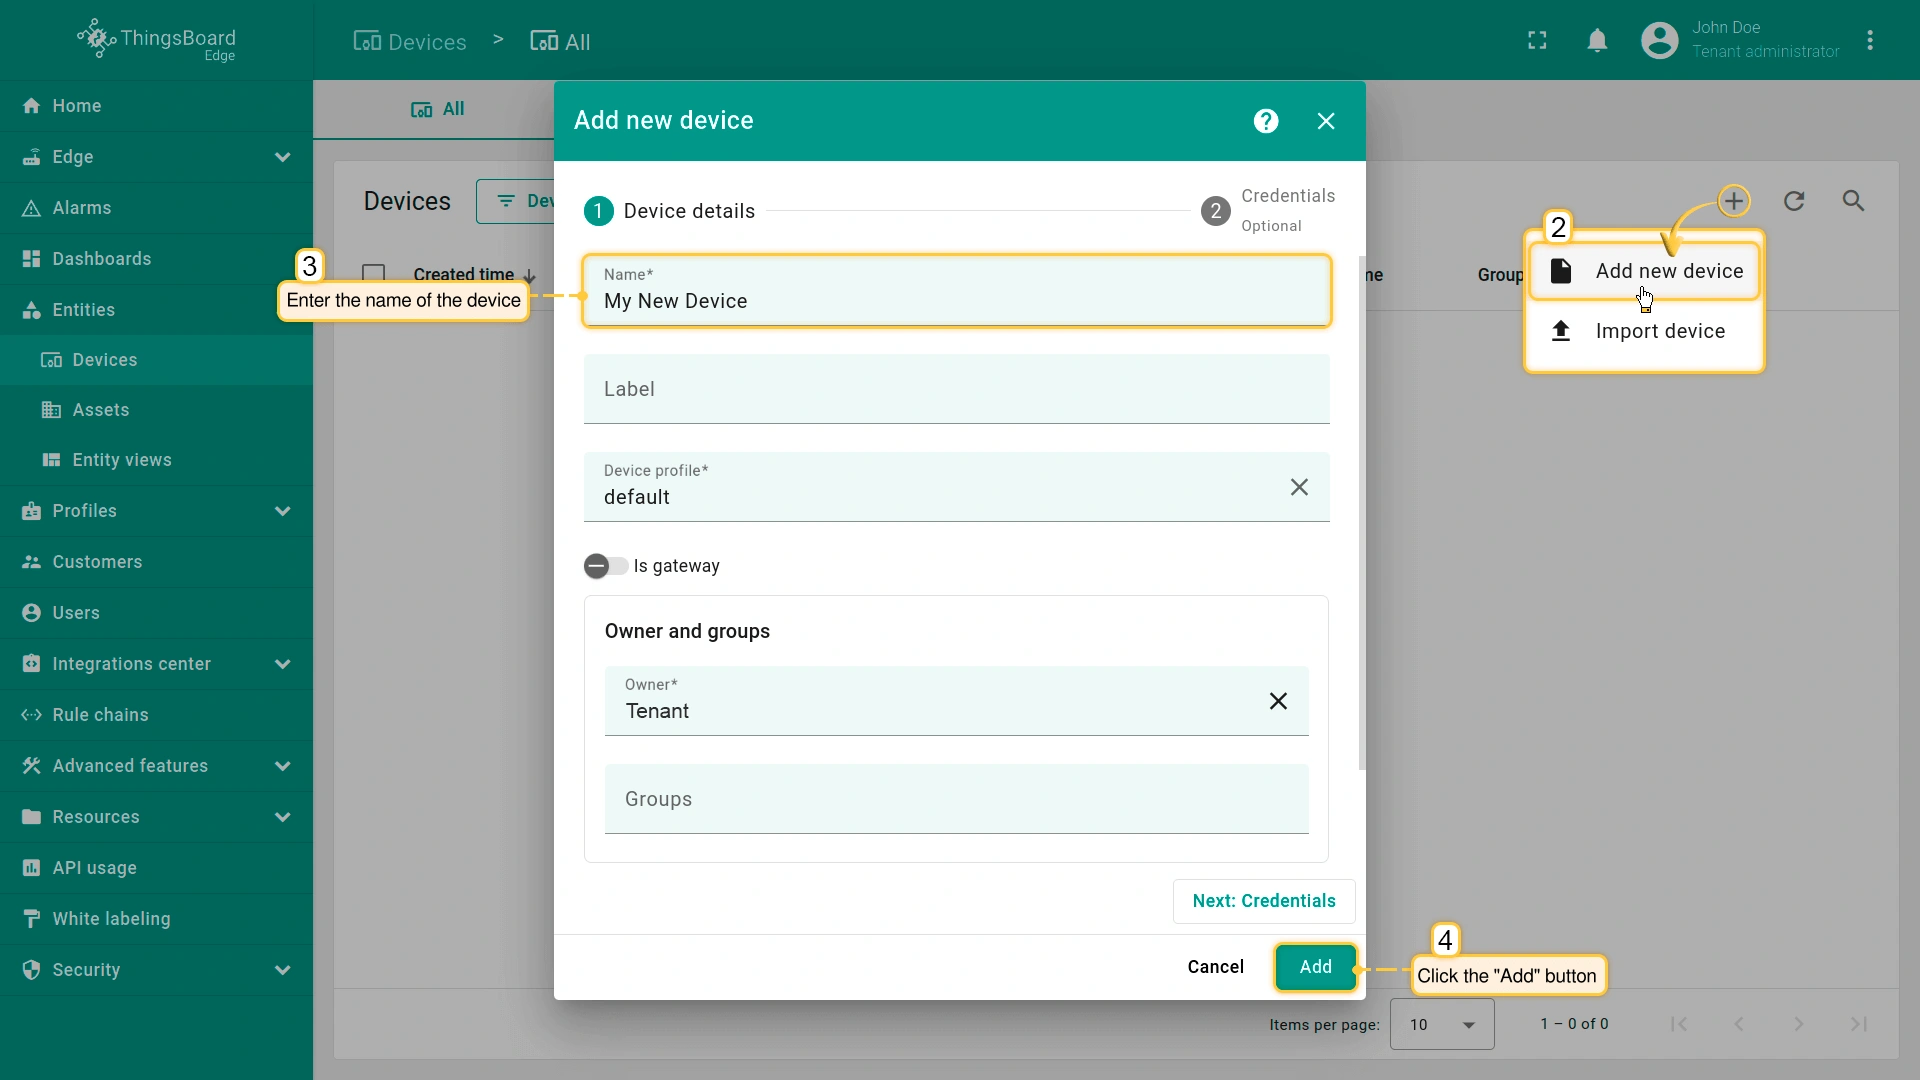
- Click the "+" icon and select the "Add new device" option. Enter a name for the device, for example, "My New Device". No other changes are required. Click the "Add" button to create the device.
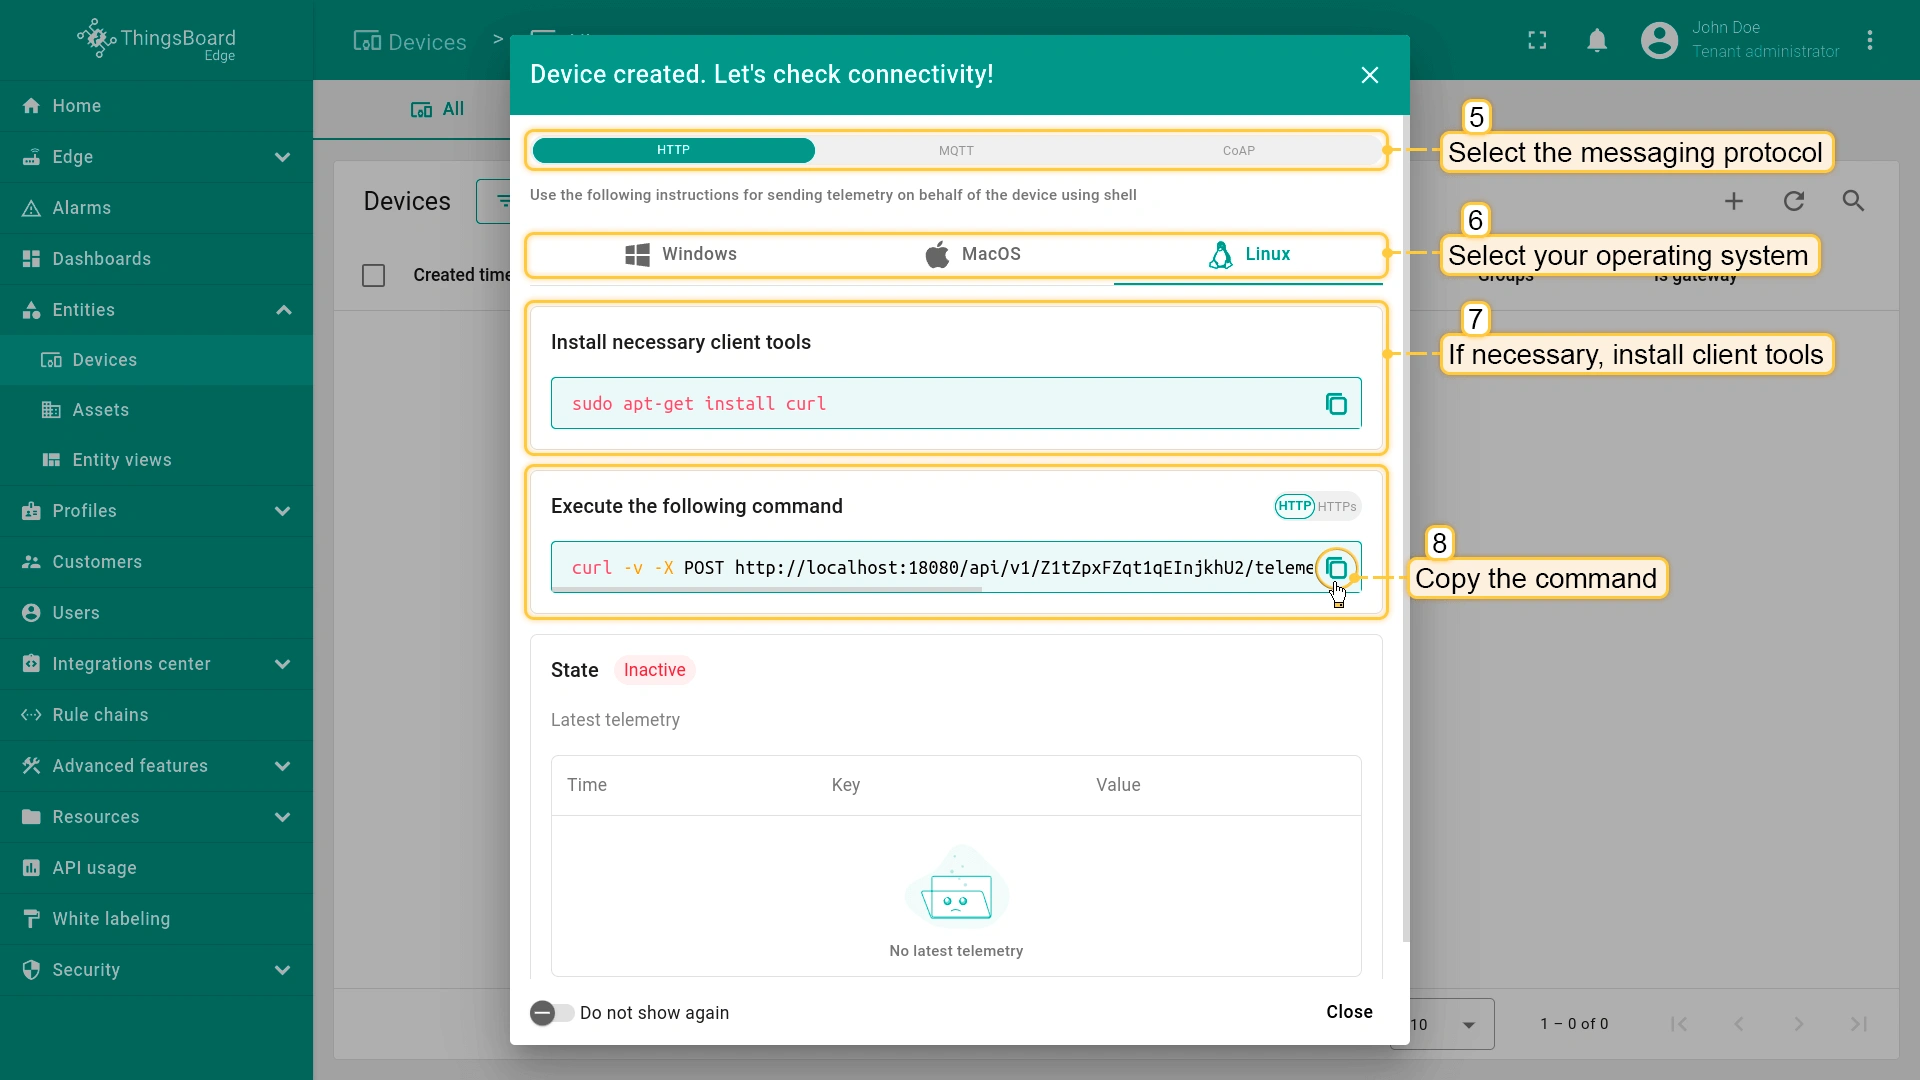
- After the device is created, instructions on how to check its connectivity will be provided. Select the messaging protocol and your operating system. Install the required client tools, then copy the provided command.
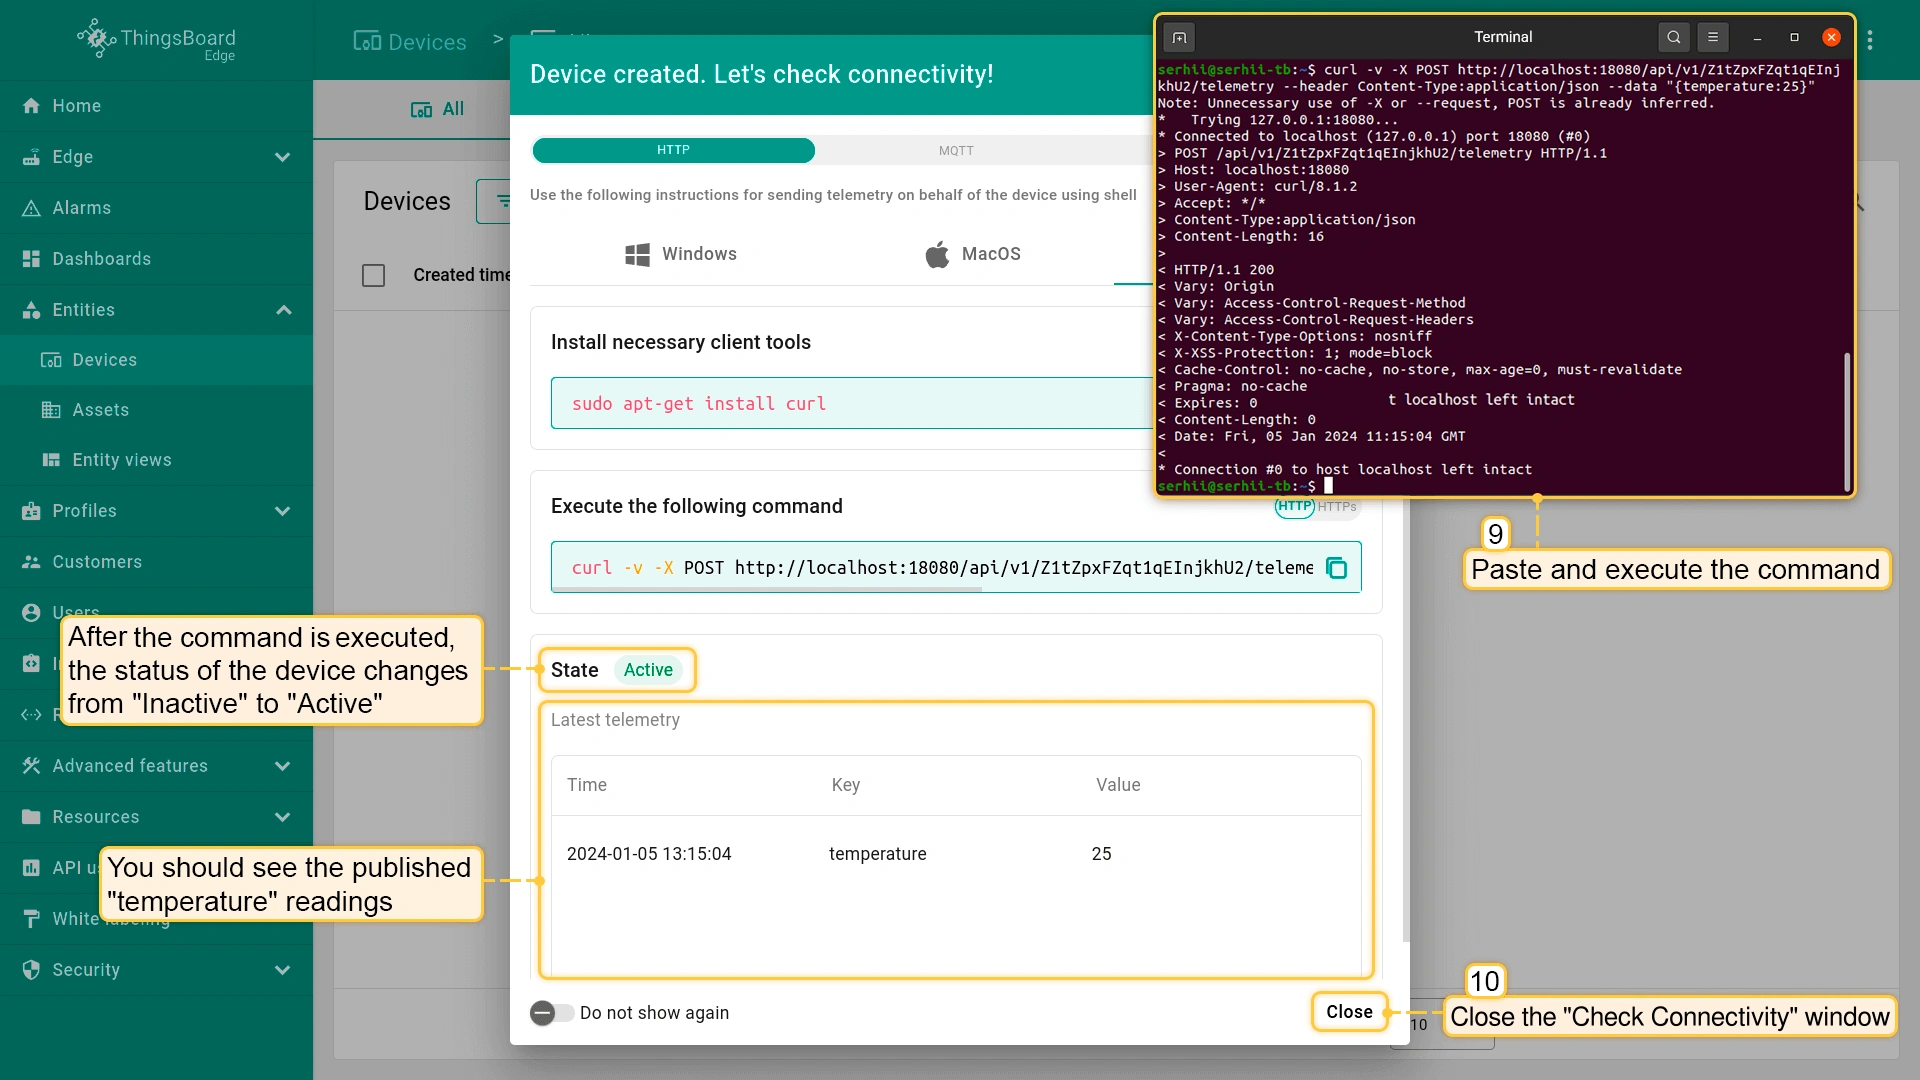
- Run the previously copied command. Once the "temperature" readings are published, the device state will change from "Inactive" to "Active", and you will see the published "temperature" readings. Finally, close the connectivity window.
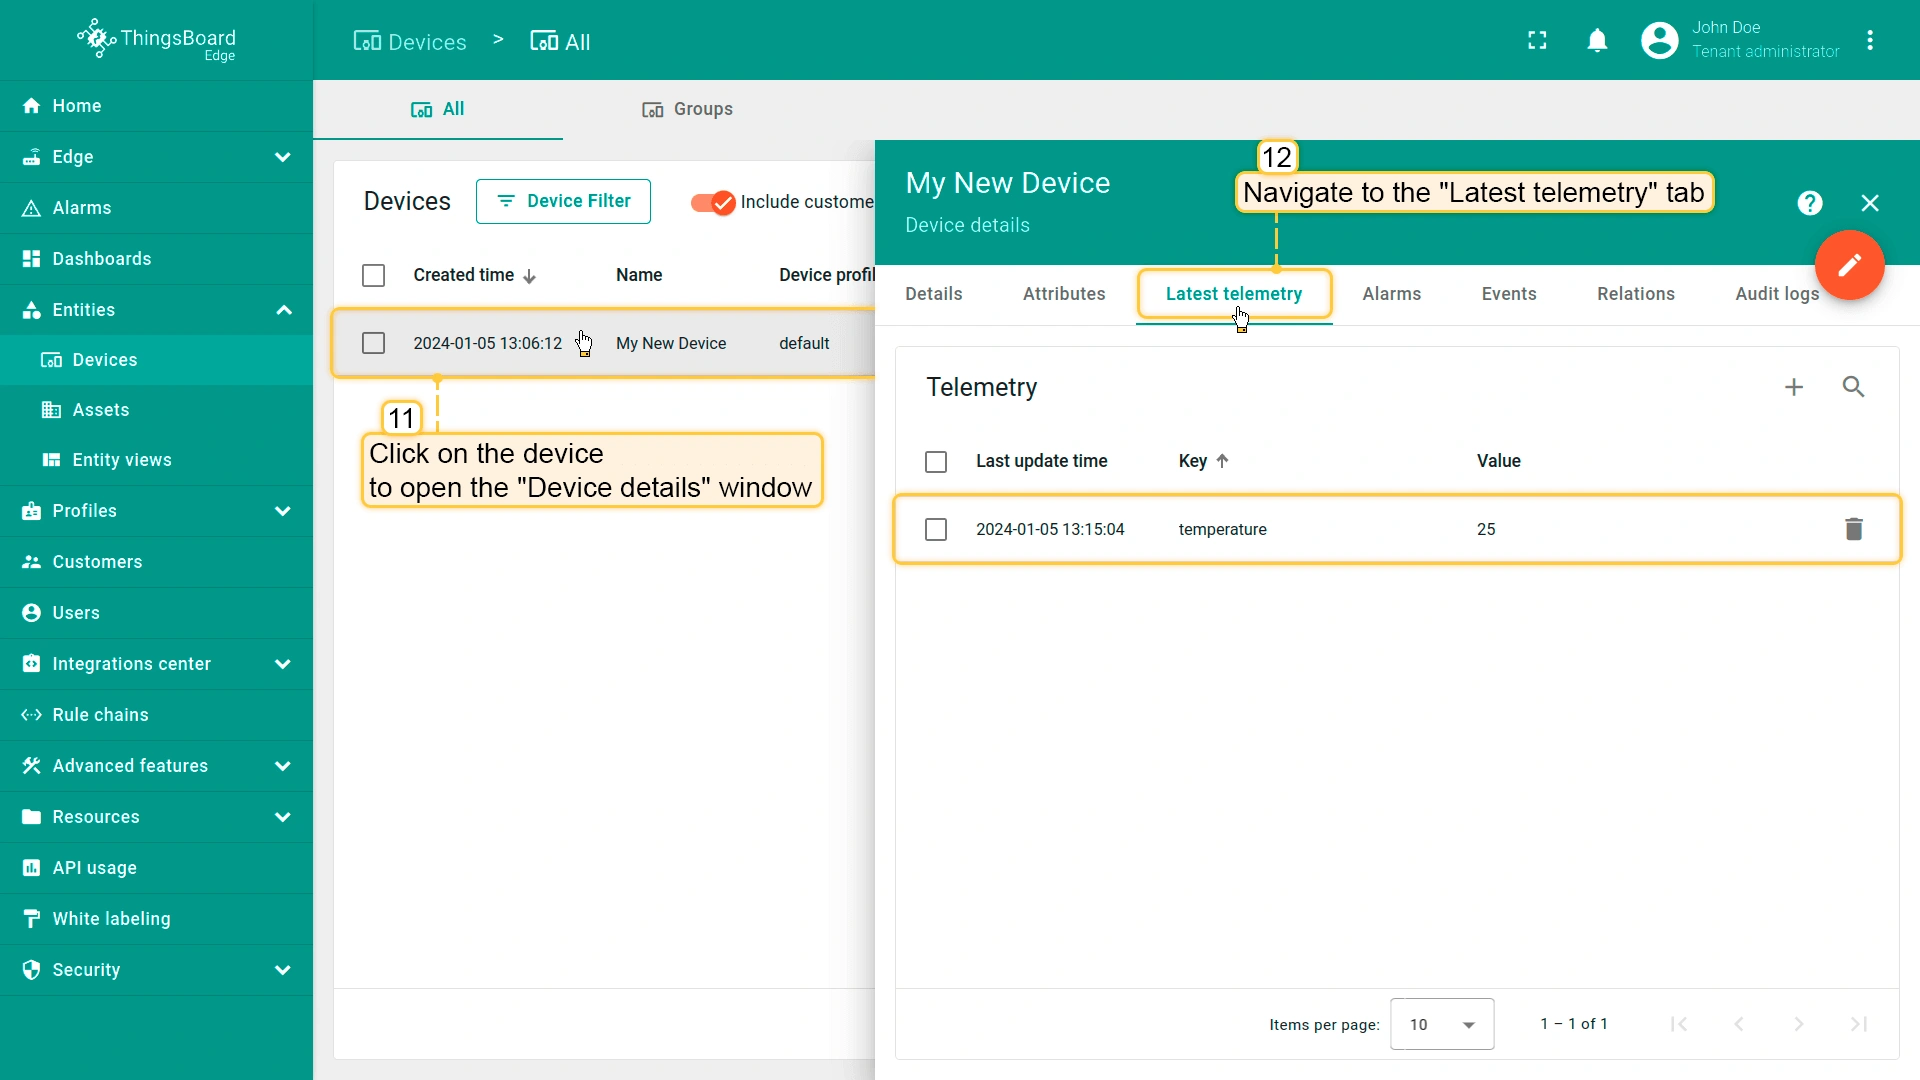
- To verify the received telemetry, click on the device entity and open the "Latest Telemetry" tab.
此外,还可使用以下方式:
- Bulk provisioning(批量配置):通过用户界面从CSV文件部署多个设备。
- REST API:以编程方式添加设备及其他实体。
在Edge上创建设备后,它将自动配置到ThingsBoard Server。要在Server上查看Edge设备,请访问SERVER_URL并进入Entities > Devices(实体 > 设备)部分。
Step 2. Creating Dashboard and Configuring Widgets
仪表盘 是 ThingsBoard 中的另一个关键实体。它允许您通过用户界面可视化 IoT 数据并控制设备。
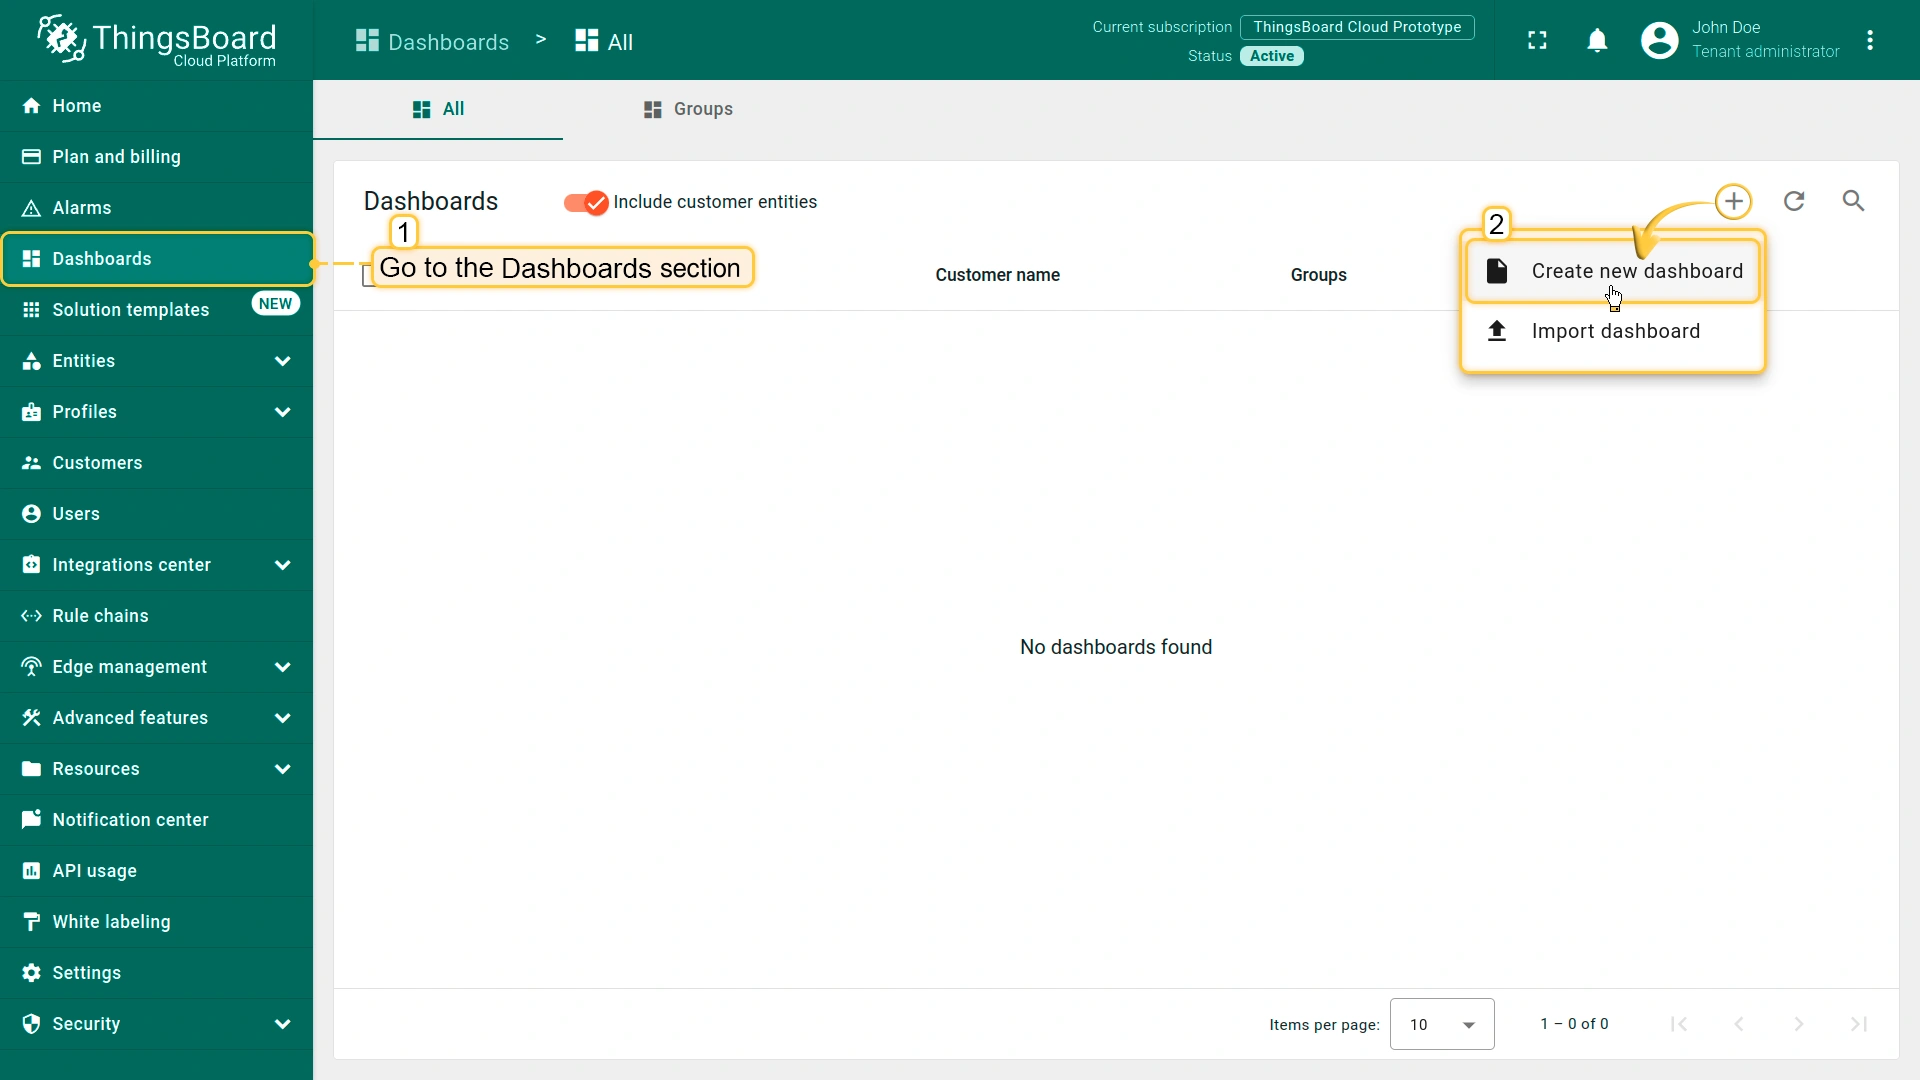
要创建仪表盘,请登录您的 ThingsBoard Edge 实例并进入 Dashboard 部分,然后按以下步骤操作:
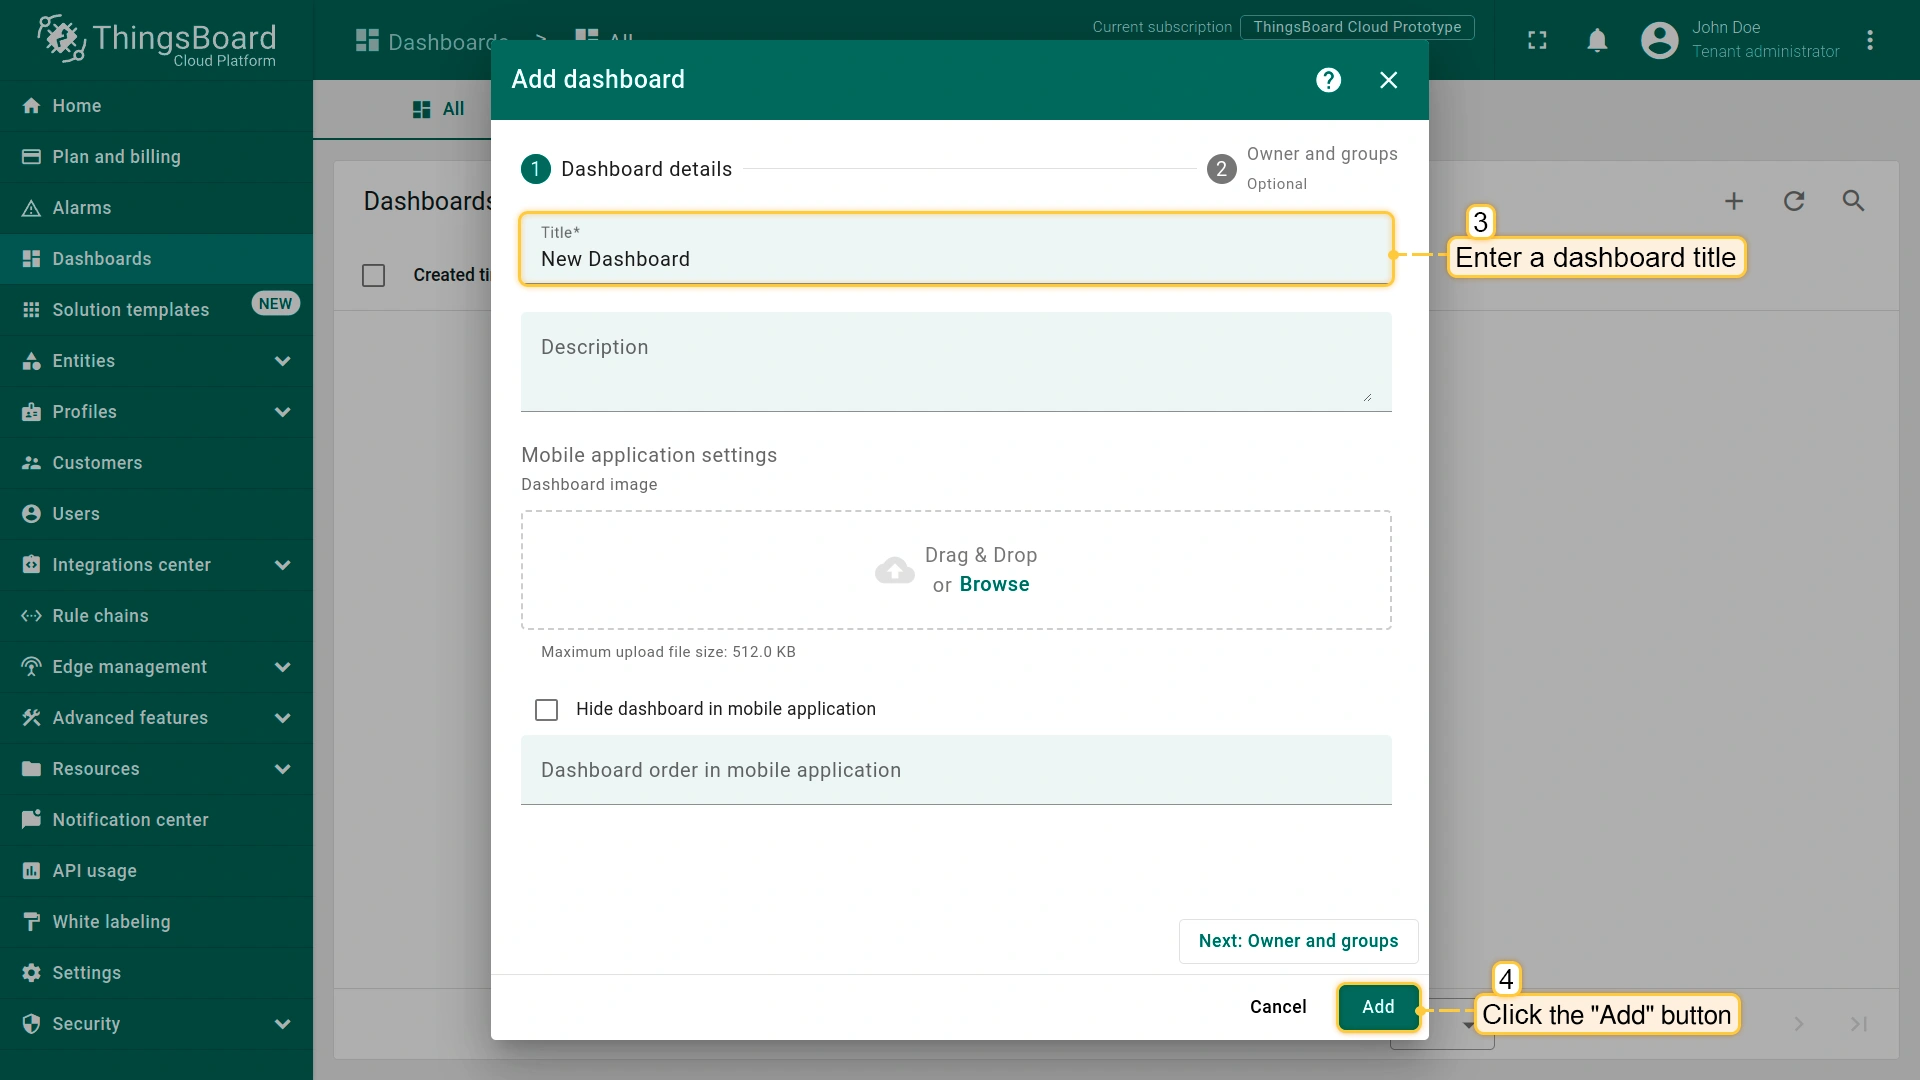
- Click the "+" icon and select the "Create new dashboard" option from the drop-down menu.
- Enter the dashboard name, for example, "New Dashboard", and click the "Add" button to create the dashboard.
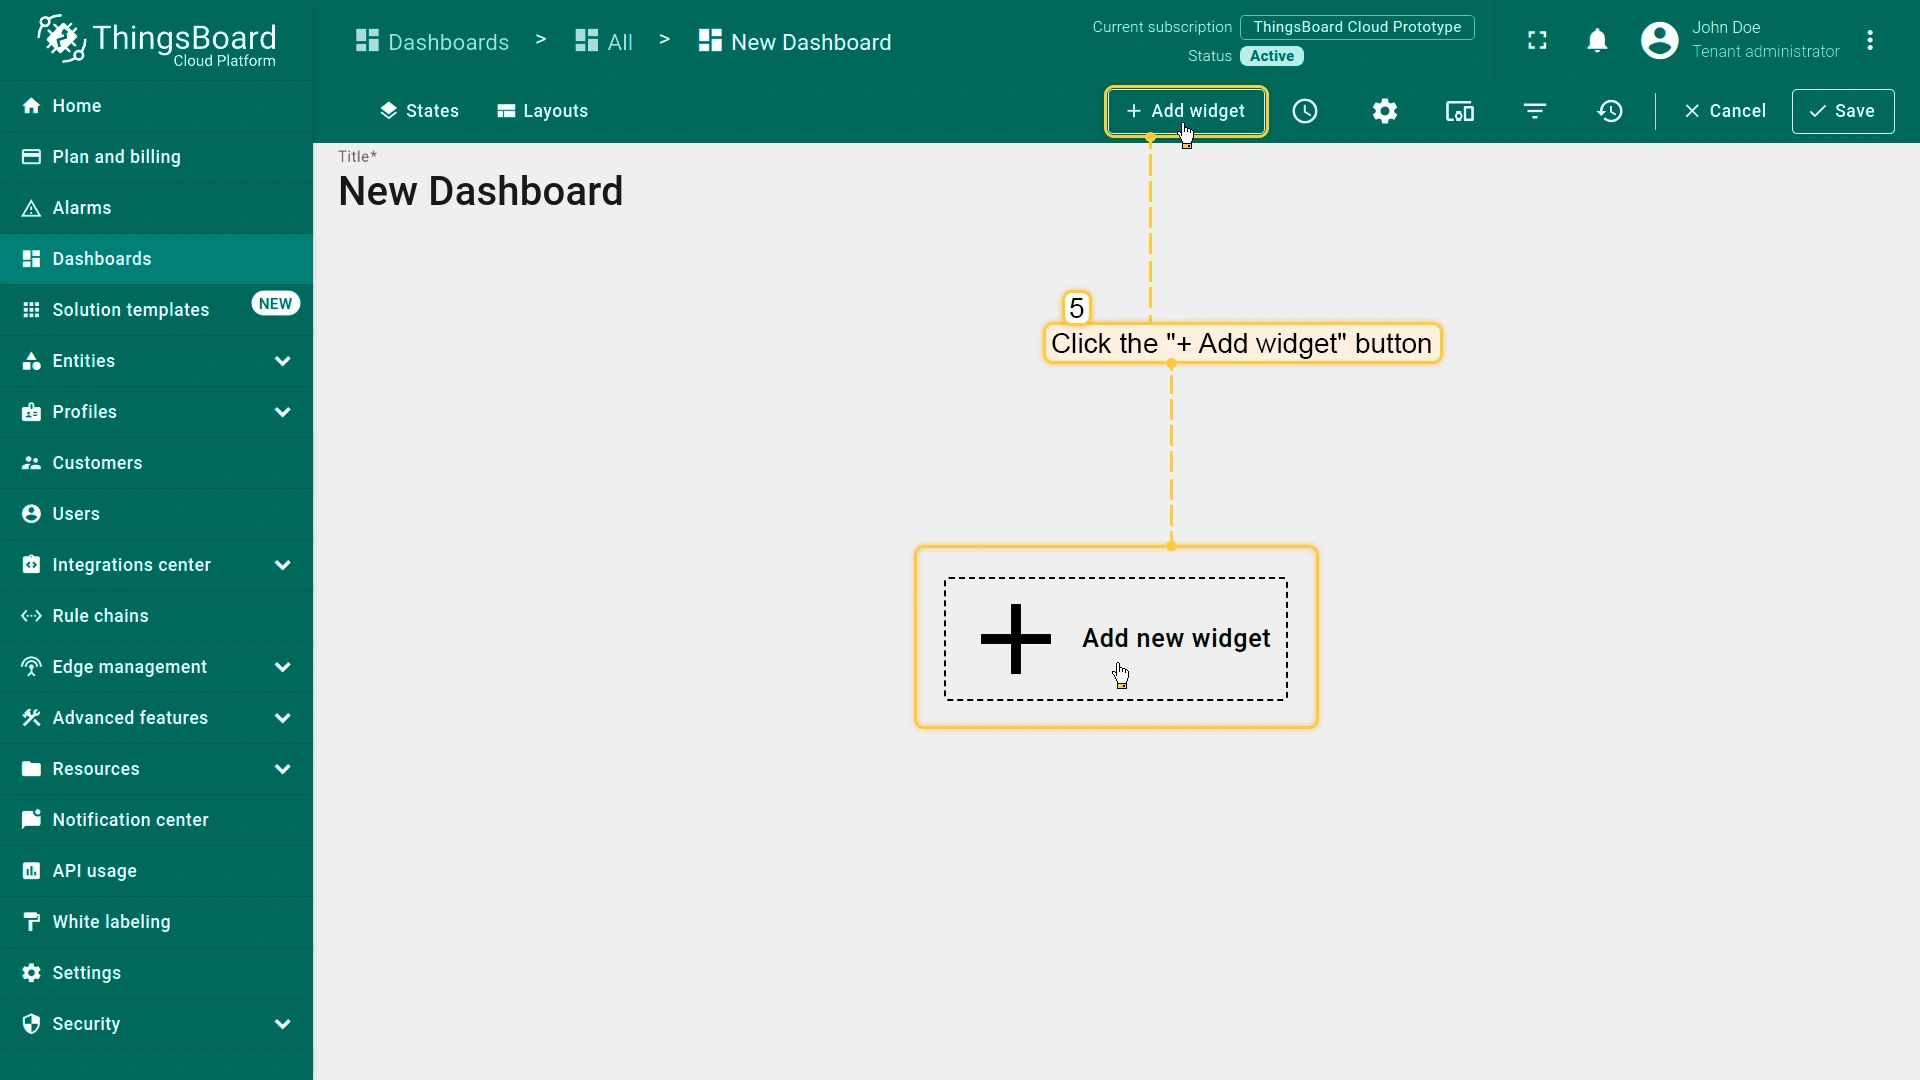
仪表盘创建后,系统会自动重定向到编辑模式页面。 要添加部件,请从部件库中选择一个,部件按部件包分组。 每个部件都链接到数据源,数据源定义其显示的数据。
例如,我们来添加并配置 Entities table 和 Time series chart 部件:
- Click the "Add widget" button.
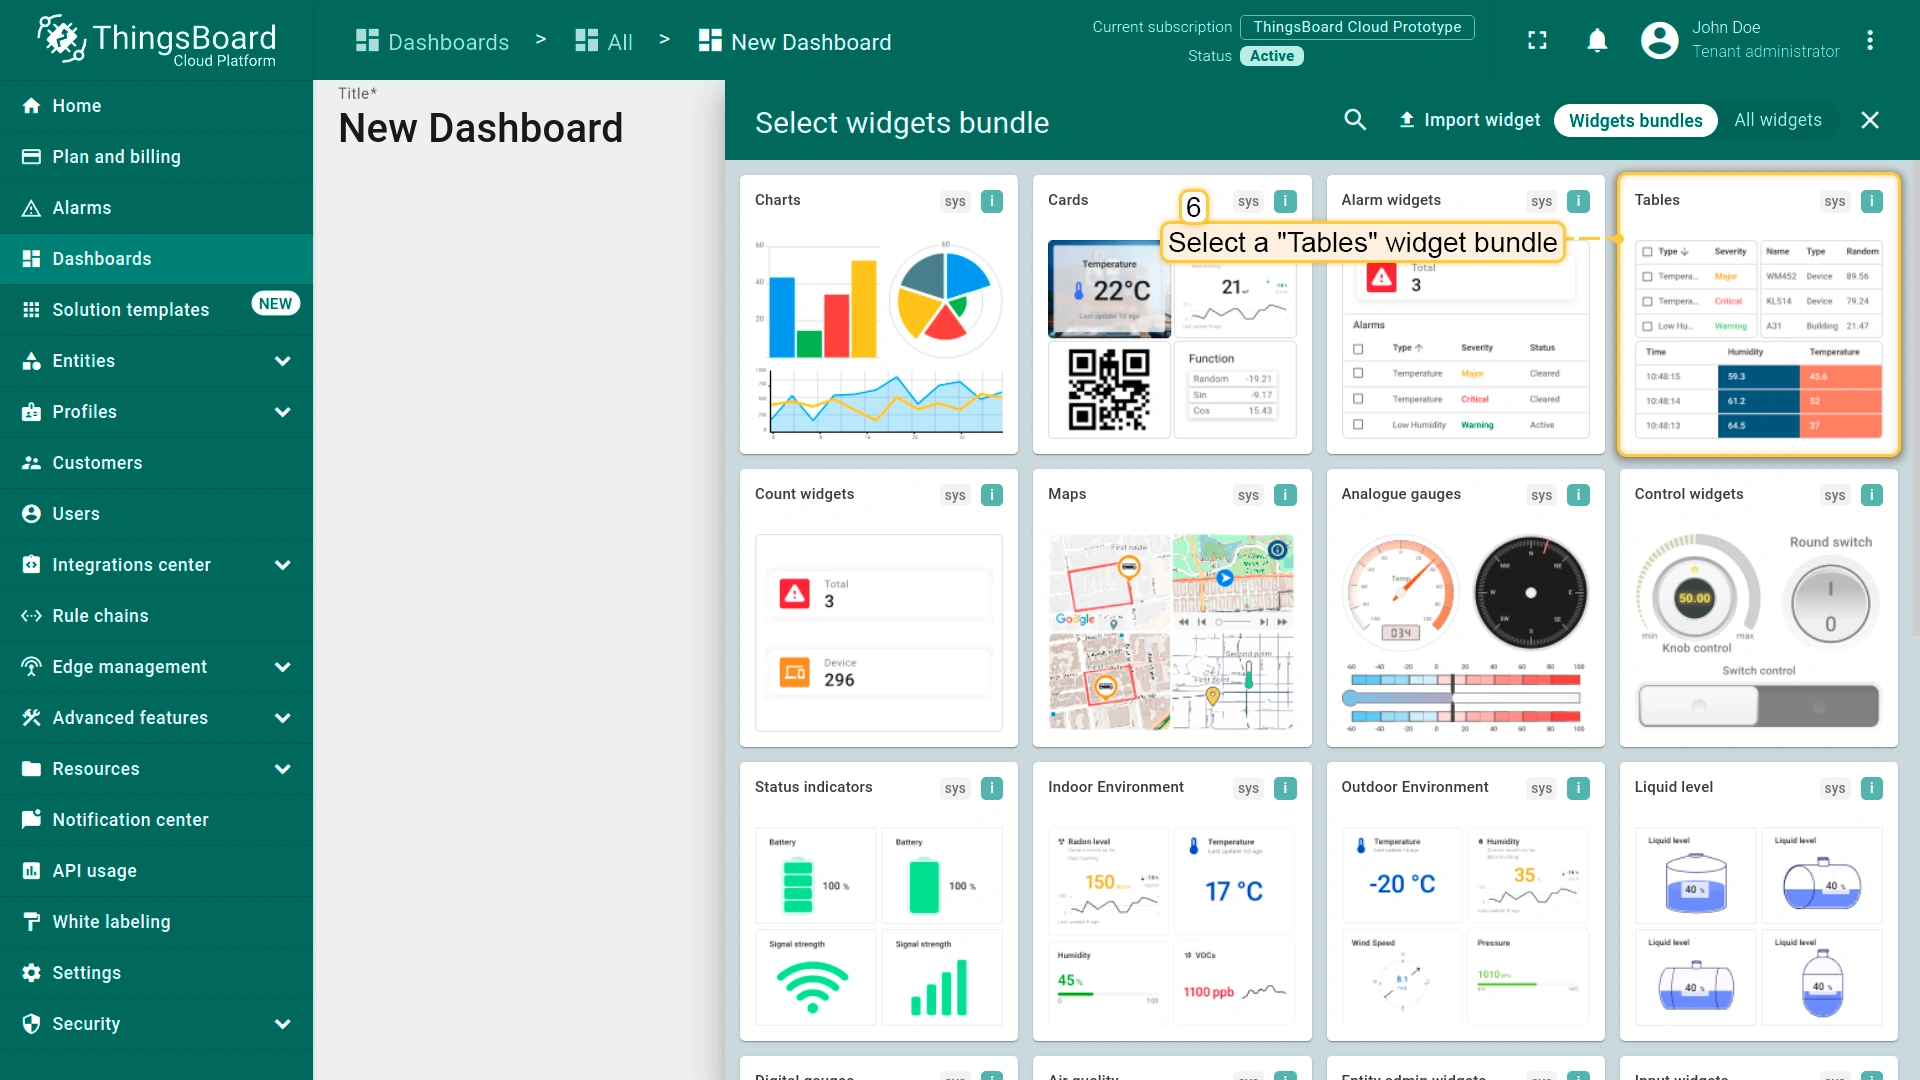
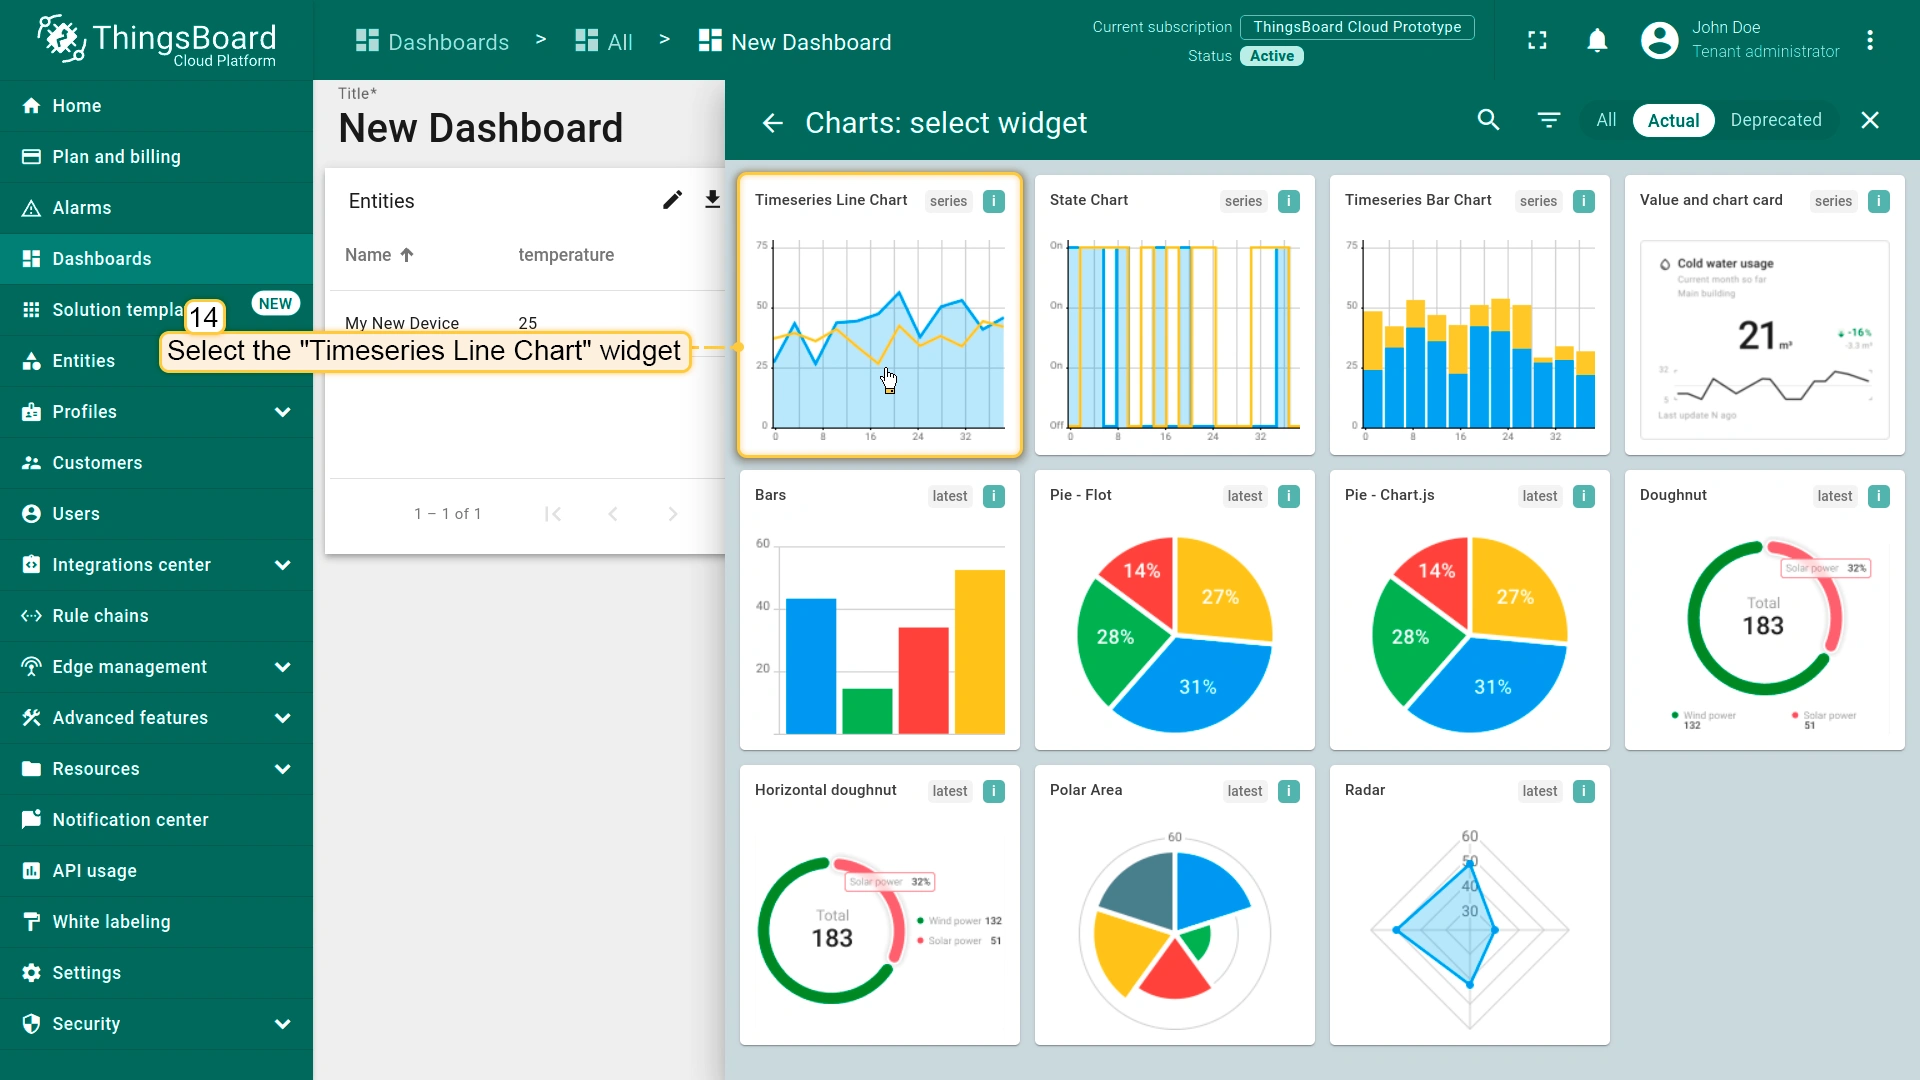
- Locate the "Tables" bundle and click on it.
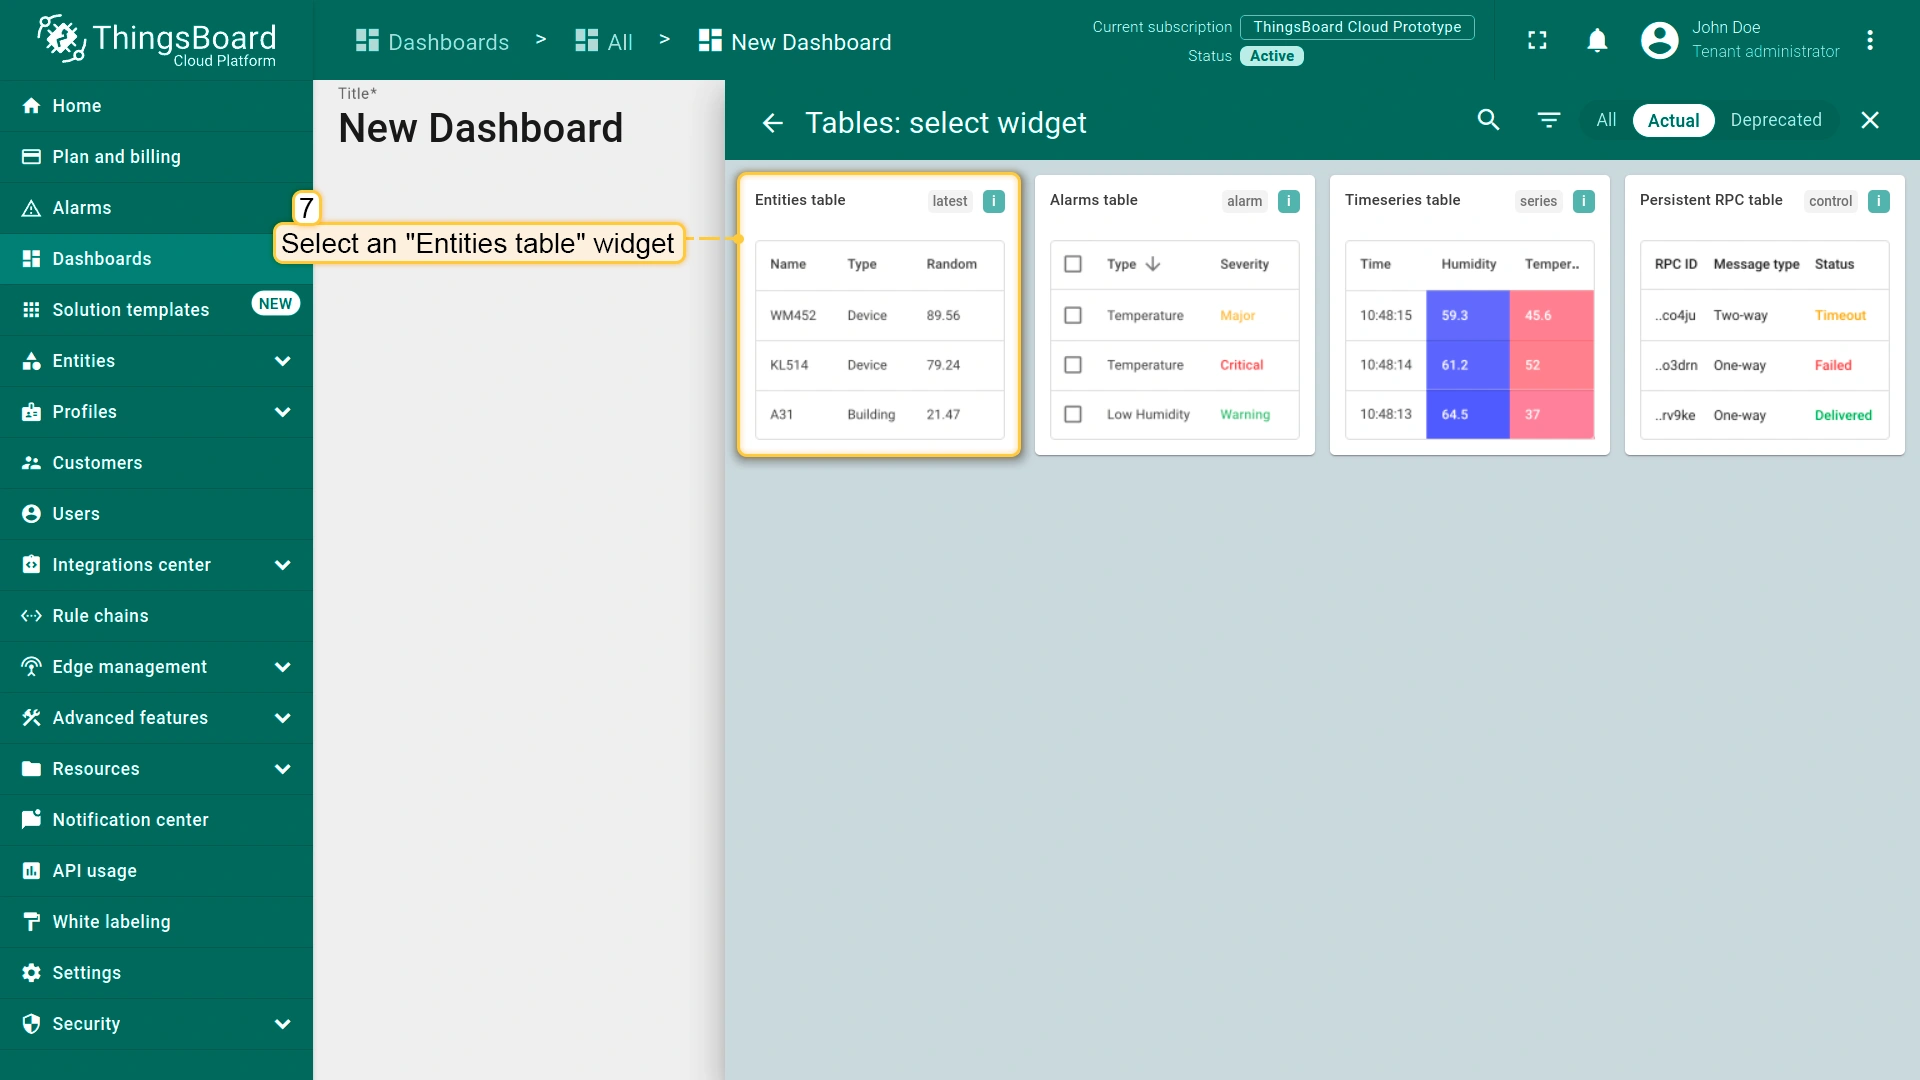
- Select the "Entities table" widget.
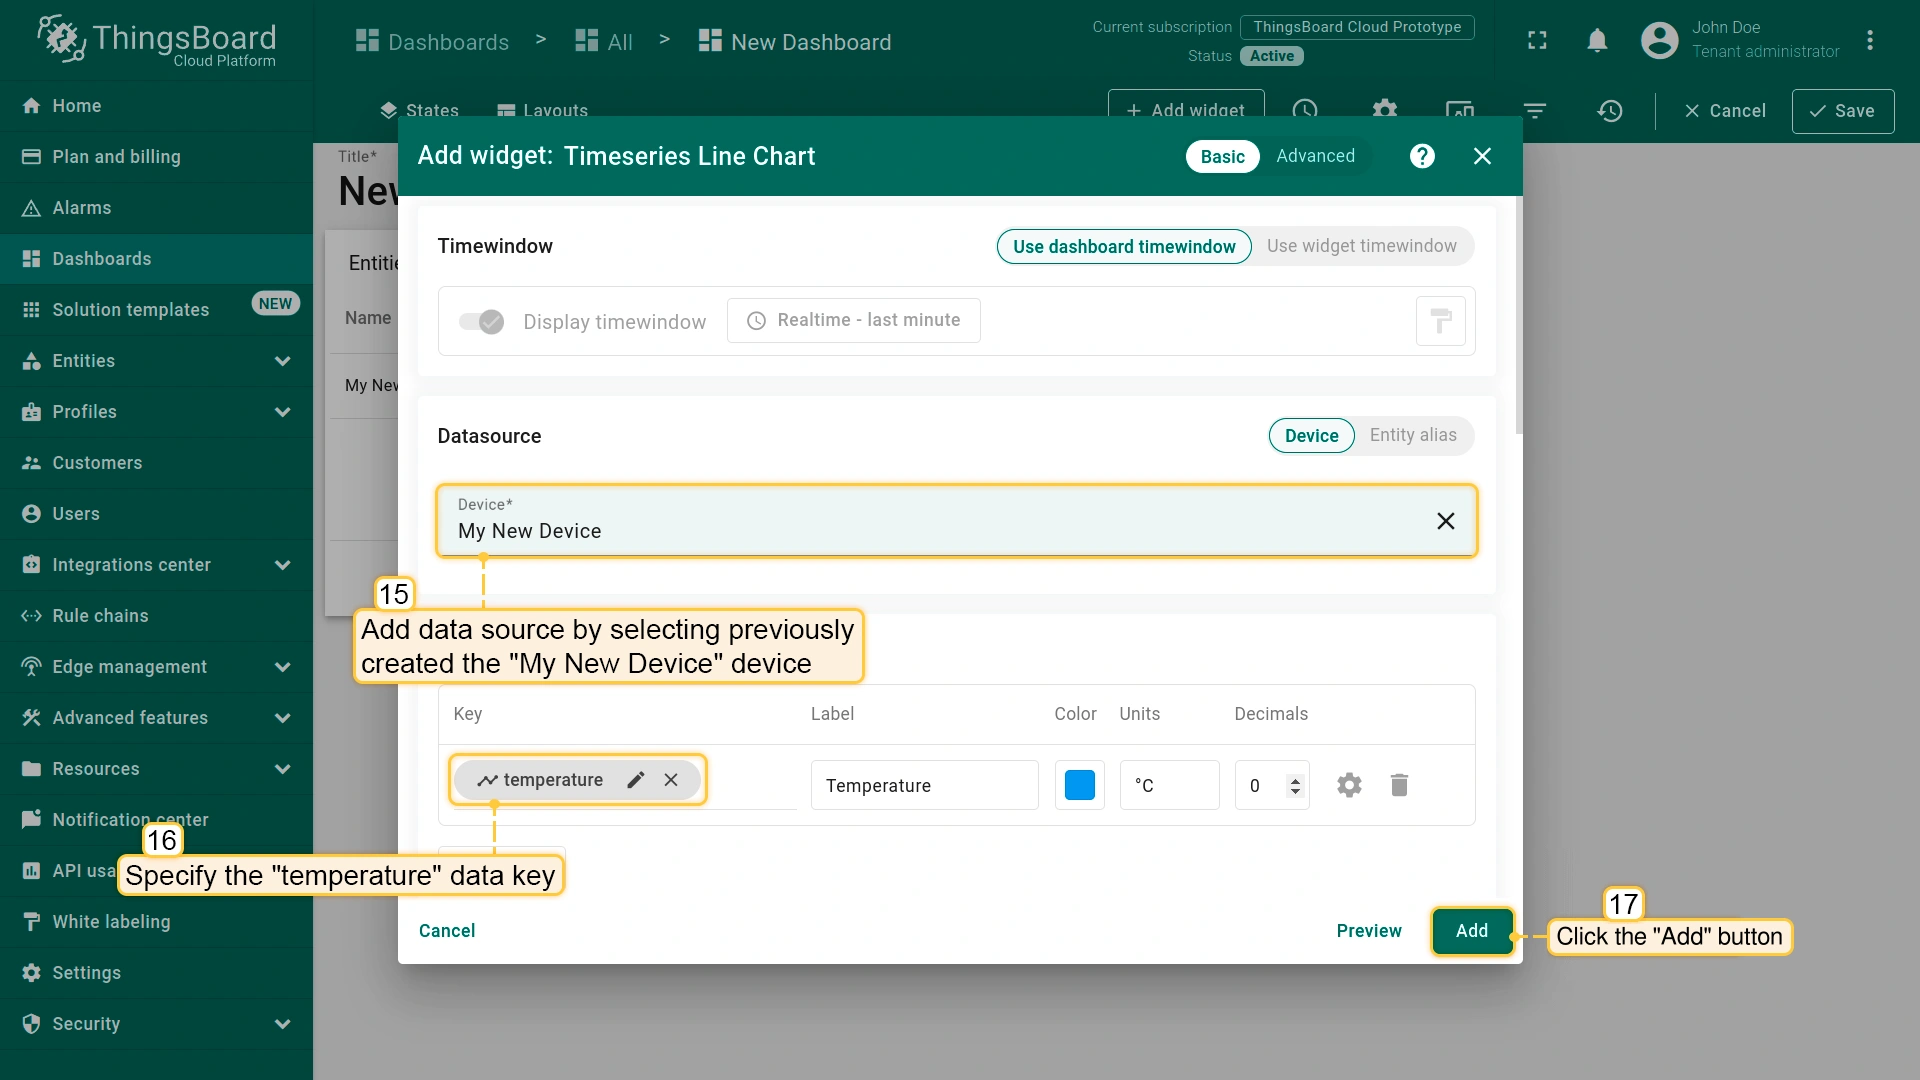
- In the "Add Widget" pop-up window, select the previously created device, "My New Device", in the "Device" field.
- The “name” key has already been added to the “Columns” section. It will display the column with the device name.
- To add another column with different key value, click the "Add column" button.
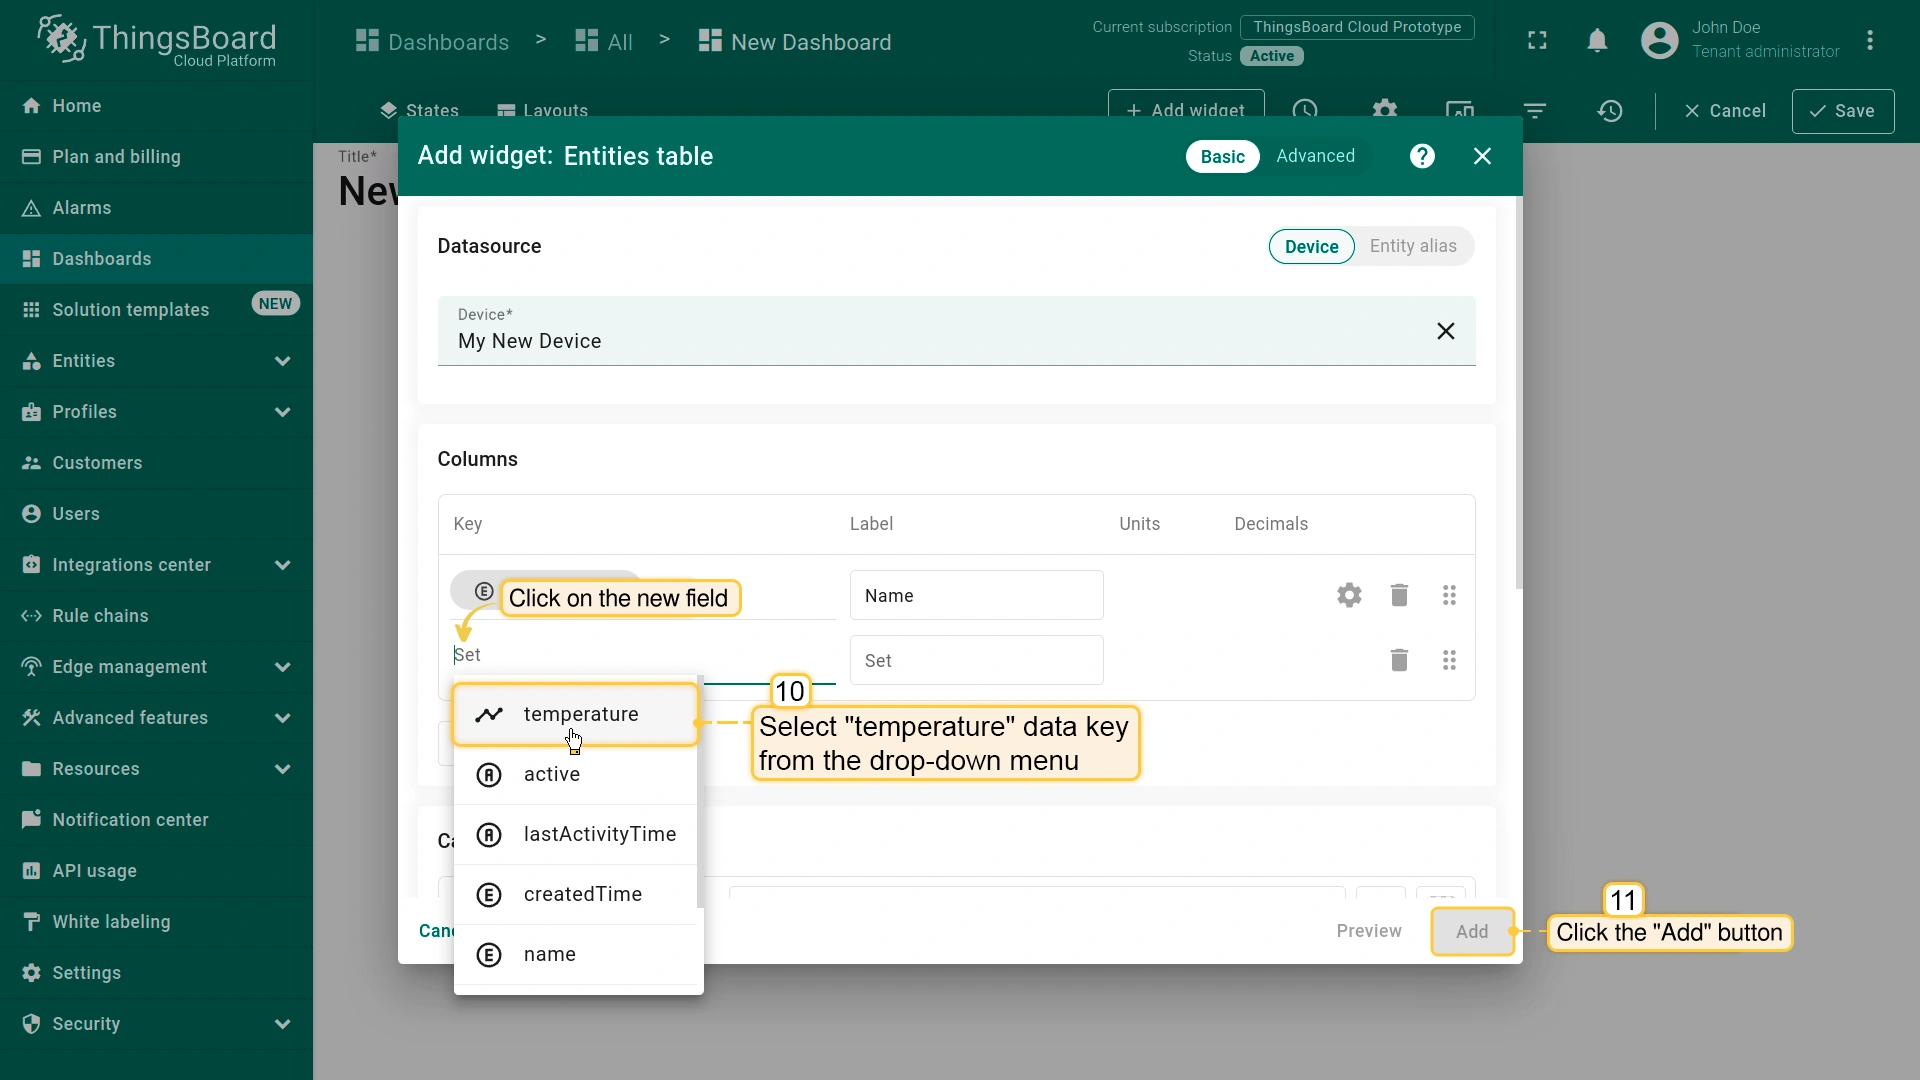
- To select an additional data key to display, click on the newly appeared field. In the drop-down menu, you will see the list of the available data keys. Select the "temperature" data key. Click the "Add" button.
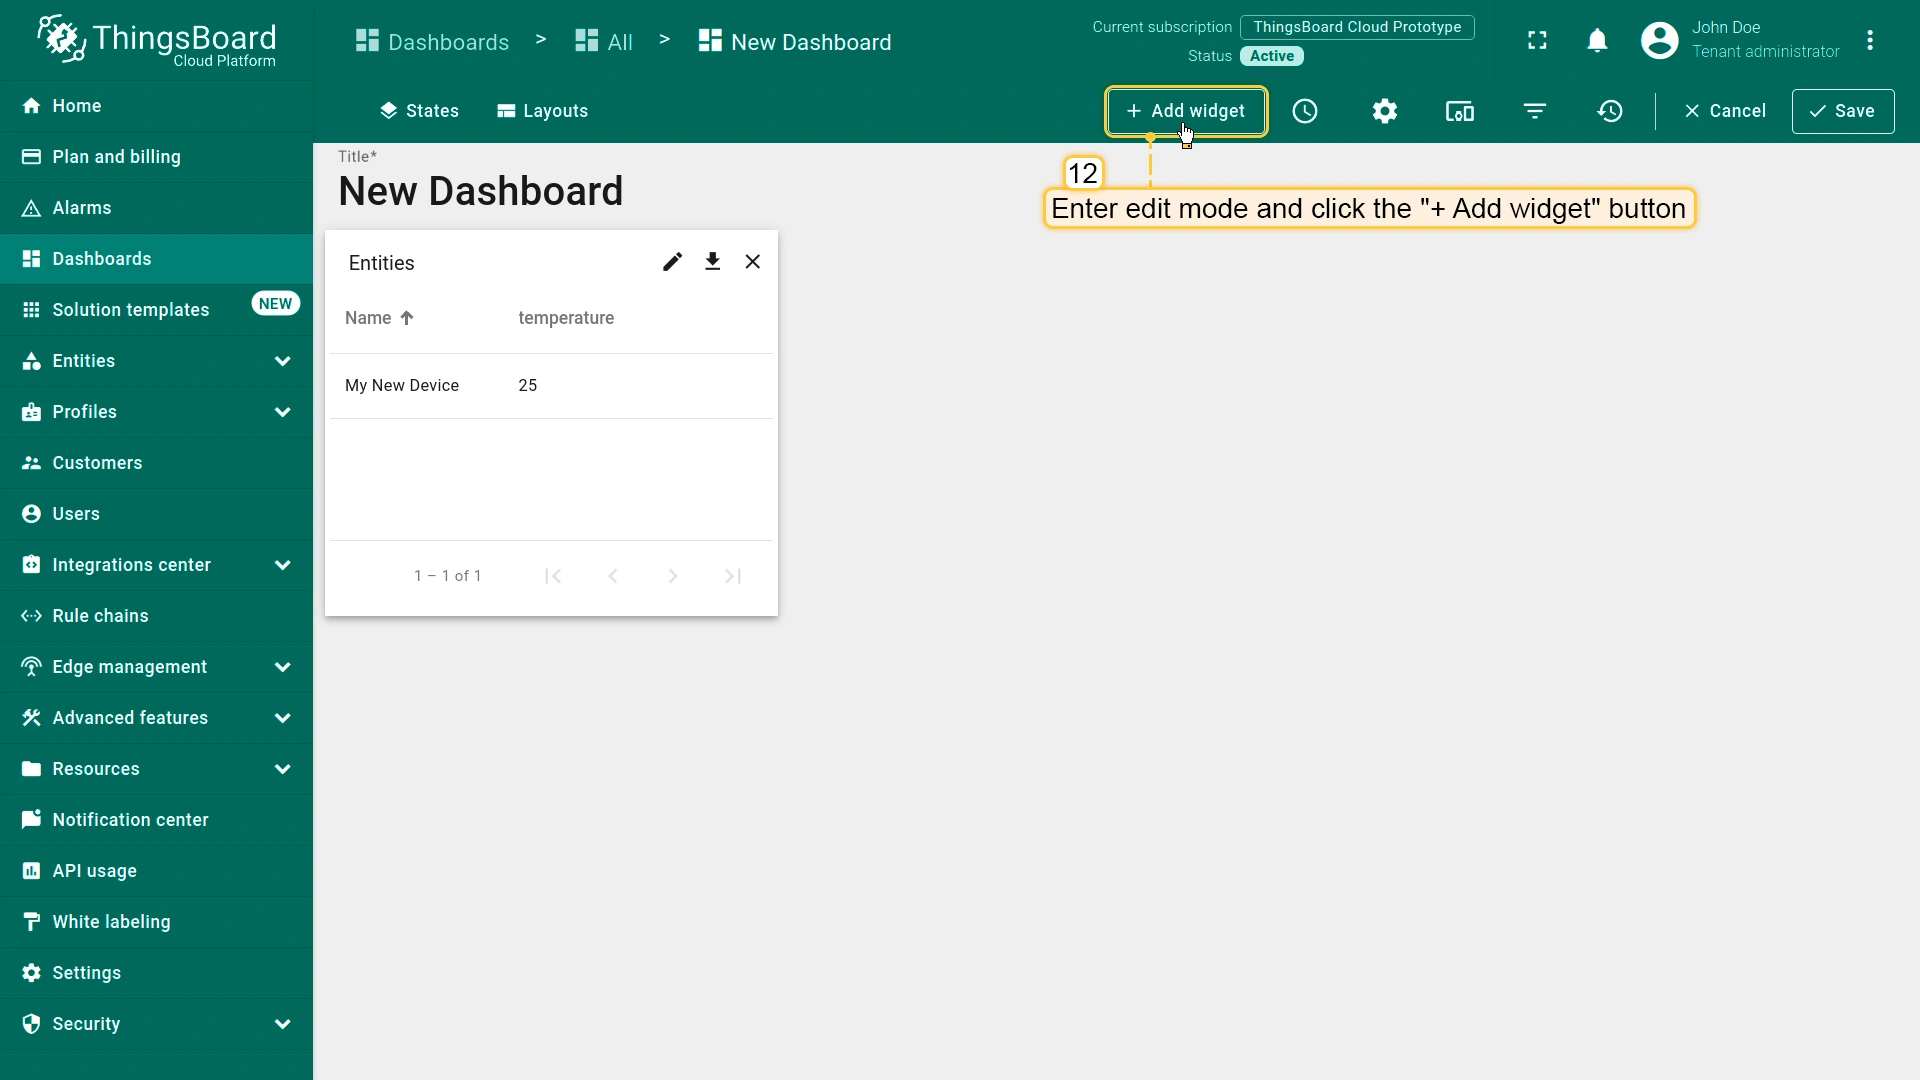
- The "Entities table" widget has been added, and "My New Device" is now displayed in the list. To add another widget, click the "Add widget" button.
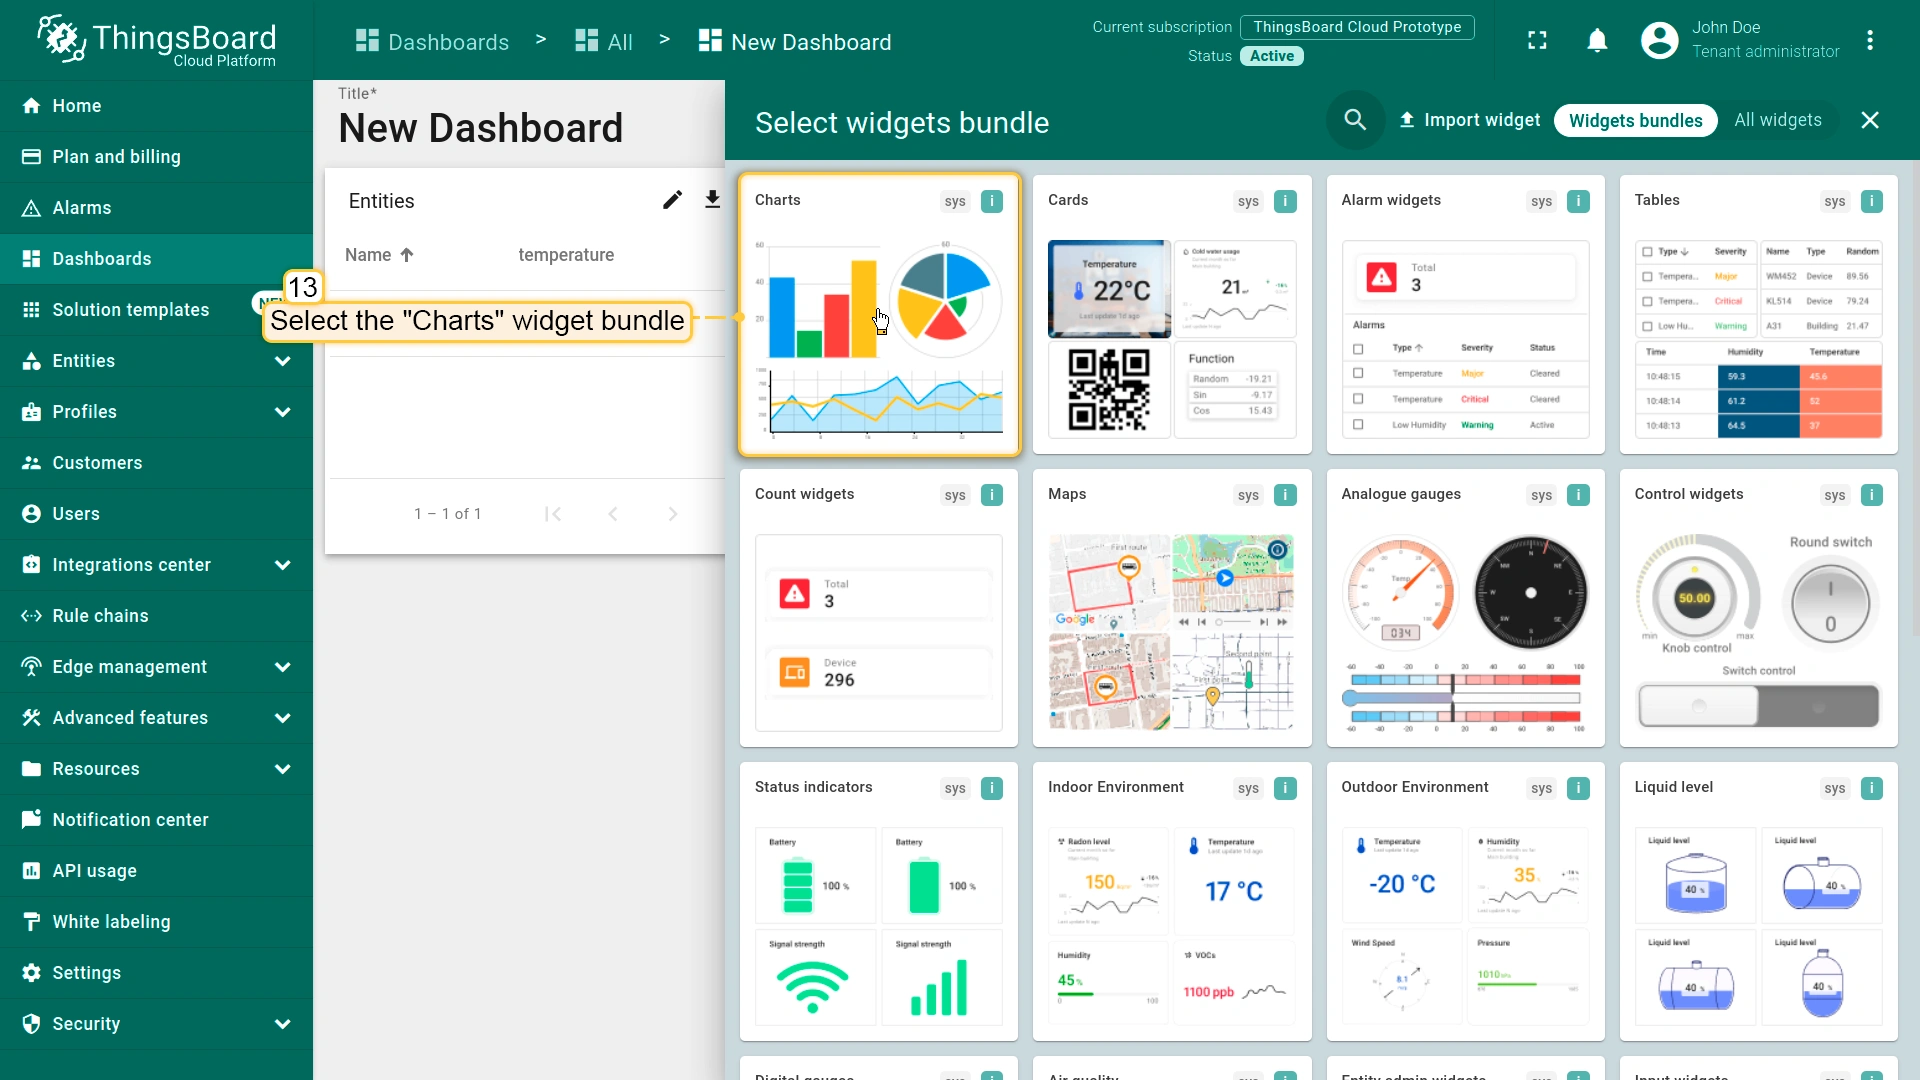
- Locate the "Charts" widgets bundle and click on it.
- Select the "Time series chart" widget.
- Select the previously created device, "My New Device", as the data source, and click the "Add" button. The "Time series chart" widget has been successfully added to the dashboard.
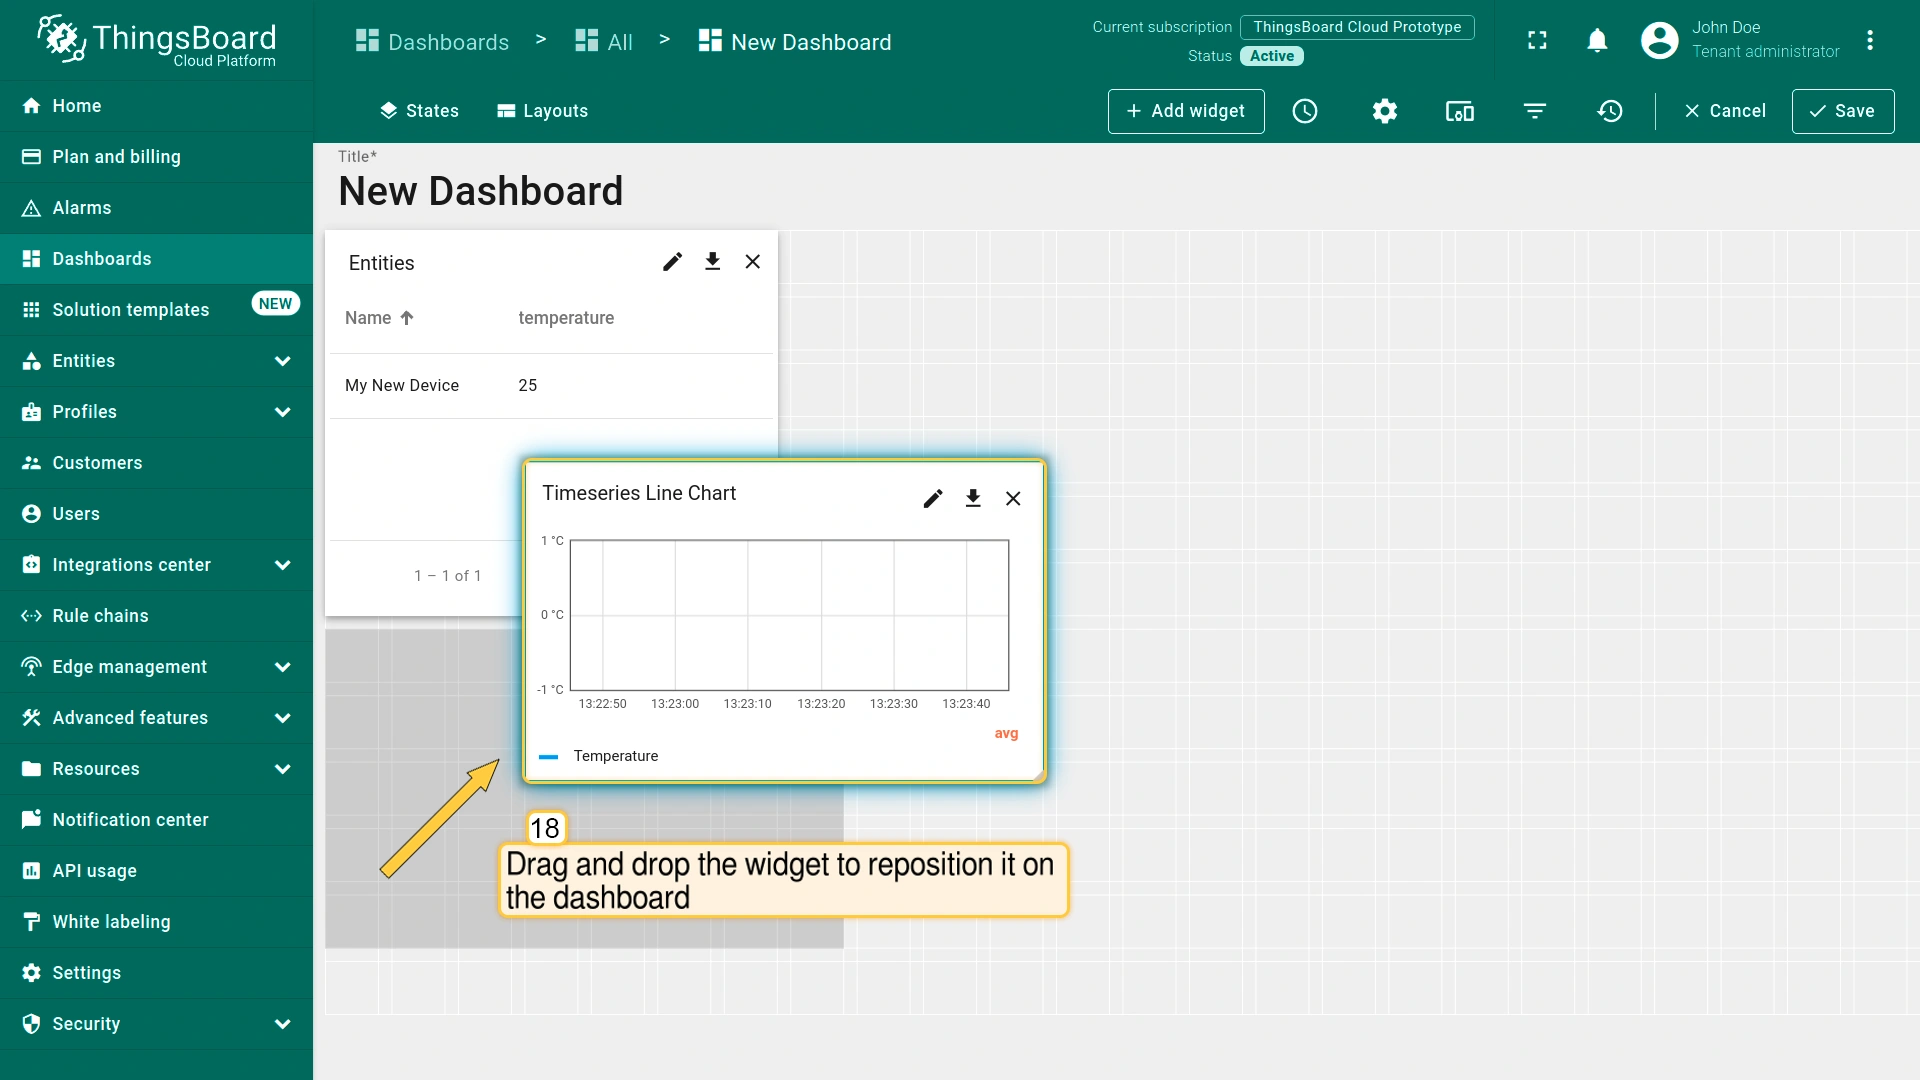
- After configuring all the desired widgets, you can adjust their size and placement on the dashboard as needed. Drag and drop the widget to reposition it on the dashboard.
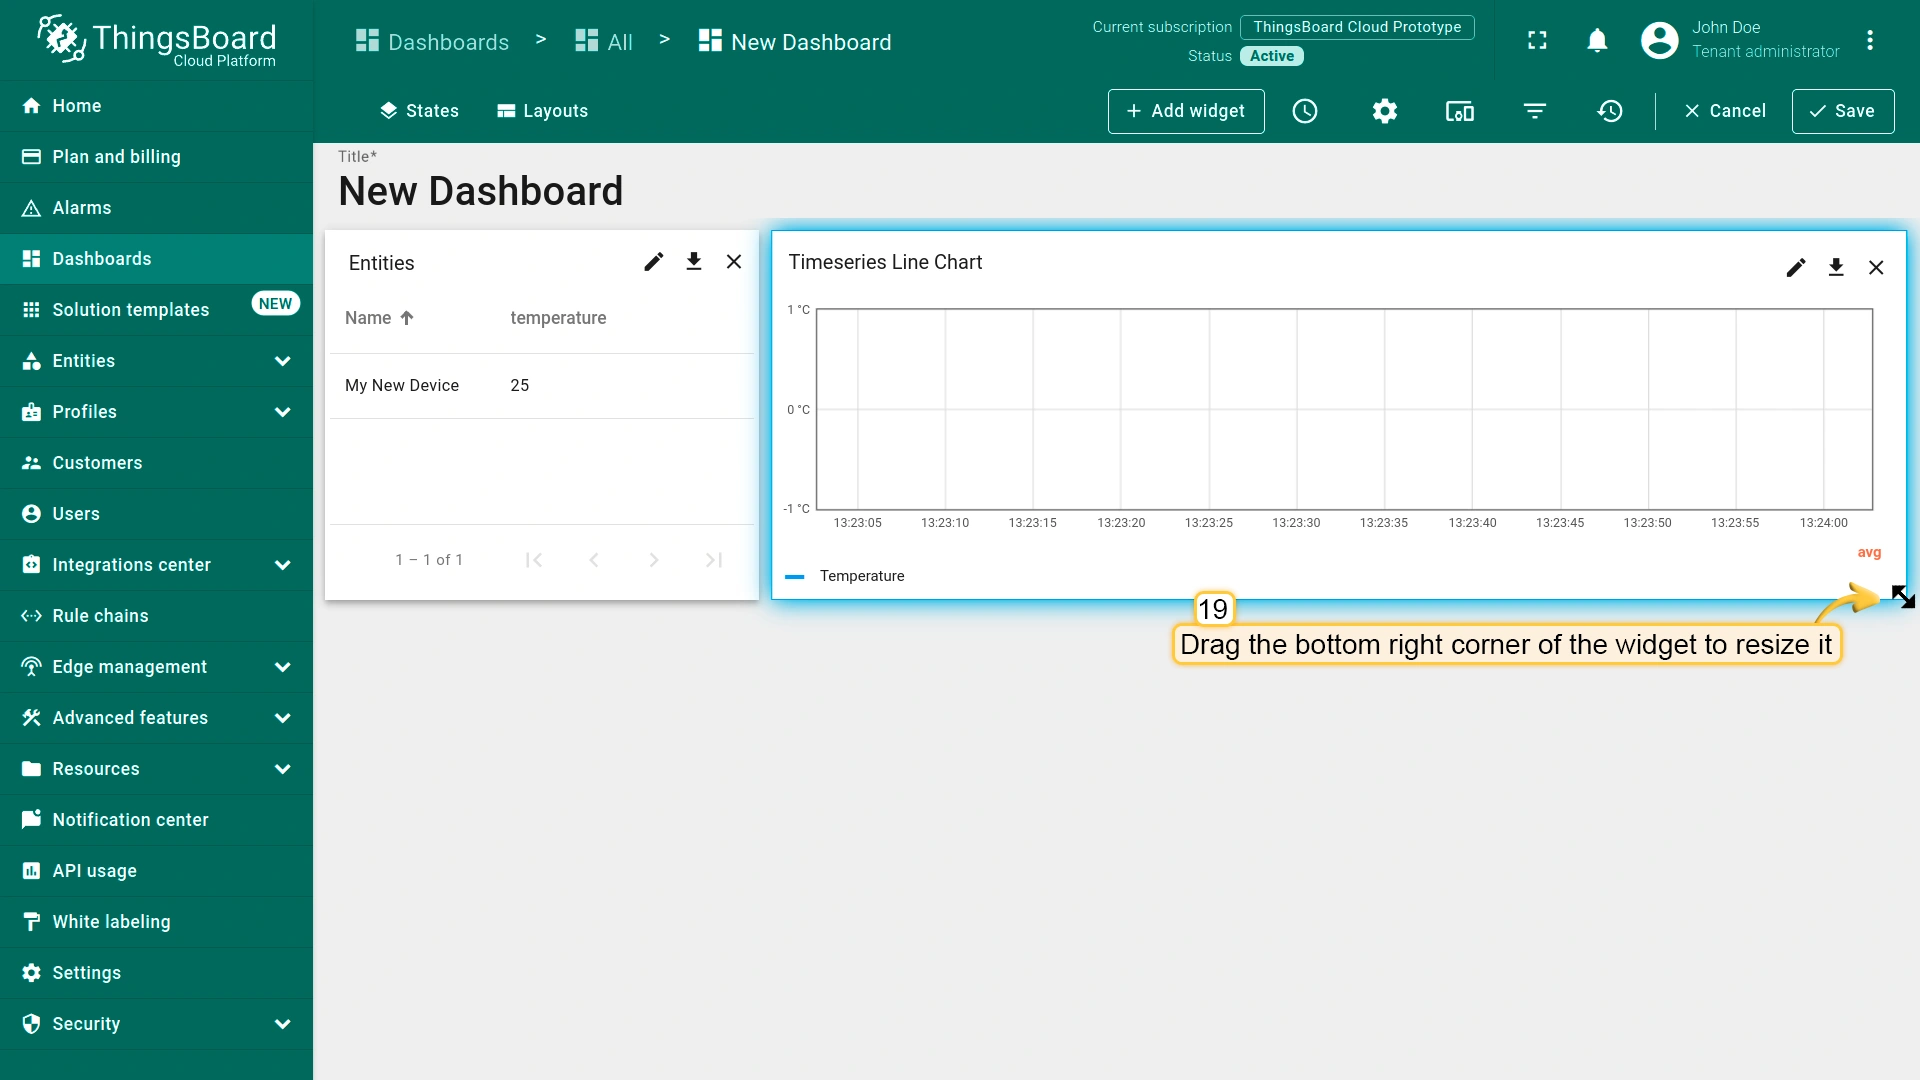
- To resize the widget, drag its bottom-right corner.
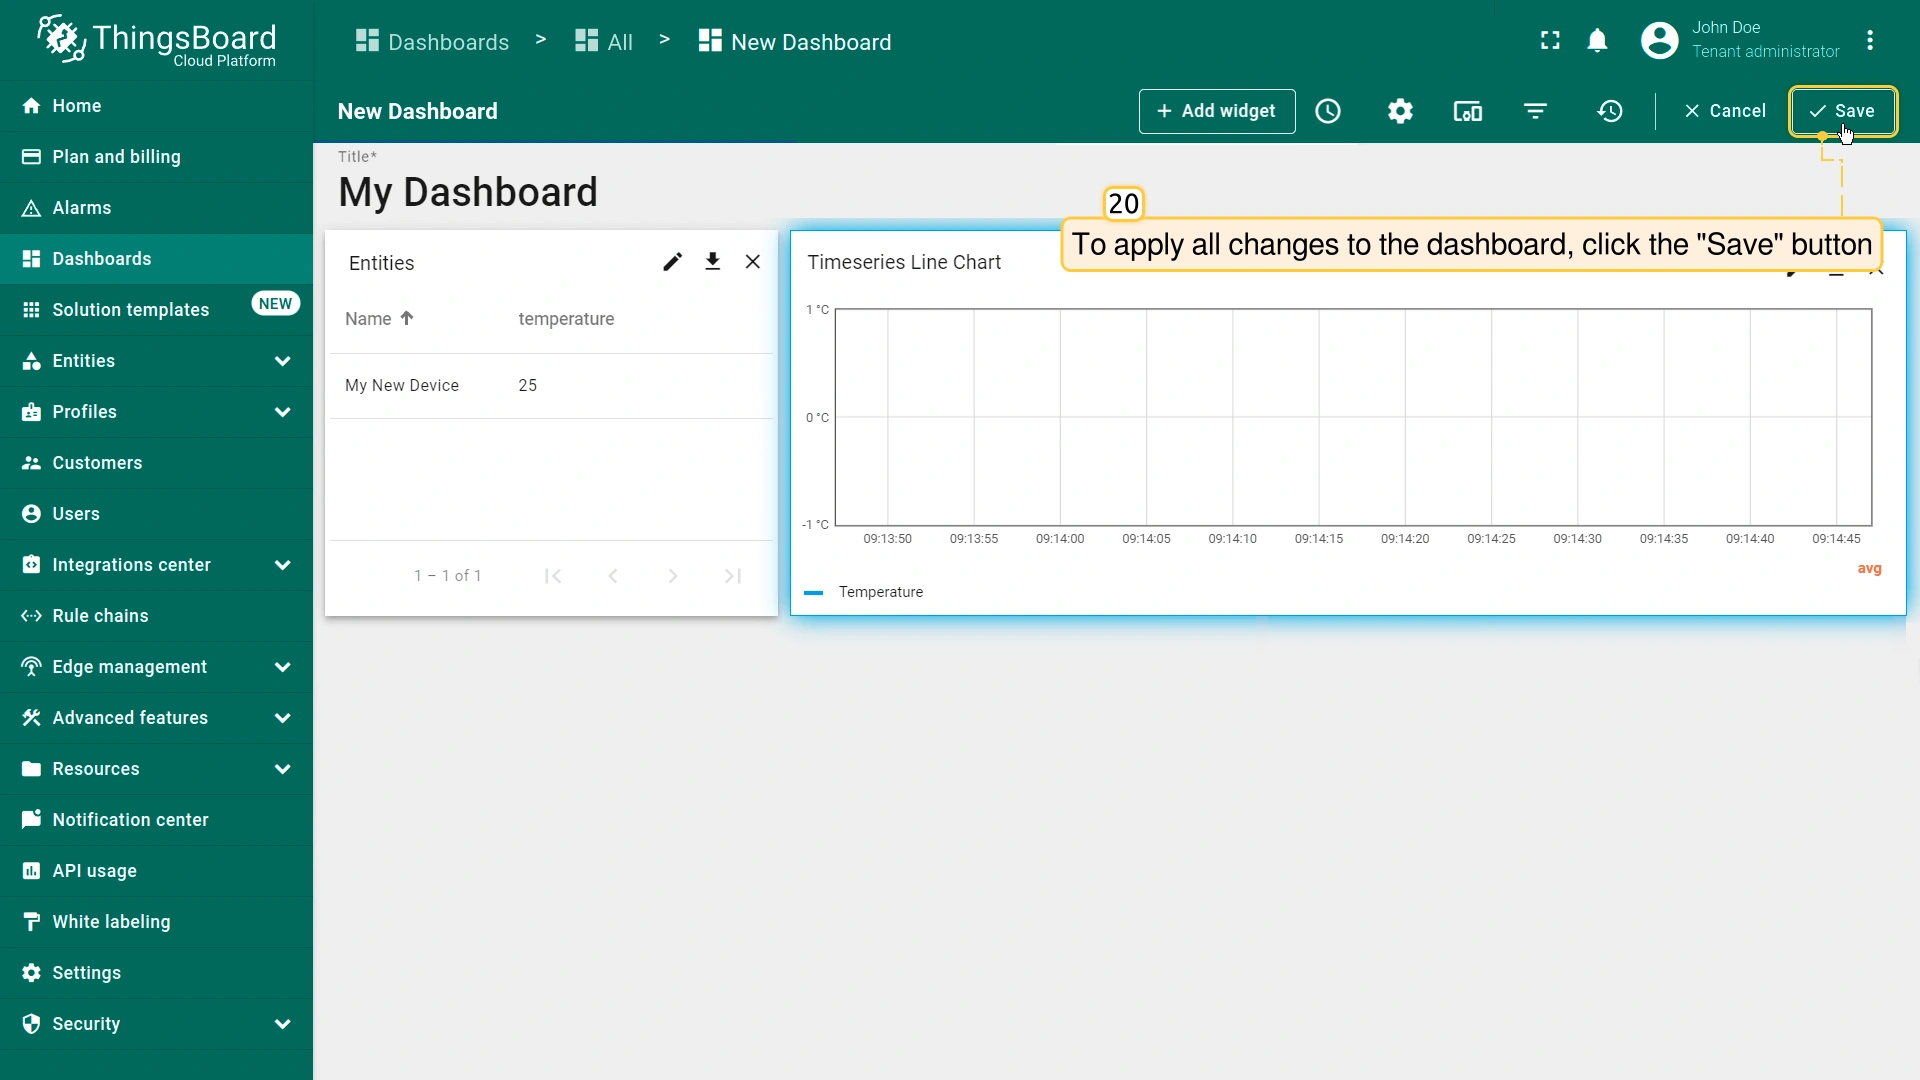
- To apply all changes to the dashboard, click the "Save" button in the upper-right corner of the screen.
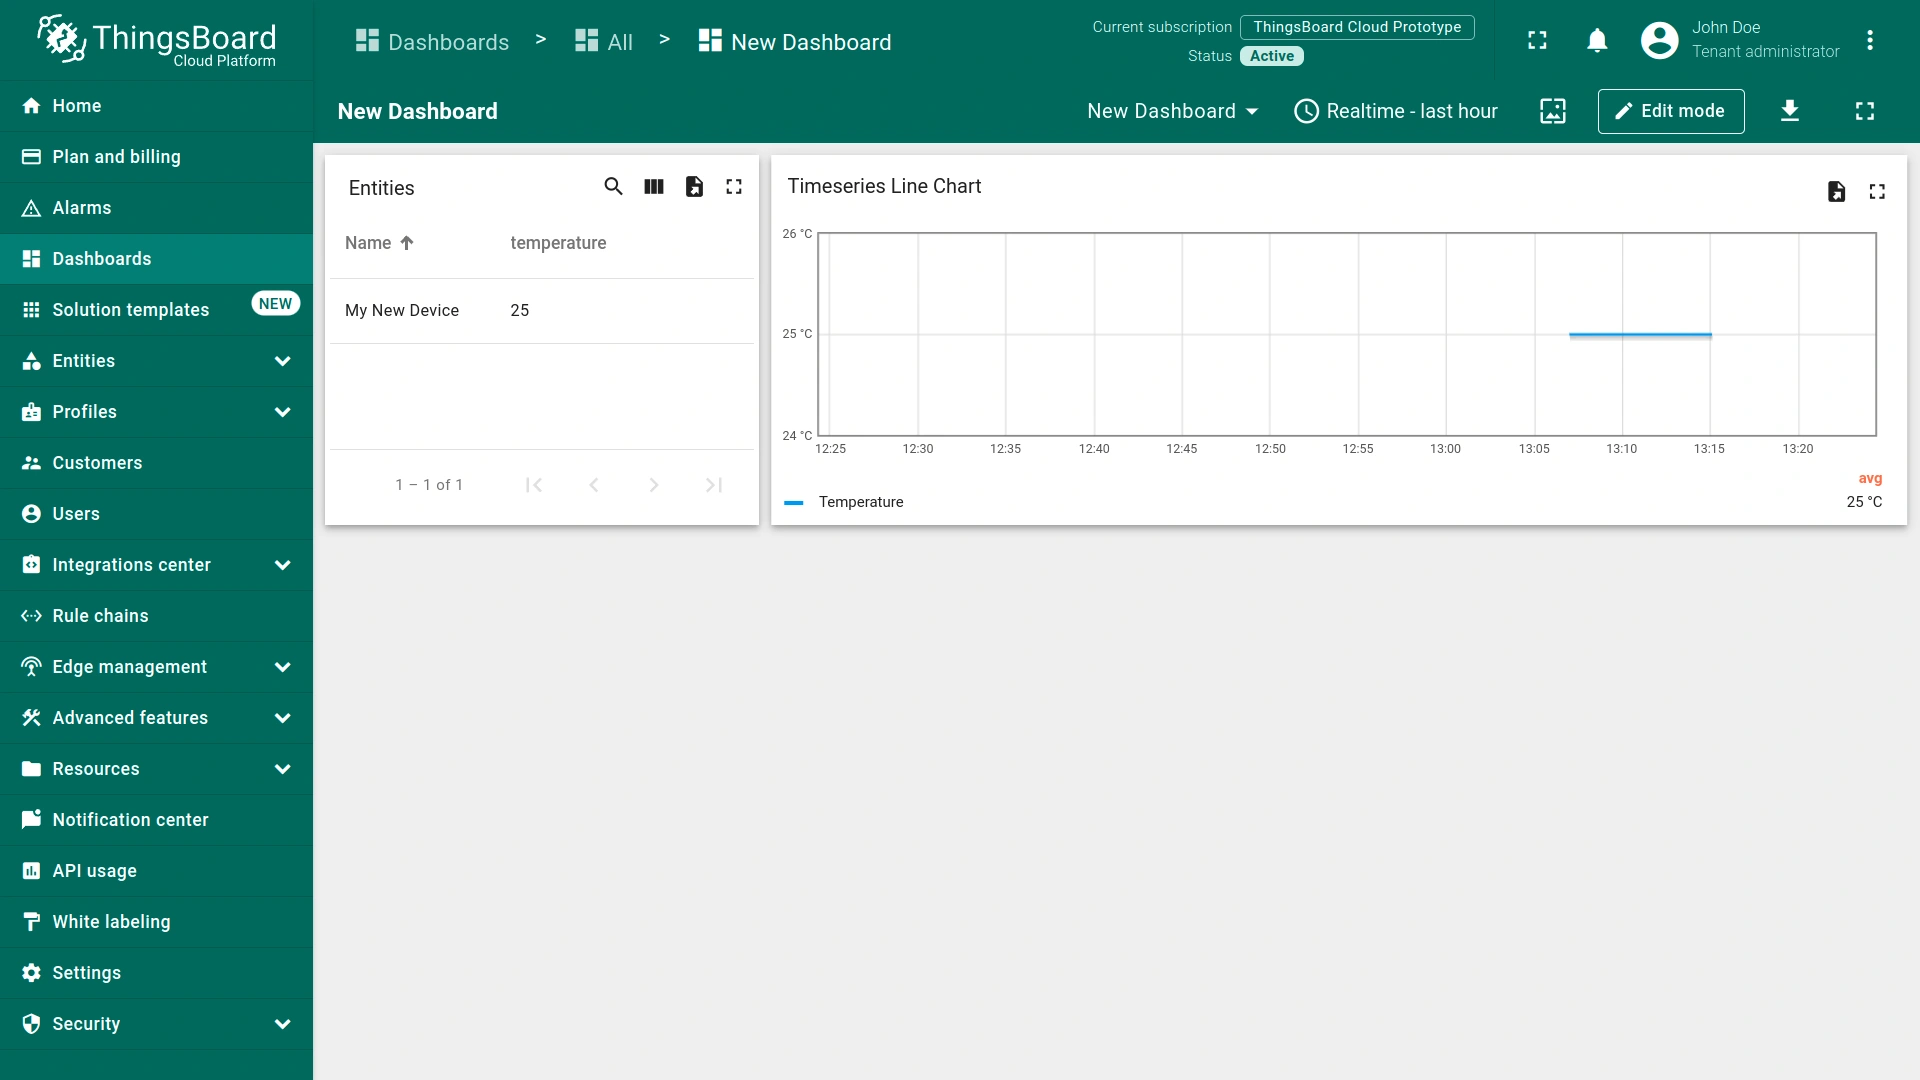
- Congratulations! You have successfully configured the dashboard. Now, all new telemetry readings will instantly appear on the dashboard widgets.
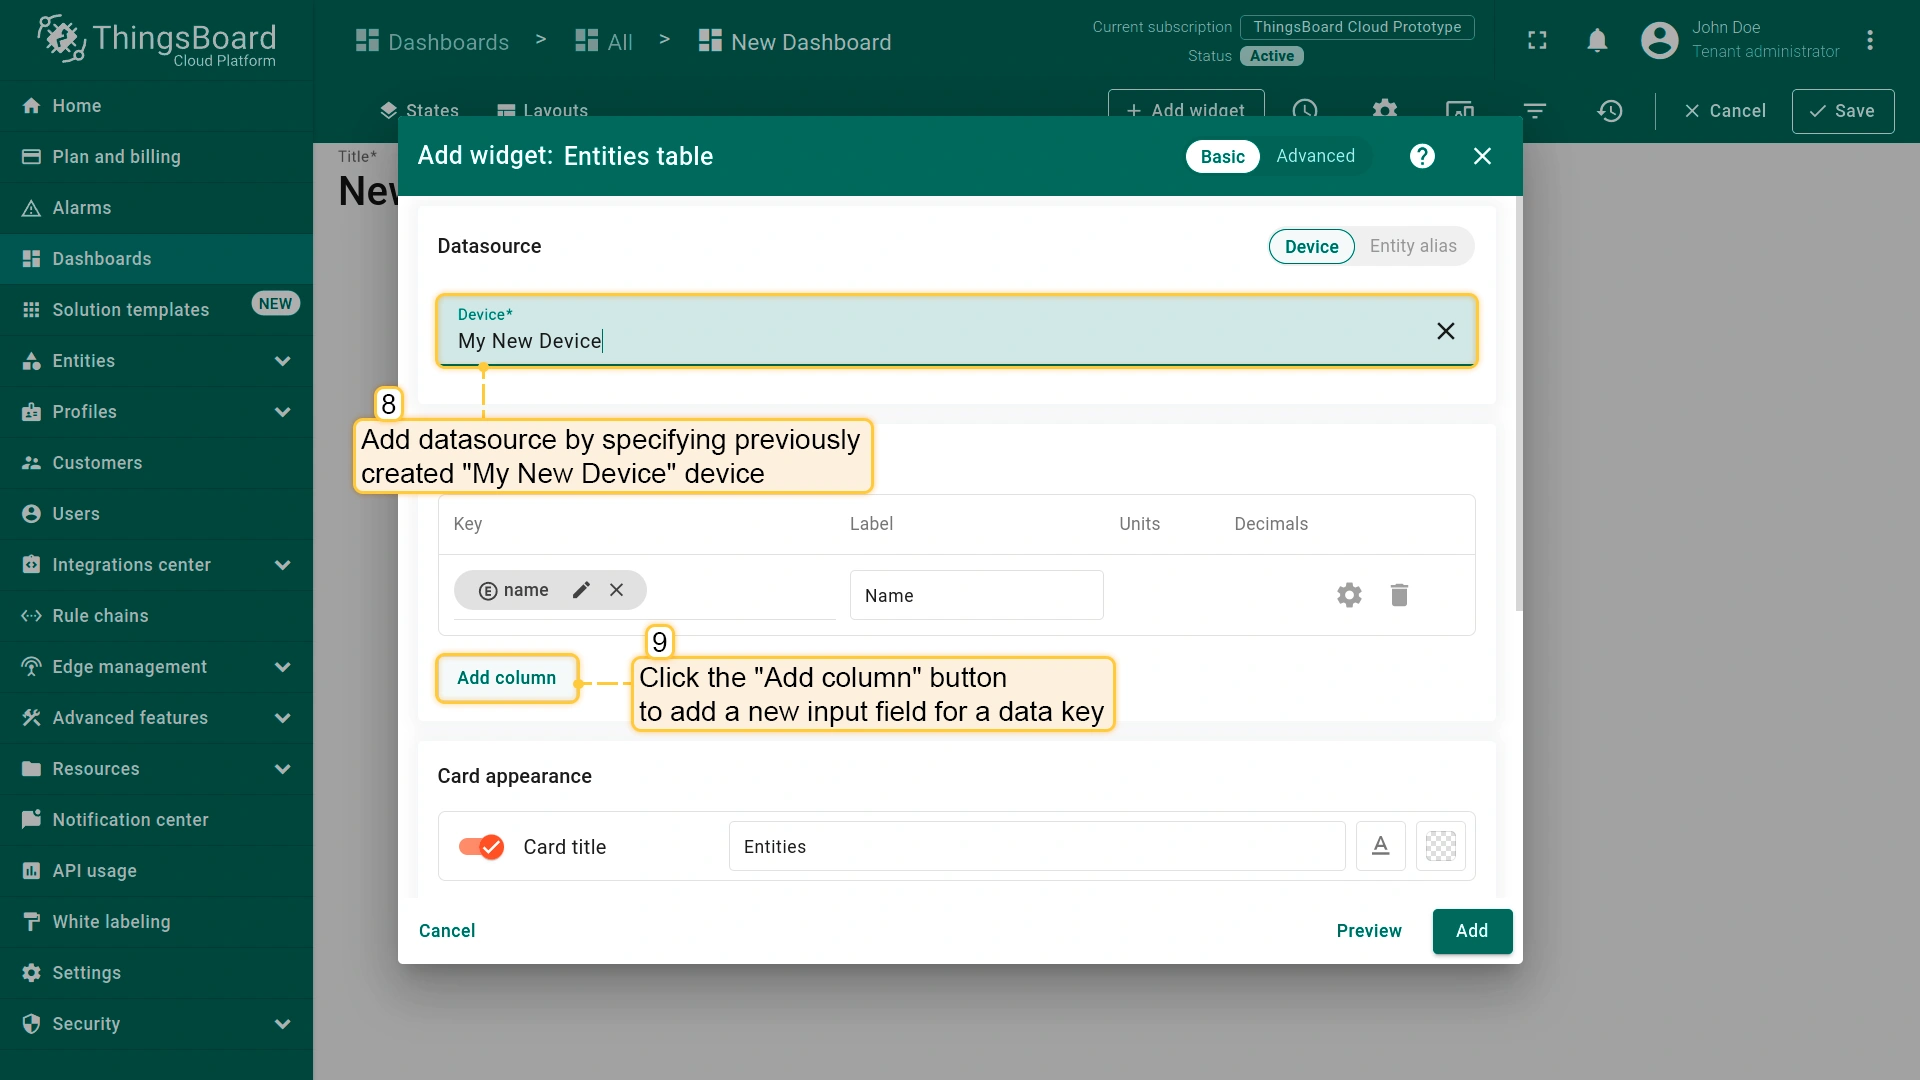
- The “name” key has already been added to the “Columns” section. It will display the column with the device name.
- To add another column with different key value, click the "Add column" button.
Step 3. Pushing Data From Edge to Cloud
要在现场处理数据并与本地及云端服务通信,需使用Edge规则链模板。 本质上,Edge根规则链是指ThingsBoard Edge中处理传入数据、并可根据特定条件触发特定动作的规则链。
要了解遥测数据如何从Edge传输到Cloud,让我们查看默认的Edge根规则链:
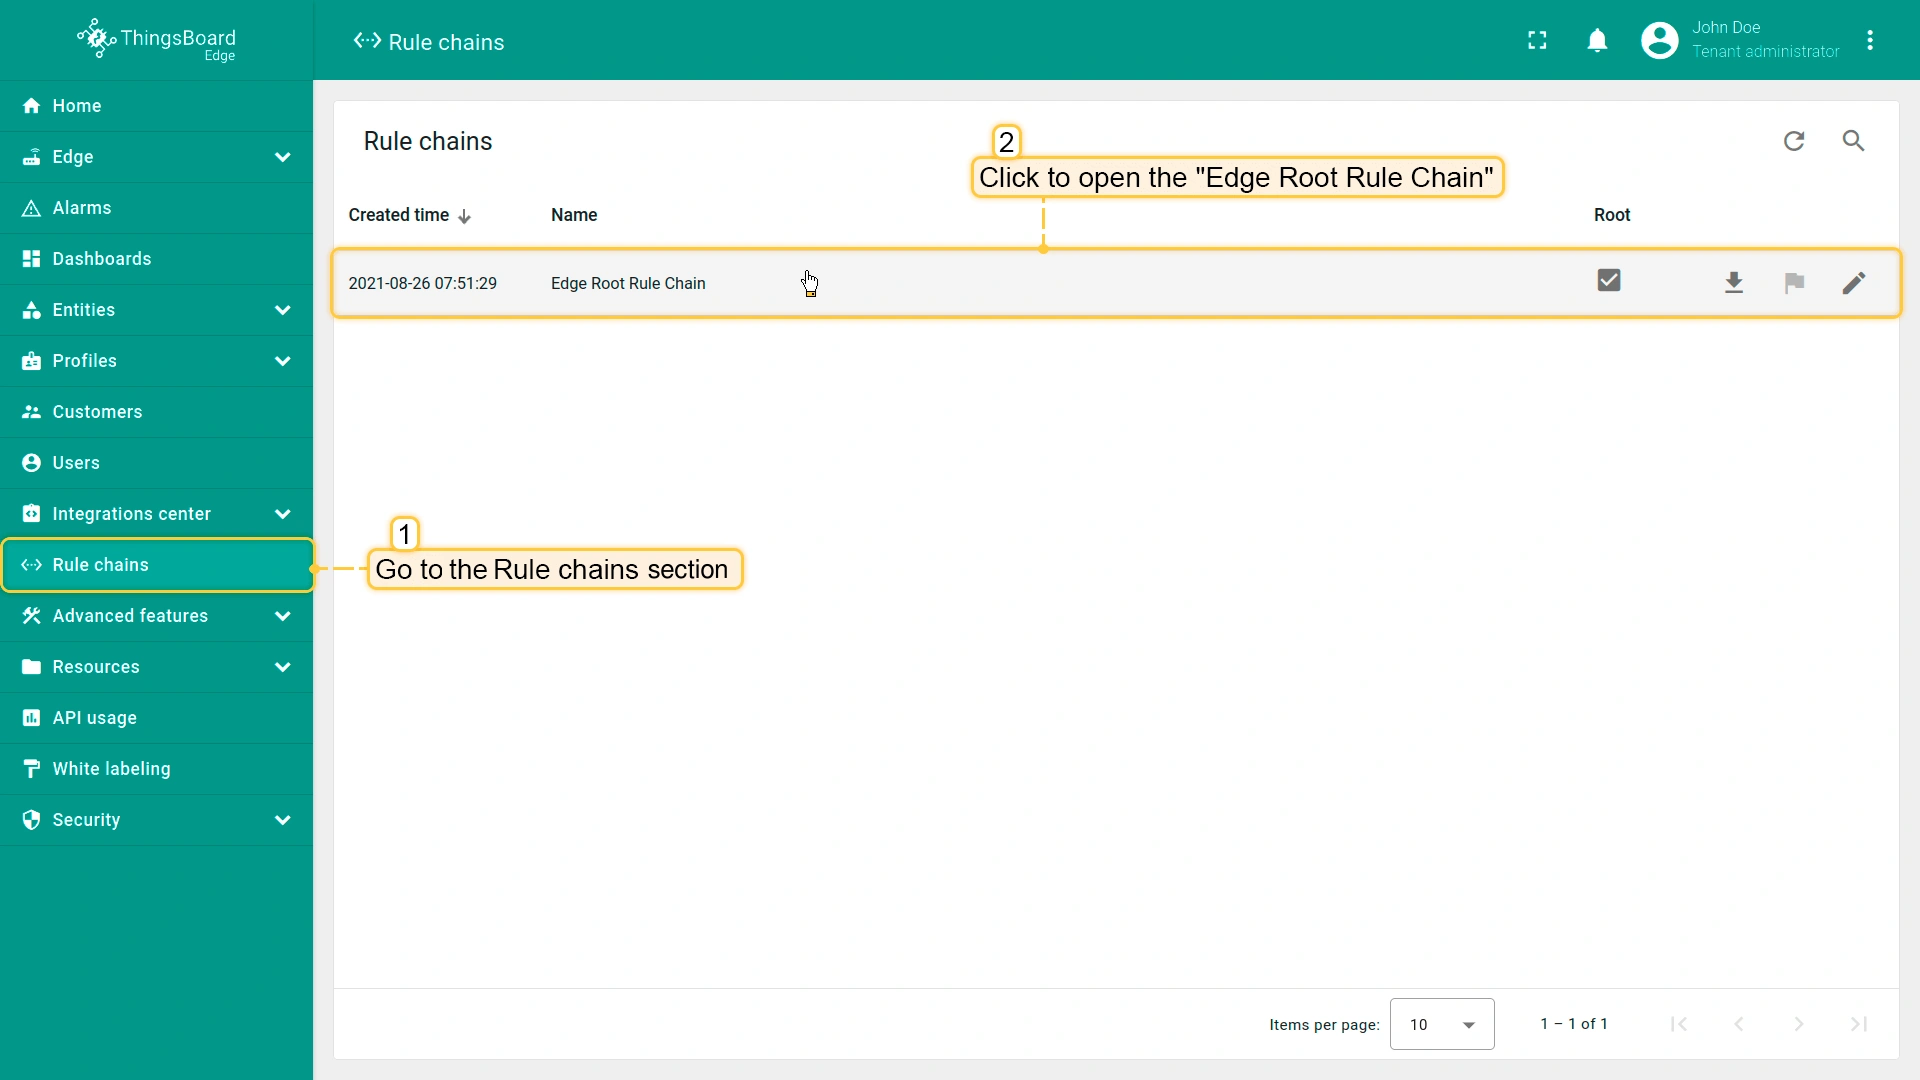
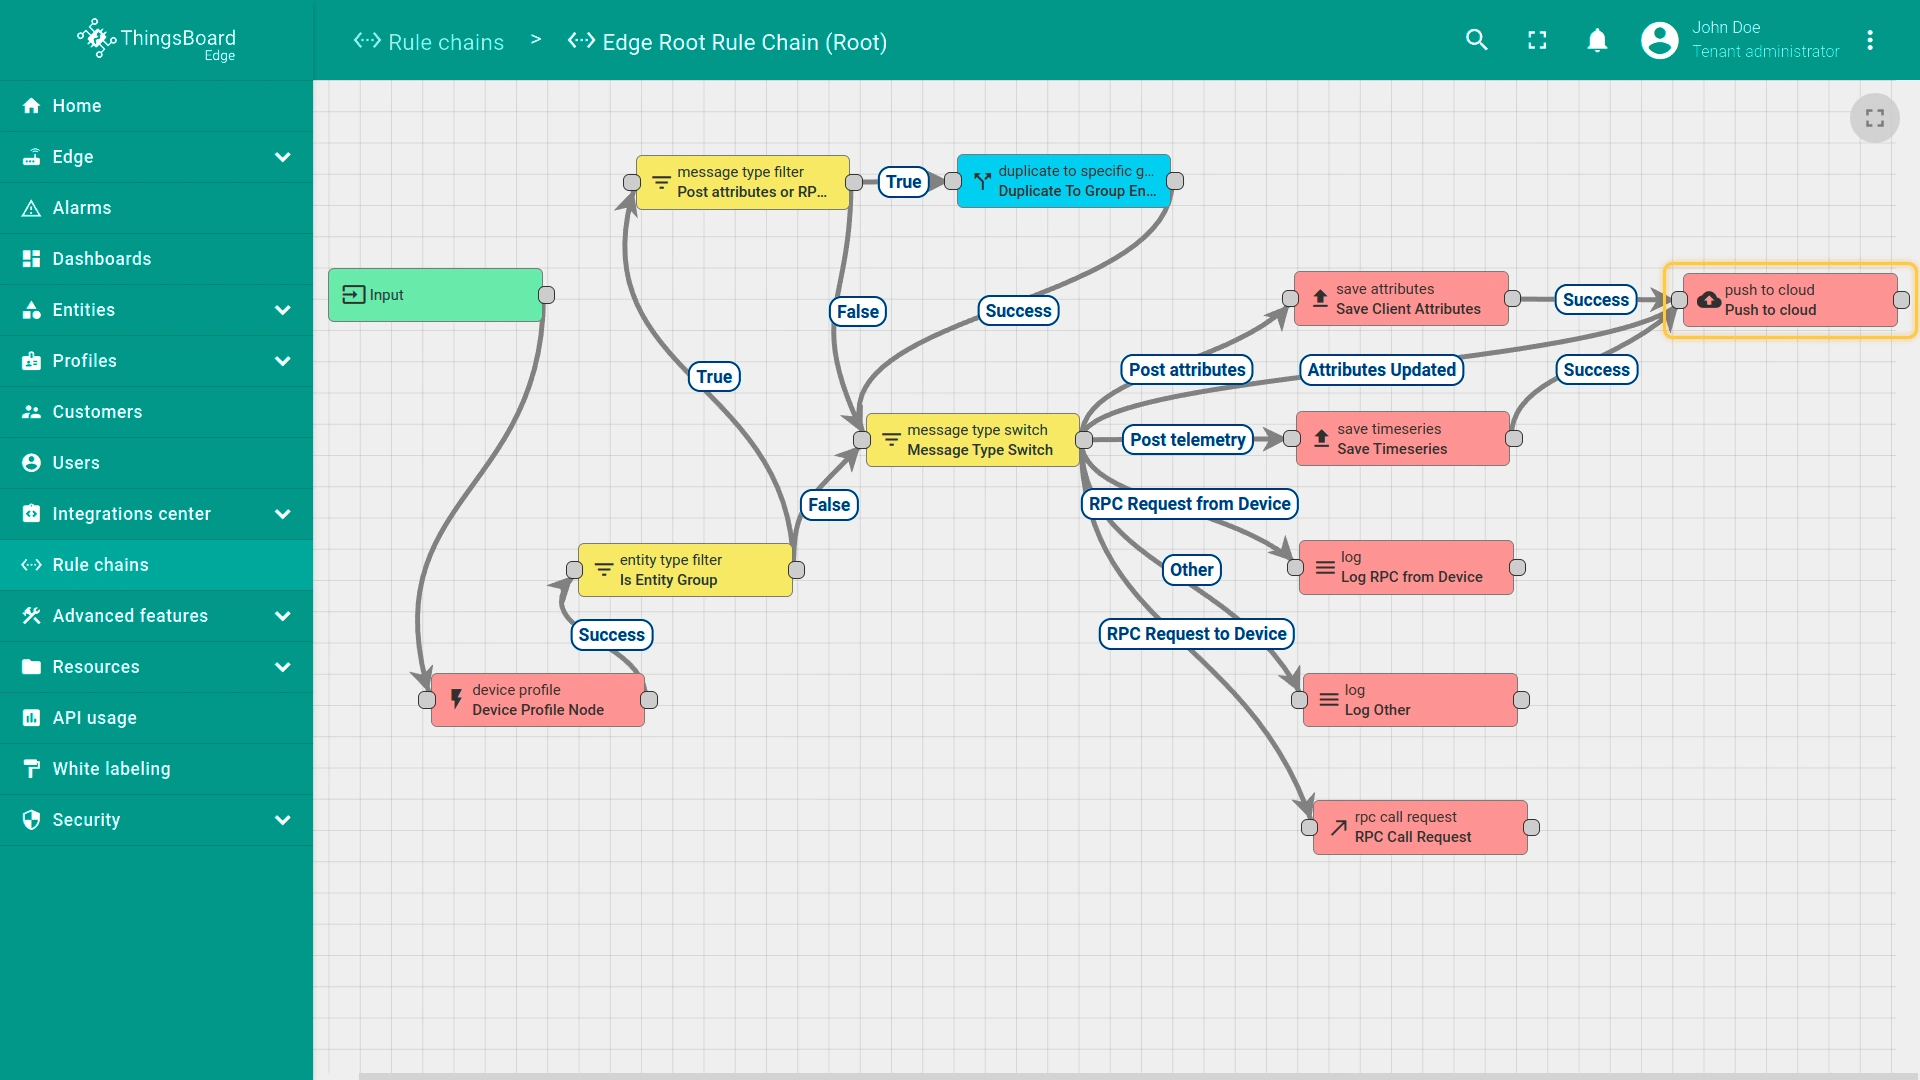
- Within your Edge instance, go to the Rule Chains section and open the "Edge Root Rule Chain".
- The Push to Cloud rule node is used to transmit messages from edge to cloud after they have been stored in the local database.
要编辑Edge规则链模板或创建新模板,请登录ThingsBoard Server实例(SERVER_URL),进入Edge management > Rule chain templates(边缘管理 > 规则链模板)部分,并按照 这些说明 操作。
Step 4. Provisioning Entities From Edge to Server
任何现实世界的资产、设备、传感器或其他逻辑组件在ThingsBoard中以相应的实体表示。 大多数实体可在Edge实例上创建。在Edge实例上创建实体后,它将自动发布到ThingsBoard Server,无需额外操作。
要查看已发布的实体(如设备),请登录SERVER_URL处的ThingsBoard Professional Edition:
- Navigate to the Devices section to confirm that the newly created device, "My New Device", has been published to the ThingsBoard Server (Cloud).
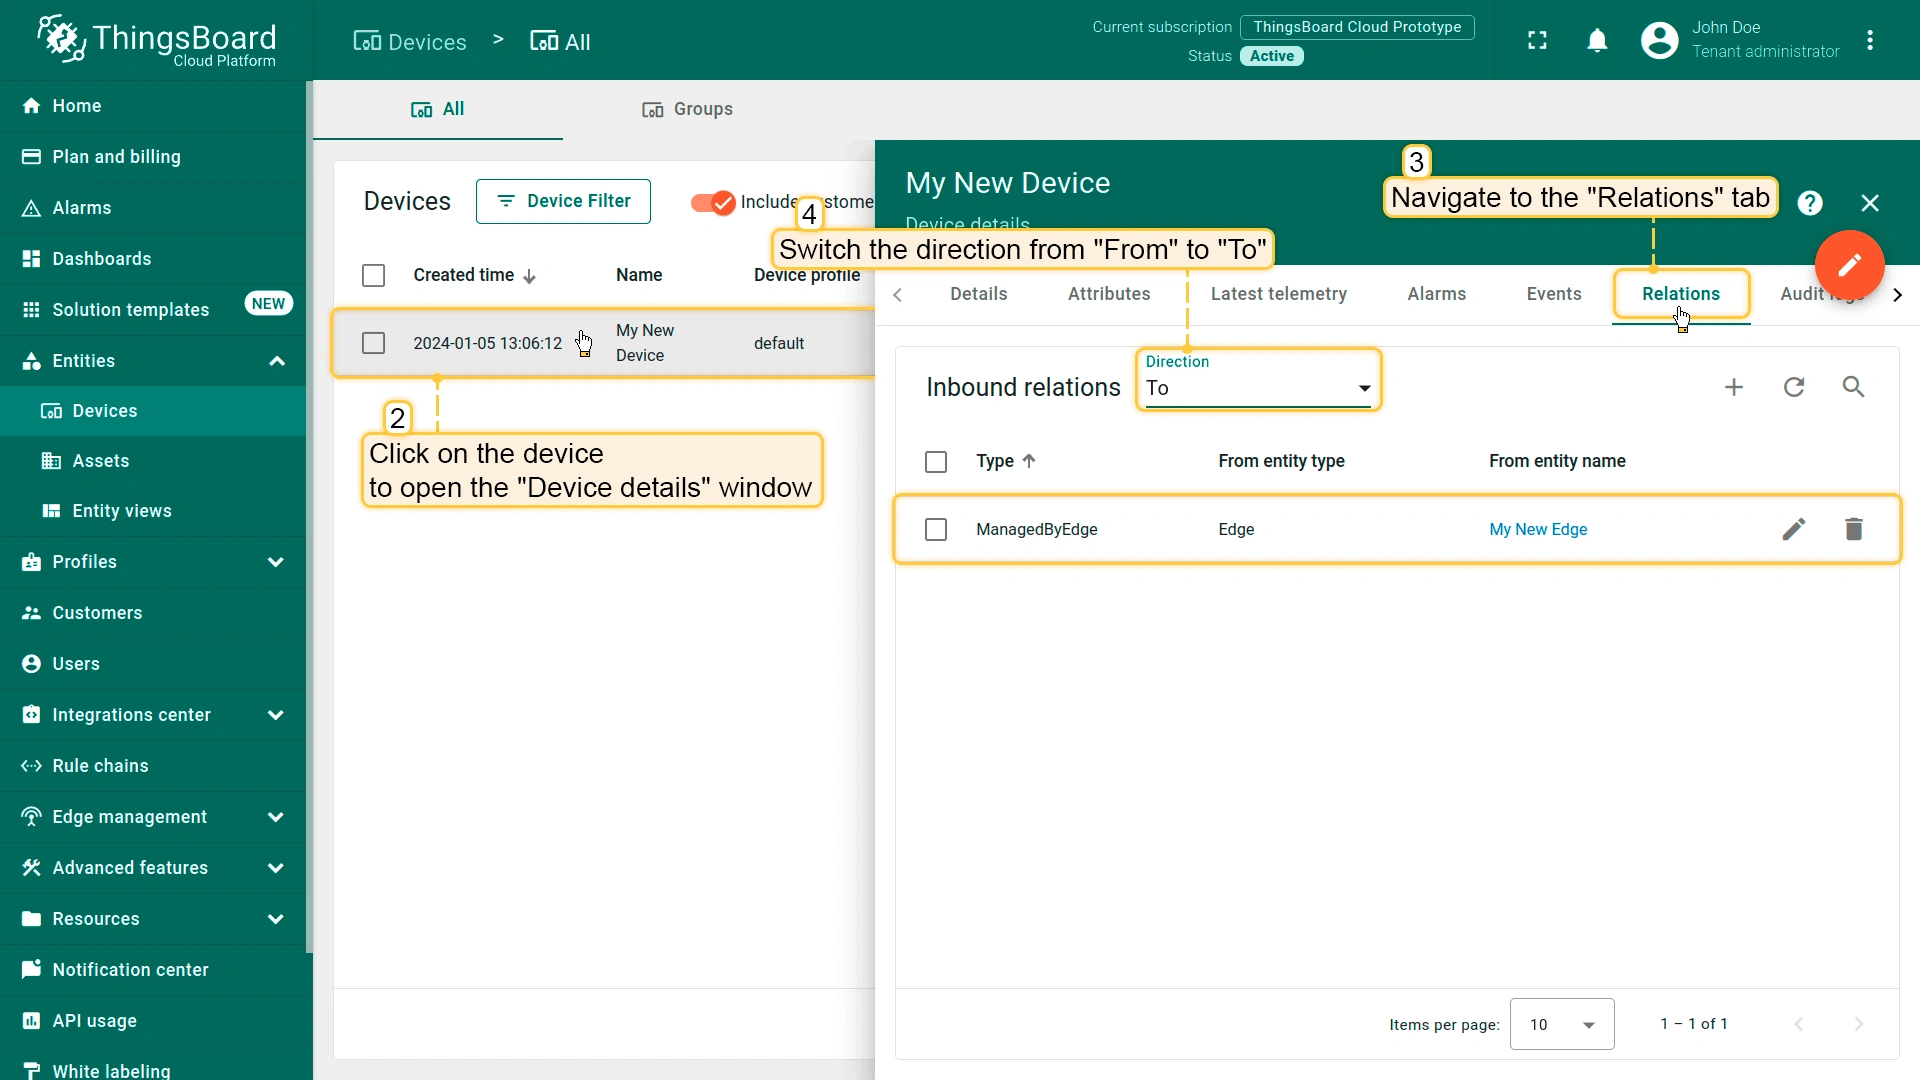
- Click on the "My New Device" to open the "Device details" page and select the "Relations" tab. Switch the direction from "From" to "To" to view the relation to the Edge that provisioned this device.
Step 5. Provisioning Entities From Server to Edge
实体也可以在Server上创建,然后分配给Edge实例。 此方式可简化多个Edge实例之间的实体管理。
要将实体分配给Edge,请登录SERVER_URL处的ThingsBoard Professional Edition Server并创建实体,例如仪表盘。
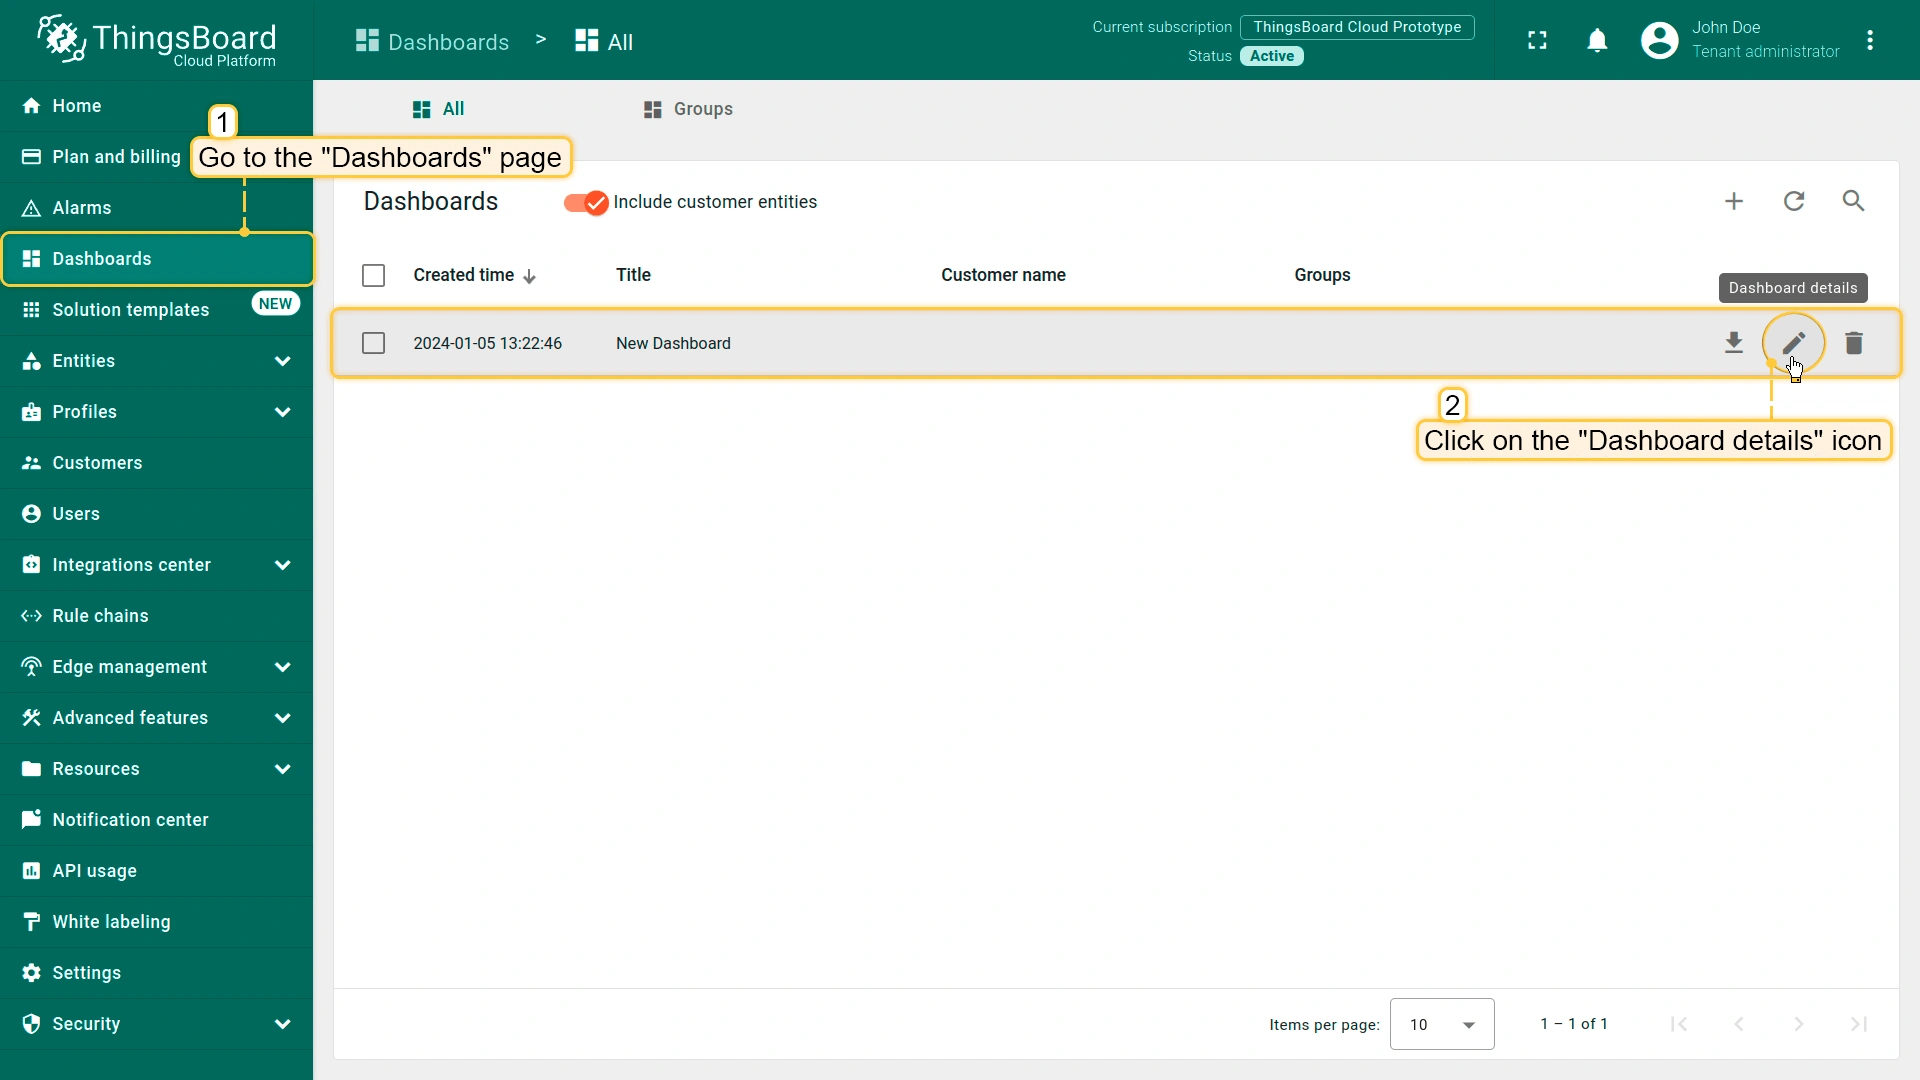
- Create a new dashboard on the ThingsBoard Server. Click the "Dashboard details" icon to view details;
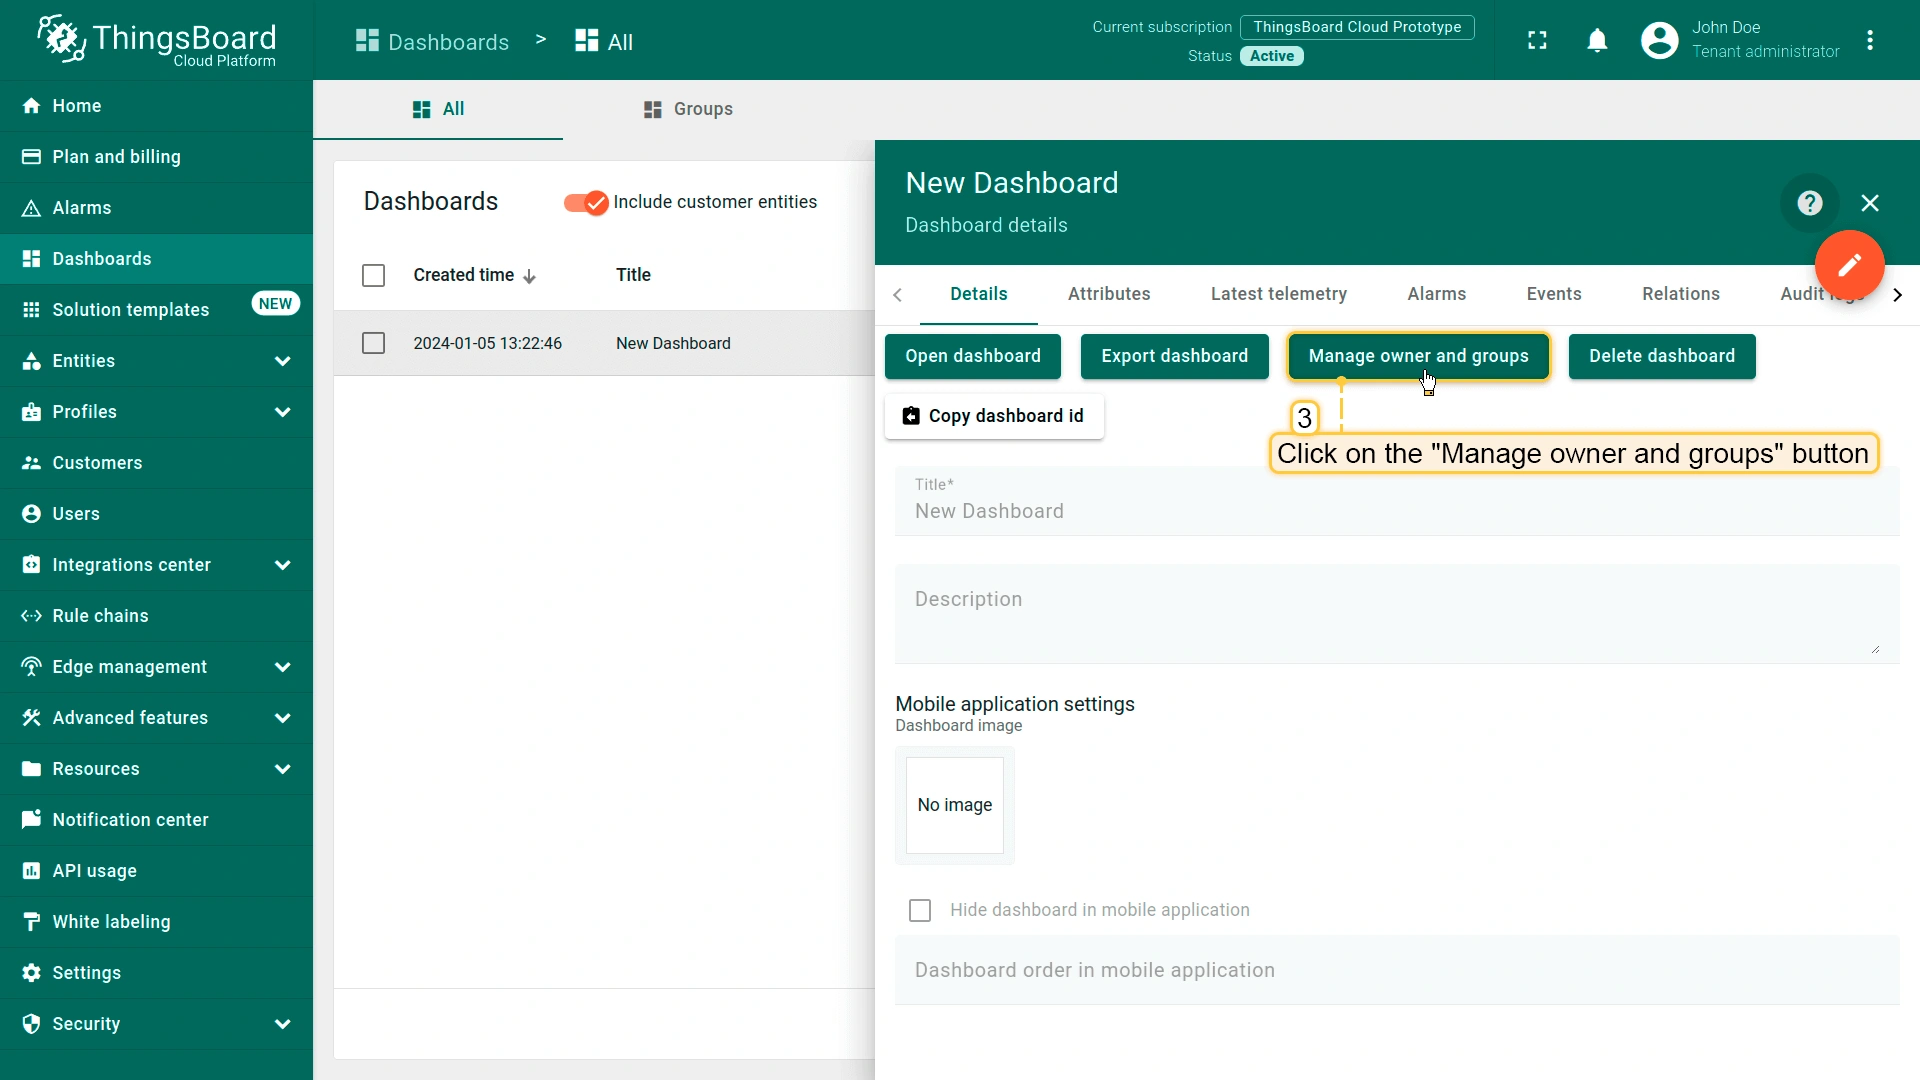
- Click the "Manage owner and groups" button;
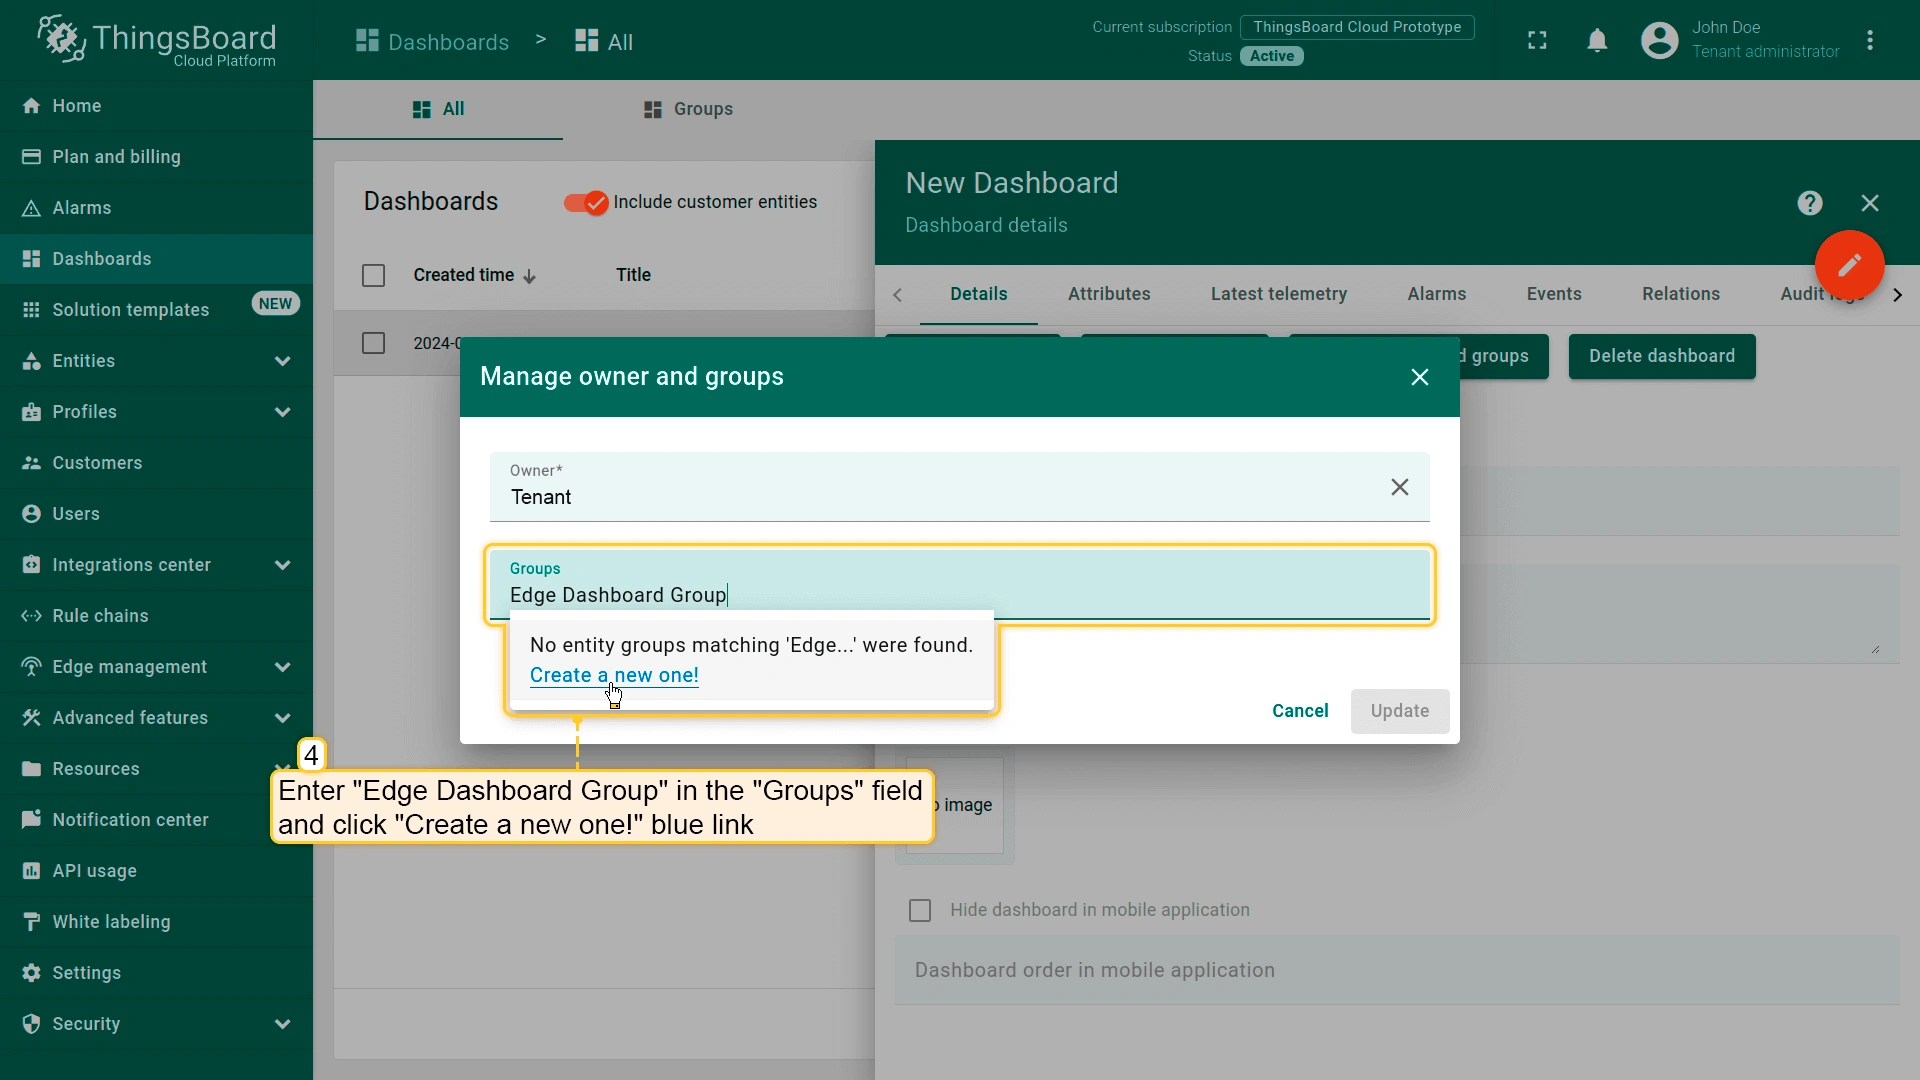
- Now, create a new dashboard group and add the previously created dashboard to it. Enter a name for the new dashboard group (for example, "Edge Dashboard Group") in the "Groups" field, and click the "Create a new one!" link.
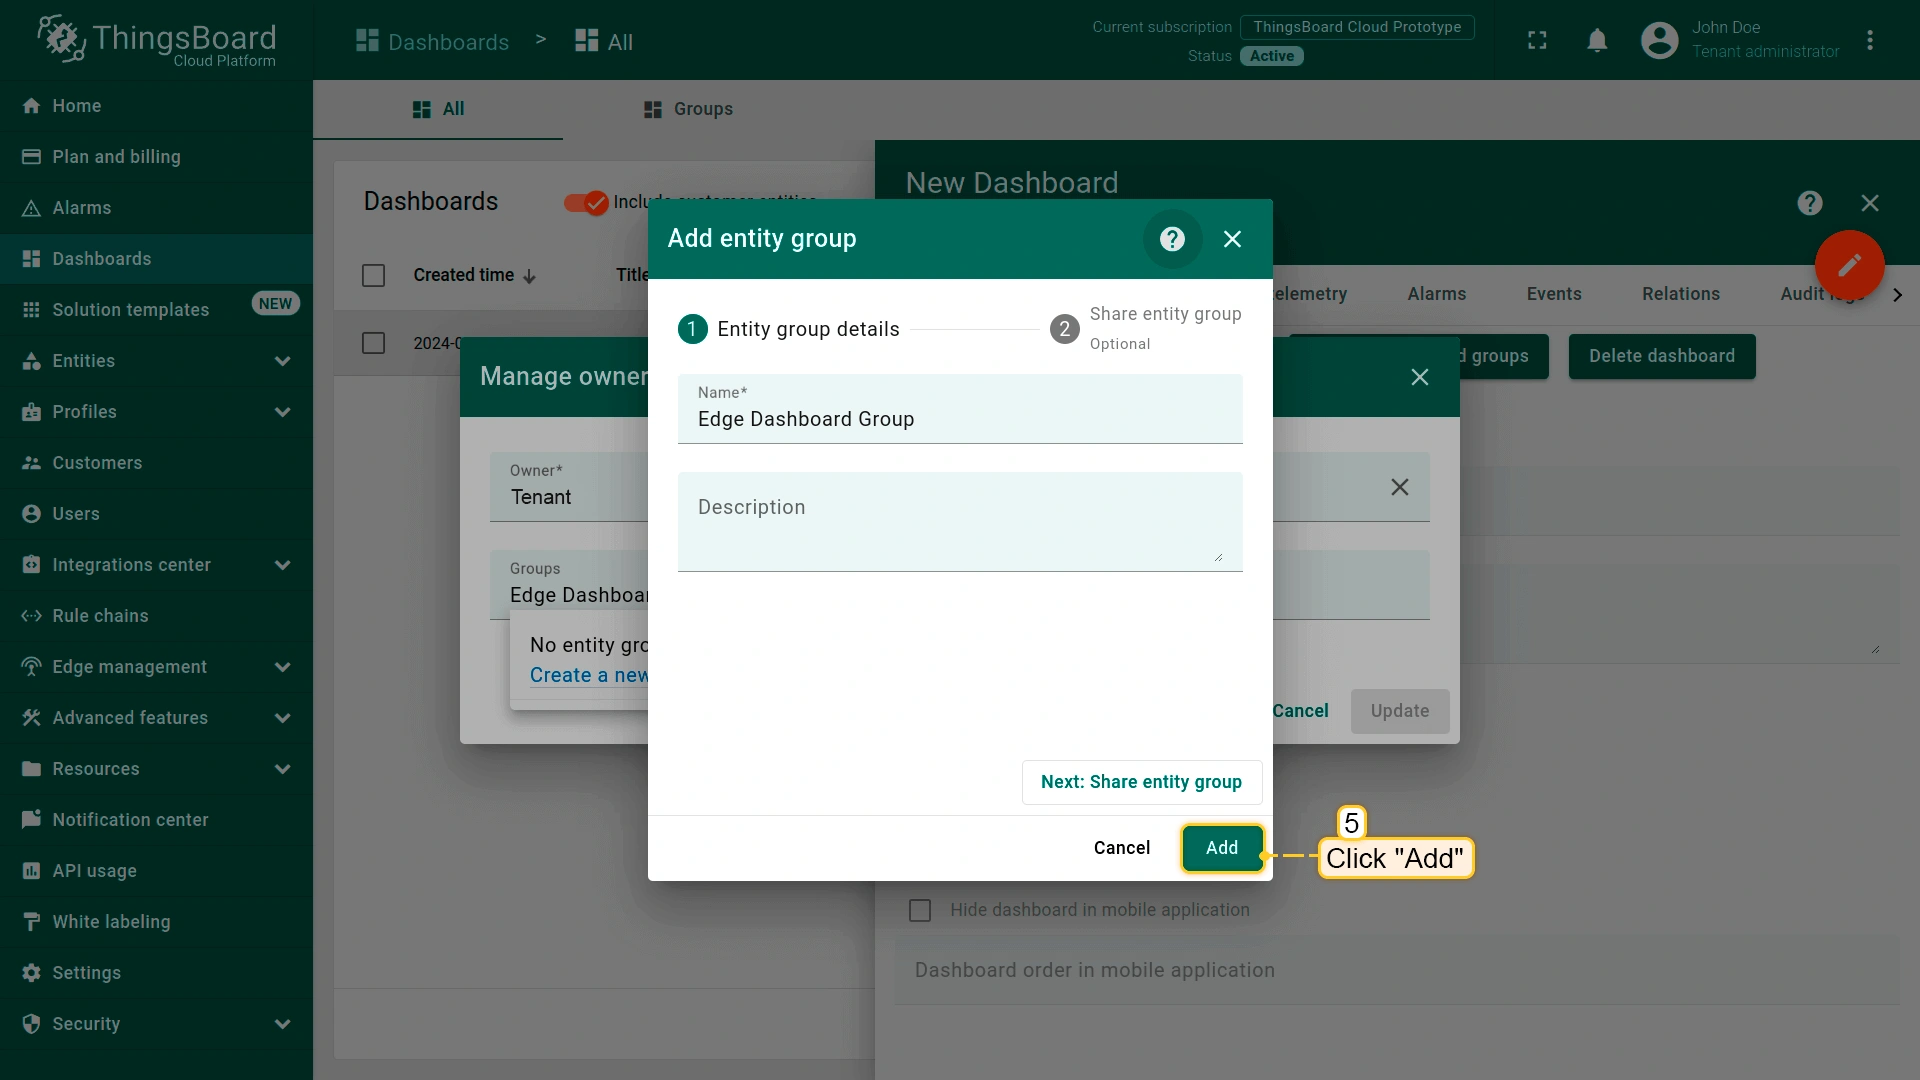
- In the "Add entity group" pop-up window, click the "Add" button.
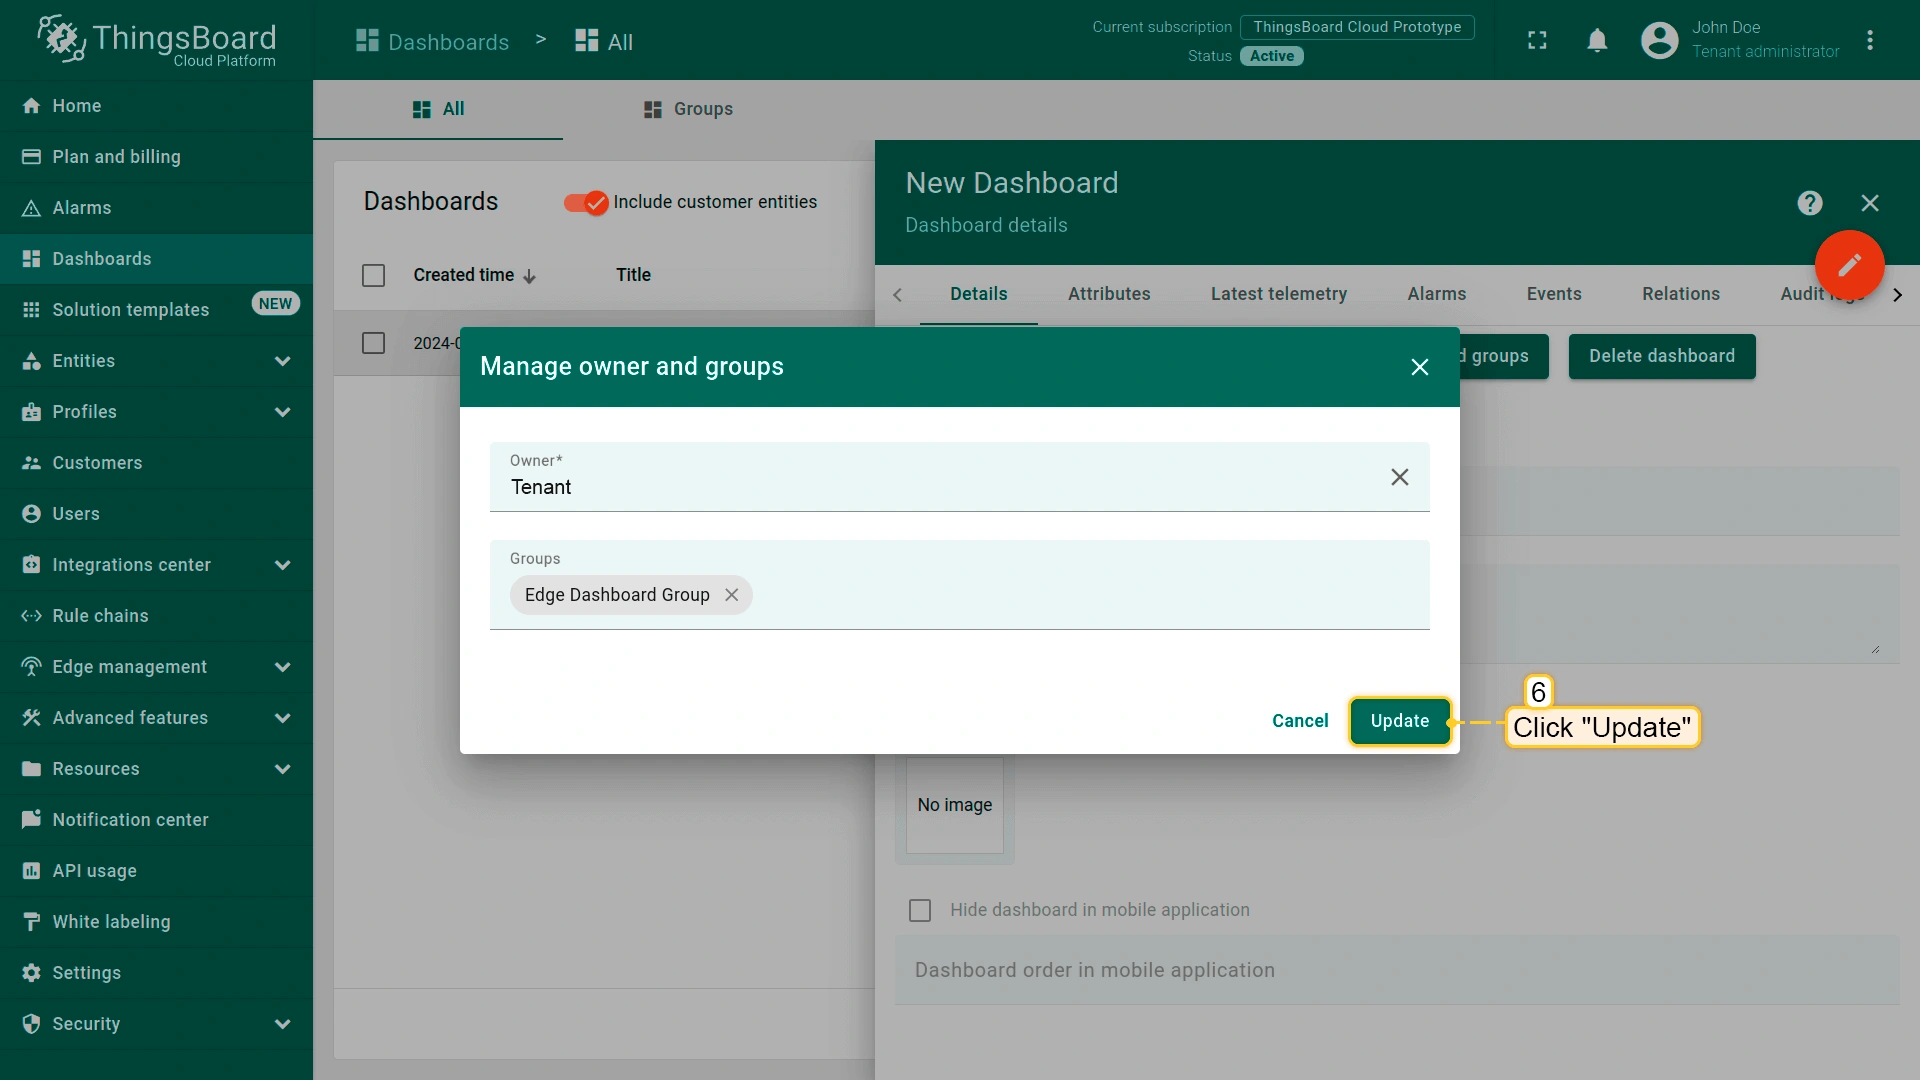
- The "Edge Dashboard Group" appears in the "Groups" field. Click the "Update" button.
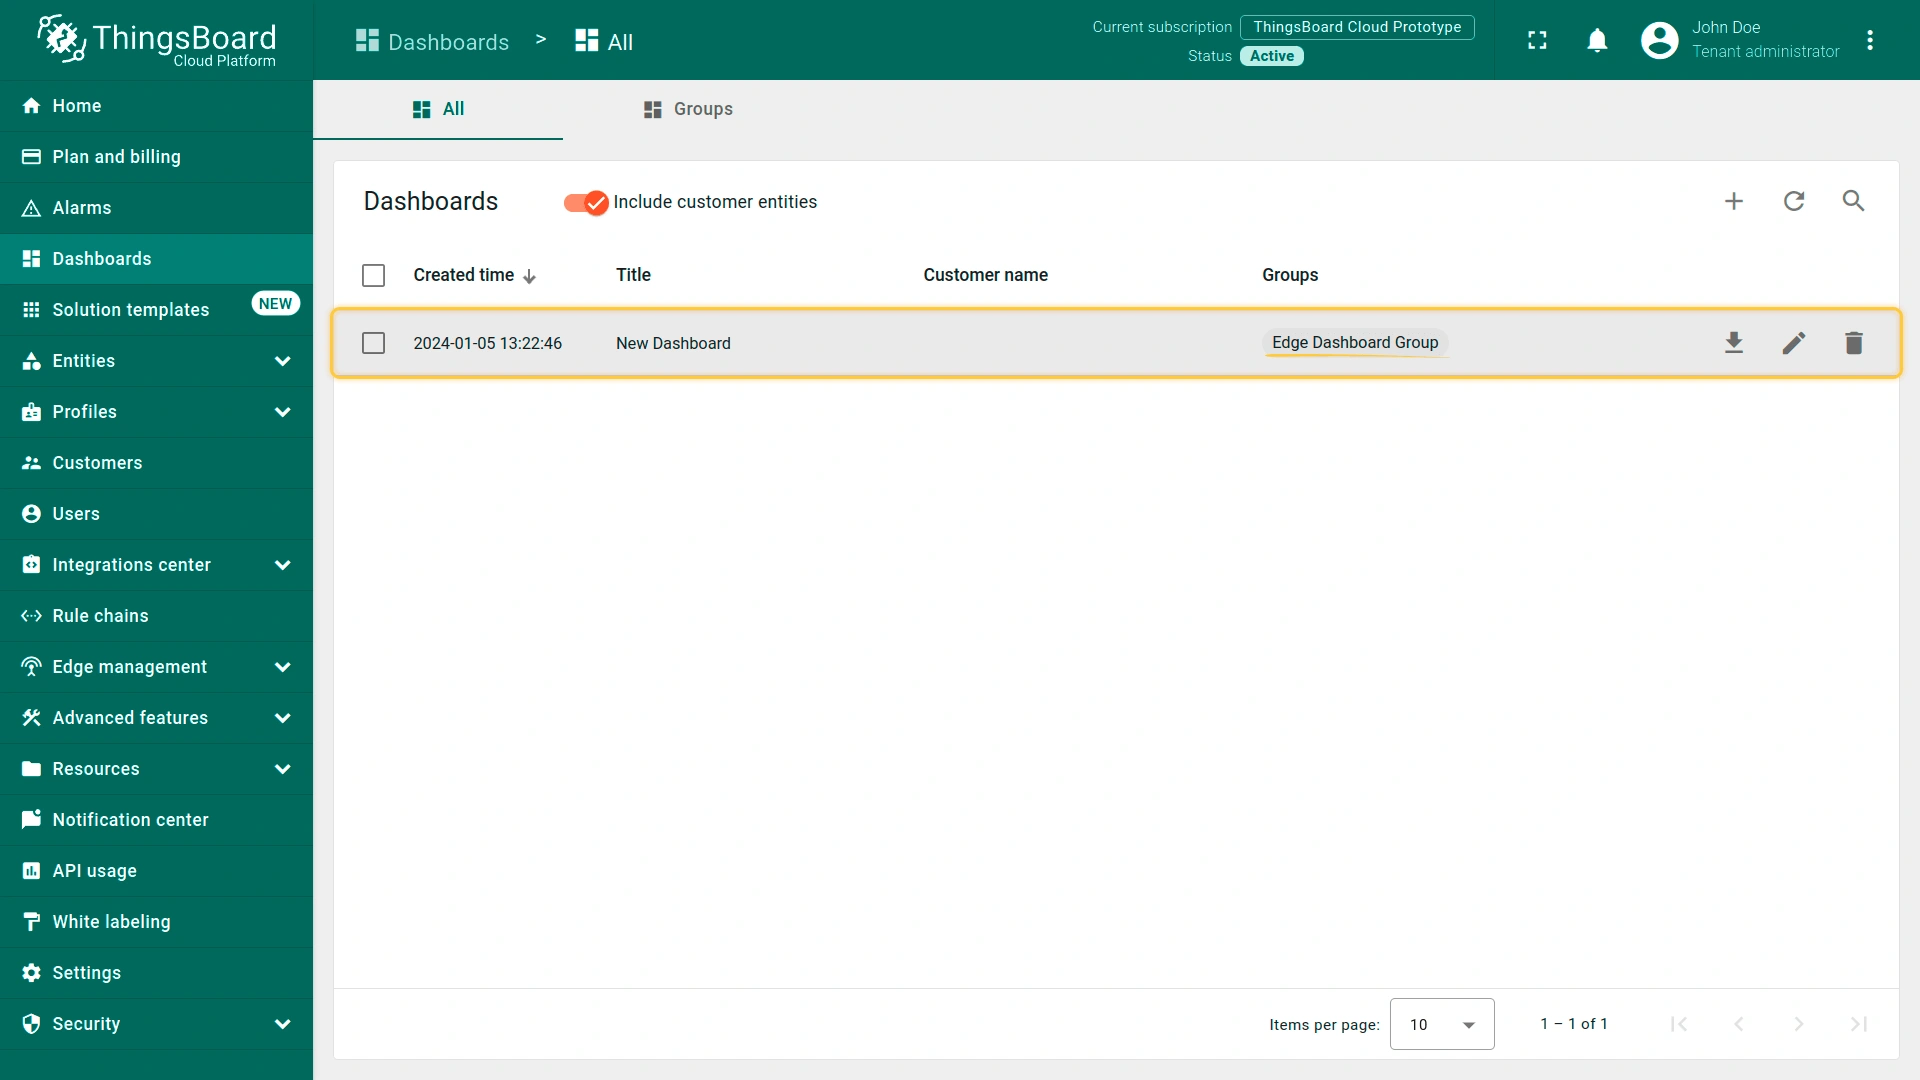
- The newly created group is now available in the "Groups" column.
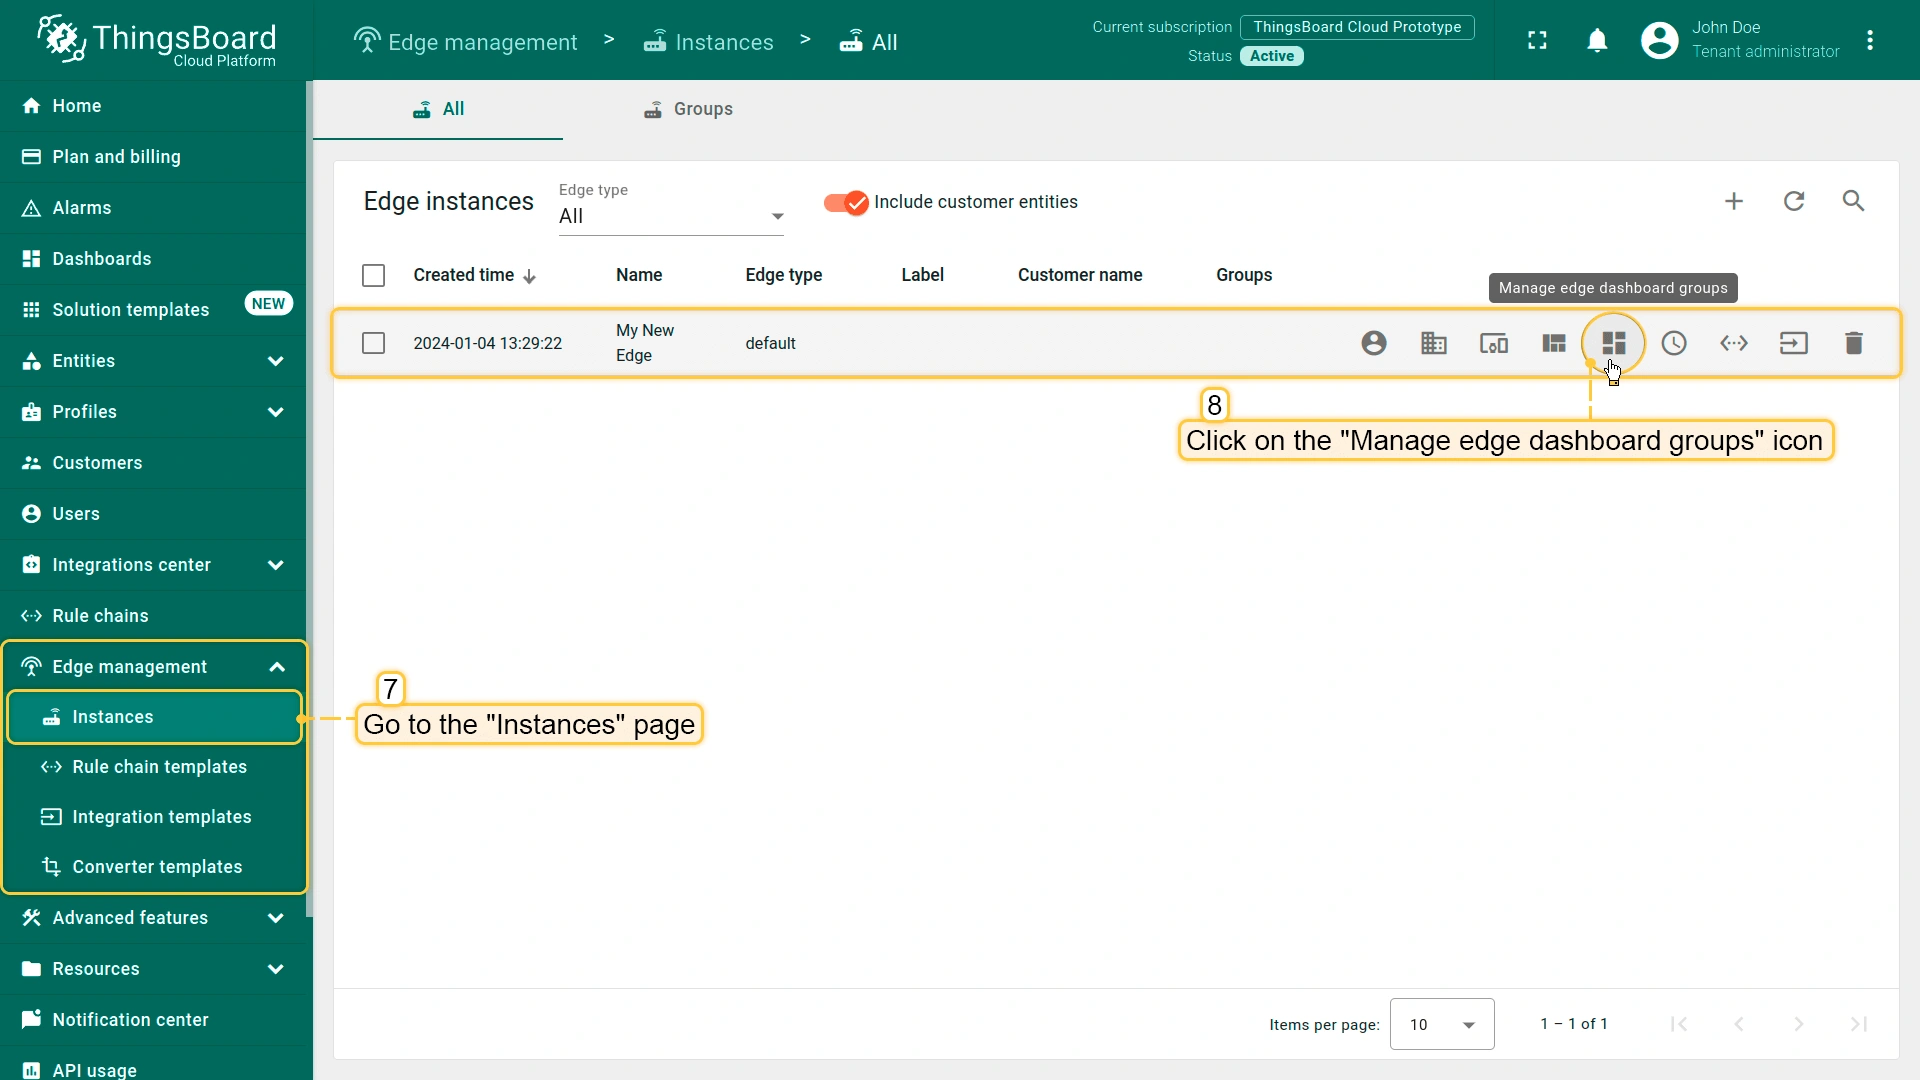
- Go to the Edge management > Instances section. Click the "Manage edge dashboard groups" icon of the instance in question.
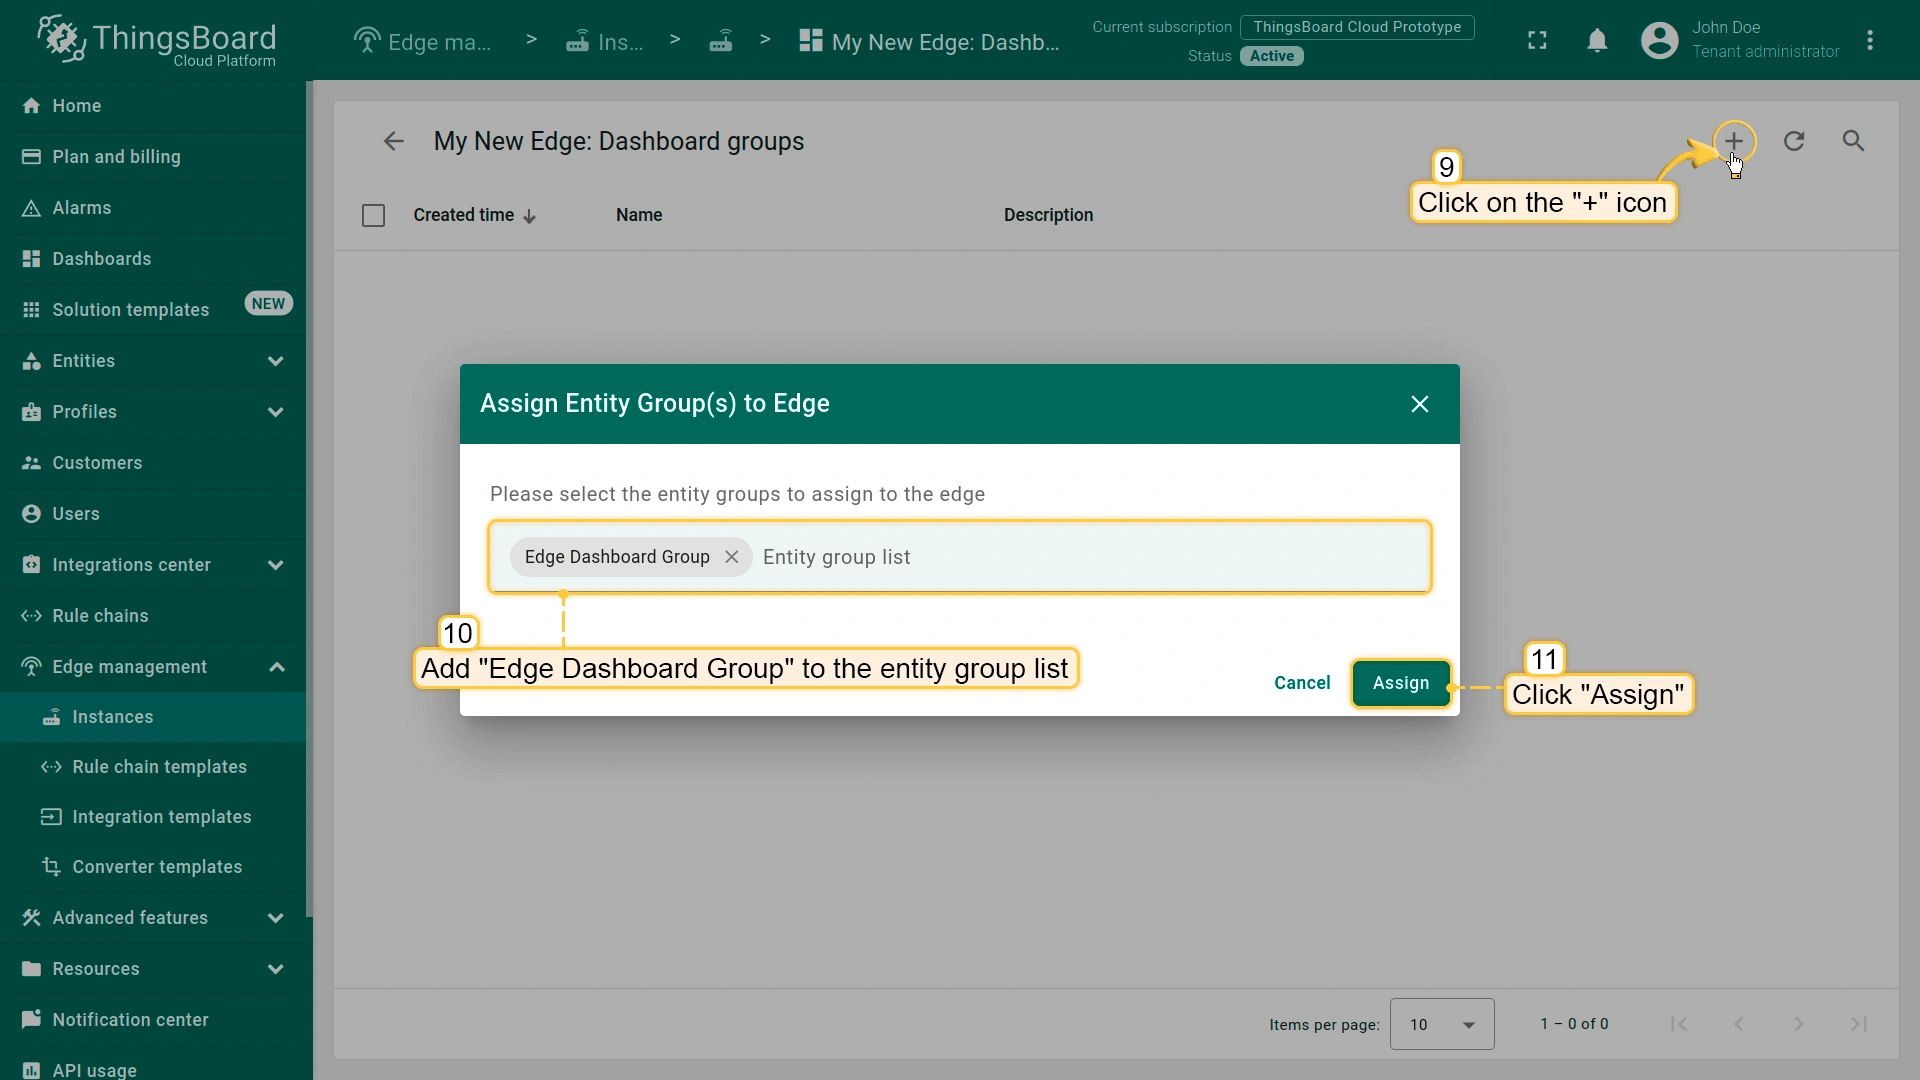
- On the Edge Dashboard Groups page, you will see all the dashboard groups that are already assigned to this Edge. To assign another dashboard group, click the "+" icon and select "Edge Dashboard Group" from the drop-down-menu. Click the "Assign" button.
要确认已分配实体在Edge上可用,请打开EDGE_URL并进入相应实体部分:
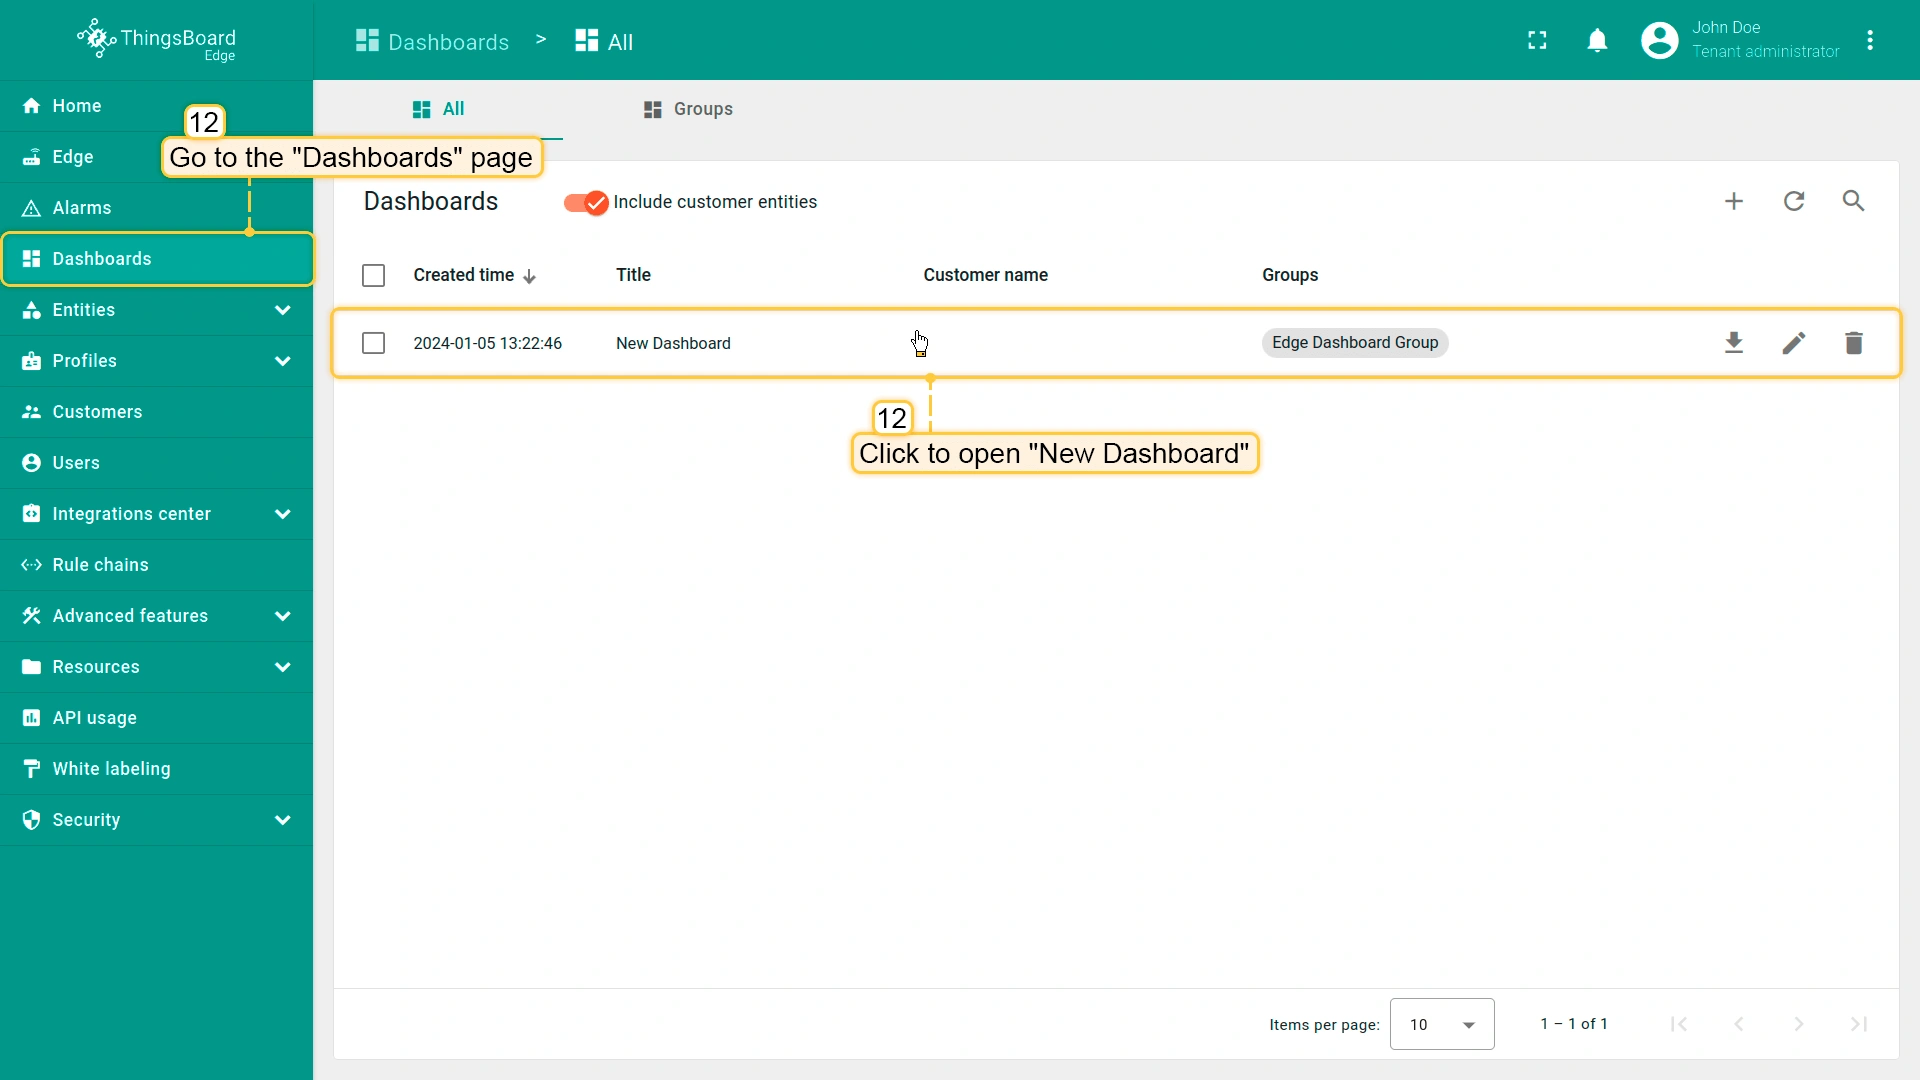
- Go to the Dashboards section and open the dashboard you have created on the ThingsBoard Professional Edition Server
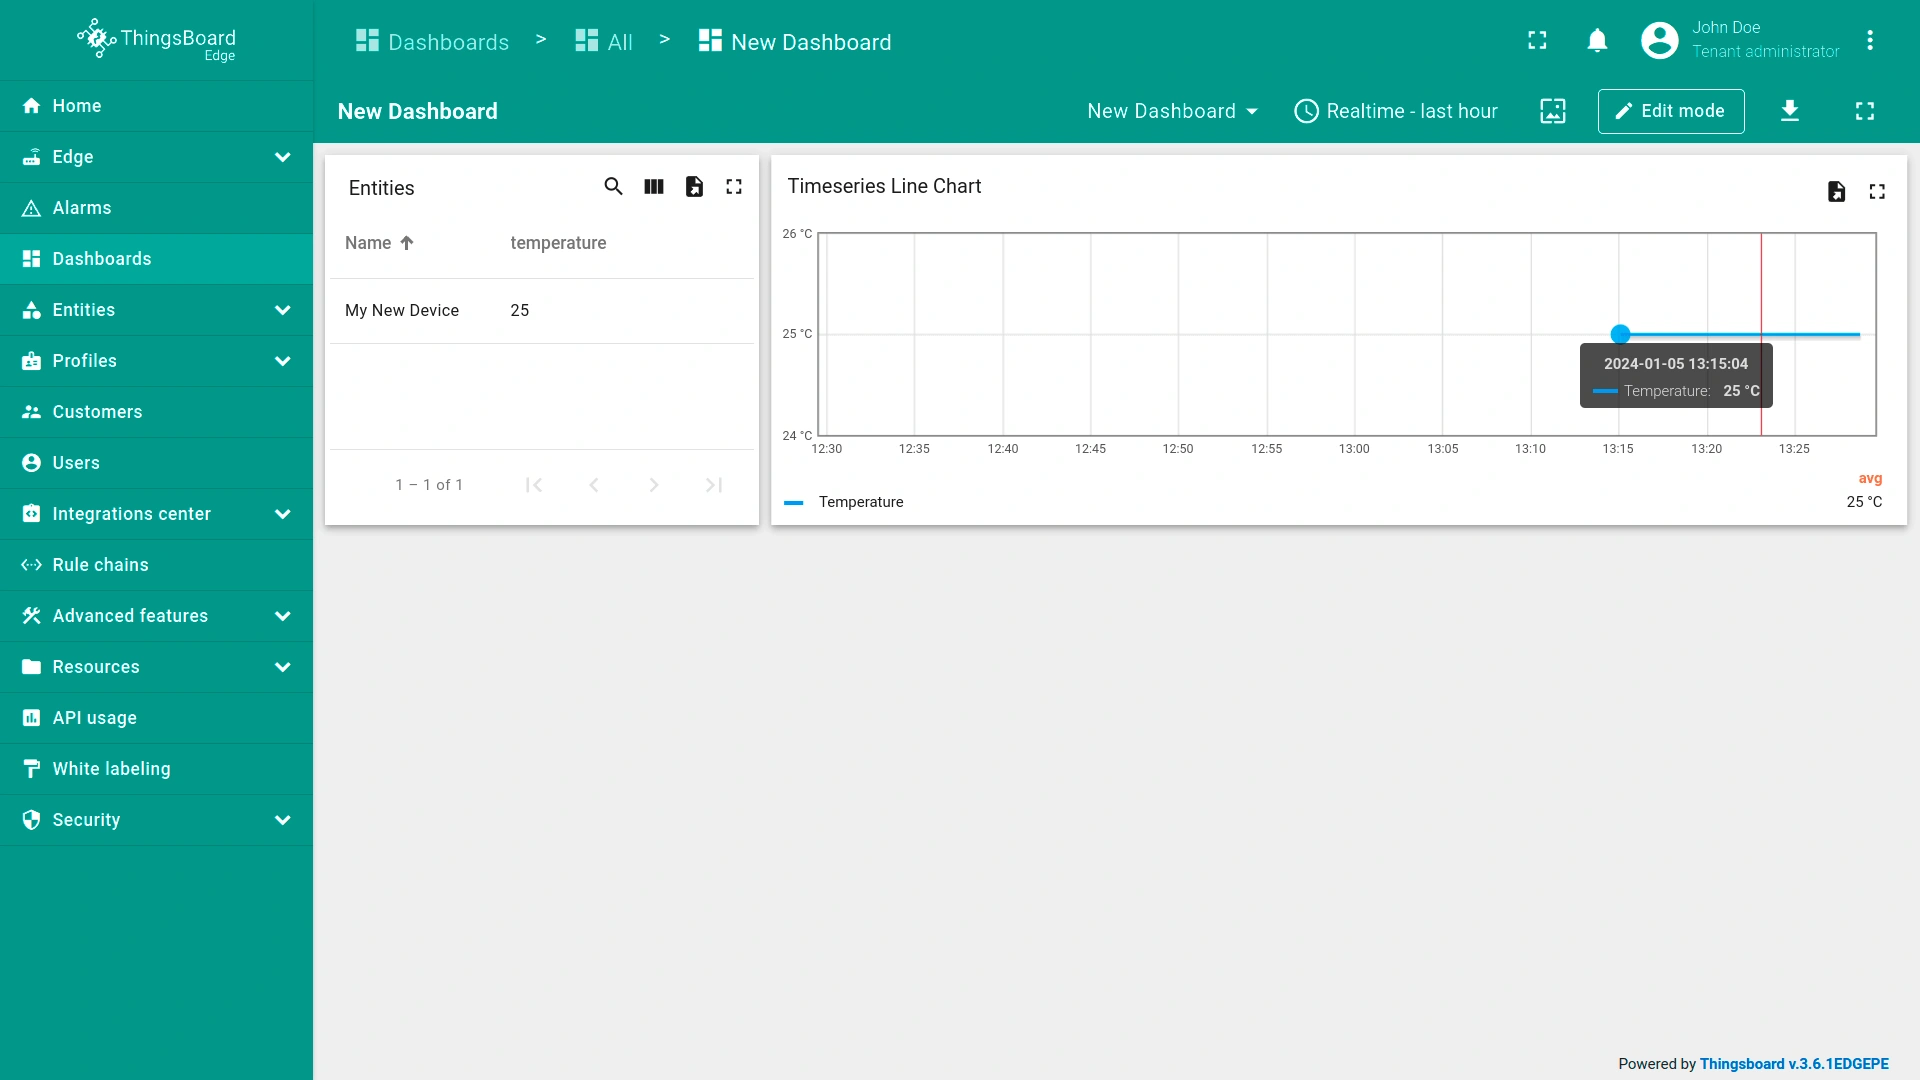
- Verify that these are the same widgets that you have added on the Cloud.
Your Feedback
Congratulations! You have successfully completed the initial configuration steps for ThingsBoard Edge. Now you can send new telemetry readings and they will appear on the dashboard immediately.
Help us improve by providing your feedback at GitHub/Issues or through the “Contact us” form. We would also greatly appreciate it if you could star our project on GitHub!
下一步
-
Installation guides(安装指南)- 了解如何在各种操作系统上安装 ThingsBoard Edge 并连接到 ThingsBoard Server。
-
Edge 规则引擎:
-
Rule Chain Templates(规则链模板)- 了解如何使用 ThingsBoard Edge 规则链模板。
-
Provision Rule Chains from cloud to edge(从云端向 Edge 下发规则链)- 了解如何从云端向 Edge 下发边缘规则链。
-
- 安全:
- gRPC over SSL/TLS - 了解如何为 Edge 与云端之间的通信配置 gRPC over SSL/TLS。
-
功能:
-
Edge Status(Edge 状态)- 了解 ThingsBoard Edge 上的 Edge Status 页面。
-
Cloud Events(云端事件)- 了解 ThingsBoard Edge 上的 Cloud Events 页面。
-
-
使用场景:
-
Manage alarms and RPC requests on edge devices(在边缘设备上管理告警和 RPC 请求)- 本指南展示如何在 Edge 上生成本地告警并向连接到 Edge 的设备发送 RPC 请求:
-
Data filtering and traffic reduce(数据过滤与流量削减)- 本指南展示如何从 Edge 向云端仅发送过滤后的设备数据:
-
- Roadmap(路线图)- ThingsBoard Edge 路线图。