Trendz 提供内置的时序预测能力,用户无需深厚的数据科学背景即可构建预测模型。数据筛选、归一化、模型训练等复杂步骤均在后台自动完成,从而简化使用流程。
在 Trendz 中可为任意数据字段(含字段计算)启用预测。时序预测有助于从数据中提取洞察,例如:
- 能源预测:估算下一季度或全年的能耗。
- 维护排程:预测最佳维护时间。
- 故障预测:预判下一次潜在系统故障。
- 制造洞察:预测关键制造 KPI 及其与当前系统状态的关系。
- 资源管理:计算资源(如油箱)耗尽前的剩余时间。
时间序列预测使企业能够根据数据中发现的未来趋势制定数据驱动的决策,优化运营,并主动应对挑战。
要访问预测模型工具,请点击标有”预测模型”的图标![]() ,位于工作区左侧。
,位于工作区左侧。
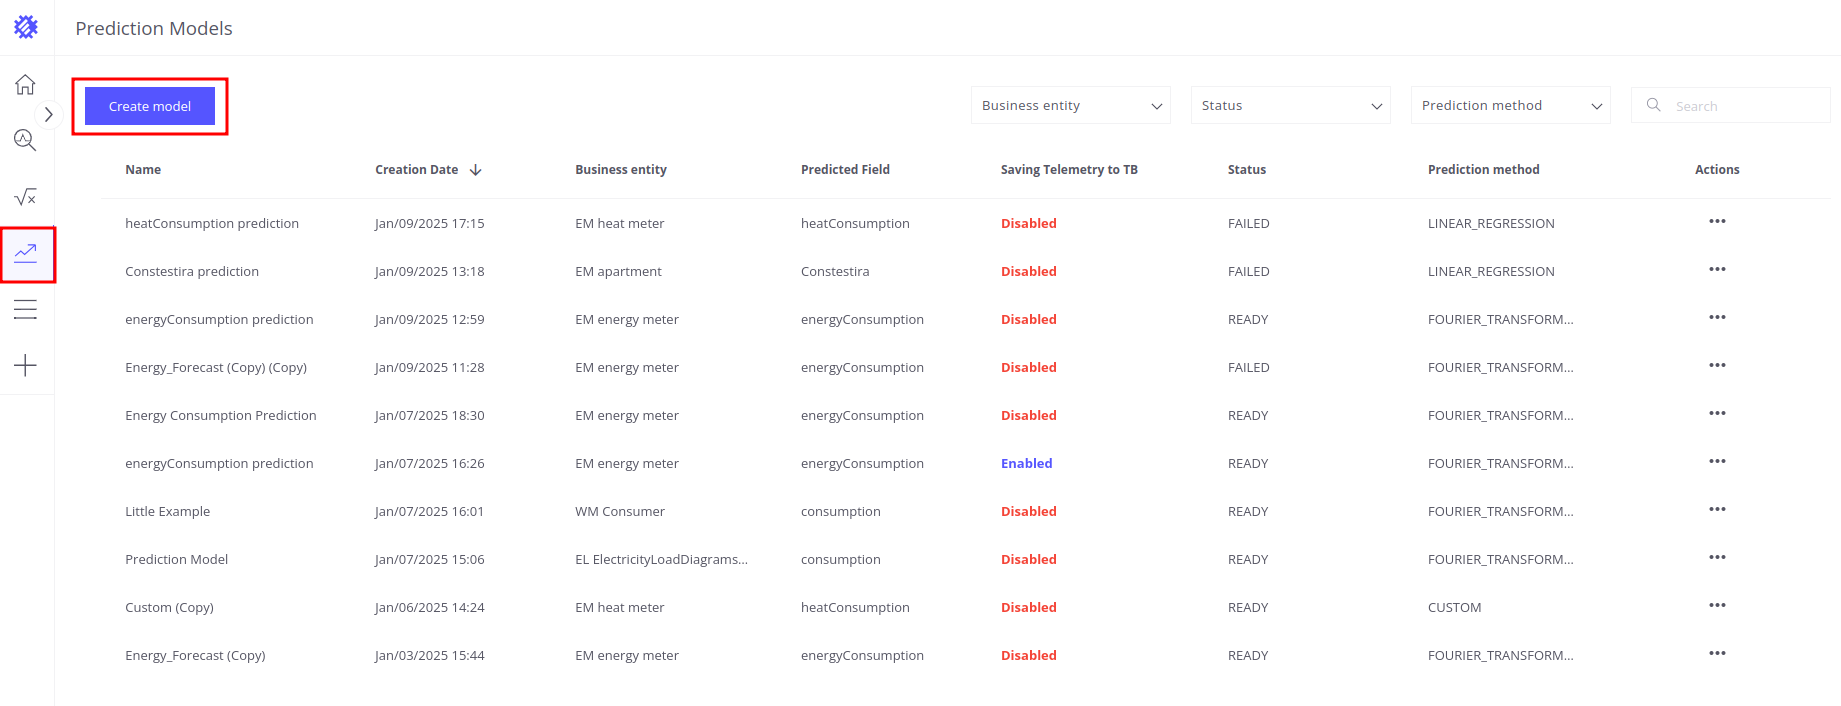
在此部分内,表格列出所有已创建的预测模型及关键详情。您可以打开、修改或对这些字段执行其他操作。要创建新的遥测预测,请单击”创建模型”按钮。
Input tab
The Input tab in Trendz prediction models is designed to configure all necessary settings for generating accurate forecasts. Below is a detailed explanation of each section and its settings:
General Settings
This section allows you to define the scope and parameters for the prediction model:
Entity: Select the entity for which the prediction will be performed. This determines the context of the forecast.
Predicted Field: Choose the specific field within the entity that you want to predict. For example, this could be energy consumption, temperature, or another measurable parameter.
Item: Select the specific item (e.g., a particular device or asset) within the entity to focus your analysis.
Key: The identifier under which the prediction telemetry data is saved in ThingsBoard with prefix EPD. For example if we set key as energy_forecast the telemetry will be saved in ThingsBoard under _EPD_energy_forecast key.
Timerange for Model Training: Define the historical data period that the model will use for training. For example, you can set a timerange of the past 3 months or 1 year, depending on the availability and relevance of data.
Prediction Range: Specify how far into the future the model should make predictions (e.g., 1, 10).
Prediction Unit: Select the unit of measurement for the prediction time range. For example: Hours, Days, Weeks, Month.
Prediction Method Settings
This section helps you define how the prediction is calculated:
- Prediction Method: Select the prediction method to use. Each method includes a short description to help you choose the most suitable approach for your use case. Trendz implements different multivariable and univariable ML models for timeseries prediction:
- Fourier Transformation - dissects a time series into its frequency components. Its power lies in discerning cyclic trends and seasonal patterns entrenched within the data, contributing to the efficacy of forecasting exercises.
- Prophet - a forecasting paradigm devised by Facebook, meticulously crafted to handle time series datasets accentuated by pronounced seasonal patterns and holiday impacts. This technique utilizes an additive framework to encapsulate trends, seasonality, and holiday-induced influences.
- Multivariable Prophet - evolves from the Prophet forecast model, enabling the simultaneous prediction of interconnected time series. This becomes particularly advantageous when dealing with numerous interconnected variables that warrant predictive insights.
- Arima - combines autoregressive and moving average aspects to anticipate upcoming values founded on historical observations. This approach adeptly accommodates trends and seasonal variations ingrained within the dataset.
- Linear Regression - a fundamental statistical method, comes into play to anticipate a dependent variable’s trajectory grounded in one or more independent variables. This technique establishes a linear connection between variables, forming the foundation for making forecasts.
- Custom Model - you can write our own multivariable time series prediction model using any Python libraries. In this case you provide a model source and Trendz is responsible for inserting input dataset from ThingsBoard and process forecasted output.
Segment Strategy: Trendz prediction models perform specific data preprocessing to align input telemetry data into the required format. This process includes filling gaps, aggregating data by a specified time unit, and applying aggregation functions.
A key preprocessing step involves dividing the data into segments - sets of data with equal time ranges that cover the entire time span of the source data. All input telemetry data is divided into a chronologically ordered set of segments, which are used iteratively for model fitting, prediction building, and calculating metrics such as accuracy.
Several strategies in Trendz define how data is segmented:
-
AUTO
This strategy performs an automatic analysis of the data to determine the optimal way to divide it. The segmentation steps are calculated dynamically. Use this strategy if you are unsure which one suits your task best.
-
FIXED
This strategy divides the input telemetry data sequentially, covering the training range from start to end. Each segment begins where the previous one ends, with no gaps or overlaps.
Example: if we have a 120-day range of the telemetry and 10-day segments we will receive 12 segments.
-
SLIDING_WINDOW_UNIT
This strategy divides telemetry data sequentially but allows overlapping segments. The overlap is determined by a user-defined step size, specified in time units and quantities.
Example: if we can have a 120-day range of the telemetry, 10-day segments, and a 5-day step will make segments divided into 60 segments and each segment will be overlapped by two neighboring ones (except the first and the last ones).
-
SLIDING_WINDOW_PERCENT
Similar to SLIDING_WINDOW_UNIT, but the step size is defined as a percentage of the segment size.
Example: if we have a 30-day range of the telemetry, the 20% step of the 10-day segment will make a 2-day step will make segments divided into 15 segments and each segment will be overlapped by several neighboring ones (from 5 to 10 segments).
-
STICK_TO_END
This strategy divides data into segments sequentially, like FIXED, but it focuses on a specific number of segments from the end of the training range. Only the data required to form the specified number of segments at the end of the training range will be used for model training. Any excess data from the training range beyond what is needed for the segments will be excluded from the model training process.
Example: if we can have a 120-day range of the telemetry, 10-day segments, and select 5 segments we will have segments from the 70’s day to 120’s day without gaps and overlapping.
Include Last Unfinished Segment: For each segment strategy, you have the option to enable the inclusion of the last unfinished segment. When Trendz divides the input telemetry into a set of segments, some data is not enough to fit the segment because the segment’s time range is bigger than the remaining data time range. This binary property tells Trendz whether to use the remaining telemetry to create partially filled segments.
For example, we have the telemetry with a range of 20 days, a prediction range of 10 days, and the “Sliding Windows Unit” strategy with a 1-day step. It means Trendz will create the first 11 segments as usual: (1-10), (2-11), (3-12), …, (11-20). But if we continue this process each next segment will not have 10 days, it would decrease by 1 day for each step: (12-20), (13-20),…, (19-20). These segments can be not appropriate for your case because of overfitting on the same data without newer ones. Setting the boolean property manages the behavior of Trendz in this case - you can allow or forbid usage of this kind of segment.
Aggregation Settings
These settings are used to preprocess data before applying the prediction model:
Aggregation: Select the data aggregation method, which determines how the input data is summarized. Common aggregation methods include: AVG, SUM, LATEST, MIN, MAX, COUNT, UNIQ, etc.
Grouping interval: Define the time interval for grouping data during aggregation. For example: hour, day, week, month.
This ensures that the data fed into the model is organized and meaningful for prediction.
Advanced Settings
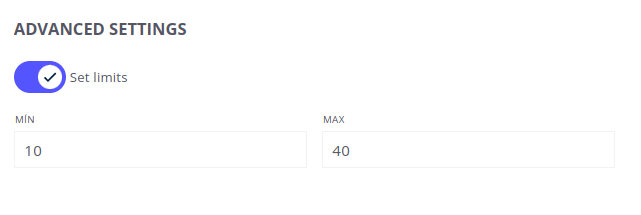
In the Advanced Settings of the prediction model configuration, you can define limits for predicted telemetry values. To enable this feature and instruct the model to restrict predictions within specific bounds, follow these steps:
- Enable Set limits in the advanced settings.
- Enter the minimum and maximum values for the telemetry to define the prediction boundaries.
Example: Suppose you are creating a prediction model to estimate water temperature telemetry values. To ensure the predicted values remain within realistic bounds, such as 0°C to 100°C, you can configure limits in the Advanced Settings. Enable the Set Limits option, then set the MIN field to 0 and the MAX field to 100. This configuration ensures that all predicted telemetry values will be restricted to the range of 0°C to 100°C.
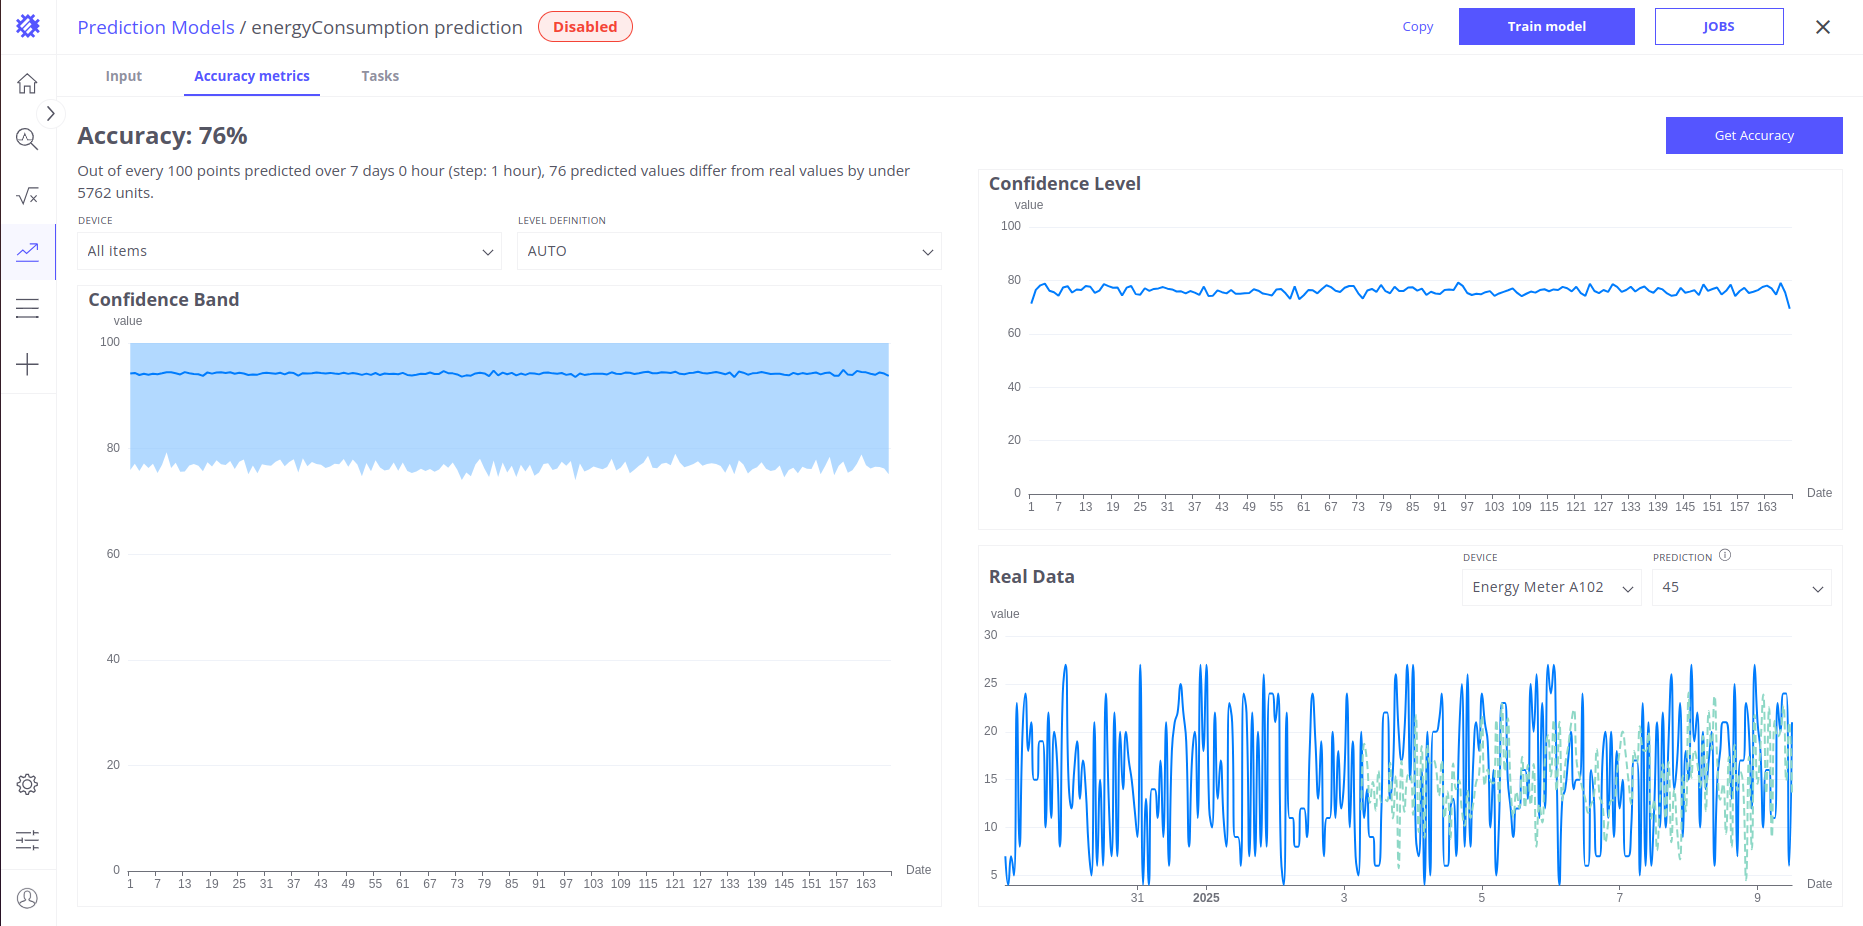
Accuracy Tab
With Trendz Analytics, you can not only generate predictions for a specific period but also validate the accuracy of those predictions. The Accuracy Metrics tab provides valuable insights into the performance of your prediction models using the following metrics:
- Real Data
- Confidence Band
- Confidence Level
Accuracy Summary and Configuration
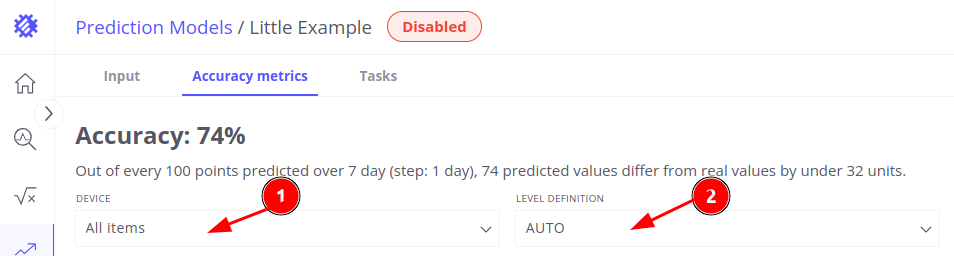
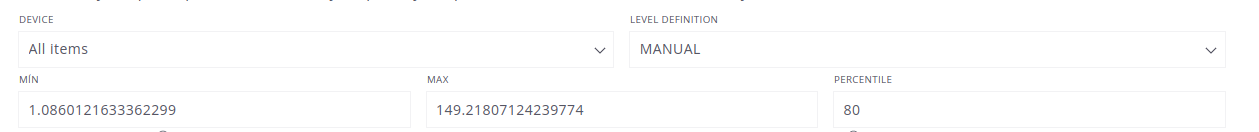
Before calculating accuracy, it is essential to configure the necessary parameters to ensure the results are meaningful. To calculate the accuracy of your prediction model, you must specify the following:
- Select the device(s) for which the system will evaluate prediction accuracy.
- Choose how the system should determine accuracy thresholds: AUTO - system automatically analyzes your prediction data and fills the required fields for optimal accuracy calculation. MANUAL - you manually provide the necessary data for the accuracy calculation (below is a detailed explanation of each metric and its parameters.).
By carefully configuring these settings, you can tailor Trendz prediction models to generate precise and actionable forecasts based on your specific requirements. Once you’ve filled in the required inputs, click on the Get Accuracy button. The system will calculate the accuracy for your prediction model based on the selected parameters.
Accuracy Summary section provides an overall evaluation of the prediction model’s performance, expressed as a percentage, and explains how closely the predicted telemetry values align with the actual values.
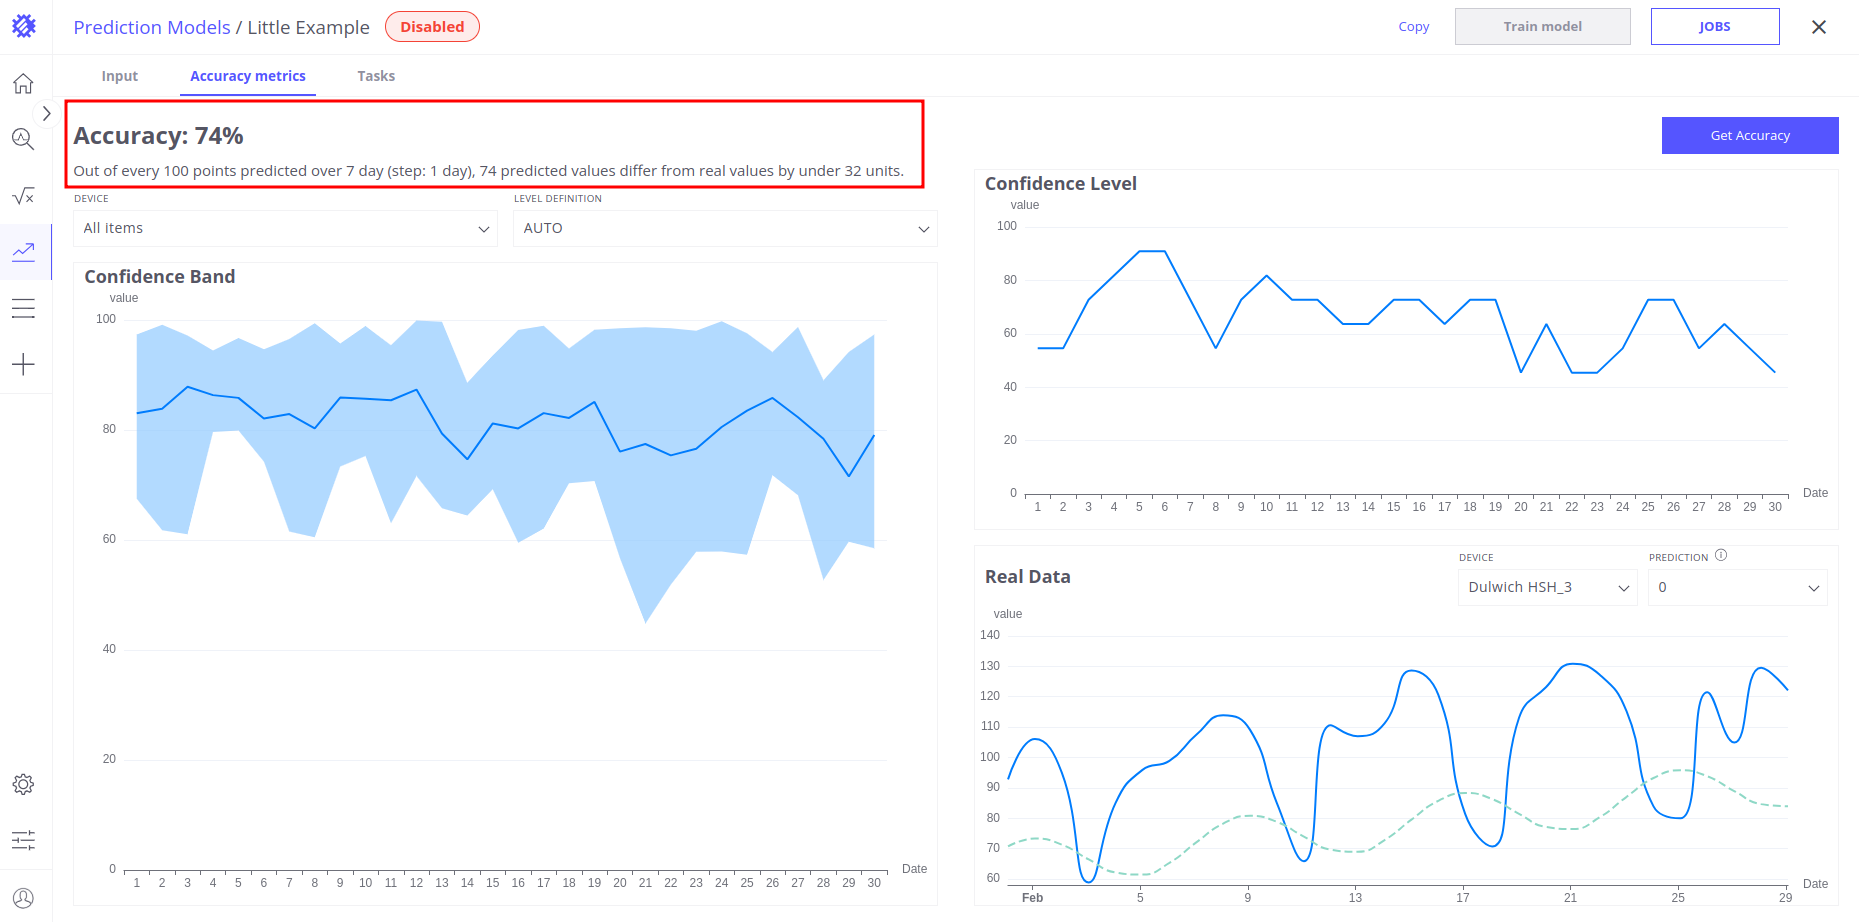
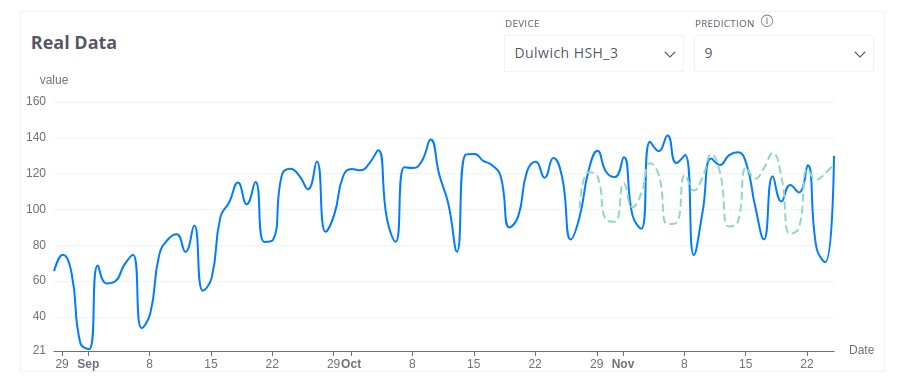
Real Data
This chart displays the prediction data for a specific segment (selected via a drop-down list) alongside the corresponding original historical telemetry.
Parameters:
- Device Name: Specify the name of the device of interest.
- Segment Number: Choose the segment number to display its data.
Confidence Level
This chart shows the prediction’s accuracy as a binary feature. The result is marked as “true” if the distance between expected and actual values (in terms of both value and time) is within the thresholds defined in the configuration. Otherwise, the result is “false.” Accuracy is calculated per time unit for each segment and aggregated across the entire segment. The chart displays the average of these binary results.
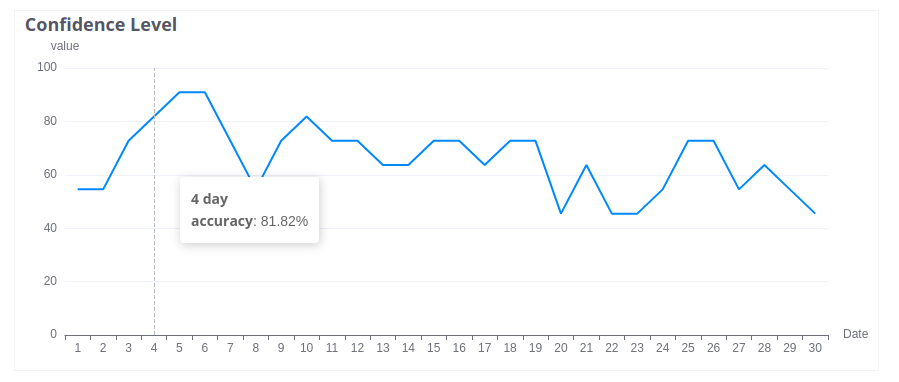
Parameters
- Acceptable Value Error: The maximum allowable difference in values.
- Acceptable Time Error: The maximum allowable time difference.

Let’s consider the example – you have a device, a Fuel Gauge, that measures telemetry such as the Remaining Fuel Level in liters (L). You want to predict the remaining fuel level in a tank for the next 14 days. From business prospective it is totally fine if the actual value is within ±20 L from the predicted value. Also, it is fine if forecasted value is delayed in time for 2 hours. You can specify the Acceptable Value Error as 20 (L) and the Acceptable Time Error as 2 (hours) according to the mentioned features of your case. For example, if we have predicted value of 80 L and an actual reading of 84 L on the same day, the value distance is 4 L, which is less than the specified 20 L, prediction marked as correct. If you have today’s predicted value of 80 L and today’s actual value of 105 L, but after 1 hour actual value is 80 L, prediction also would be marked as valid.
Confidence Band
This chart illustrates the prediction’s accuracy by comparing the expected and actual telemetry values. The accuracy is calculated as the percentage difference (error function) between these values, measured per time unit within each segment. The min, max, and accuracy (average) values displayed on the chart are aggregated across all segments in the training range. These aggregated values represent the accuracy for the selected percentile of “correct” values, filtering out less useful data.
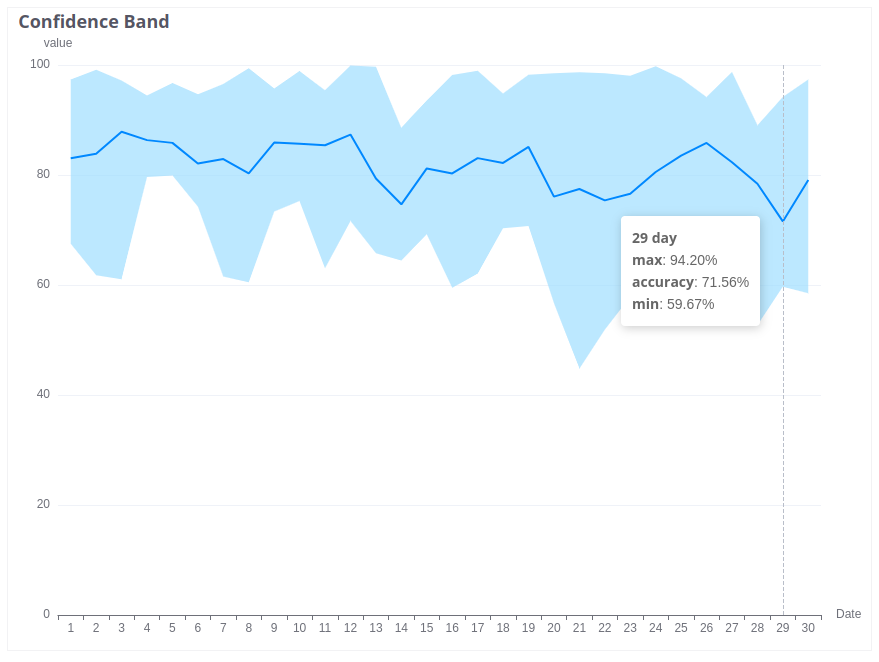
Parameters:
- MIN: The minimum acceptable value.
- MAX: The maximum acceptable value.
- PERCENTILE: The percentile of best values to consider.
Let’s consider the example - imagine you have a device called an Energy Meter that measures how much energy is used, in units called kilowatt-hours (kWh). Now, we know some basic facts about energy consumption: First, energy consumption can never be less than 0 kWh. It’s impossible to have negative energy usage. So, the minimum value (MIN) is set to 0. Second, your system has a maximum limit of 50 kWh. If the consumption goes above this, the system will break. This means the maximum value (MAX) is set to 50. With these two limits, the range of possible energy consumption is from 0 to 50 kWh. This range helps us calculate accuracy when there’s a difference between the energy we expect the system to use and the energy it actually measures. Here’s how it works: The full range of 50 kWh (from 0 to 50) represents 100% of the possible error. Any difference between the expected and actual value is compared to this full range. For example, let’s say the expected energy usage is 25 kWh, but the actual measured value is 30 kWh. The difference between these two is 5 kWh. To figure out how much of the full range this difference represents, you divide the difference (5 kWh) by the full range (50 kWh): Error percentage = 5kWh / 50kWh = 10%. The accuracy is then the remaining percentage: Accuracy = 100% − 10% = 90%. So in this example, the device measured energy with 90% accuracy because the difference between the expected and actual values was small (only 10% of the total range). This approach helps you clearly understand and measure how accurate the system is.
Tasks Tab
The Tasks tab provides an overview of all tasks initiated for a specific model, including their status (completed, in progress, or pending). For more detailed task management information, refer to the corresponding section in the documentation.
Example: Forecasting Energy Consumption for a Building
In this example, we’ll create a forecast to predict how much energy a building will consume over the next 3 month. The dataset includes Buildings, Apartments, and energy meters installed in each Apartment. The process involves aggregating telemetry from sensors at the building level and then generating a forecast using Trendz prediction models.
Model Training
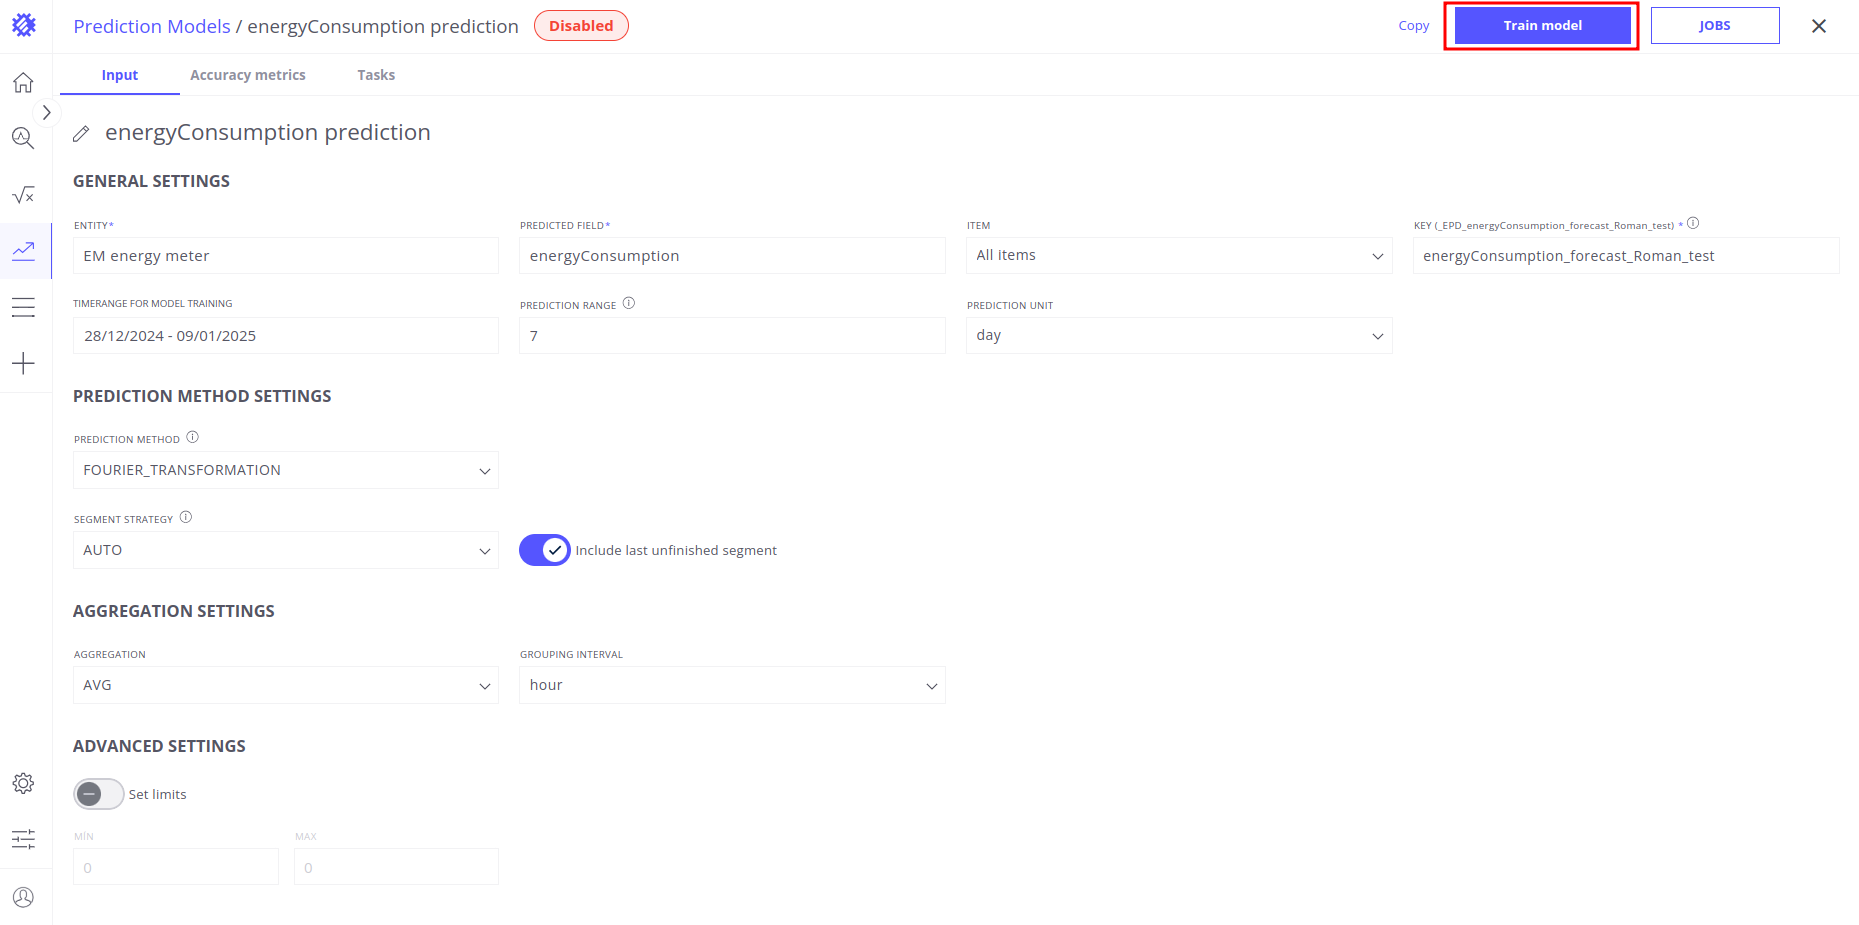
- Input Tab Configuration
- Entity: Select Energy meter as the entity for prediction.
- Predicted Field: Choose energyConsumption as the field to forecast.
- Item: Select the specific building for which the forecast will be made (e.g., Energy Meter H101).
- Key (EPD): Assign a unique key, such as the Energy_Meter_H101, to ensure data integrity.
- Timerange for Model Training: Set the historical data range, for example, Last Years, to train the model with sufficient past data.
- Prediction Range: Set the prediction range to 3.
- Prediction Unit: Select month as the unit of prediction.
- Prediction Method Settings
- Prediction Method: Select FOURIER_TRANSFORMATION as the prediction method.
- Segment Strategy: Select AUTO as the segment strategy.
- Aggregation Settings
- Aggregation: Choose AVG to aggregate the energy consumption data.
- Grouping Interval: Set the grouping interval to DAY to ensure data is aggregated daily.
After configuring all the settings:
- Name model energyConsumption prediction.
- Click the Train Model button located in the upper-right corner of the screen. This action will automatically save your model configuration and start the training process.
- Once the training is complete, navigate to the Accuracy tab. Here, you can evaluate the model’s performance and accuracy metrics to determine whether it meets your requirements for further use.
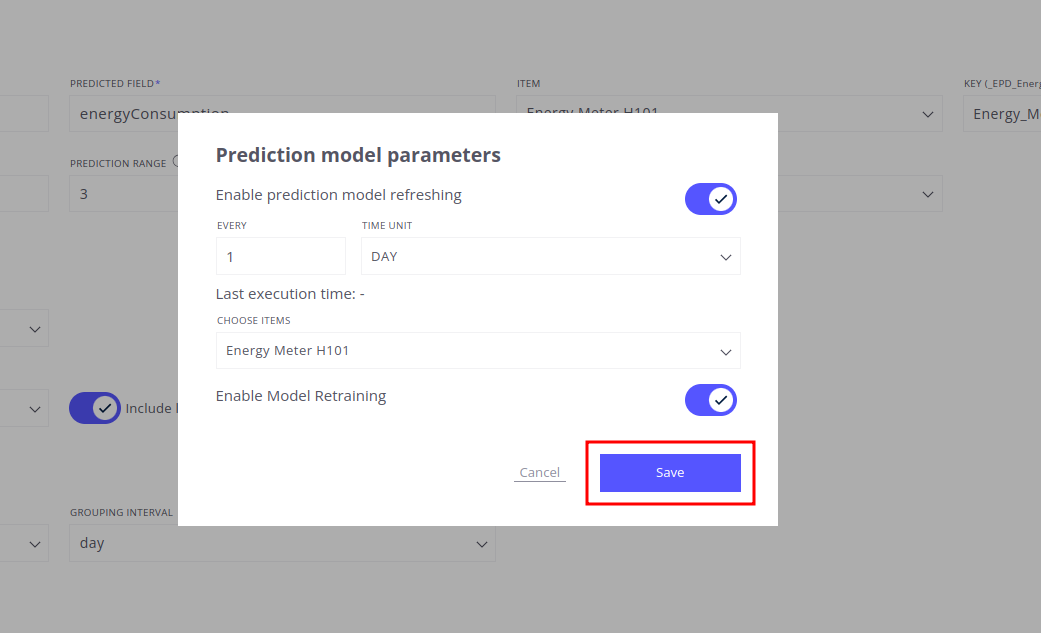
Saving telemetry to ThingsBoard
- If the accuracy is satisfactory, and you want to use this prediction as new telemetry, you need to record it as telemetry in ThingsBoard. To do this:
- Activate the JOBS button in the upper-right corner of the screen.
- Configure the following settings:
- Enable the Enable prediction model refreshing option.
- Set the interval to: EVERY 1 TIME UNIT DAY.
- Choose items (e.g., Energy Meter H101).
- Enable the Enable Model Retraining option to ensure the model retrains automatically.
- Save the configuration
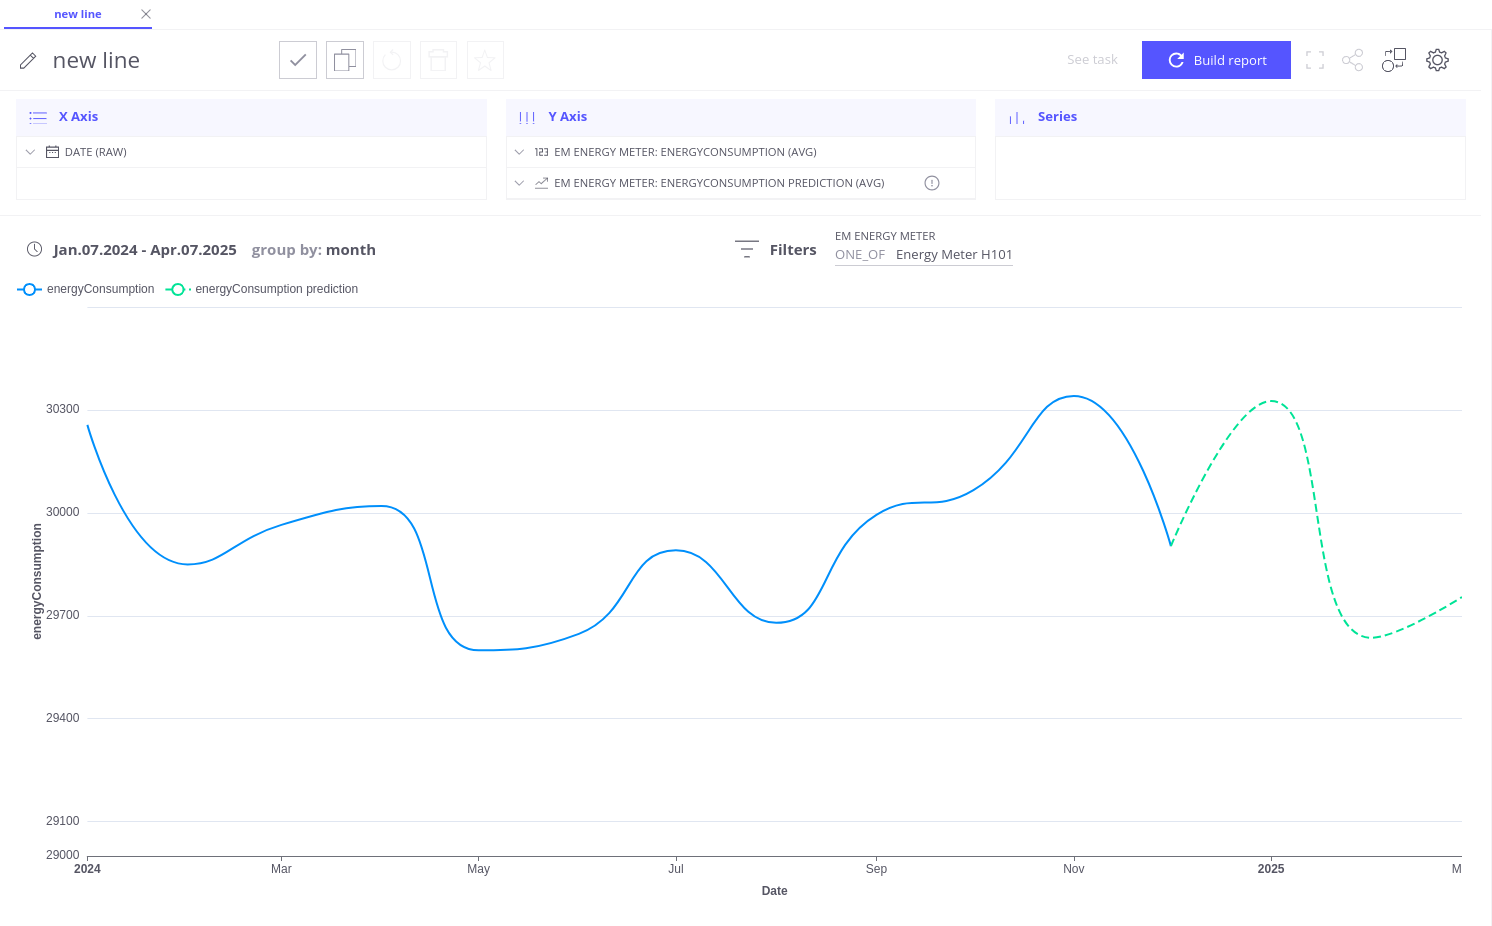
Visualizing the Forecast telemetry: Creating a Line Chart
- Proceed to the View Fields section. Here, you can visually analyze the forecast for the selected time range and explore how the predicted values align with historical data.
- Add Date (RAW) as the X-axis to represent the timeline.
- Add energyConsumption telemetry as the Y-axis to visualize energy usage.
- Add energyConsumption prediction telemetry as the Y-axis to visualize forecast usage.
- Add energy meter field to Filter section and select Energy Meter H101.
- Choose time range 07/01/2024 - 07/04/2025 in date picker.
- Click Build report button and check how our forecast looks like.
下一步
-
快速入门指南 - 快速了解 Trendz 主要功能。
-
安装指南 - 学习在各种操作系统上部署 Trendz。
-
指标探索器 - 学习使用 Trendz Metric Explorer 探索和创建指标。
-
异常检测 - 学习识别数据中的异常。
-
字段计算 - 了解字段计算及使用方法。
-
状态 - 学习基于原始遥测定义和分析资产状态。
-
筛选器 - 学习在分析中筛选数据集。
-
可用可视化部件 - 了解 Trendz 中可用的可视化部件及配置方法。
-
分享与嵌入可视化 - 学习将 Trendz 可视化添加到 ThingsBoard 仪表盘或第三方网页。
-
AI 助手 - 学习使用 Trendz AI 功能。