视频教程
简单表格
此模式下,仅需将字段拖放到 Columns 区域,每个字段对应表格一列。 可排序、过滤行、调整列顺序等。
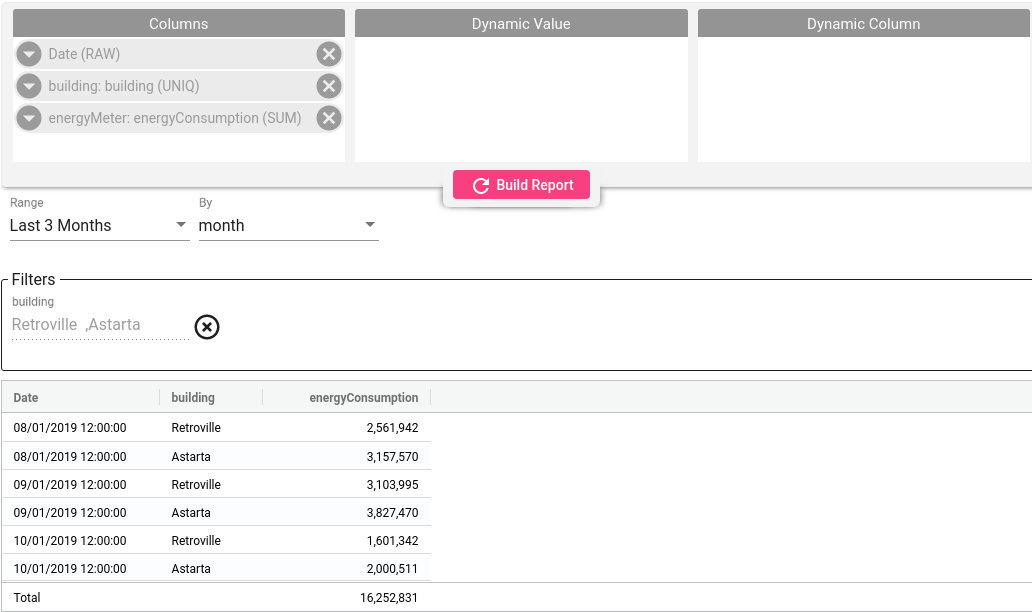
遥测字段聚合:
- 若列中无 Date 字段——Trendz 对整个时间范围应用聚合函数。
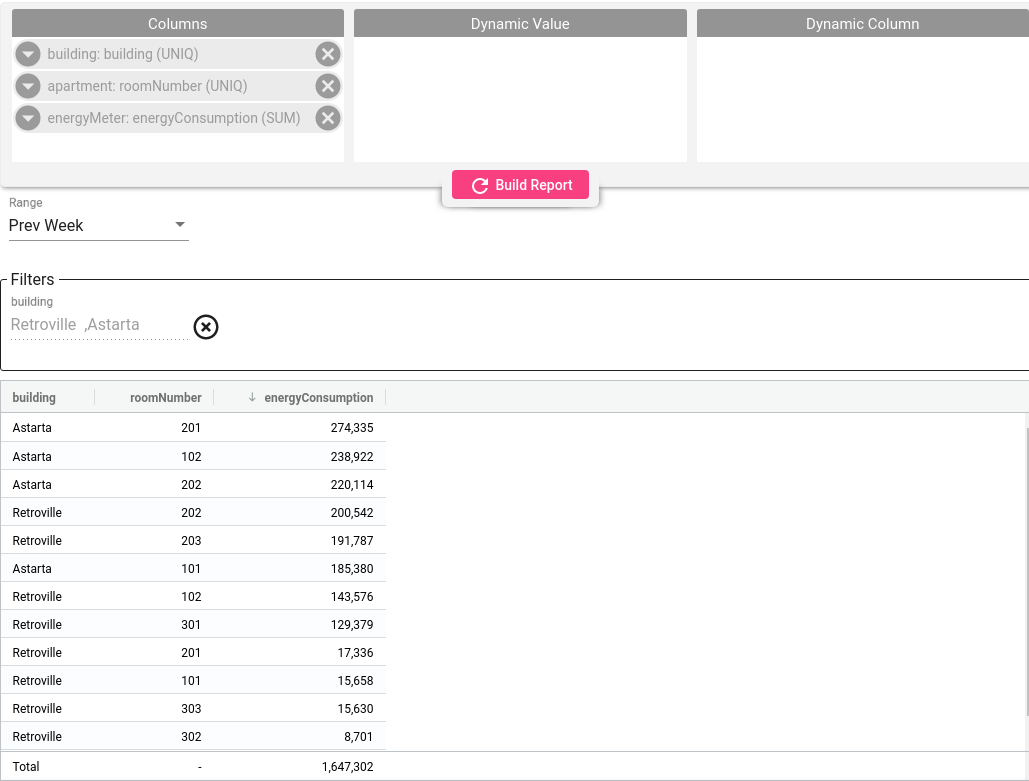
- 若列中有 Date 字段——系统将时间范围拆分为多个时间段,分别对每个时间段应用聚合。
动态列表格
此表格变体可将遥测聚合作为额外列显示,而非单独行。 操作:将telemetry字段加入Dynamic Value区域,将Date字段加入Dynamic Column区域并设置日期分组。
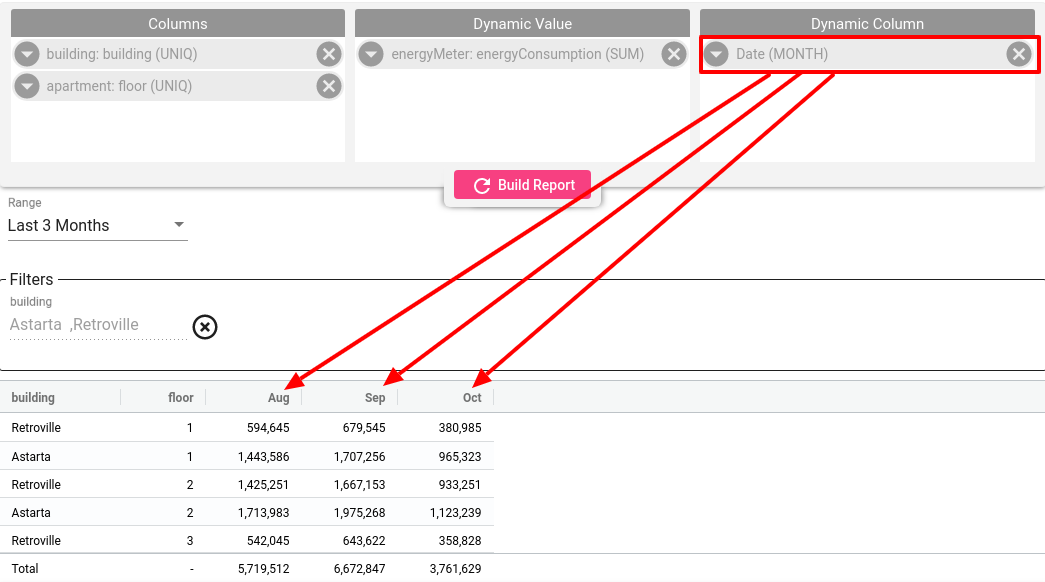
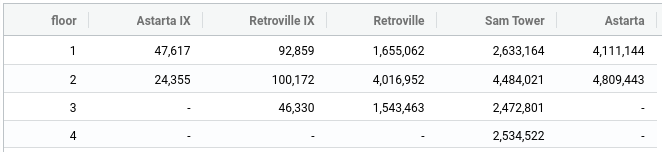
可将任意字段(date/attribute)加入Dynamic Column区域构建所需表格。例如:每栋建筑的能耗作为一列,楼层作为行。
注意:使用Dynamic Columns时,Dynamic Value和Dynamic Column区域仅允许一个字段。 若任一区域添加了多个字段,表格将为空。但Columns区域仍可添加多个字段。
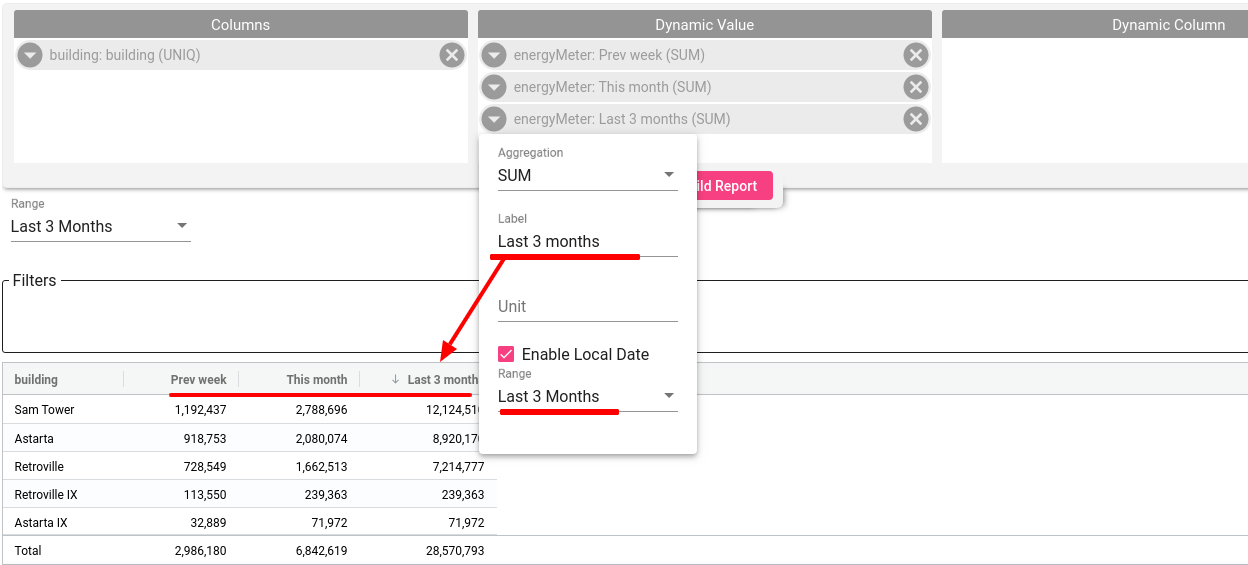
列独立时间范围表格
有时为看到更大图景,需要对比同一实体在不同时间范围的数据,例如:今日、昨日和过去一个月的能耗。 此时将遥测字段加入 Dynamic Value 区域,为字段启用并选择 local date,Dynamic Column 区域留空。注意可将同一遥测字段多次添加并设置不同的 local date。
默认排序
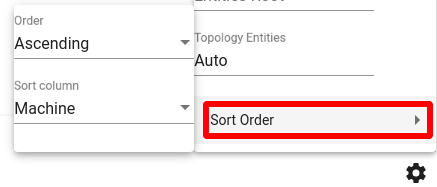
为快速区分原始数据,可在构建表格时配置列排序。
设置列排序:
- 进入设置区域;
- 选择列并应用排序方式:降序或升序。
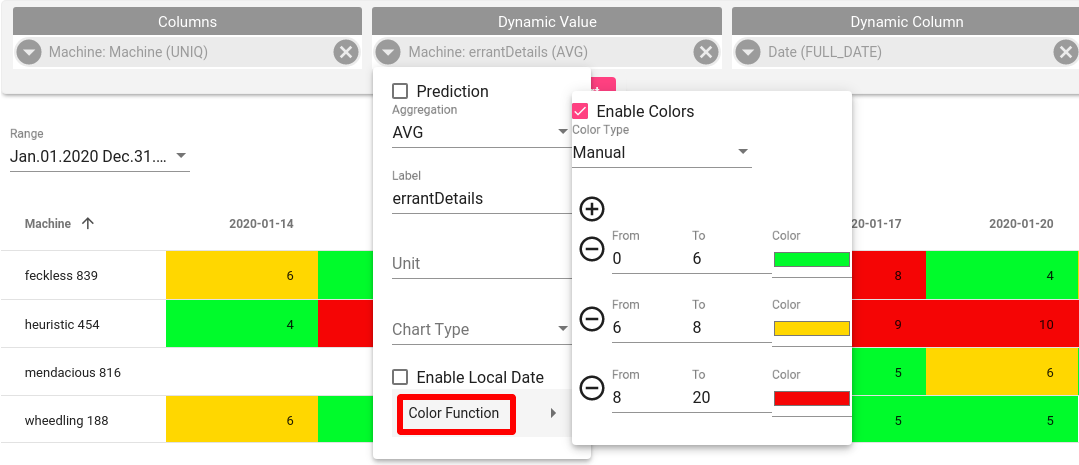
单元格颜色
使用颜色规则根据单元格值着色。
在所选遥测的卡片上激活 Color function,选择颜色类型:Auto 或 Manual,可创建多个自定义颜色范围。
- 选择要着色的字段;
- 打开 Color Function 菜单;
- 启用 Colors;
- 选择颜色类型:Auto 或 Manual。
Trendz 支持两种颜色规则:
- Auto Color Rule——自动将数据范围划分为四个等级并相应着色。
- Manual Color Rule——对指定取值范围应用特定颜色。
合计行
当字段聚合类型为 SUM 或 COUNT 时,表格底部显示合计行。 此时系统会对每列所有单元格求和并显示合计值。
行点击操作
Trendz 表格视图支持 onRowClick 操作。可配置嵌入 ThingsBoard 仪表板后用户点击表格行时的行为,例如将实体保存到仪表板状态别名或打开新的仪表板状态。
启用行点击事件:
- 在 ThingsBoard 仪表板上添加 Trendz 表格视图;
- 打开部件编辑模式,切换到操作选项卡;
- 点击添加操作按钮;
- 在操作来源中选择 On row click;
- 按标准部件操作配置。
每行可能包含来自一个或多个设备或资产的多个字段,即一行可与多个实体关联。 若使用 onRowClick 操作,需定义点击行时选中的实体。
- 在 Trendz 视图编辑模式下打开视图设置;
- 打开 View Mode fields 区域;
- 在 Row click entity 下拉中选择所需设备或资产类型;
- 保存更改。