IoT平台
开源平台
专业平台
软件即服务
产品生态
边缘计算
连接传统协议
开源IoT移动应用
IoT移动应用
MQTT代理服务
数据分析与预测
IoT方案开发
支持套餐
ThingsBoard培训课程
能源监测与能效
室内外环境分析
提升效率与资源优化
用水分析与防作弊
食品储存与安全监测
远程土壤与设备监测
车队追踪与管理
智能辅助生活方案
表计数据采集与分析
多传感器监测AQI
土壤湿度与灌溉控制
实时废弃物管理
储罐位置与液位监测
SCADA
实时控制工业流程
控制钻井作业
监测与控制能源系统
高级IoT平台
平台即服务
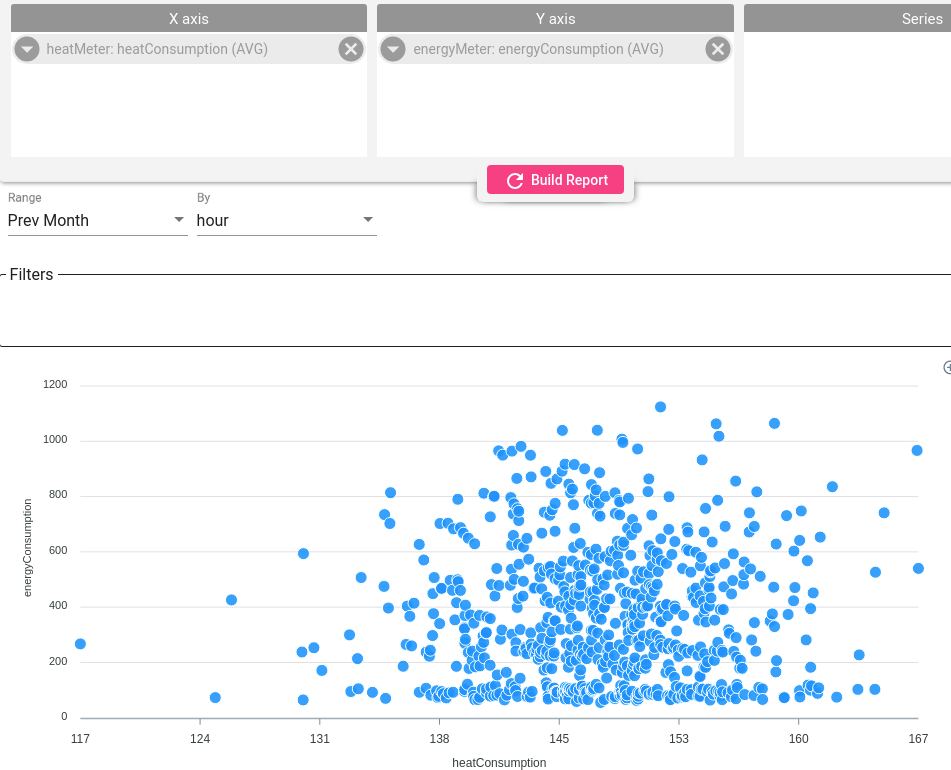
散点图展示拓扑中若干属性之间的依赖关系。
此情况下仅使用 X 轴 和 Y 轴 区域,将感兴趣字段拖入即可。
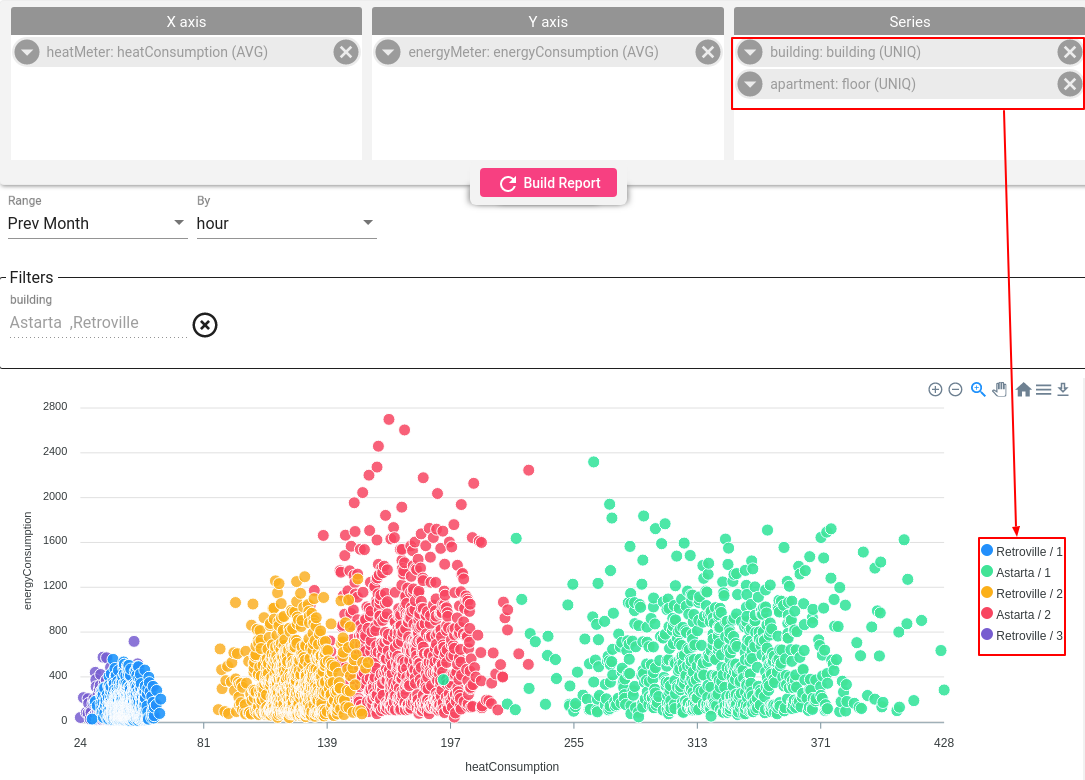
当需要比较超过 2 个维度时,可按多个字段对测量分组,并为每组应用不同颜色。 示例:同一数据集上比较热能与能耗,但按每栋建筑每层着色。 结果显示 Retroville 一层和三层最节能,Astarta 一层效率较低。