本指南说明如何准备用于可视化的数据集。
在数据分析中,定义大数据集的聚合方式是常见任务。
该任务可分为两阶段:定义分析过程中使用的分组,以及定义各分组的聚合函数。
在继续之前,需先了解 Trendz 如何解析数据:
Trendz 如何解析不同业务实体的字段
假设有一个智能楼宇方案:拓扑中包含楼栋(Buildings)、公寓(Apartments)和各类表计(Meters),通过关系相互连接。拓扑结构示意如下:

Trendz 将此类拓扑当作一张扁平表处理,表中包含该拓扑内所有设备/资产的属性与遥测列。实体间的关系用于关联不同业务实体的字段。
示例说明:仅使用该拓扑中的 2 个字段时:
- 属于 Building 资产的
building name - 属于 Energy Meter 设备的
energy遥测 - 聚合类型
SUM - 时间范围:上月
Trendz 会在ThingsBoard中查找所有楼栋,再查每栋楼下的公寓,最后得到属于各公寓的 Energy Meter。然后对每栋楼下的所有 Energy Meter 加载上月 energy 遥测并求和,从而得到每栋楼的总能耗。
以上并非精确算法描述,实际有大量后台优化。但足以理解 Trendz 内部处理的复杂度,使您专注于分析而非数据获取。
按时间分组
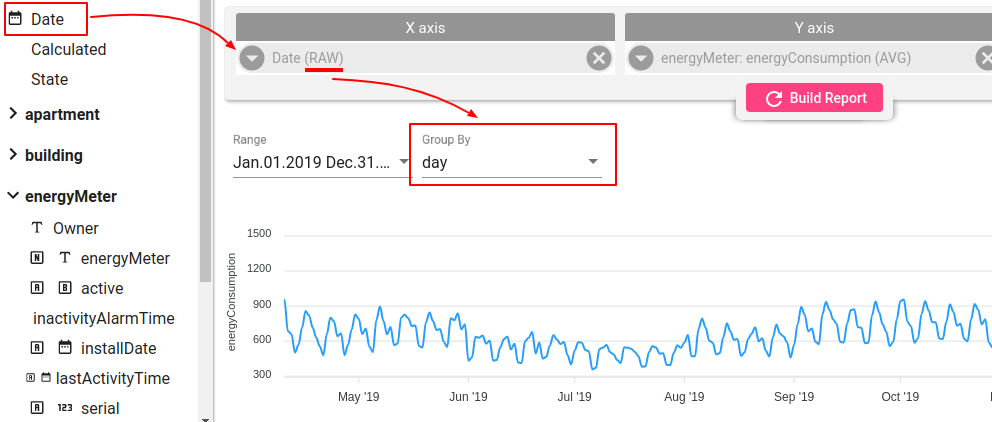
多数情况下数据按时间间隔分组(小时、天、周、月等)。请从左侧面板将日期字段拖放到X轴区域。
日期聚合的默认函数为原始值:用户可通过时间范围选择器旁的分组依据下拉框控制聚合间隔。系统会取时间范围选择器的整段区间,按所选间隔拆成更小区间,再对每个区间应用所选聚合函数。分组依据可选值为:
- 月(Month)
- 周(Week)
- 天(Day)
- 小时(Hour)
- 分钟(Minute)
选择其他日期聚合选项可更精细地控制时间区间:
- 原始值(RAW)
- 分钟(MINUTE)
- 小时(HOUR)
- 完整小时(FULL_HOUR) - ‘2020-03-01 23’
- 星期几(DAY) - 星期几
- 日期(DATE) - 当月日期
- 完整日期(FULL_DATE) - ‘2020-03-01’
- 周开始(START_OF_WEEK) - 2020-03-01
- 年内周数(WEEK_OF_YEAR) - 年内周数
- 月内周数(WEEK_OF_MONTH) - 月内周数
- 月(MONTH)
- 季度(QUARTER)
- 年(YEAR)
- 年月(YEARMONTH) - ‘2020-Feb’
定义分析分组
本步用于定义希望在何种逻辑层级上查看数据。在能源计量场景中,可按城市、区域、楼栋、公寓或具体表计等不同层级分析。Trendz会实时自动完成分组,无需事先显式定义聚合规则或预计算各层级数值。
本例中仅添加两个字段:楼栋名称和能耗,无需在规则引擎中配置聚合规则。Trendz会根据各楼栋下注册的能耗计自动将表计按楼栋分组。
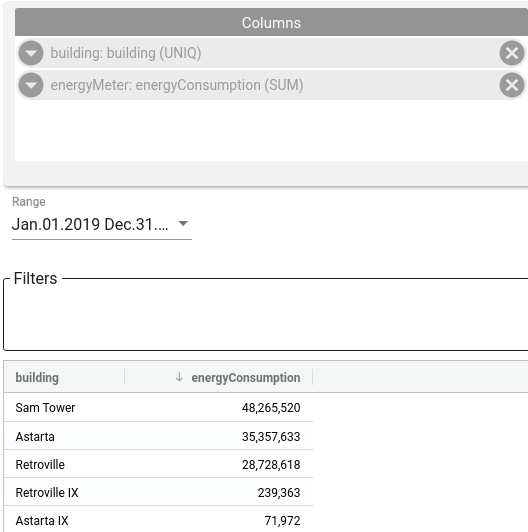
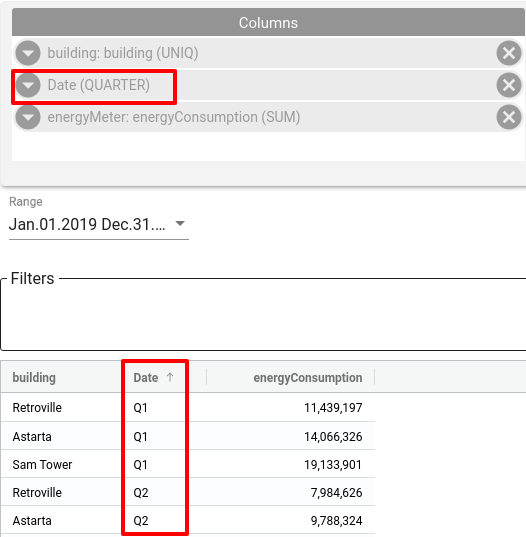
可看到去年总能耗。若按季度分组,可添加日期字段并选择季度类型:
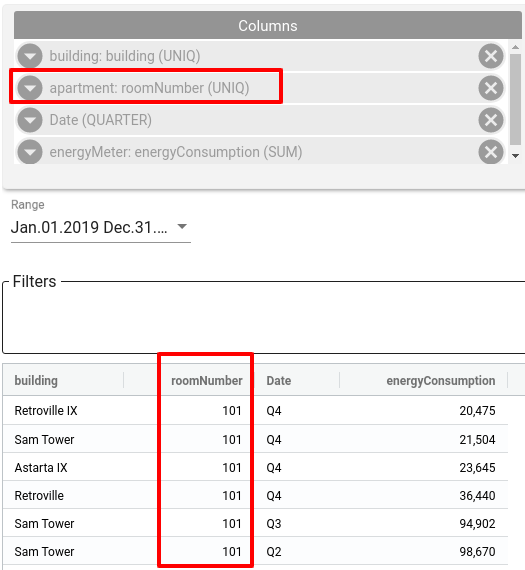
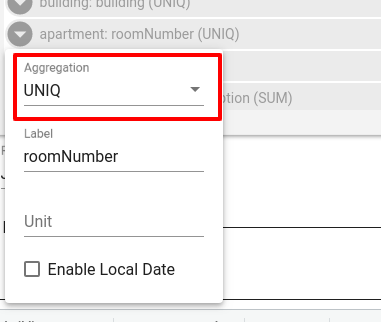
若要按房间号查看总能耗,可从公寓业务实体添加房间号属性:
遥测与分组聚合
下一步是定义数据的聚合方式。支持的聚合类型包括:
- AVG
- SUM
- MIN
- MAX
- LATEST
- COUNT
- UNIQ
- DELTA - 特殊用法见后文
修改聚合类型:点击字段并选择所需类型即可。
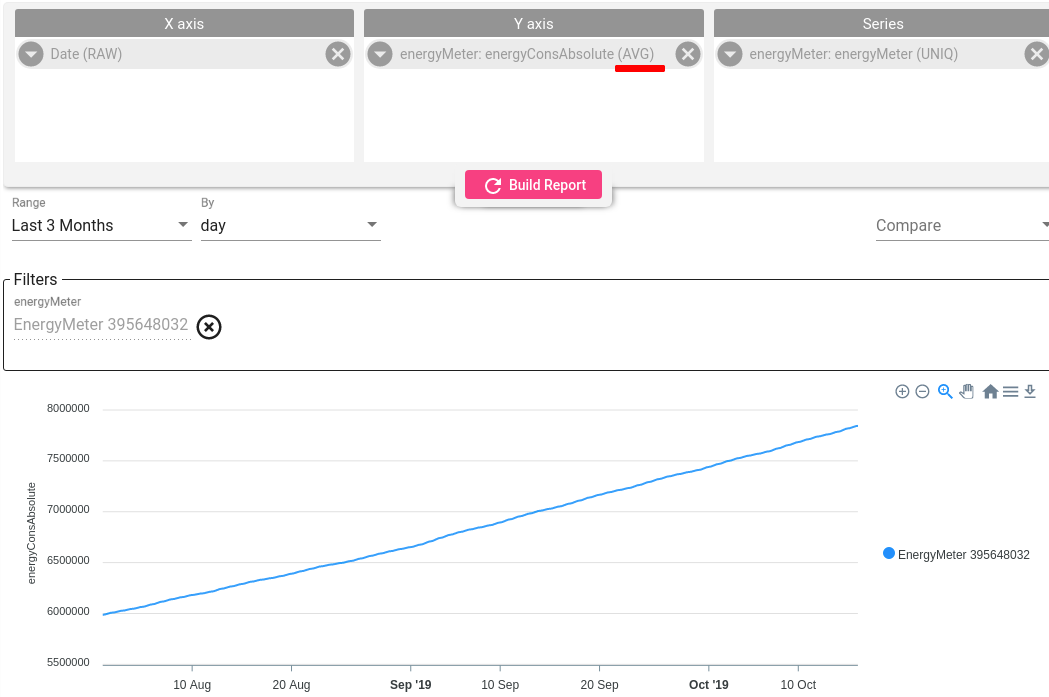
脉冲输出遥测的处理
水表是典型的脉冲输出设备:遥测值单调递增,分析时需转换为增量。此类遥测的示例图表如下:
对该字段应用 DELTA 聚合后的效果如下:
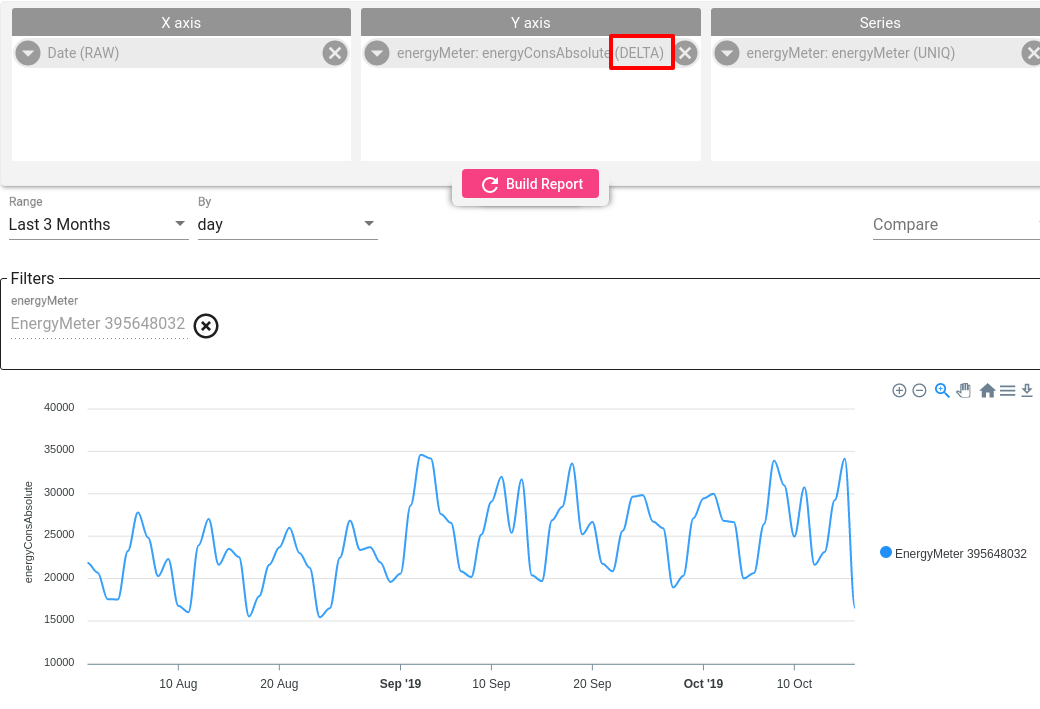
Trendz 会按设定时间范围和粒度自动计算该字段的增量。对多台设备使用 DELTA 时,Trendz 会在聚合组上再应用 SUM,从而得到不同层级(城市、楼栋等)的总消耗。
下一步
-
快速入门指南 - 快速了解 Trendz 主要功能。
-
安装指南 - 学习在各种操作系统上部署 Trendz。
-
指标探索器 - 学习使用 Trendz Metric Explorer 探索和创建指标。
-
异常检测 - 学习识别数据中的异常。
-
字段计算 - 了解字段计算及使用方法。
-
状态 - 学习基于原始遥测定义和分析资产状态。
-
预测 - 学习进行预测及遥测行为预测。
-
筛选器 - 学习在分析中筛选数据集。
-
可用可视化部件 - 了解 Trendz 中可用的可视化部件及配置方法。
-
分享与嵌入可视化 - 学习将 Trendz 可视化添加到 ThingsBoard 仪表盘或第三方网页。
-
AI 助手 - 学习使用 Trendz AI 功能。