仅专业版支持Analytics Rule Nodes功能。
请使用ThingsBoard Cloud或自行安装平台实例。
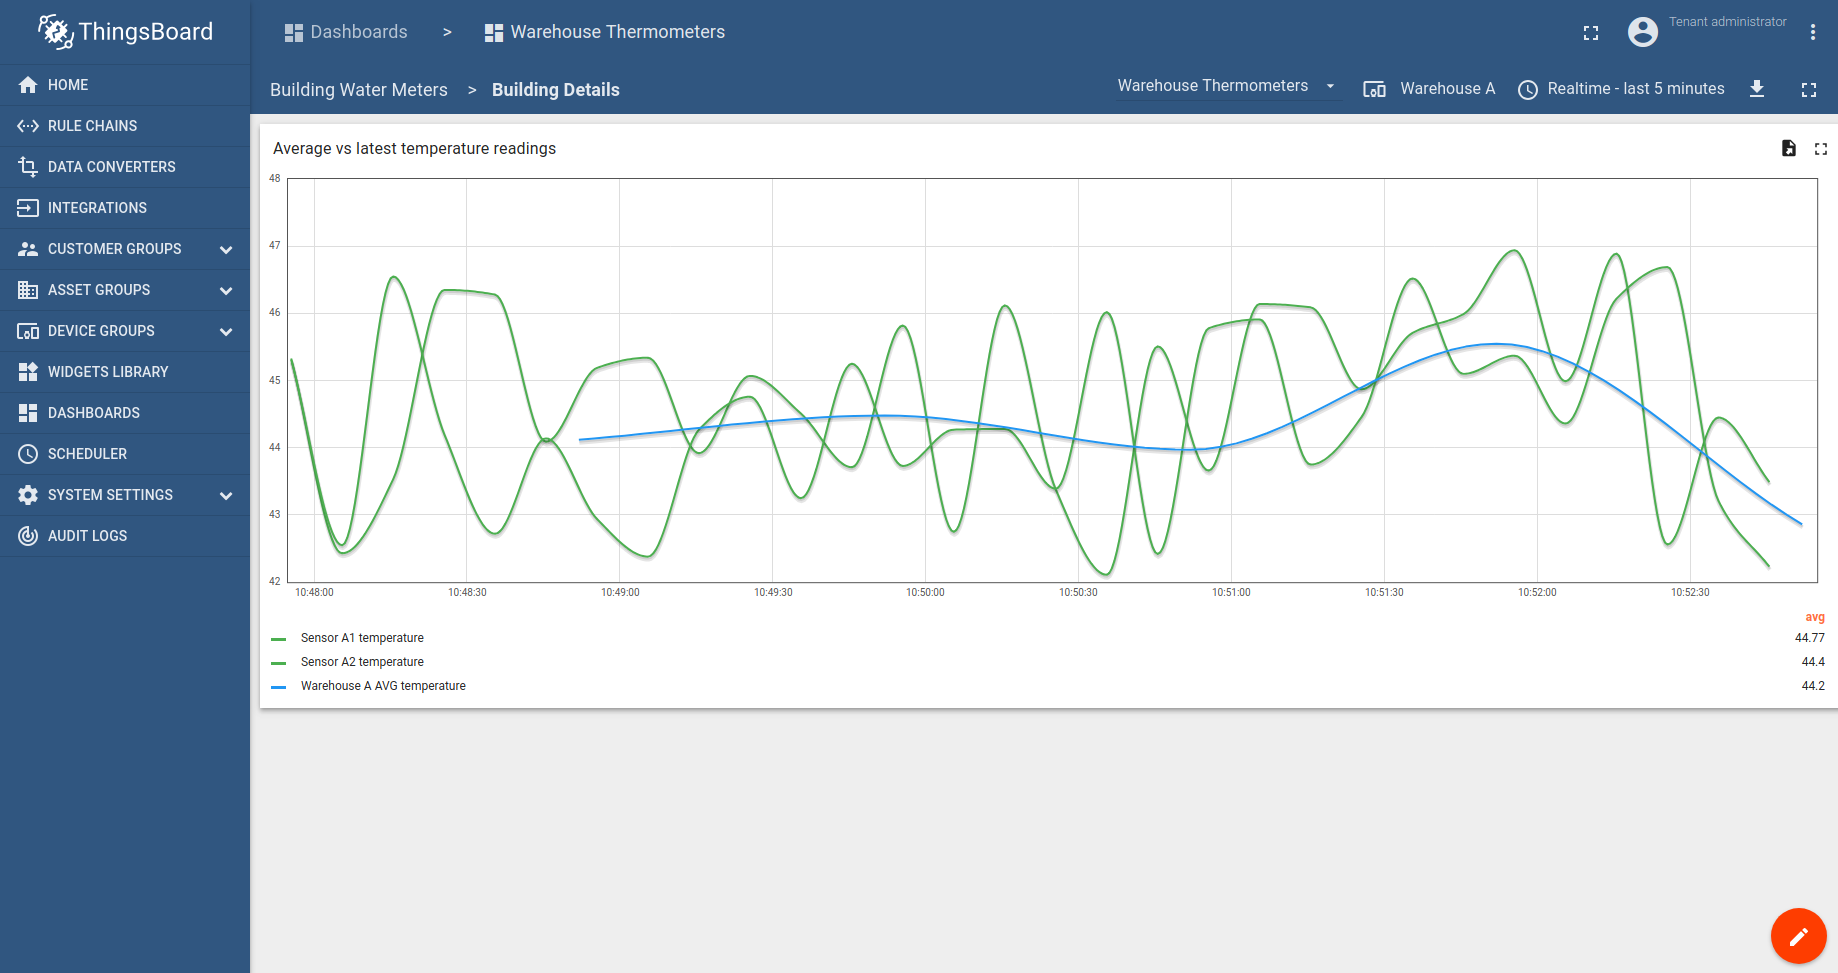
本教程演示如何根据仓库内多个温度传感器的最新读数,每分钟计算仓库平均温度。
使用场景
假设仓库内有多个温度传感器(例如每区域一个),且传感器仅在检测到温度变化时上报读数。 因此,部分传感器可能已一周无上报,而其他传感器可能最近才上报变化。
本教程将配置ThingsBoard Rule Engine,根据多个温度传感器的最新读数每分钟自动计算仓库平均温度。 请注意,这仅为一个简单的理论示例,用于展示平台能力。您可将本教程作为基础实现更复杂的场景。
为演示方便,仅使用 1 个仓库、2 个传感器和 1 分钟执行周期。
前置条件
请确保已完成以下指南并阅读所列文章:
模型定义
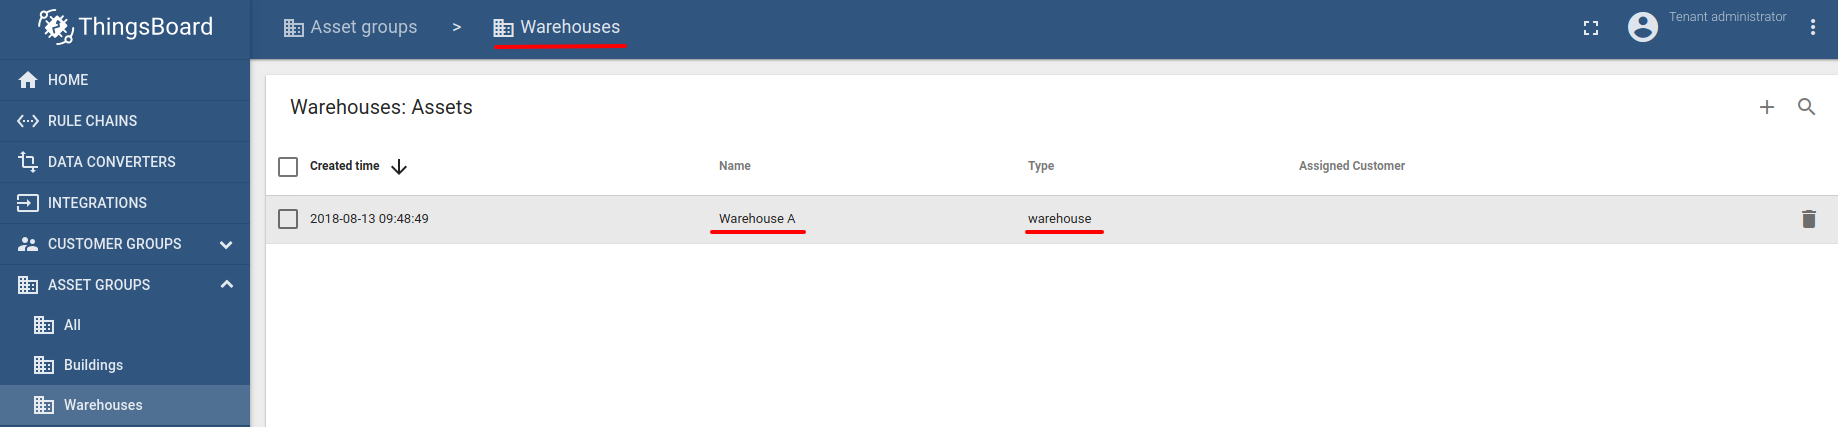
创建一个名为「Warehouse A」、类型为「warehouse」的 asset,并将其加入名为「Warehouses」的 asset 分组。
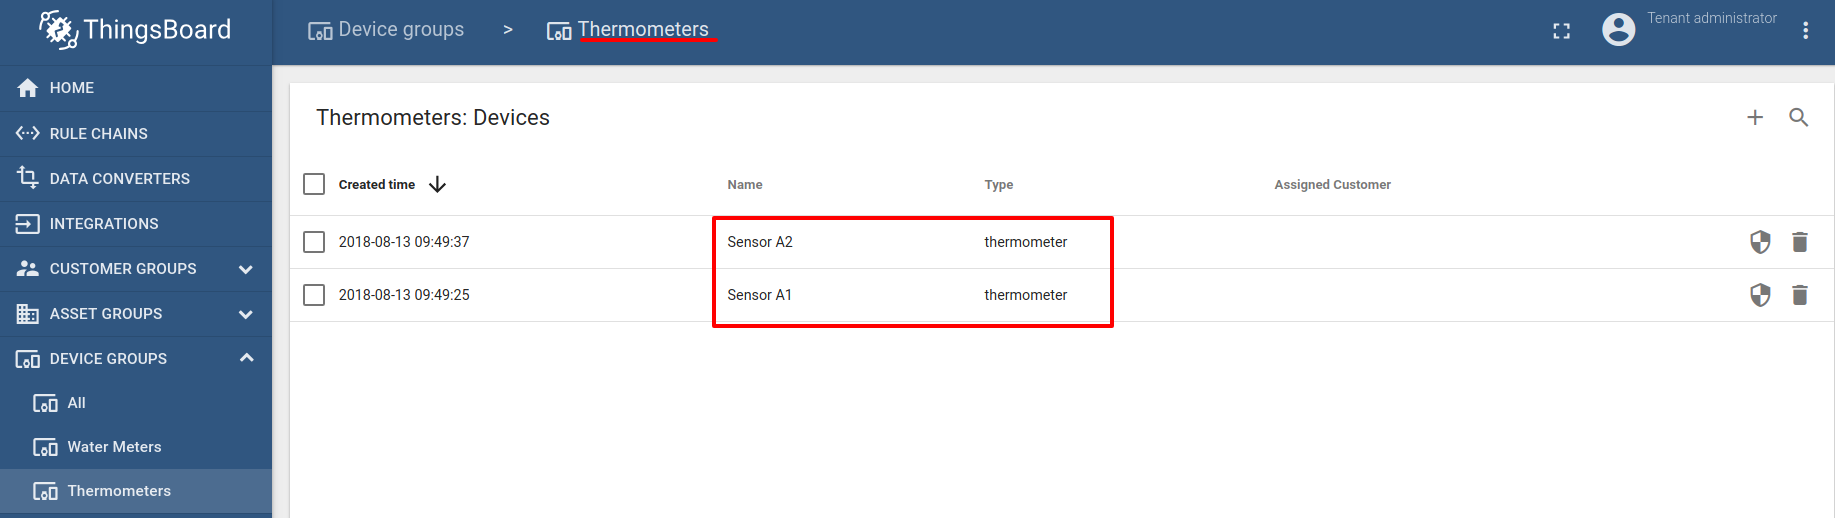
创建两个设备,名称分别为「Sensor A1」和「Sensor A2」,类型为「thermometer」,并将其加入名为「Thermometers」的设备分组。
还需在 warehouse asset 与温度计设备之间创建 relations。rule chain 将用这些 relation 将温度计读数关联到仓库本身。 relations 也可用于 dashboard 中实现下钻。下面截图中可看到 warehouse asset 到温度计的两条出向 relation:
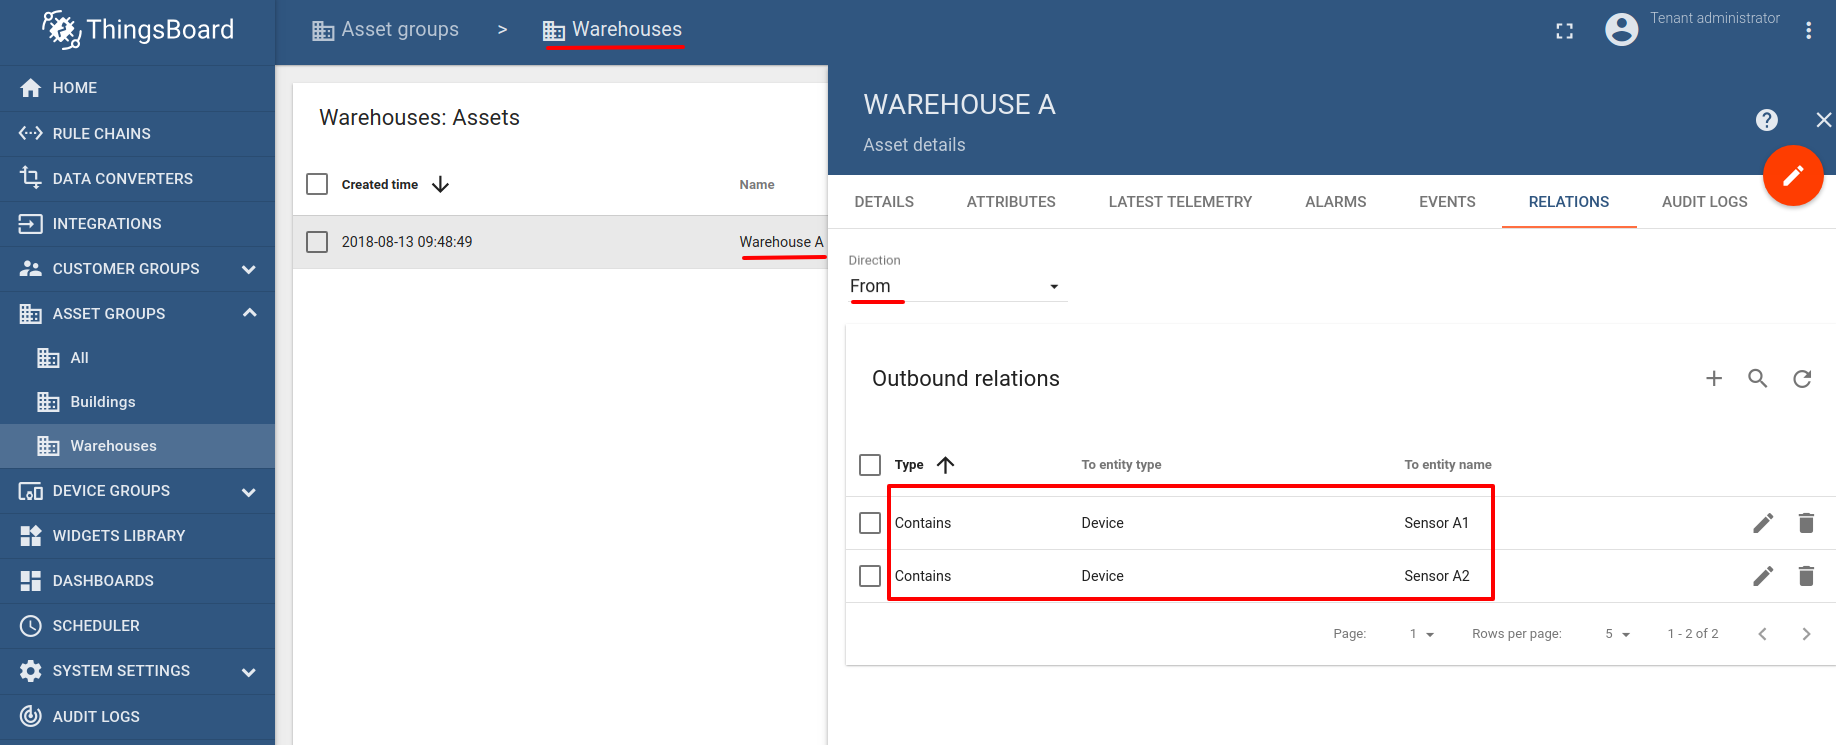
说明:请参阅 文档页面 了解如何创建 assets 和 relations。
消息流
本节说明本教程中各节点的作用。涉及两个 rule chain:
- 「Thermometer Emulators」— 可选,用于模拟两个温度传感器的数据;
- 「Warehouse Temperature」— 负责计算仓库平均温度的 rule chain;
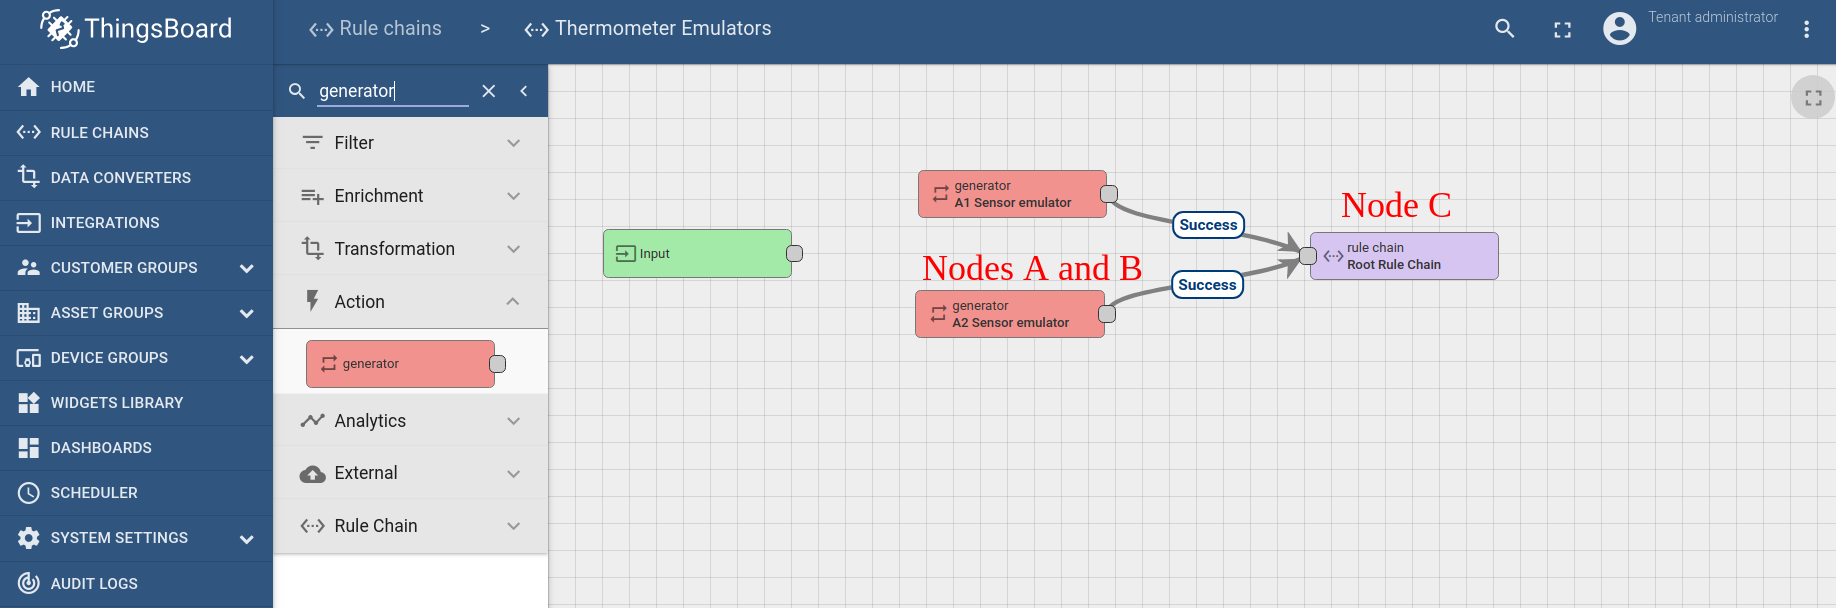
Thermometer Emulators rule chain
-
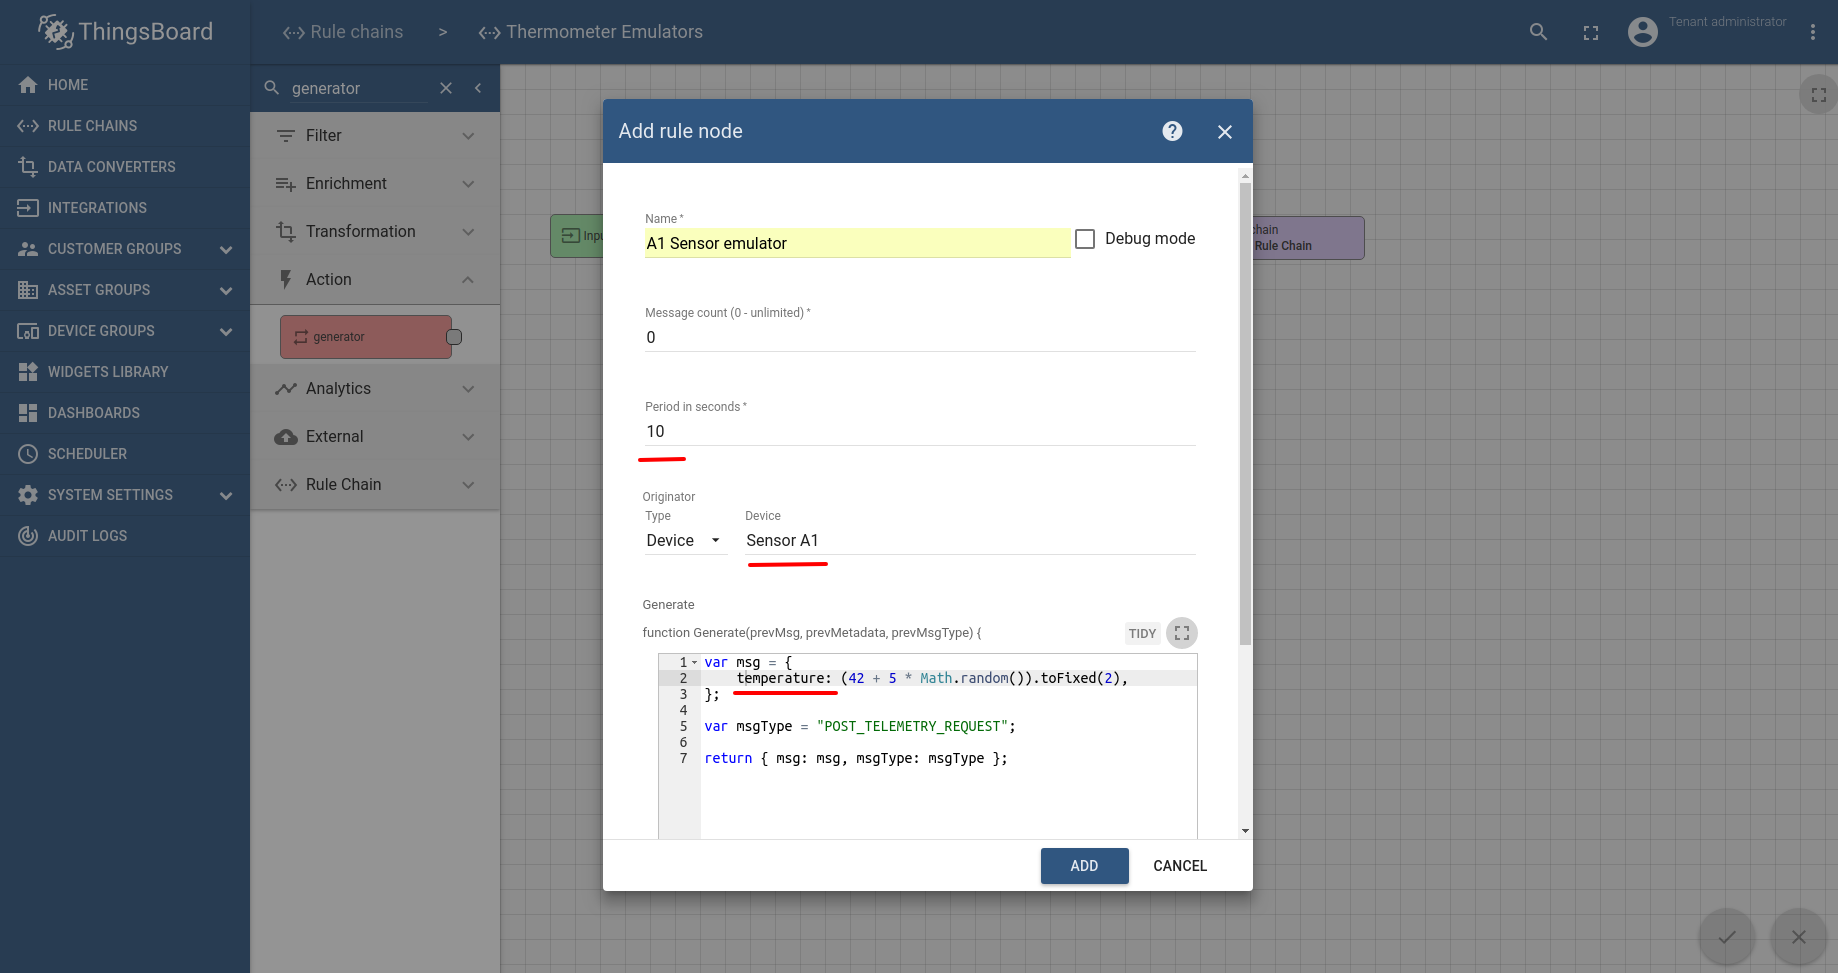
Nodes A 和 B:Generator 节点
- 两个类似节点,定期生成包含随机温度读数的简单消息。
-
Node C:Rule Chain 节点
- 将所有消息转发到默认 rule chain。
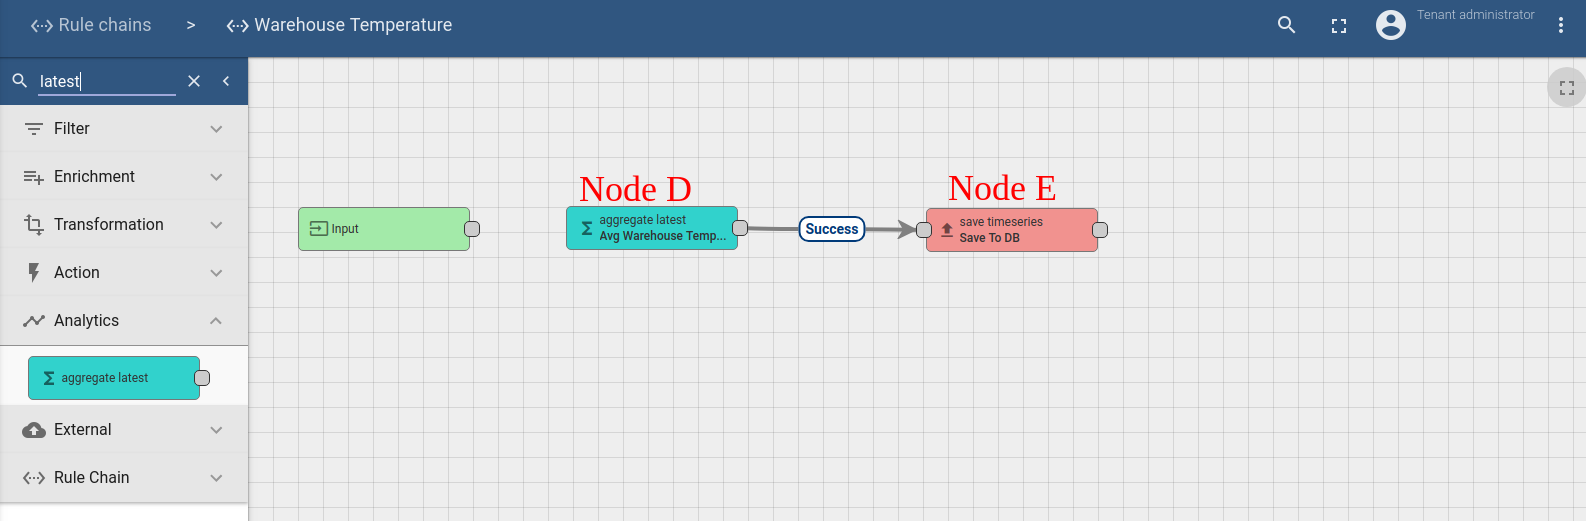
Warehouse Temperature rule chain
-
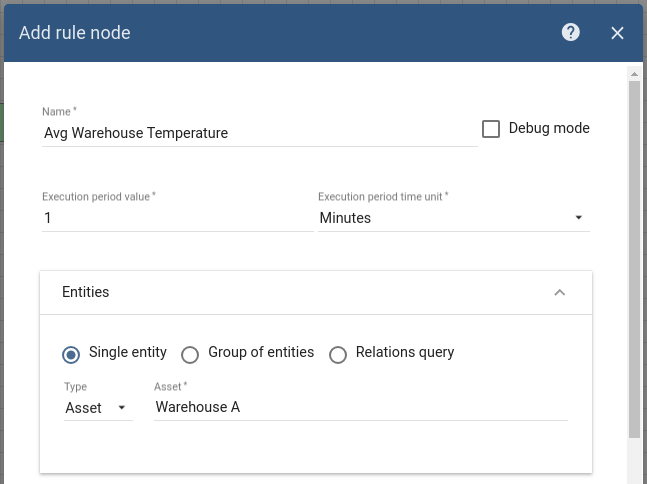
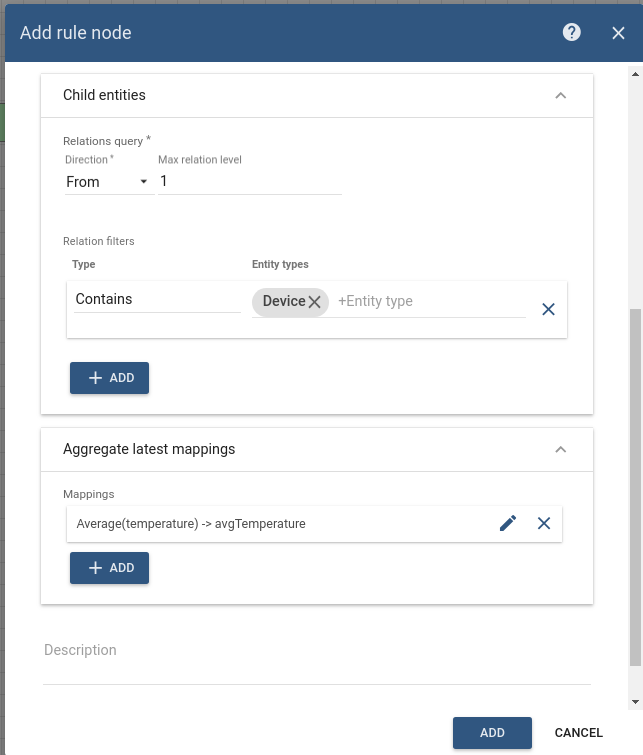
Node D:Aggregate latest 节点。按周期(「Execution period value」定义执行周期)执行:
- 通过「Contains」relation 获取与「Warehouse A」asset 相关的所有设备。
- 获取每个设备的最新温度读数并计算平均温度读数。
- 生成包含平均温度值的「POST_TELEMETRY_REQUEST」消息。
-
Node E:Save telemetry 节点
- 简单节点,将入站消息写入数据库并分发给订阅者。
配置 Rule Chains
下载并 import 附带的模拟器 rule chain file 作为新的「Thermometer Emulators」rule chain,以及 仓库温度 rule chain file 作为新的「Warehouse Temperature」rule chain。 注意部分节点已开启 debug,会影响性能。在 thermometer emulators rule chain 中按上图创建 Node C,将 telemetry 转发到 root rule chain。
验证流程
下载并 import 附带的 dashboard file 作为新的「Warehouse Temperature」dashboard。
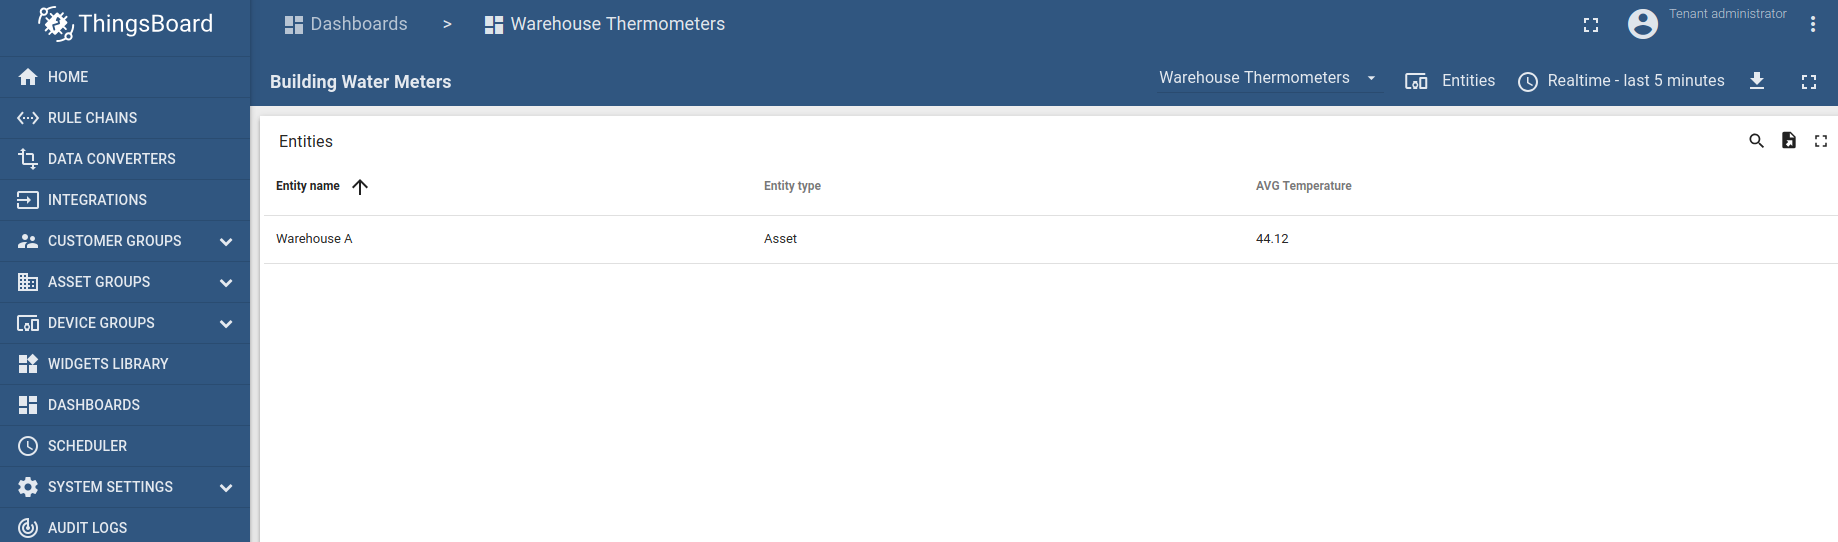
可点击对应行下钻到具体仓库的图表。