仅专业版支持Analytics Rule Nodes功能。
请使用ThingsBoard Cloud或自行安装平台实例。
本教程演示如何根据楼内所有水表传感器上报的数据,计算楼内总用水量。
使用场景
假设每栋楼内有多个水表传感器(例如每户一个)。
本教程将配置ThingsBoard Rule Engine,根据多个水表的读数,在设定时间间隔内自动计算楼内总用水量。 为演示方便,仅使用 1 栋楼、2 个传感器和 10 秒间隔。 您可将本教程作为基础,实现更复杂的场景。
前置条件
请确保已完成以下指南并阅读所列文章:
模型定义
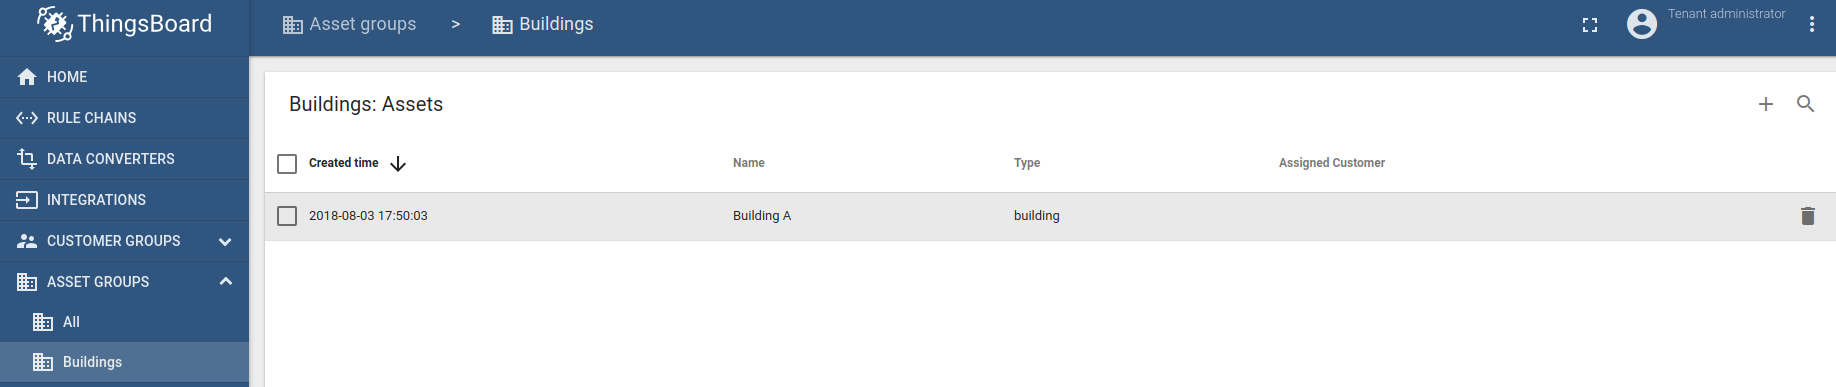
创建一个名为「Building A」、类型为「building」的 asset,并将其加入名为「Buildings」的 asset 分组。
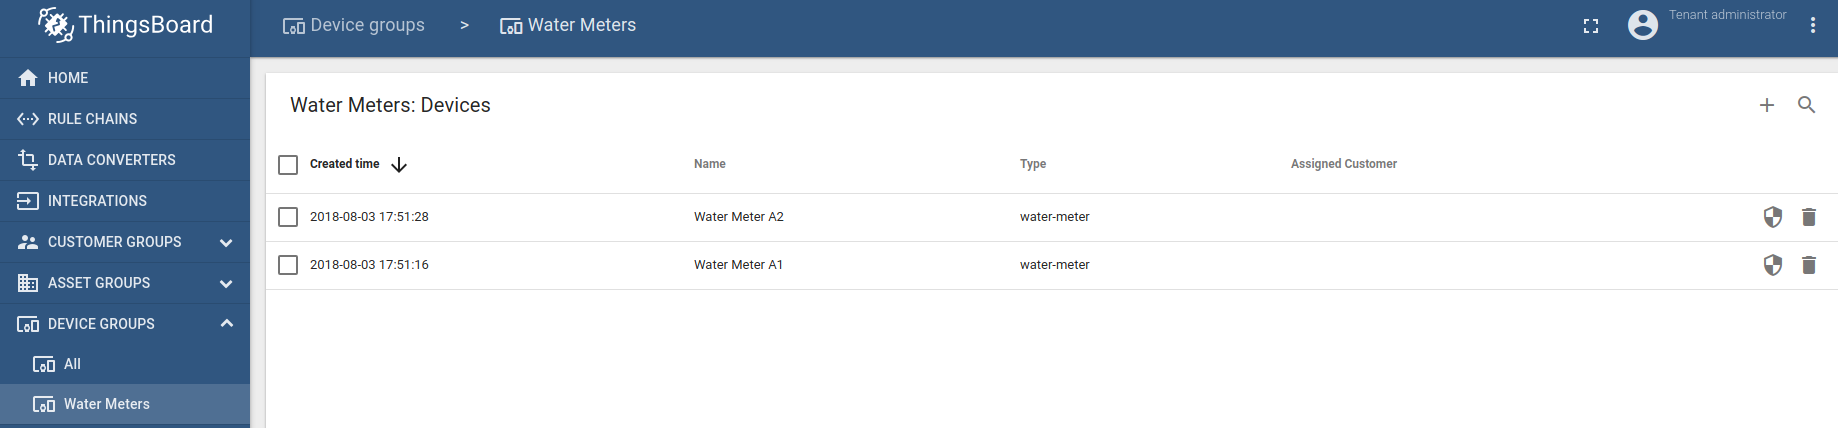
创建两个设备,名称分别为「Water Meter A1」和「Water Meter A2」,类型为「water-meter」,并将其加入名为「Water Meters」的设备分组。
还需在 building asset 与水表设备之间创建 relations。rule chain 将用这些 relation 将水表读数关联到楼宇本身。 relations 也可用于 dashboard 中实现下钻。下面截图中可看到 building asset 到水表的两条出向 relation:
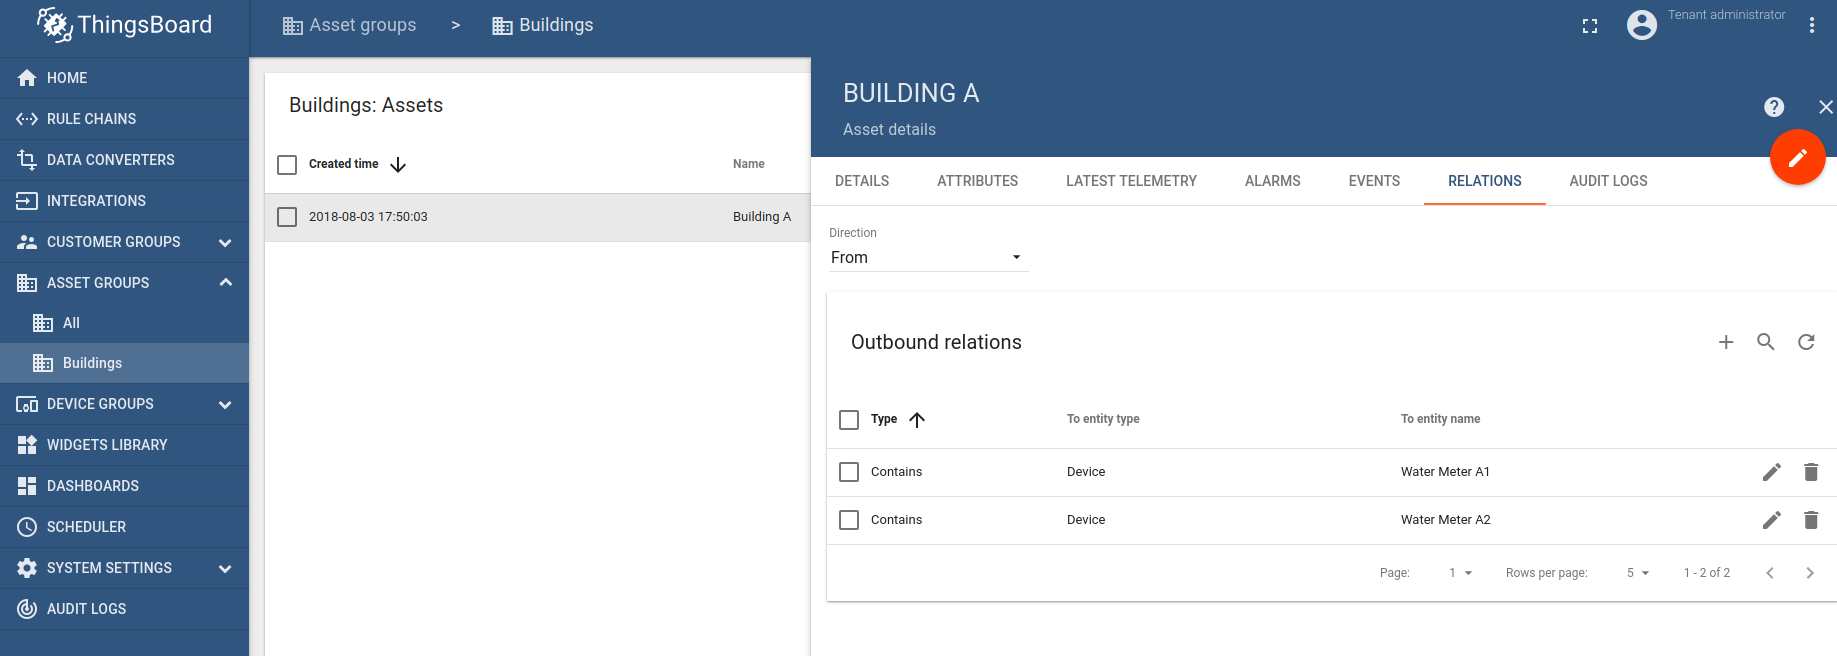
说明:请参阅 文档页面 了解如何创建 assets 和 relations。
消息流
本节说明本教程中各节点的作用。涉及三个 rule chain:
- 「Emulators」— 可选,用于模拟两个水表的数据;
- 「Water consumption」— 负责聚合用水量读数的 rule chain;
- 「Root Rule Chain」— 主默认 rule chain,负责分发所有消息。本示例中 Root Rule Chain 处理「Emulators」产生的数据,存入数据库并推送到「Water consumption」rule chain 进一步处理。
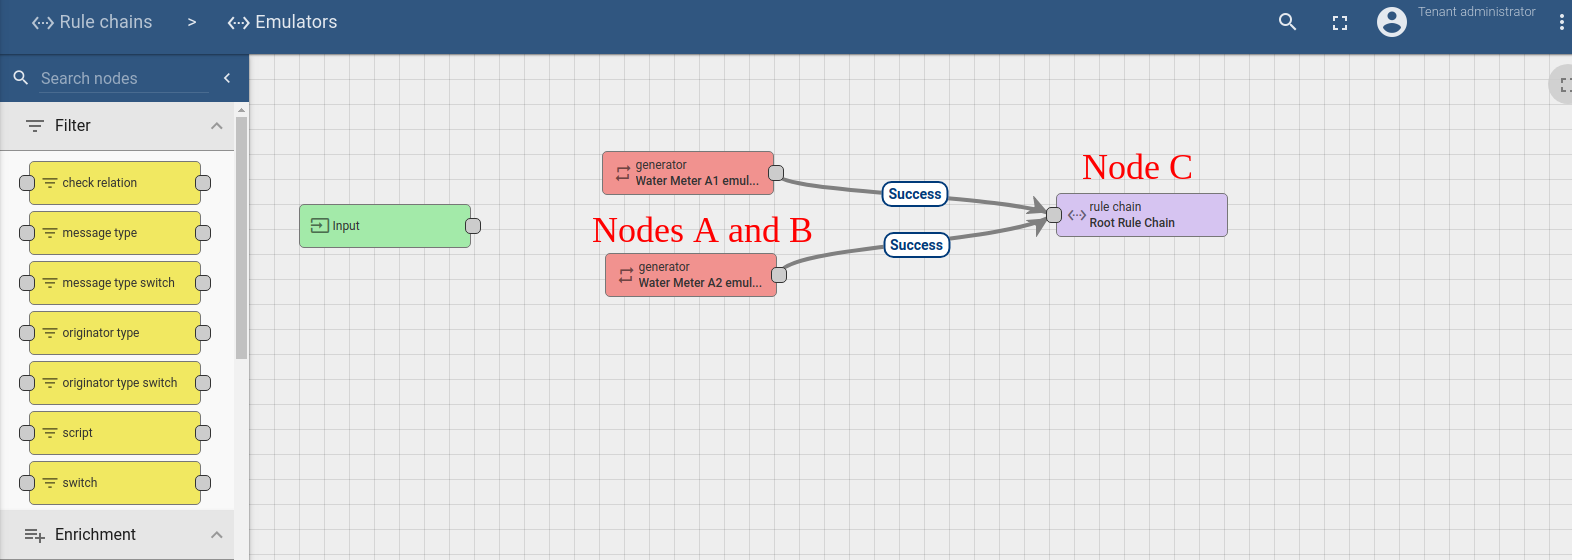
Emulators rule chain
-
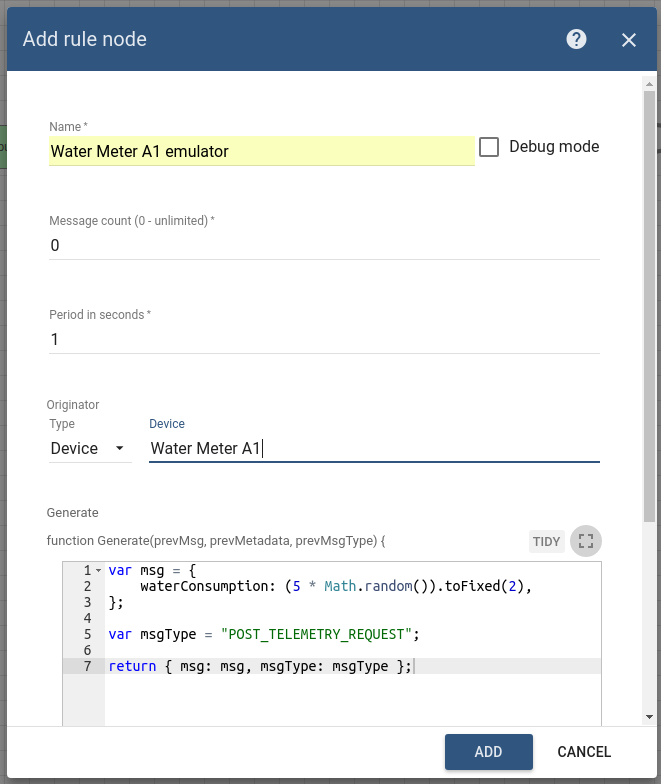
Nodes A 和 B:Generator 节点
- 两个类似节点,定期生成包含随机用水量的简单消息。
-
Node C:Rule Chain 节点
- 将所有消息转发到默认 rule chain
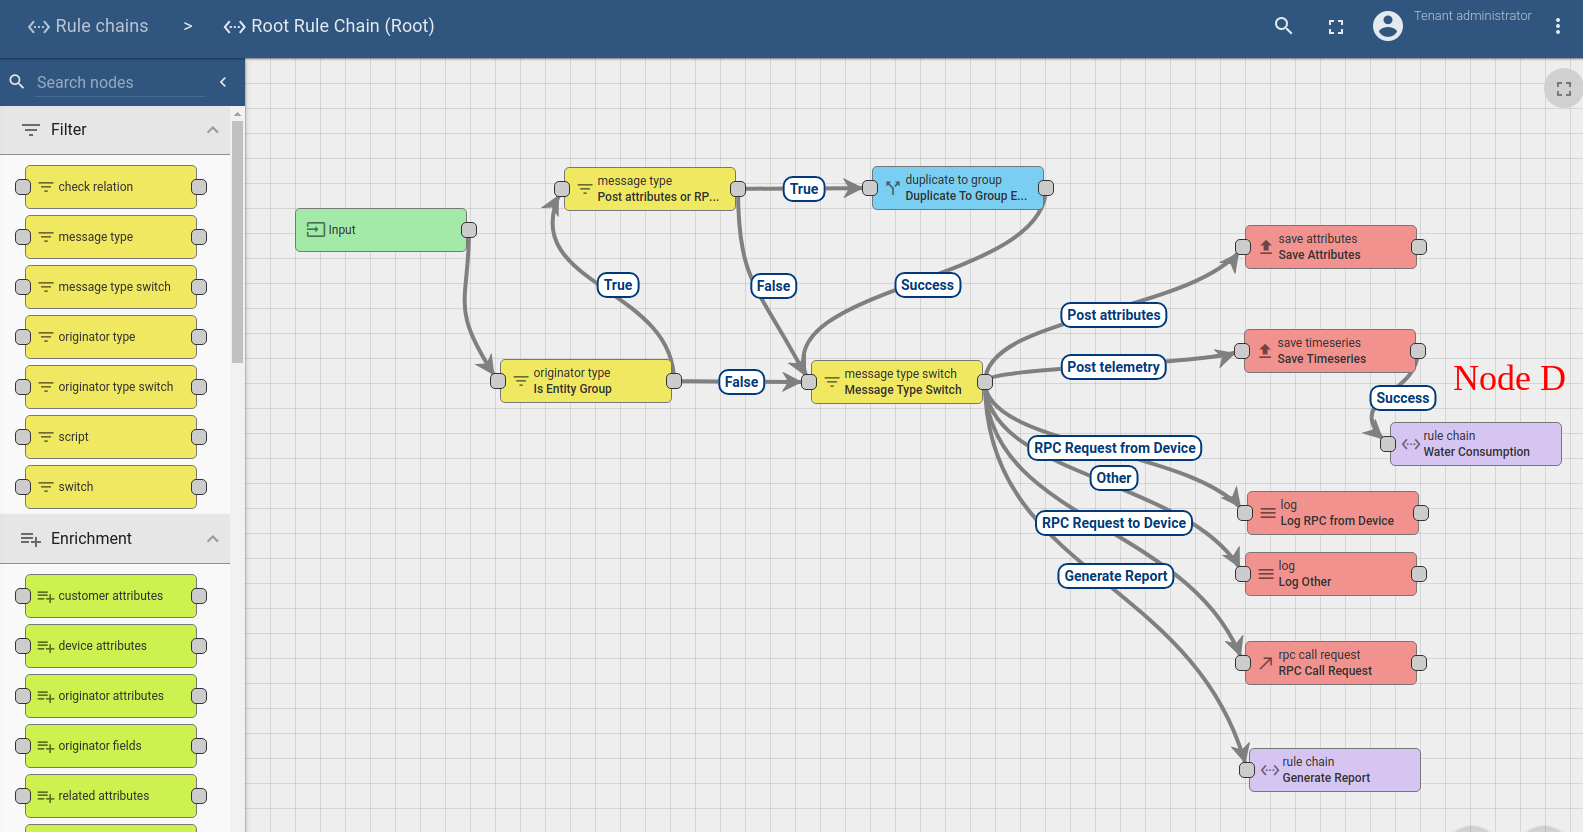
Root rule chain
-
Node D: Rule Chain 节点
- 将所有 telemetry 消息转发到聚合 rule chain。 为简化指南,我们刻意未添加过滤节点。 实际使用时通常应在转发到复杂节点前对入站 telemetry 做过滤,例如检查是否包含水表读数。
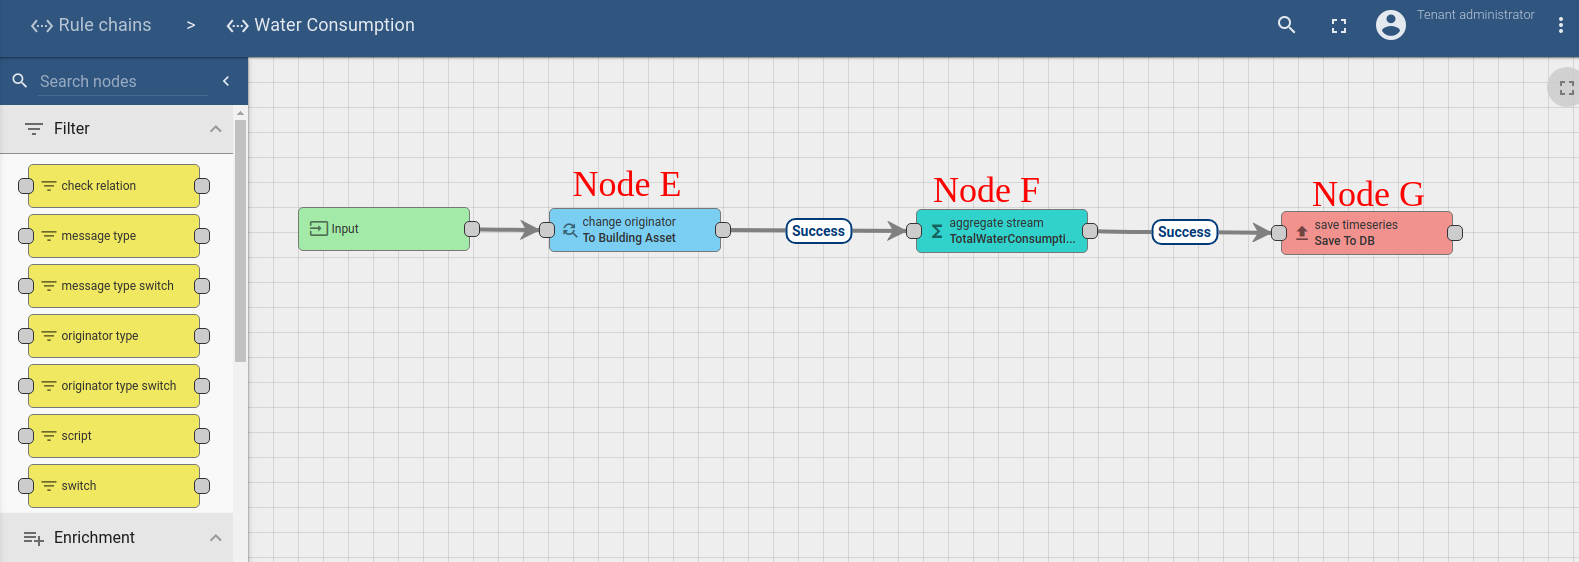
Water consumption rule chain
-
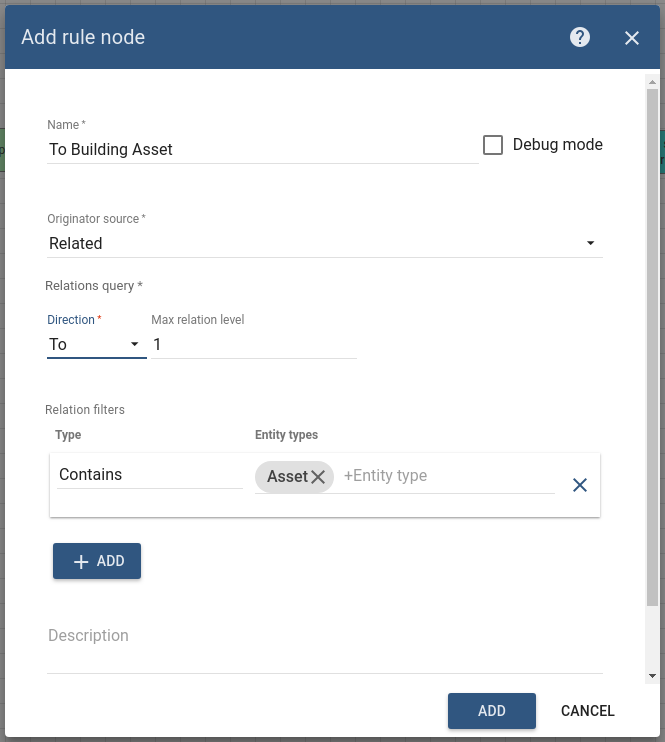
Node E:Change originator 节点
- 更新与消息关联的实体 id。 将实体 id 从具体水表更新为父 asset。
-
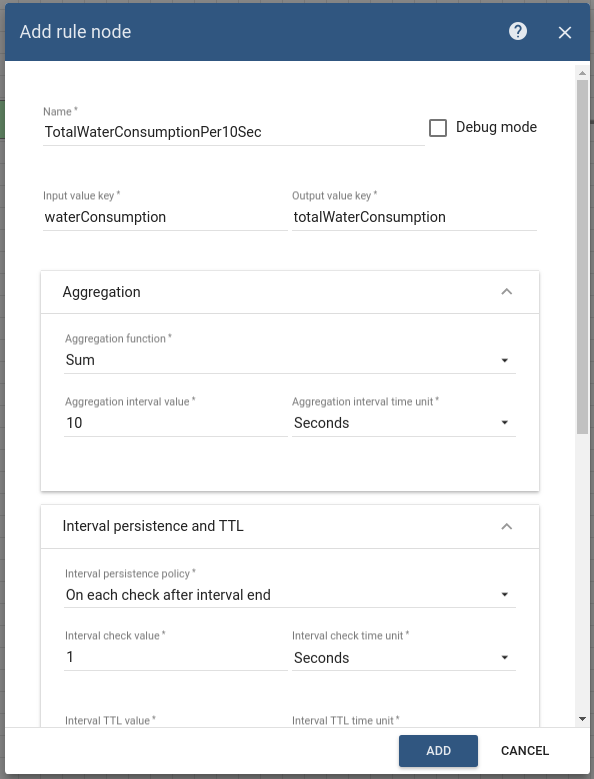
Node F:Aggregate stream 节点
- 每 10 秒将「waterConsumption」入站数据流聚合为「totalWaterConsumption」值。
- 在指定间隔结束后及之后属于该间隔的每条新消息到达时,持久化新 telemetry。 适用于 telemetry 读数可能延迟的情况。
-
Node G:Save telemetry 节点
- 简单节点,将入站消息写入数据库并分发给订阅者。
配置 Rule Chains
下载并 import 附带的模拟器 rule chain file 作为新的「Emulators」rule chain,以及 用水量 rule chain file 作为新的「Water Consumption」rule chain。 注意部分节点已开启 debug,会影响性能。在 root rule chain 中按上图创建 Node C 和 Node D,将 telemetry 转发到新 rule chain。
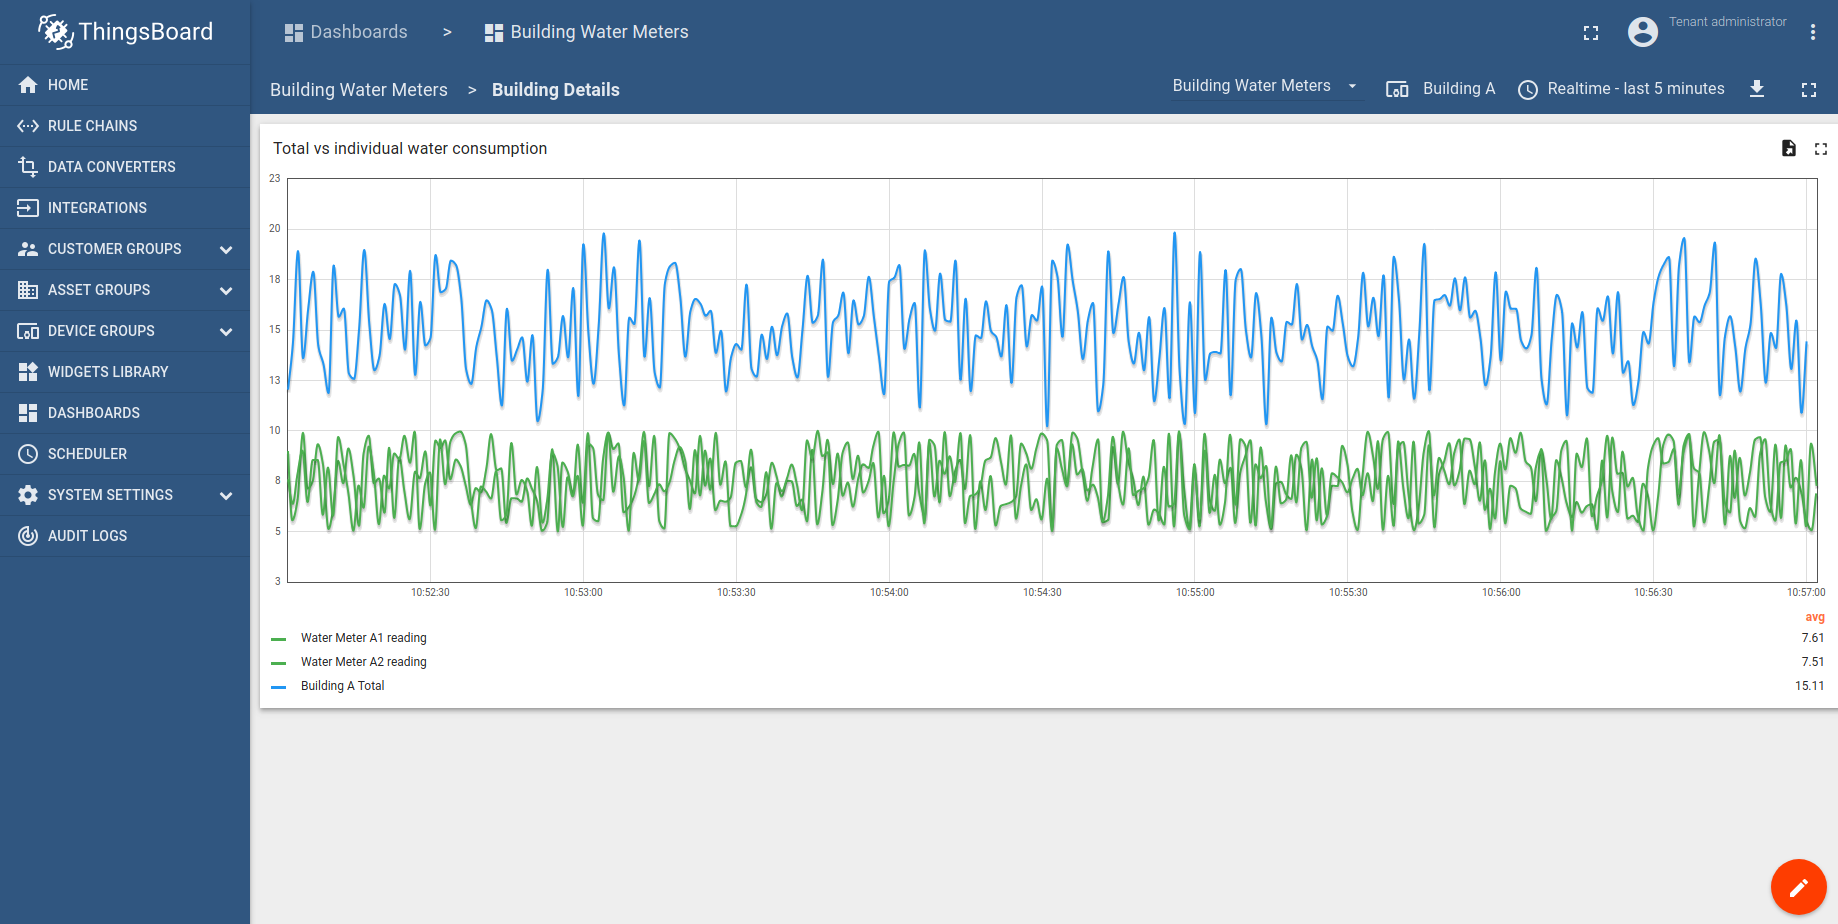
验证流程
下载并 import 附带的 dashboard file 作为新的「Building Water Meters」dashboard。
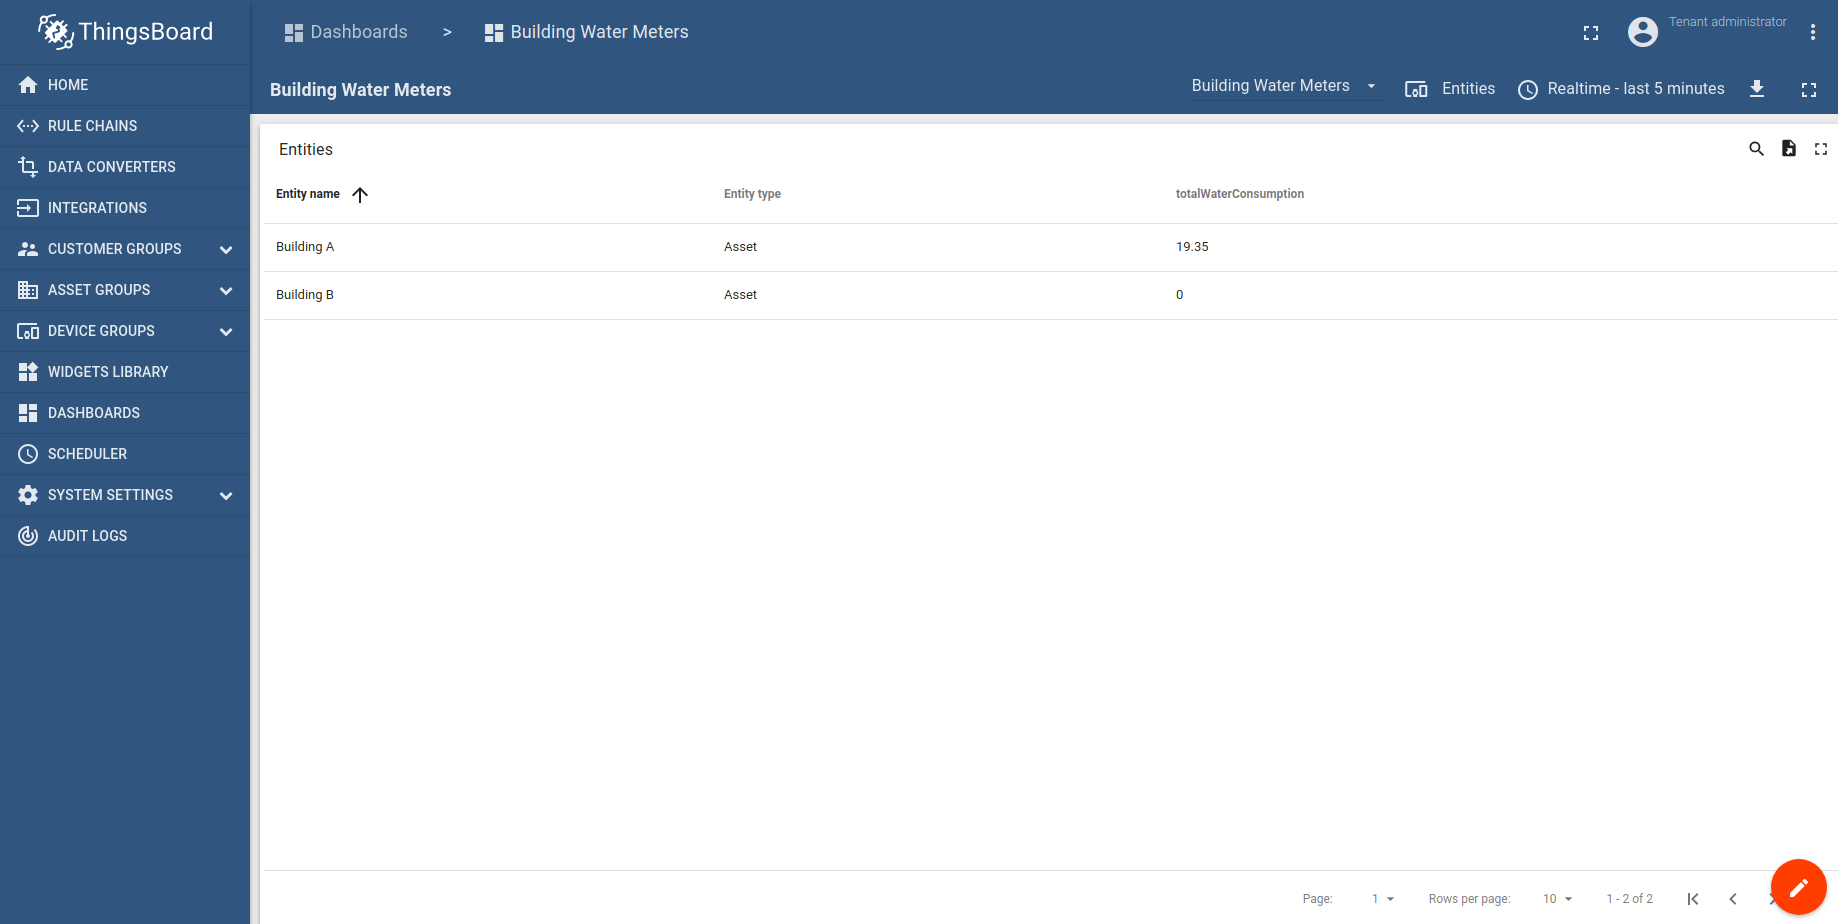
可点击对应行下钻到具体仓库的图表。