ThingsBoard已被众多企业在单体和微服务模式下投入生产运行。本文介绍单台ThingsBoard服务器在常用场景下的性能表现。了解ThingsBoard的纵向扩展(单体)有助于理解其横向扩展(集群模式)。
测试方法
为简化测试,我们在单台EC2实例上使用docker-compose部署了单实例ThingsBoard及所有相关第三方组件。 测试代理会配置并连接可配置数量的设备模拟器,持续通过MQTT发布时序数据。
不同物联网设备配置在消息数量与单条消息大小上各有差异。 我们模拟了智能电表设备,以JSON格式发送包含三个数据点的消息:脉冲计数、泄漏标志和电量。 每台设备使用独立的MQTT连接连接服务器。
ThingsBoard将所有时序数据存入数据库。 ThingsBoard还通过告警规则处理数据,在电量低时生成告警。 我们将测试规模从5K扩展到100K设备,消息速率从1K条/秒扩展到10K条/秒。 团队至少运行24小时测试,以确保无资源泄漏或随时间性能下降。 我们还提供了复现测试的说明,链接见各测试运行的详情部分。
测试所用辅助工具集: Postgres、 Java及 ThingsBoard用于性能可视化。
输出方面,我们将分析ThingsBoard规则引擎统计仪表板和API使用统计。
注:不同物联网用例可能影响性能数据。 本测试涵盖数据接入与告警生成的主要功能。
测试总结
各测试场景在连接设备数、每秒消息数、服务器类型及存储时序数据的数据库上有所不同。
| 场景 | 设备数 | 每秒数据点数 | 实例类型 | 队列类型 | 数据库 | CPU使用率 | 写IOPS |
|---|---|---|---|---|---|---|---|
| 场景A | 5K | 1K | t3.medium:2突发型vCPU、4GB内存 | 内存队列 | PostgreSQL | 27% | 800 |
| 场景B | 5K | 15K | m6a.large:2 vCPU、8GB内存 | Kafka | PostgreSQL | 95% | 850 |
| 场景C | 25K | 30K | m6a.2xlarge:8 vCPU、32GB内存 | Kafka | PostgreSQL + Cassandra | 75% | 200 |
| 场景D | 100K | 15K | m6a.2xlarge:8 vCPU、32GB内存 | Kafka | PostgreSQL + Cassandra | 71% | 700 |
| 场景E | 100K | 30K | m6a.2xlarge:8 vCPU、32GB内存 | Kafka | PostgreSQL + Cassandra | 95% | 240 |
仅Postgres性能
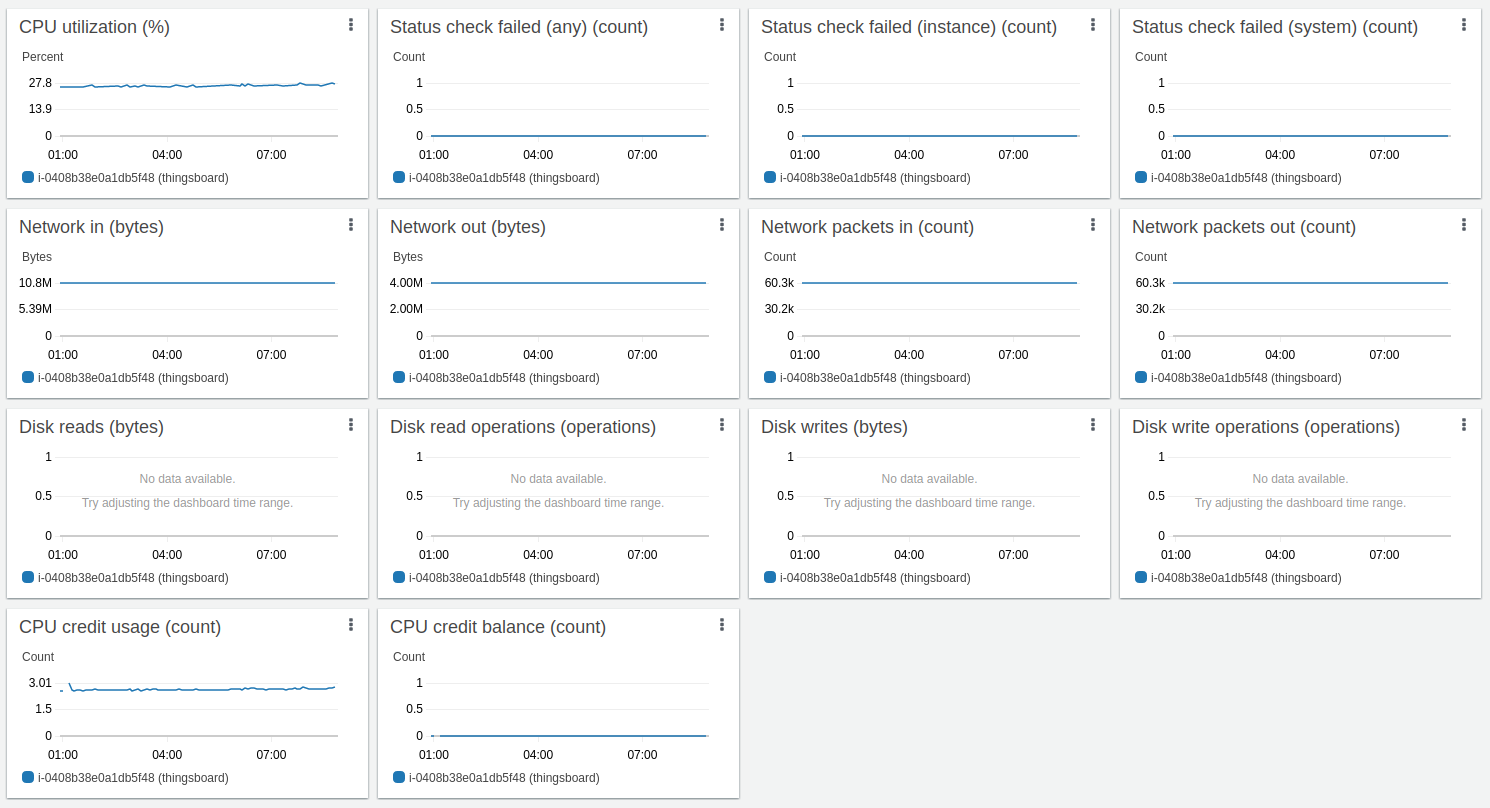
场景A
负载配置:
- 5000台设备;
- 通过MQTT 1000条消息/秒,每条MQTT消息含3个数据点,即3000数据点/秒;
- PostgreSQL数据库;
- 内存队列。
实例:AWS t3.medium(2 vCPU Intel、4 GiB、EBS GP3)
预估成本:19 USD EC2 + x USD CPU突发 + 8 USD EBS GP3 100GB = 30 USD/月
x64架构下测试执行统计:

ARM架构(t4g.medium)下测试执行统计:
经验总结
由于使用内存队列,此配置主要适用于开发环境。 系统可承受并稳定运行最高约3倍消息速率(3000条/秒)。 云服务商会根据CPU突发收费,但生产环境可正常运行。
注:t3.medium为突发型实例,基础CPU性能约20%。空闲时未使用的CPU时间会累积至上限。 建议将实例设计为平均使用率低于20%。
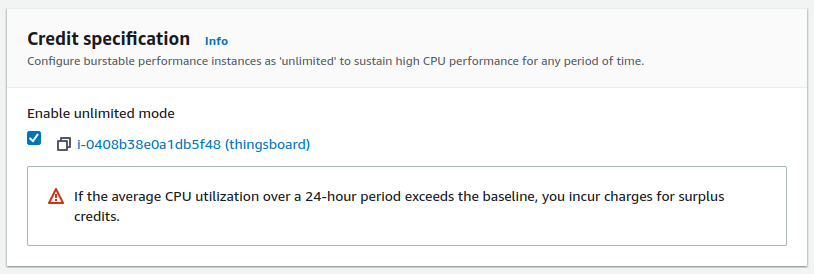
提示:在积分规格中启用Unlimited模式以获得初次运行时的良好性能
可承受超出限制的额外负载(可能产生额外费用)。 若不启用Unlimited模式,首次启动时积分为0,无法突发CPU,系统将限制在20%基础CPU,导致初次配置较慢。
如何复现测试:
在AWS EC2上配置ThingsBoard实例
根据说明使用下述Docker Compose文件在AWS EC2上配置实例。
1
2
3
4
5
6
7
8
9
10
11
12
13
14
15
16
17
18
19
20
21
22
23
24
25
26
27
28
29
30
31
32
33
34
35
36
37
version: '3.0'
services:
  postgres:
    image: "postgres:14"
    network_mode: "host"
    restart: "always"
    volumes:
      - postgres:/var/lib/postgresql/data
    environment:
      POSTGRES_DB: "thingsboard"
      POSTGRES_PASSWORD: "postgres"
  tb:
    depends_on:
      - postgres
    image: "thingsboard/tb"
    network_mode: "host"
    restart: "always"
    volumes:
      - thingsboard-data:/data
      - thingsboard-logs:/var/log/thingsboard
    environment:
      DATABASE_TS_TYPE: "sql"
      TB_QUEUE_TYPE: "in-memory"
      TB_SERVICE_ID: "tb-node-0"
      HTTP_BIND_PORT: "8080"
      TB_QUEUE_RE_MAIN_PACK_PROCESSING_TIMEOUT_MS: "30000"
      TB_QUEUE_RE_MAIN_CONSUMER_PER_PARTITION: "false"
      # Postgres connection
      SPRING_DATASOURCE_URL: "jdbc:postgresql://localhost:5432/thingsboard"
      SPRING_DATASOURCE_USERNAME: "postgres"
      SPRING_DATASOURCE_PASSWORD: "postgres"
      # Java options for 4G instance and JMX enabled
      JAVA_OPTS: " -Xmx2048M -Xms2048M -Dcom.sun.management.jmxremote -Dcom.sun.management.jmxremote.port=9999 -Dcom.sun.management.jmxremote.rmi.port=9999 -Dcom.sun.management.jmxremote.authenticate=false -Dcom.sun.management.jmxremote.ssl=false -Djava.rmi.server.hostname=127.0.0.1"
volumes: # to persist data between container restarts or being recreated
  postgres:
  thingsboard-data:
  thingsboard-logs:
启动性能测试工具
根据说明使用下述Docker命令启动性能测试工具。
1
2
3
4
5
6
7
8
9
10
11
# Put your ThingsBoard private IP address here, assuming both ThingsBoard and performance tests EC2 instances are in same VPC.
export TB_INTERNAL_IP=172.31.16.229
docker run -it --rm --network host --name tb-perf-test \
  --env REST_URL=http://$TB_INTERNAL_IP:8080 \
  --env MQTT_HOST=$TB_INTERNAL_IP \
  --env DEVICE_END_IDX=5000 \
  --env MESSAGES_PER_SECOND=1000 \
  --env ALARMS_PER_SECOND=10 \
  --env DURATION_IN_SECONDS=86400 \
  --env DEVICE_CREATE_ON_START=true \
  thingsboard/tb-ce-performance-test:3.3.3
x3峰值负载生存测试
负载配置:
- 5000台设备;
- 通过MQTT 3333条消息/秒,每条消息含3个数据点,即10000数据点/秒;
- PostgreSQL数据库;
- 内存队列。
实例:AWS t3.medium(2 vCPU Intel、4 GiB、EBS GP3)
预估成本:19 USD EC2 + x USD CPU突发 + 8 USD EBS GP3 100GB = 30 USD/月
上节展示了面向最高3000数据点/秒的成功ThingsBoard部署。
看起来不错,但生产环境遇到峰值负载时会怎样?需要担心吗?
故障代价可能是资金损失、声誉受损或连锁问题。
可靠设计的收益可带来更轻松的运行、更小压力和持续增长。
我们尝试应对约3倍常规速率、最高10000数据点/秒的消息洪峰。
ThingsBoard docker compose配置与上节相同。 消息速率已逐步提高。
性能测试已停止,并分步以更高数值重新运行
根据说明使用下述Docker命令启动性能测试工具。
1
2
3
4
5
6
7
8
9
10
11
# Put your ThingsBoard private IP address here, assuming both ThingsBoard and performance tests EC2 instances are in same VPC.
export TB_INTERNAL_IP=172.31.16.229
docker run -it --rm --network host --name tb-perf-test \
  --env REST_URL=http://$TB_INTERNAL_IP:8080 \
  --env MQTT_HOST=$TB_INTERNAL_IP \
  --env DEVICE_END_IDX=5000 \
  --env MESSAGES_PER_SECOND=3333 \
  --env ALARMS_PER_SECOND=10 \
  --env DURATION_IN_SECONDS=86400 \
  --env DEVICE_CREATE_ON_START=false \
  thingsboard/tb-ce-performance-test:3.3.3
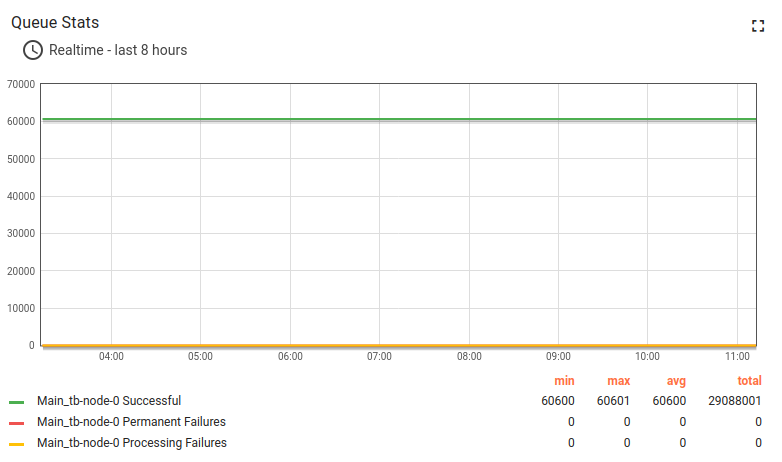
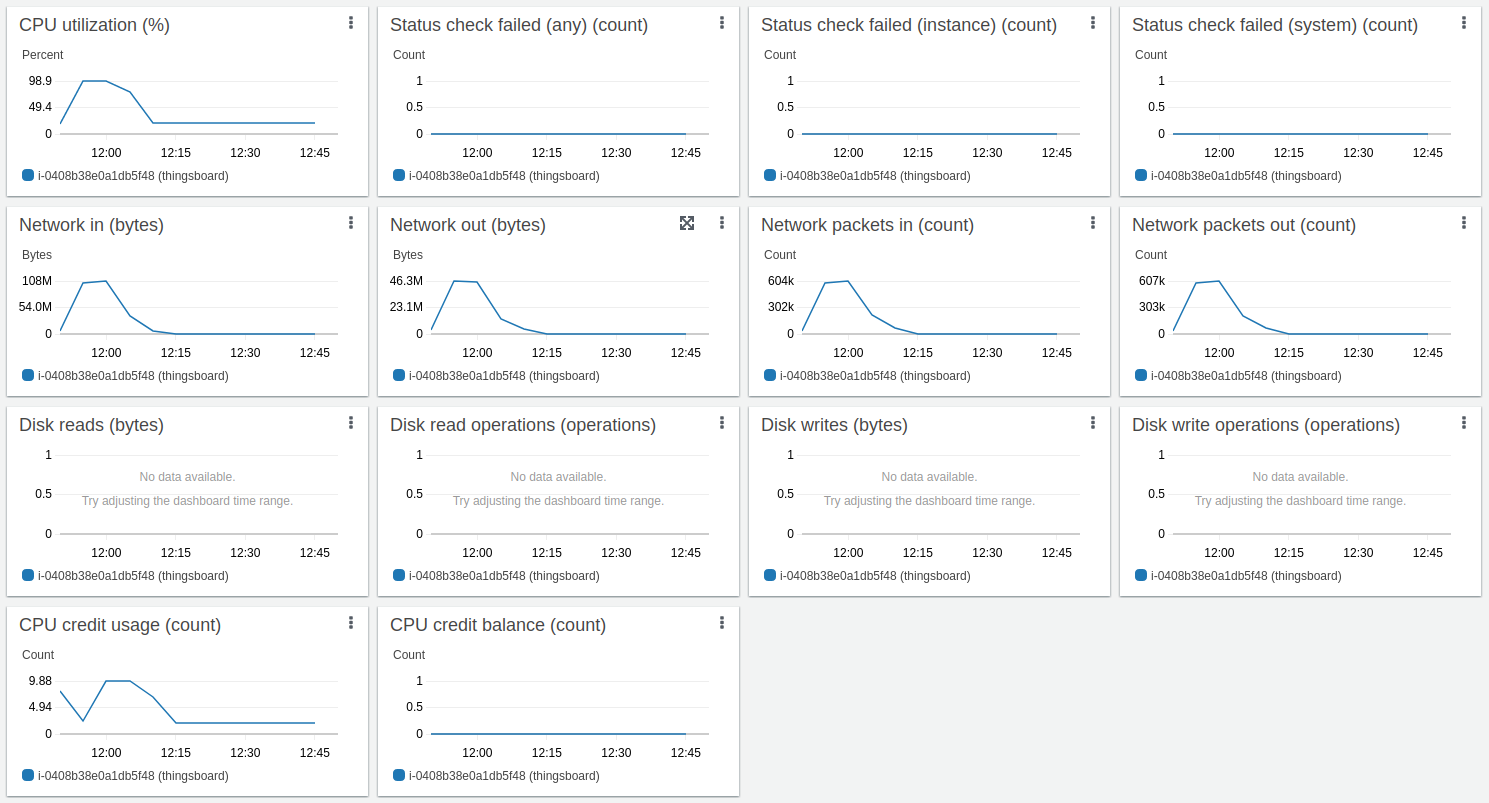
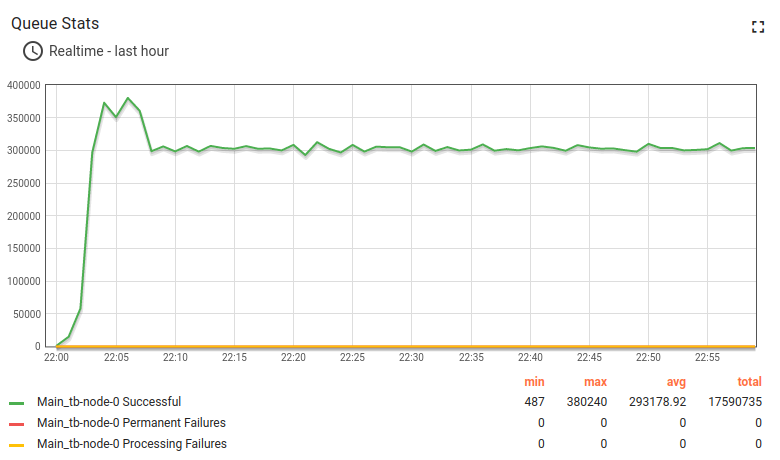
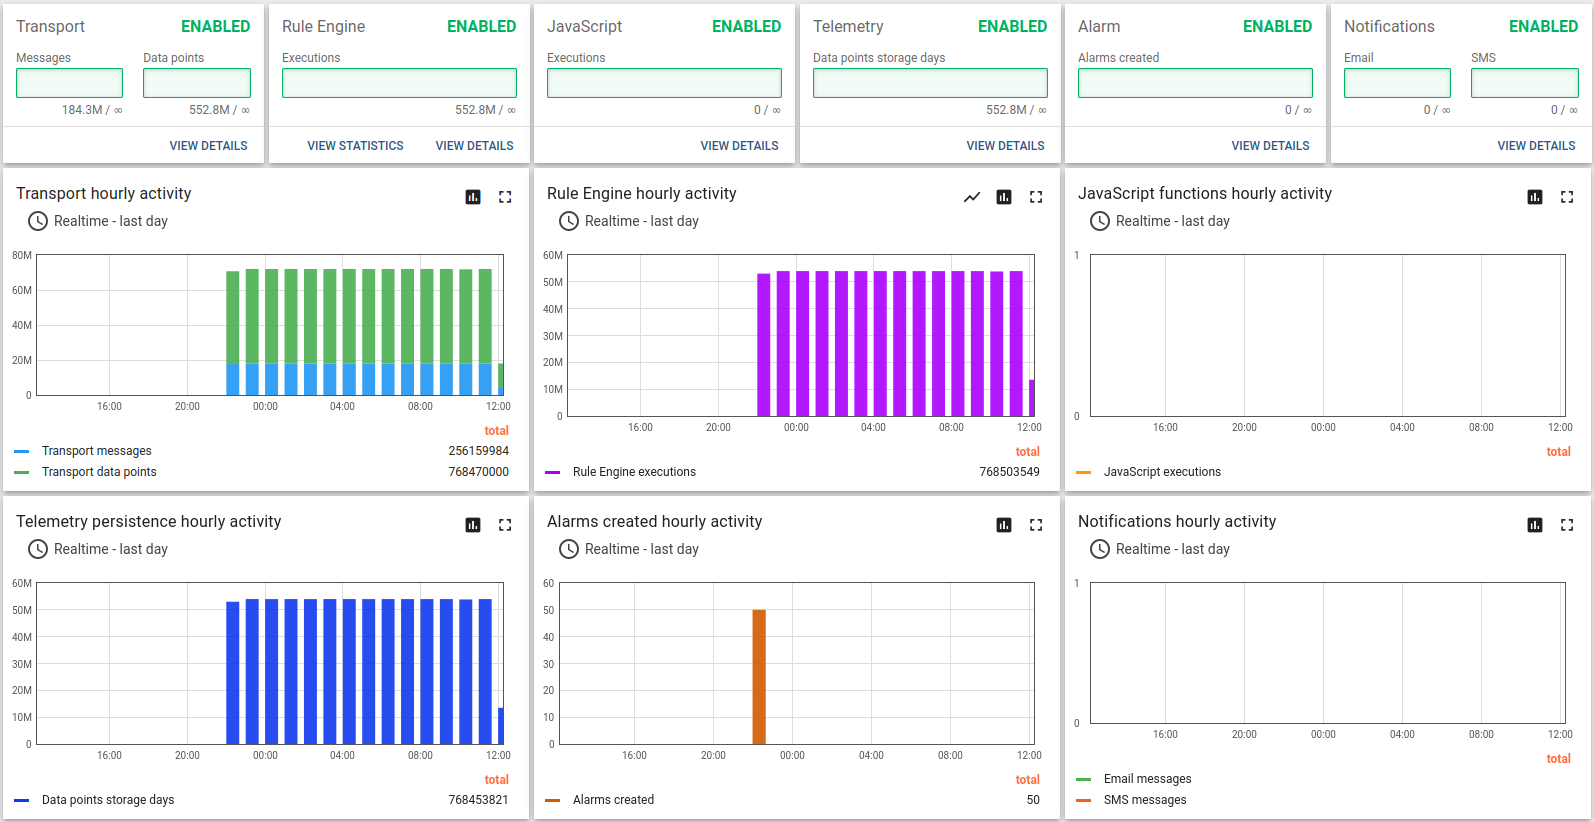
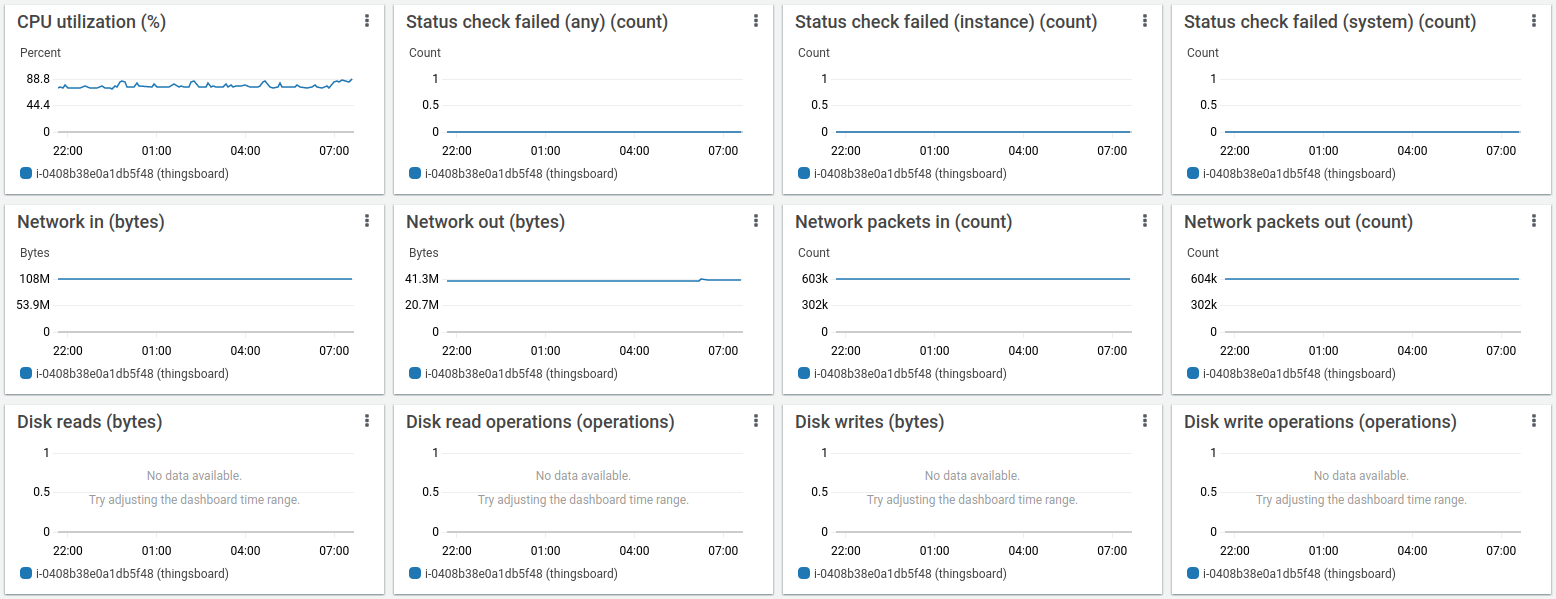
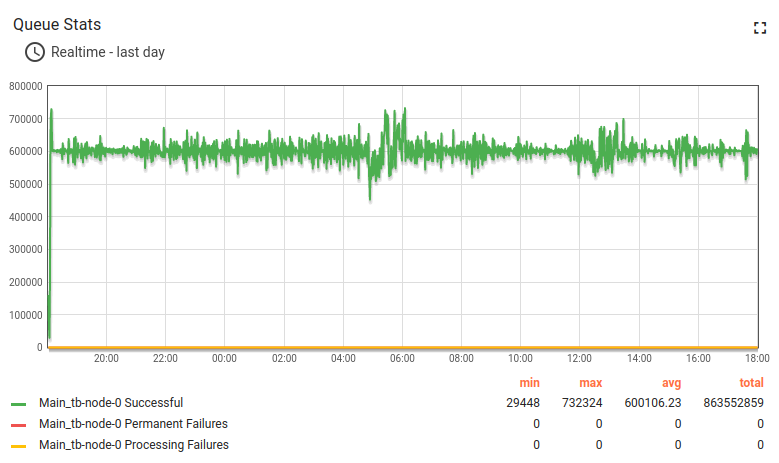
测试已成功通过。以下为部分截图。
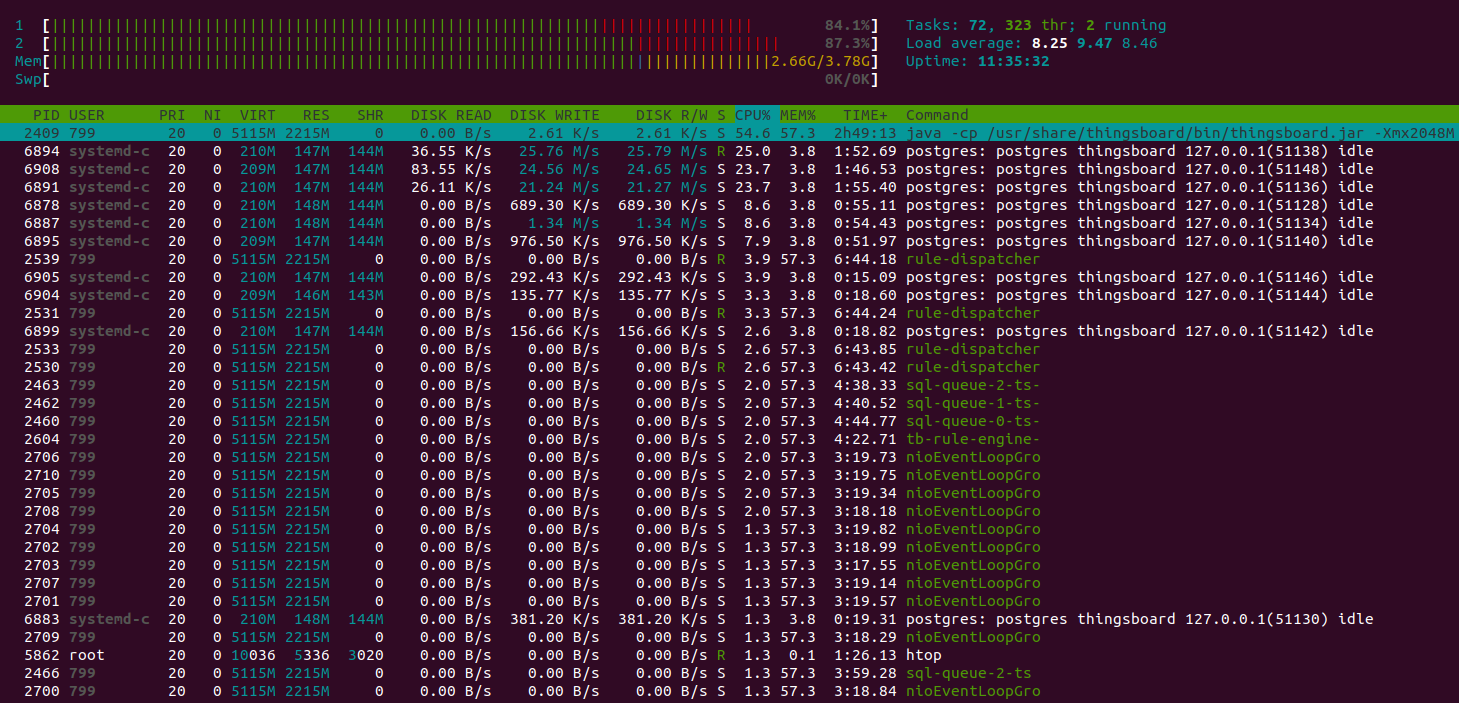
使用共享CPU实例类型和内存队列承受并处理消息突发,此配置是较好的折中方案。
然而,共享CPU实例无法保证额外CPU资源随时可用。 在关键时刻可能只能获得基础CPU水平(t3.medium为20%)。 最佳实践是配置持久化队列服务(如Kafka)以尽可能应对高负载。
x10峰值负载及OOM崩溃
负载配置:
- 5000台设备;
- 通过MQTT 10000条消息/秒,每条消息含3个数据点,即30000数据点/秒;
- PostgreSQL数据库;
- 内存队列。
实例:AWS t3.medium(2 vCPU Intel、4 GiB、EBS GP3)
让我们用10倍消息速率压测这台小实例! 目的是展示不当平台配置的案例,帮助社区避免错误部署决策。
我们生成消息速率尖峰。CPU和磁盘将无法处理所有消息。 会产生一定延迟。观察内存内情况及内存队列洪峰带来的后果。
启动性能测试工具
根据说明使用下述Docker命令启动性能测试工具。
1
2
3
4
5
6
7
8
9
10
11
# Put your ThingsBoard private IP address here, assuming both ThingsBoard and performance tests EC2 instances are in same VPC.
export TB_INTERNAL_IP=172.31.16.229
docker run -it --rm --network host --name tb-perf-test \
  --env REST_URL=http://$TB_INTERNAL_IP:8080 \
  --env MQTT_HOST=$TB_INTERNAL_IP \
  --env DEVICE_END_IDX=5000 \
  --env MESSAGES_PER_SECOND=10000 \
  --env ALARMS_PER_SECOND=10 \
  --env DURATION_IN_SECONDS=86400 \
  --env DEVICE_CREATE_ON_START=false \
  thingsboard/tb-ce-performance-test:3.3.3
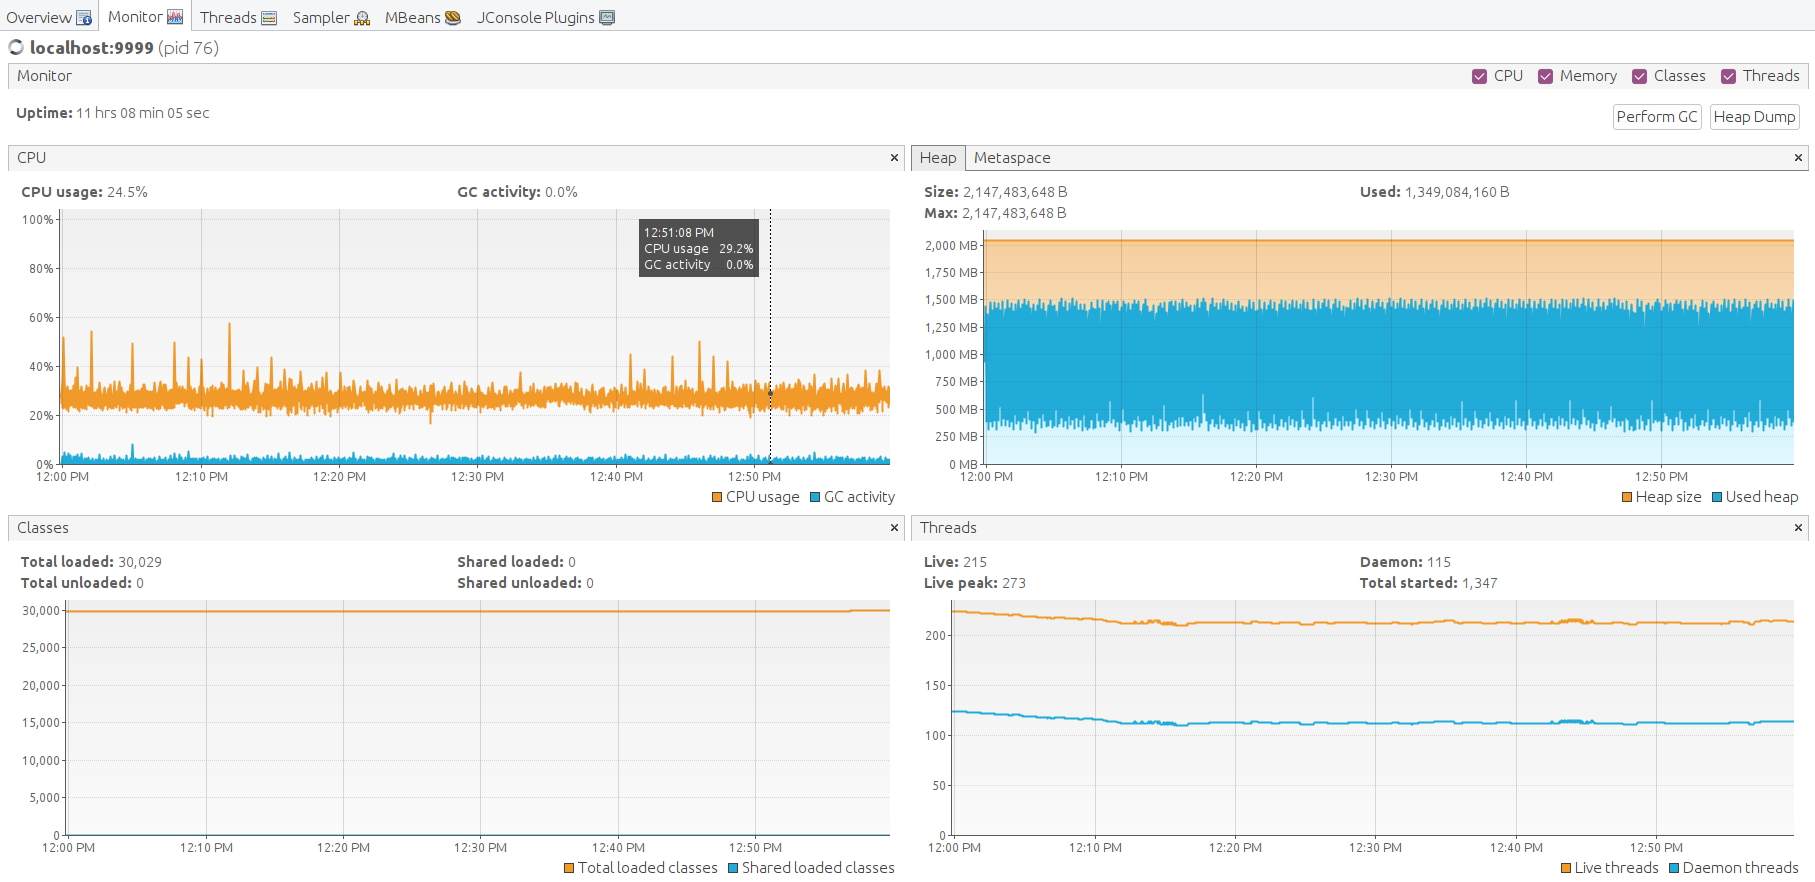
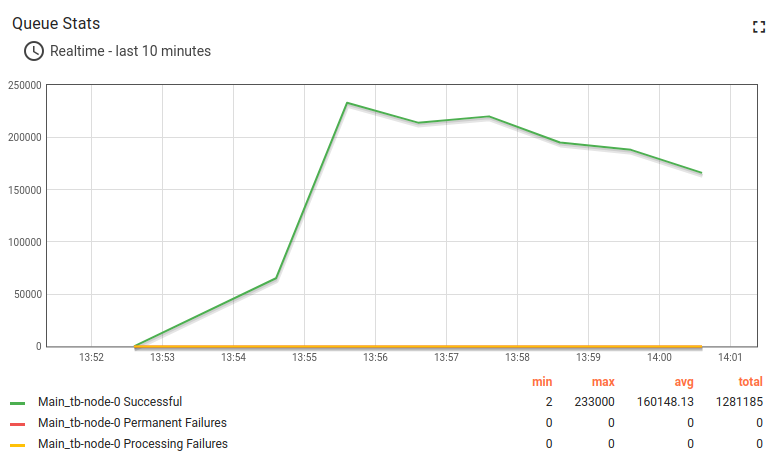
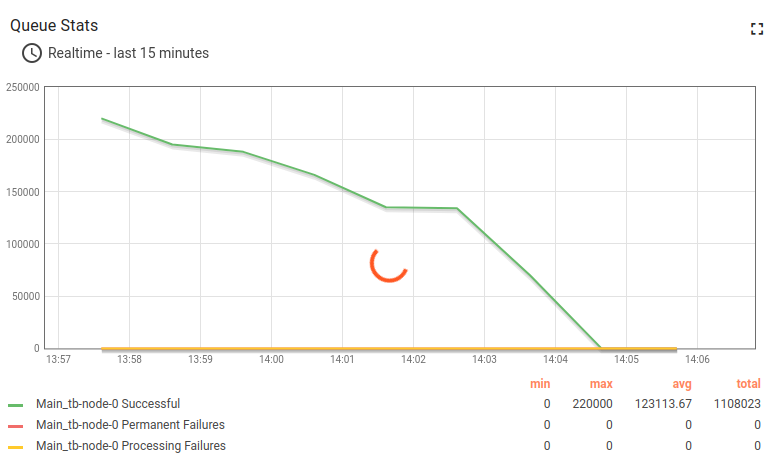
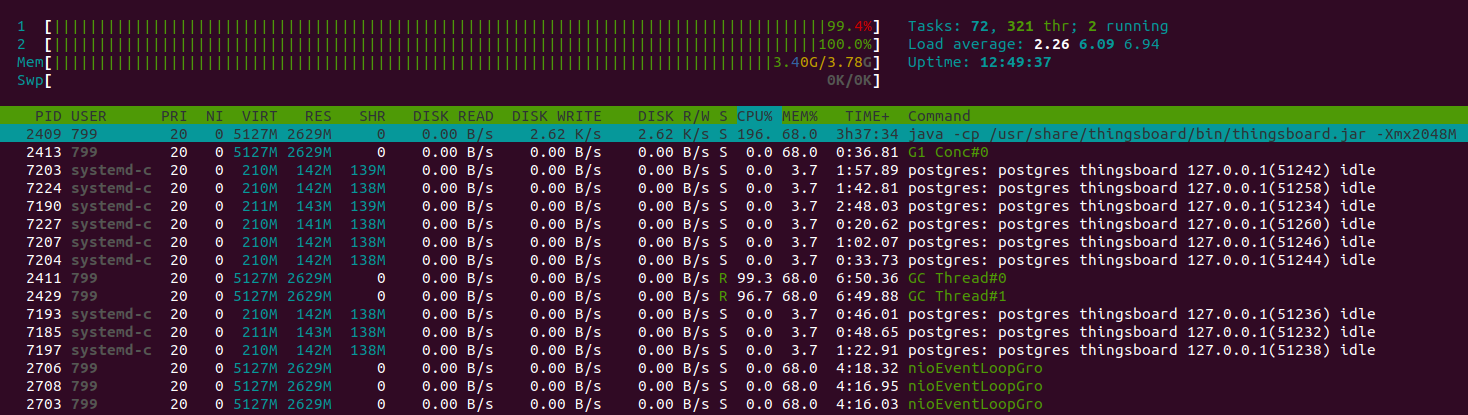
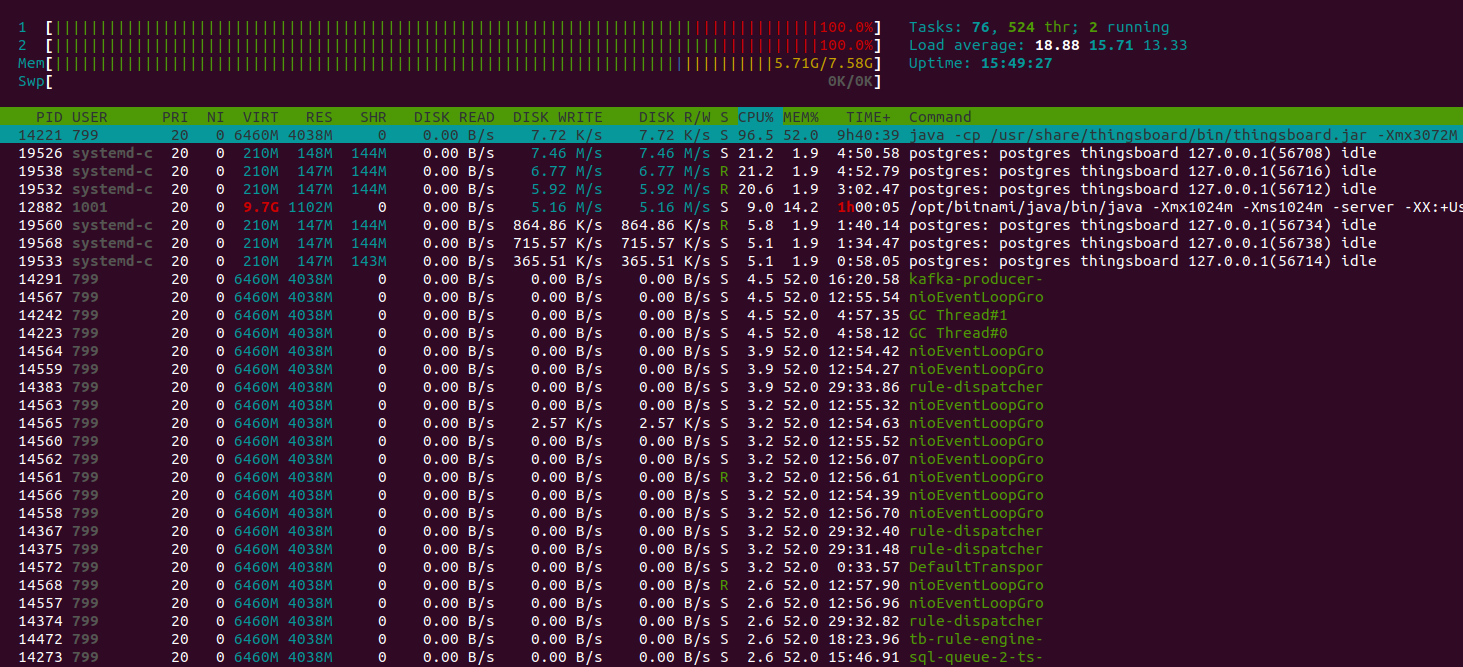
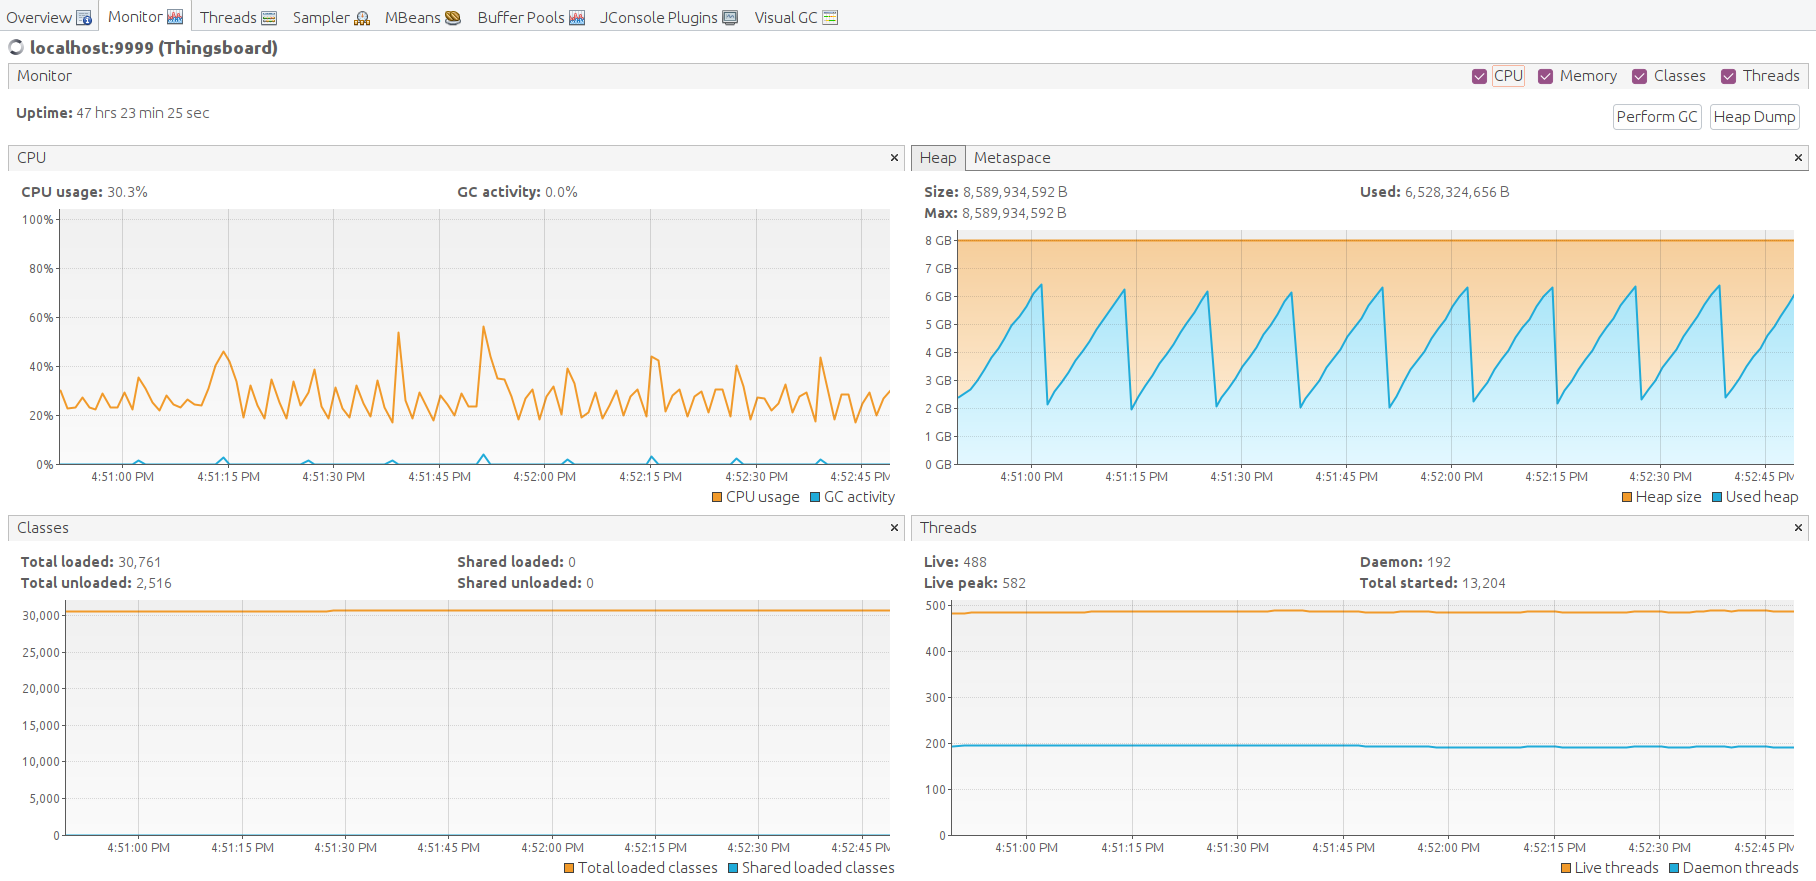
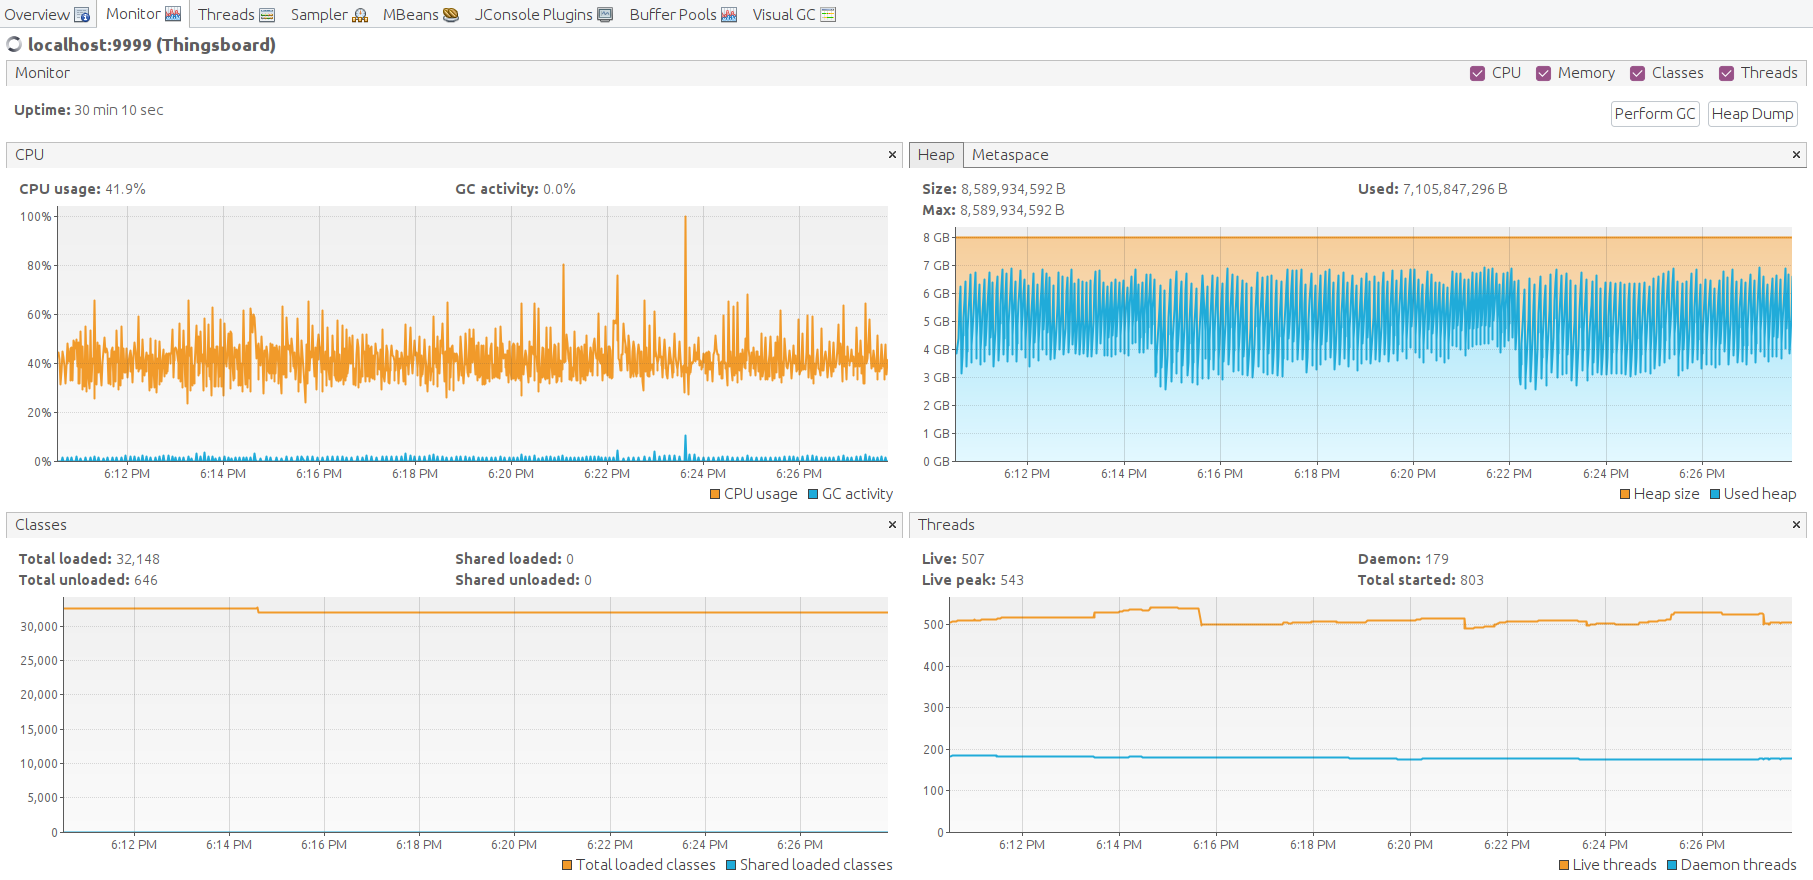
起初系统看起来忙碌但仍可响应。
随后实例内存不足,整体性能下降。
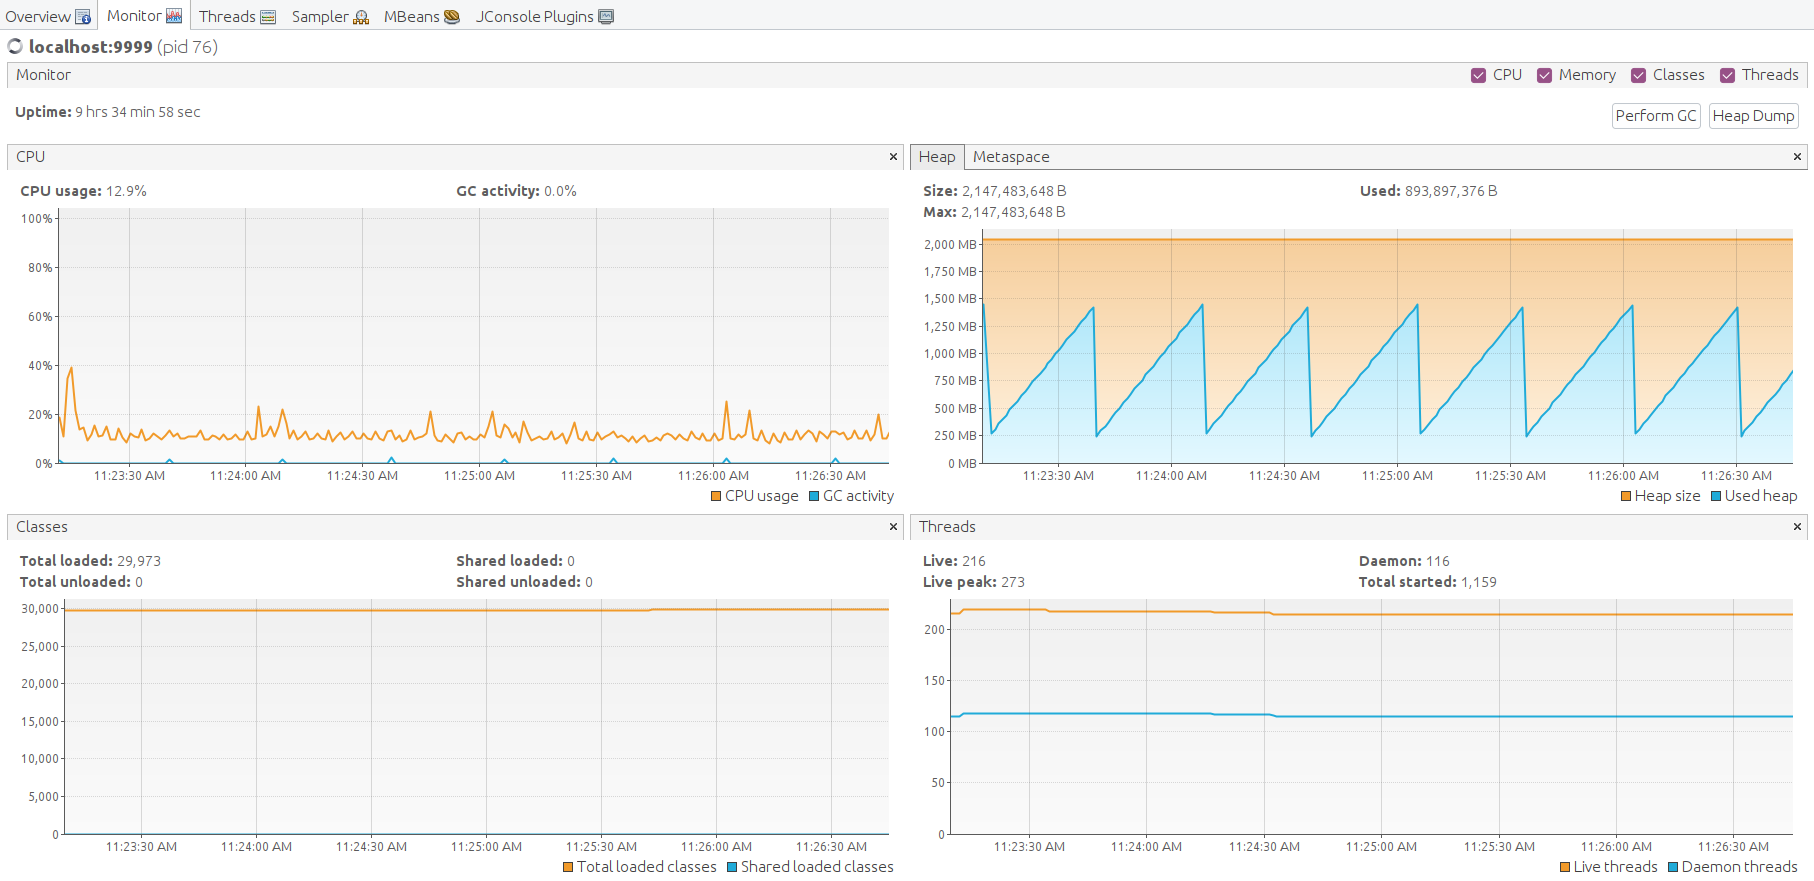
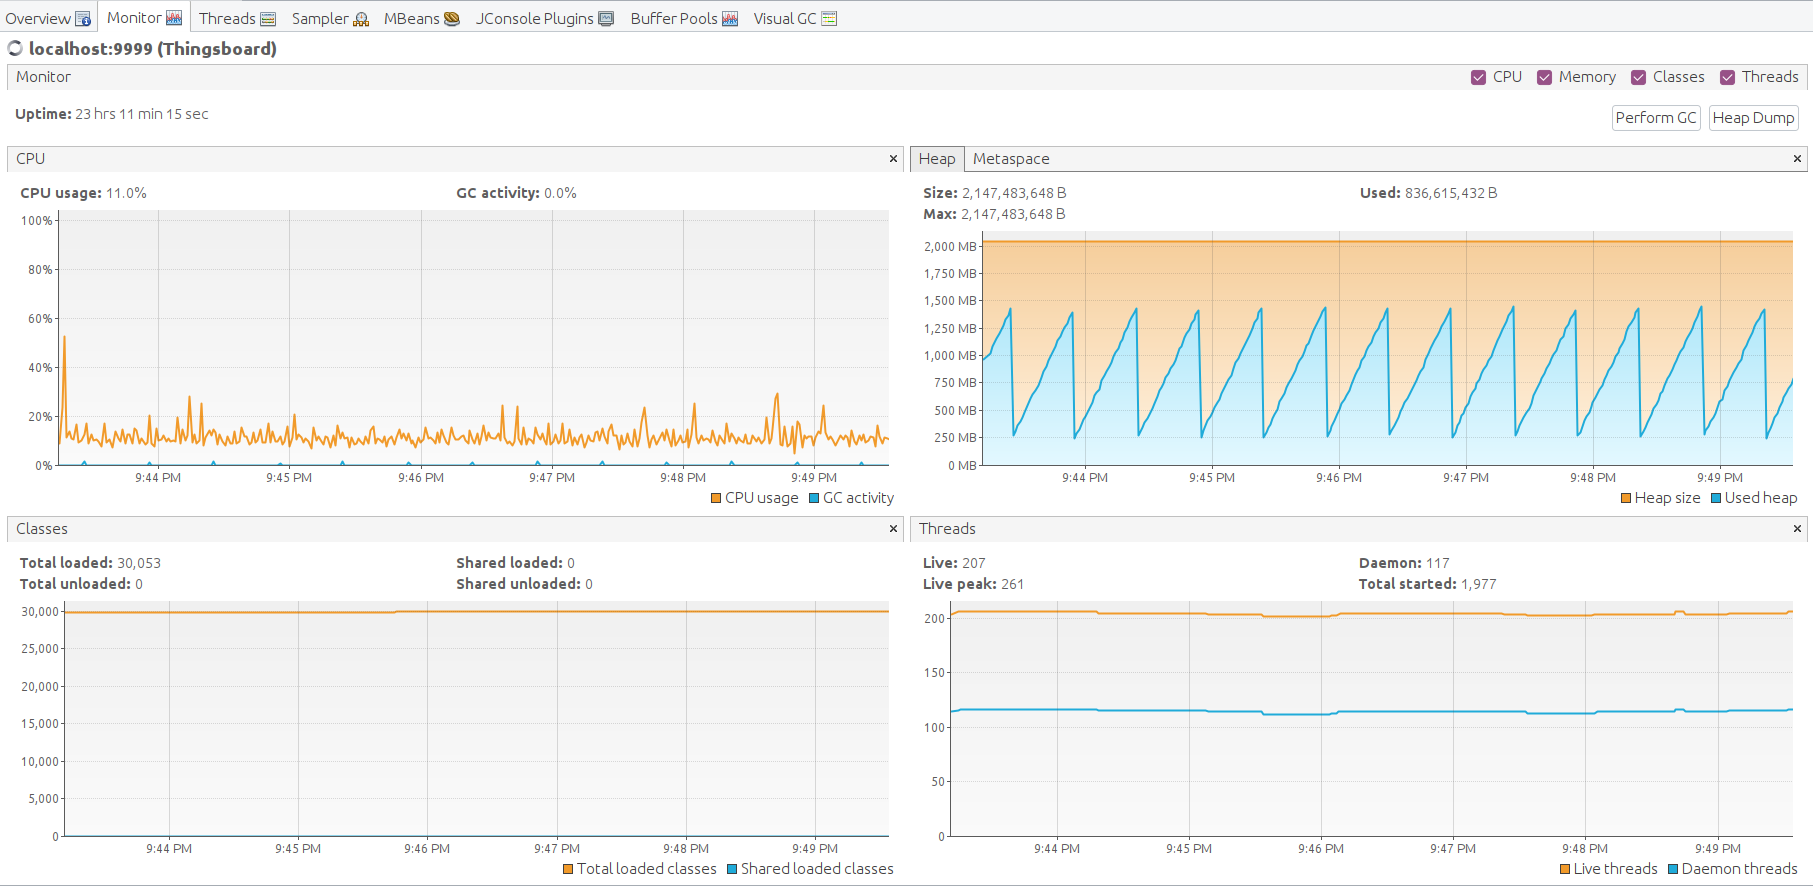
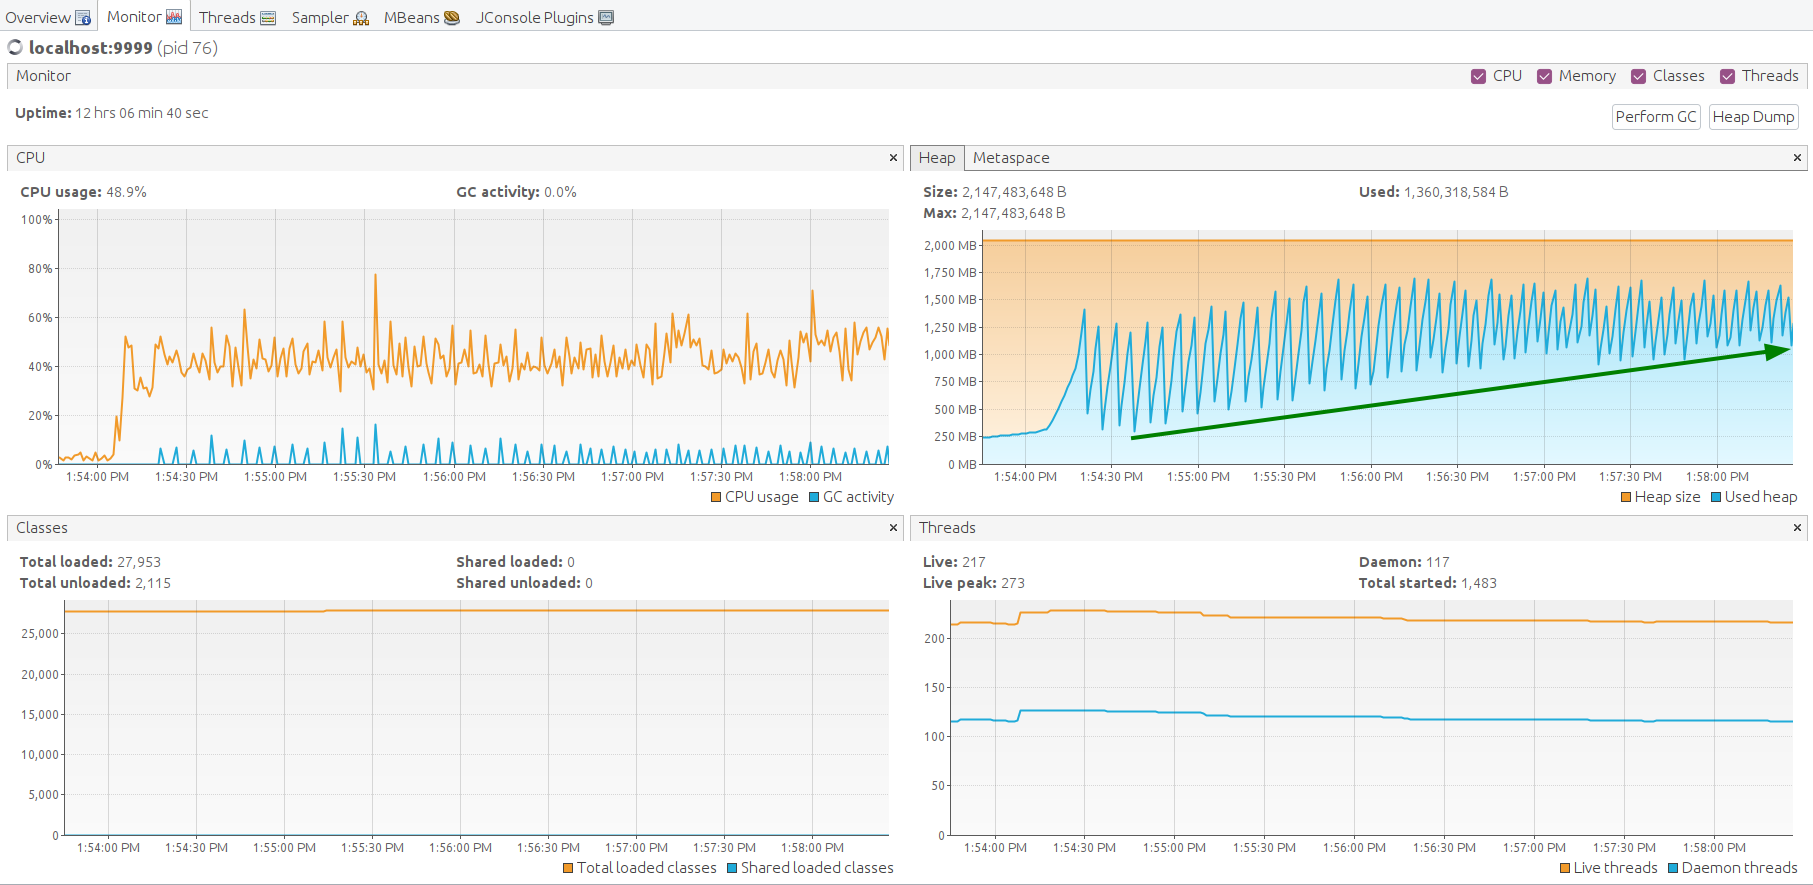
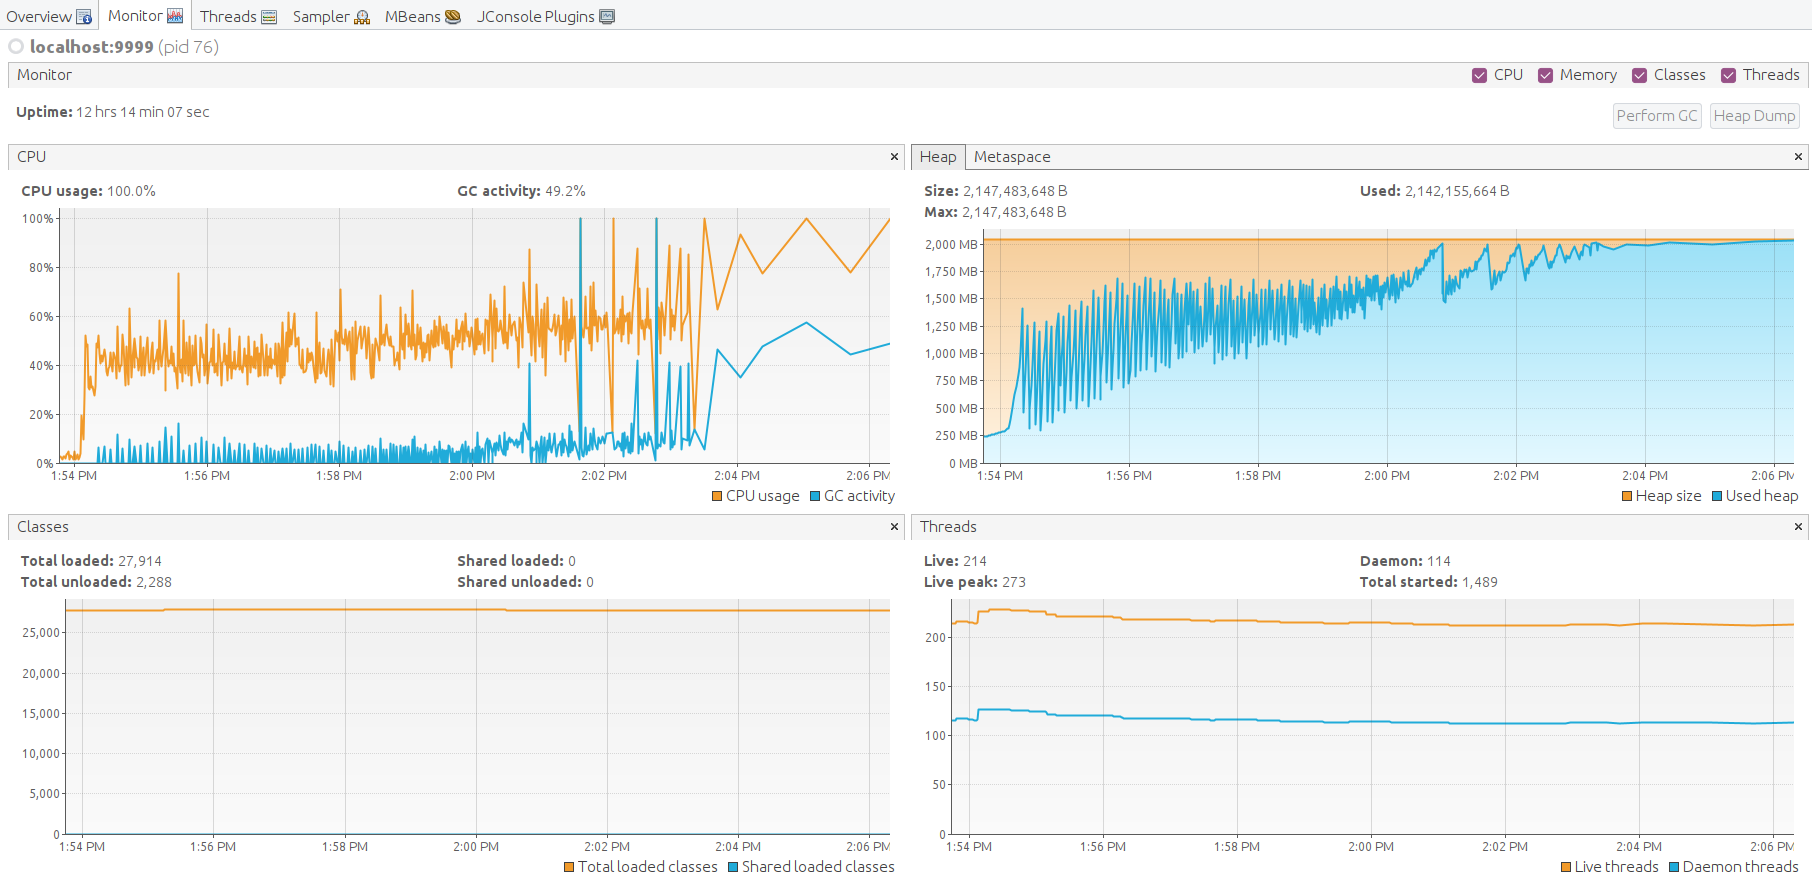
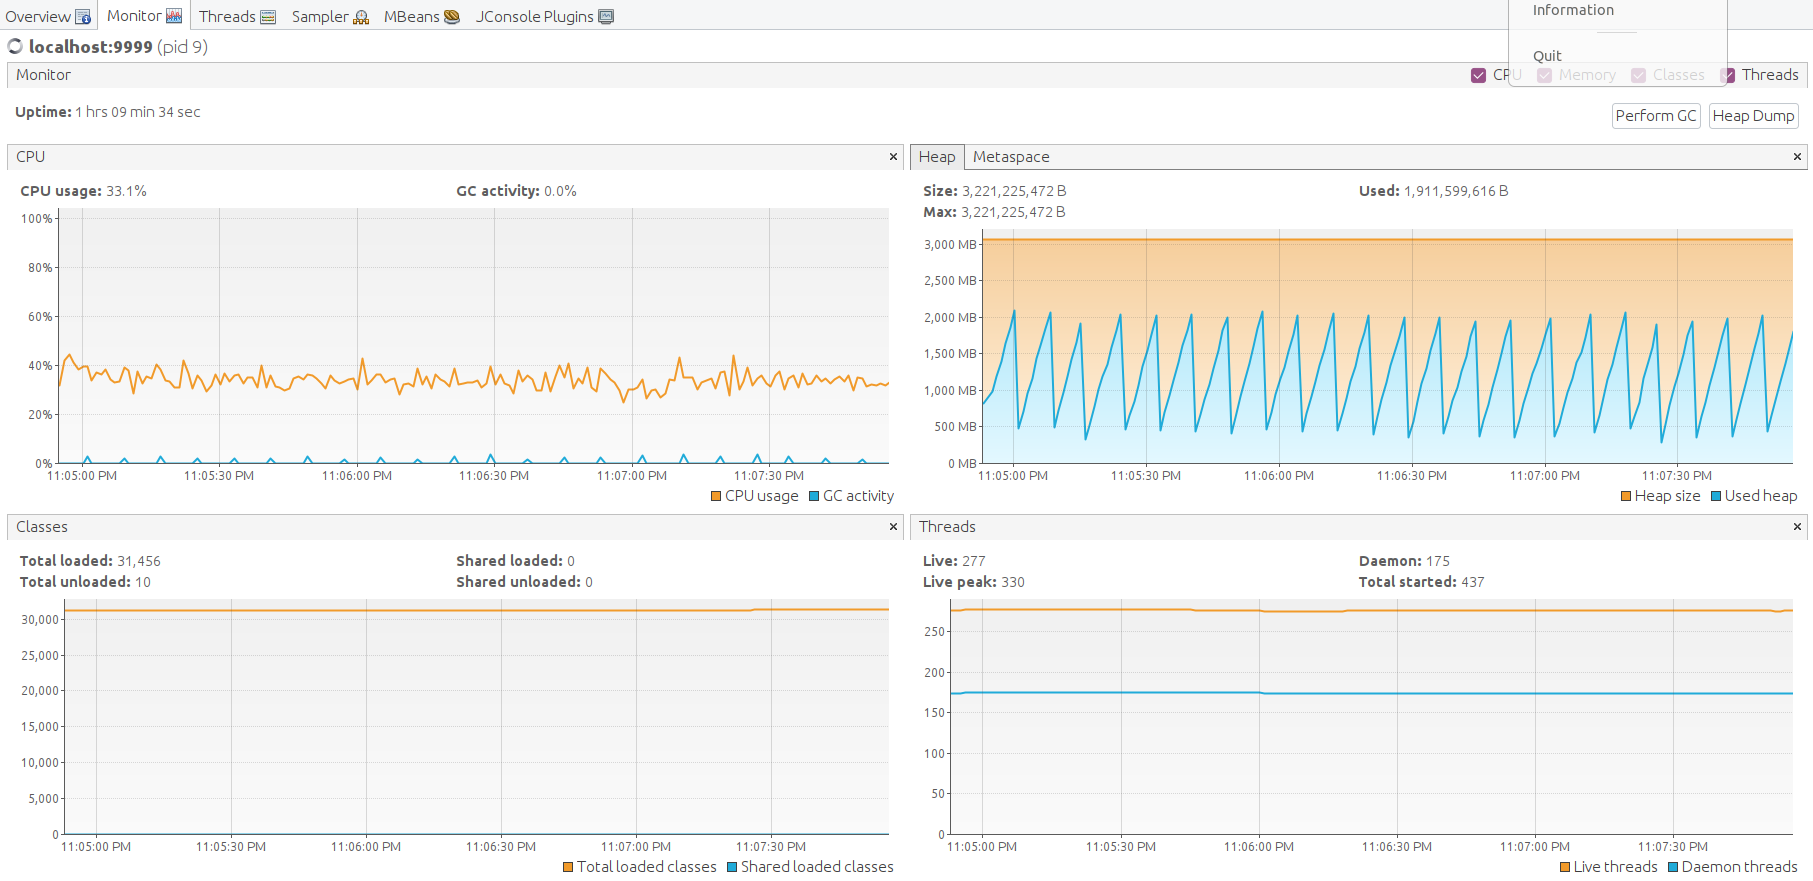
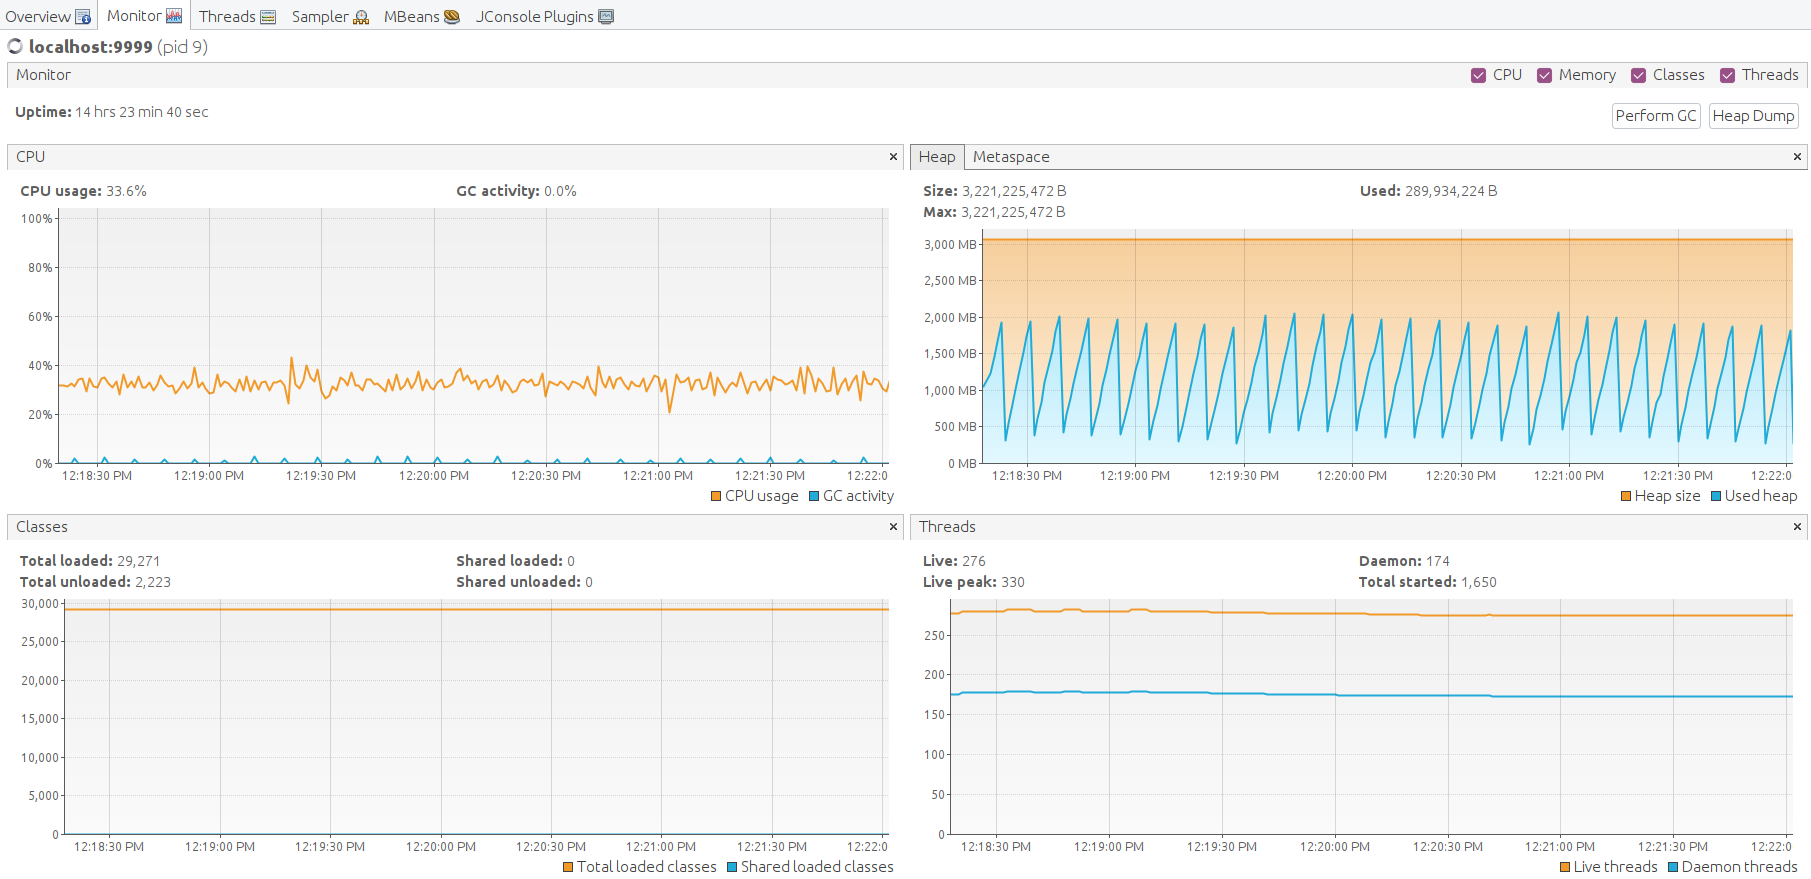
JMX监控显示堆内存使用持续增长。
约10分钟后内存耗尽,系统无响应。
队列统计归零且不再响应。
CPU仍处于100%负载,但主要消耗在垃圾回收上。
JMX VisualVM监控展示系统因内存不足而崩溃的过程。
约3分钟后系统将故障。
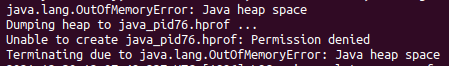
为何会发生?
根本原因是使用内存队列。 未处理的消息全部存于内存,最终导致系统内存耗尽。
有解决方案吗?有!建议使用持久化队列使系统更可靠、更能应对峰值。Kafka是不错选择。
详见Scenario B。
Kafka + Postgres性能
场景B {: #scenario-b }
负载配置:
- 5000台设备;
- 通过MQTT 5000条消息/秒,每条消息含3个数据点,即15000数据点/秒;
- PostgreSQL数据库;
- Kafka队列。
实例:AWS m6a.large(2 vCPU AMD EPYC 3rd、8 GiB、EBS GP3)
预估成本:42 USD EC2 + 8 USD EBS GP3 100GB = 50 USD/月,遥测磁盘空间可能产生额外费用。
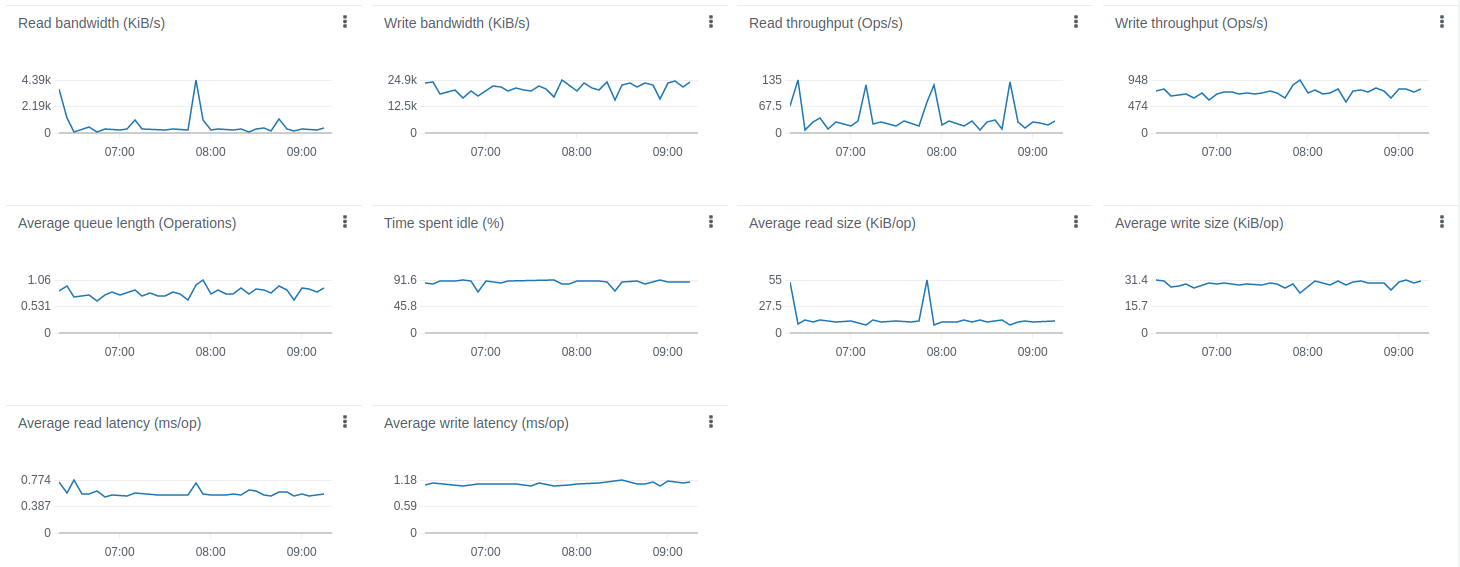
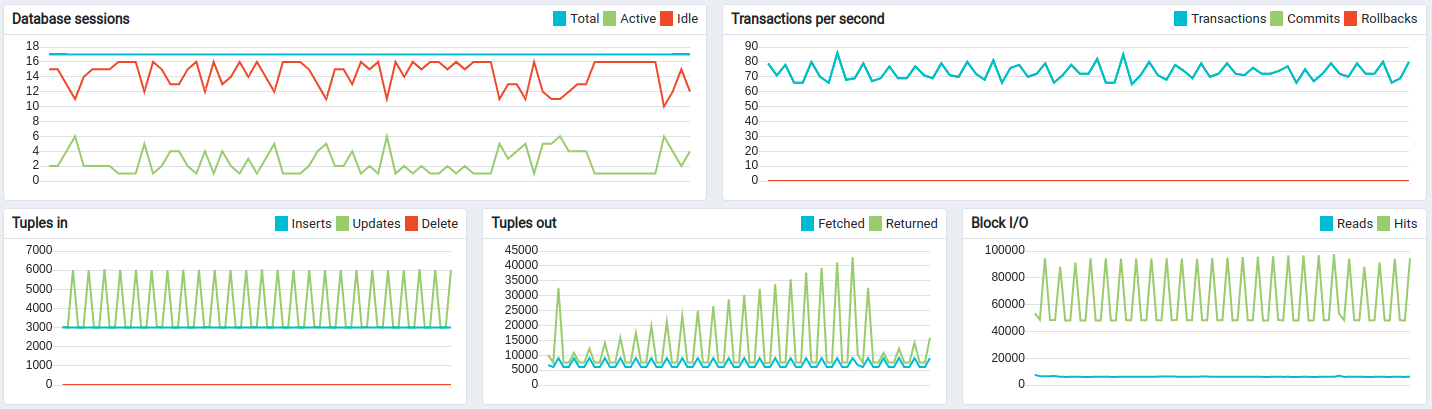
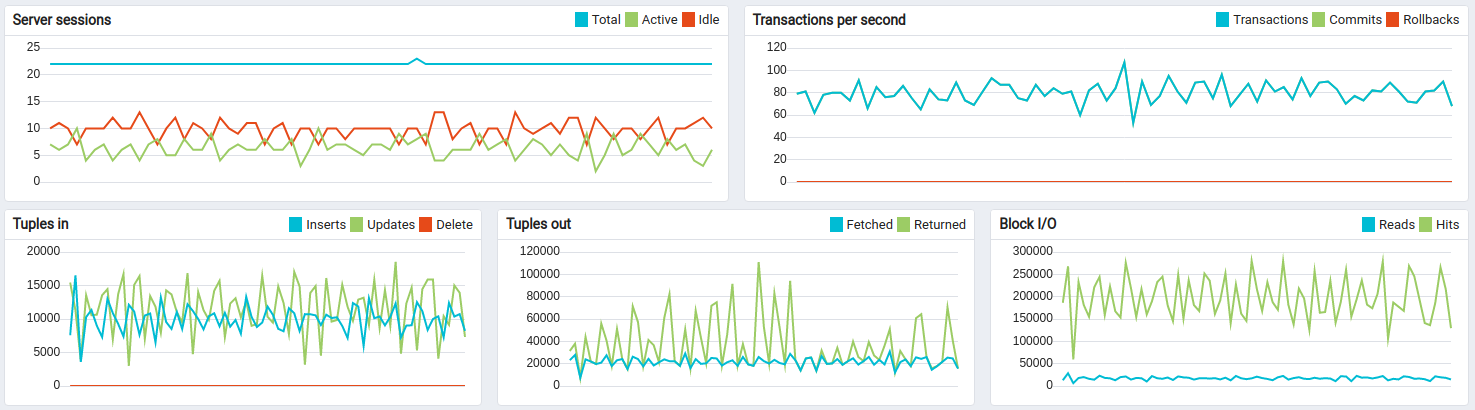
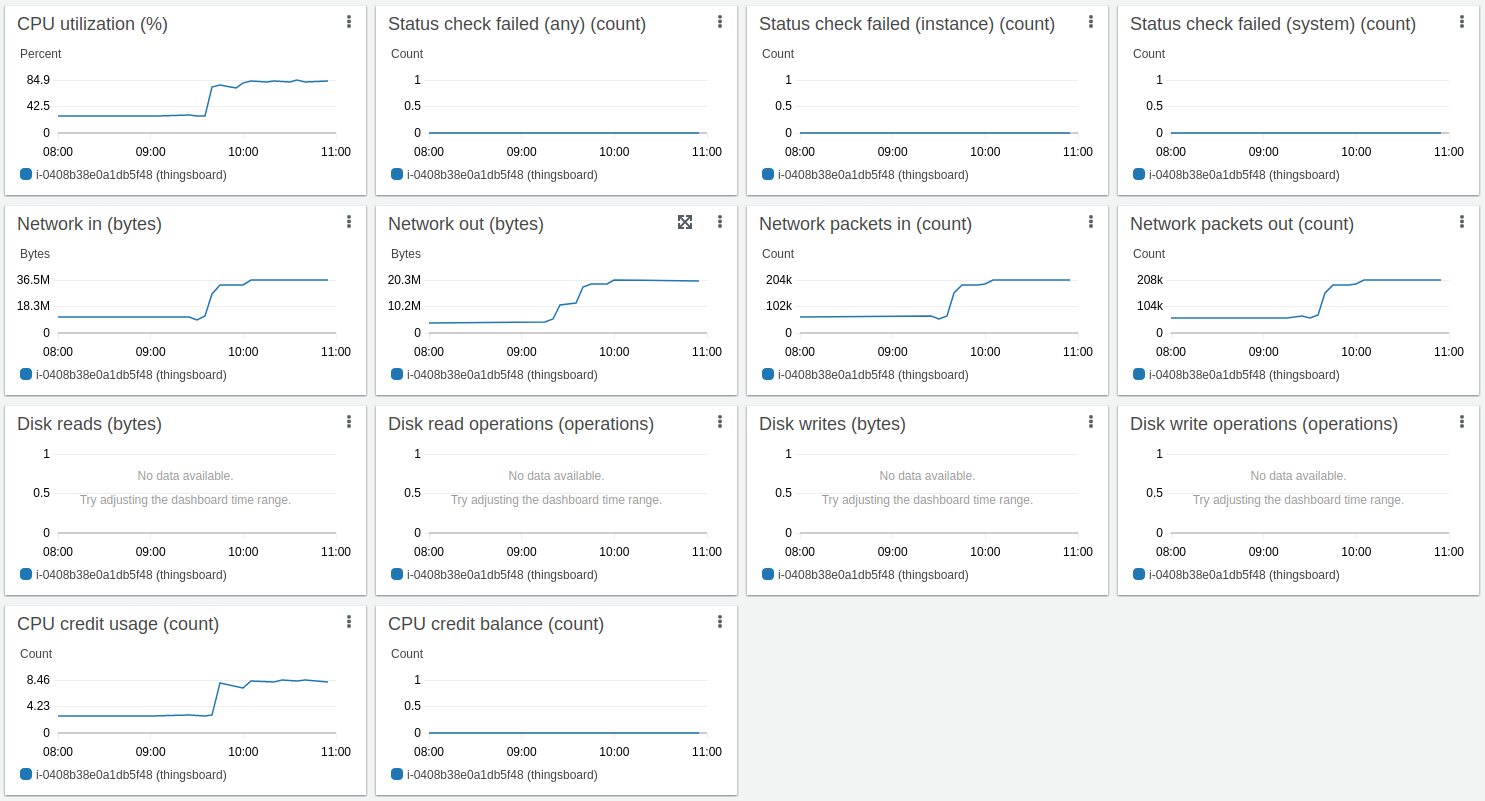
Kafka + Postgres测试结果:

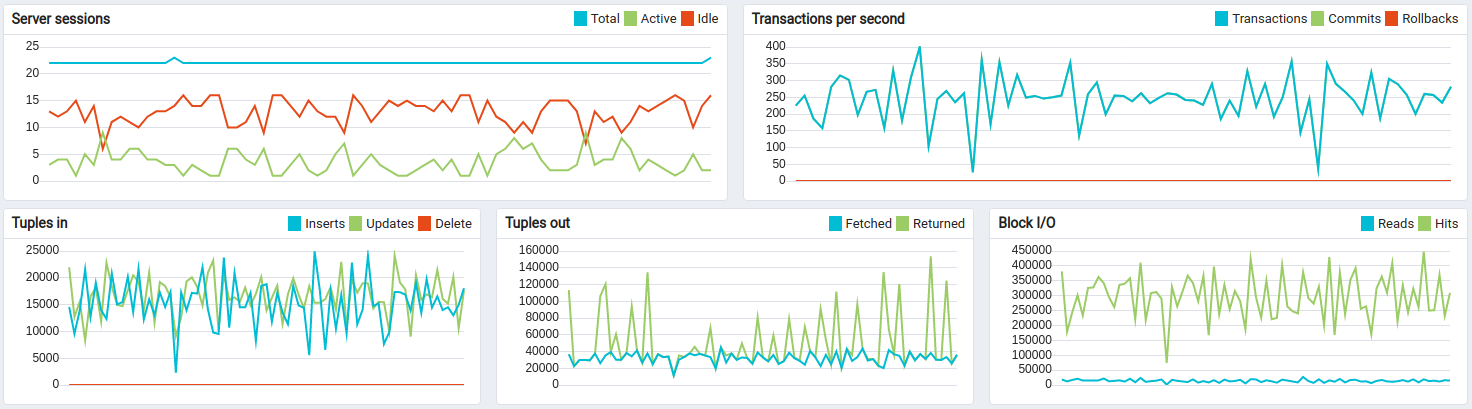
约14小时长期运行结果:
经验总结
Kafka的CPU和磁盘IO开销相对于Postgres和ThingsBoard的CPU消耗很小。 默认配置下内存占用约1G,可轻松针对更小实例调整。 持久化队列对承受峰值负载至关重要。
此为高负载配置,处理15000数据点/秒时CPU平均利用率达95%。 适用于最高10000数据点/秒的配置,峰值可达60000数据点/秒(见下一测试)。
注:若需处理自定义规则链、渲染仪表板并稳定维持5000条消息/秒,必须增加CPU资源。
如何复现测试:
在AWS EC2上配置ThingsBoard实例
注意:当前运行Kafka需要Zookeeper。 根据说明在AWS EC2实例上配置 ThingsBoard + PostgreSQL + Zookeeper + Kafka 的docker-compose文件如下。
1
2
3
4
5
6
7
8
9
10
11
12
13
14
15
16
17
18
19
20
21
22
23
24
25
26
27
28
29
30
31
32
33
34
35
36
37
38
39
40
41
42
43
44
45
46
47
48
49
50
51
52
53
54
55
56
57
58
59
60
61
62
63
version: '3.0'
services:
  zookeeper:
    image: bitnamilegacy/zookeeper:3.7
    network_mode: "host"
    restart: "always"
    volumes:
      - zookeeper:/bitnami
    environment:
      ALLOW_ANONYMOUS_LOGIN: "yes"
      ZOO_ENABLE_ADMIN_SERVER: "no"
      JVMFLAGS: "-Xmx128m -Xms128m -Dcom.sun.management.jmxremote -Dcom.sun.management.jmxremote.port=9199 -Dcom.sun.management.jmxremote.rmi.port=9199  -Dcom.sun.management.jmxremote.authenticate=false -Dcom.sun.management.jmxremote.ssl=false -Djava.rmi.server.hostname=127.0.0.1"
  kafka:
    image: bitnamilegacy/kafka:3
    network_mode: "host"
    restart: "always"
    volumes:
      - kafka:/bitnami
    environment:
      - KAFKA_CFG_ZOOKEEPER_CONNECT=localhost:2181
      - ALLOW_PLAINTEXT_LISTENER=yes
    depends_on:
      - zookeeper
  postgres:
    image: "postgres:14"
    network_mode: "host"
    restart: "always"
    volumes:
      - postgres:/var/lib/postgresql/data
    environment:
      POSTGRES_DB: "thingsboard"
      POSTGRES_PASSWORD: "postgres"
  tb:
    depends_on:
      - postgres
      - kafka
    image: "thingsboard/tb"
    network_mode: "host"
    restart: "always"
    volumes:
      - thingsboard-data:/data
      - thingsboard-logs:/var/log/thingsboard
    environment:
      DATABASE_TS_TYPE: "sql"
      TB_QUEUE_TYPE: "kafka"
      TB_KAFKA_BATCH_SIZE: "65536" # default is 16384 - it helps to produce messages much efficiently
      TB_KAFKA_LINGER_MS: "5" # default is 1
      TB_QUEUE_KAFKA_MAX_POLL_RECORDS: "2048" # default is 8192
      TB_SERVICE_ID: "tb-node-0"
      HTTP_BIND_PORT: "8080"
      TB_QUEUE_RE_MAIN_PACK_PROCESSING_TIMEOUT_MS: "30000"
      # Postgres connection
      SPRING_DATASOURCE_URL: "jdbc:postgresql://localhost:5432/thingsboard"
      SPRING_DATASOURCE_USERNAME: "postgres"
      SPRING_DATASOURCE_PASSWORD: "postgres"
      # Java options for 8G instance and JMX enabled
      JAVA_OPTS: " -Xmx3072M -Xms3072M -Dcom.sun.management.jmxremote -Dcom.sun.management.jmxremote.port=9999 -Dcom.sun.management.jmxremote.rmi.port=9999 -Dcom.sun.management.jmxremote.authenticate=false -Dcom.sun.management.jmxremote.ssl=false -Djava.rmi.server.hostname=127.0.0.1"
volumes: # to persist data between container restarts or being recreated
  kafka:
  zookeeper:
  postgres:
  thingsboard-data:
  thingsboard-logs:
启动性能测试工具
根据说明使用下述Docker命令启动性能测试工具。
1
2
3
4
5
6
7
8
9
10
11
# Put your ThingsBoard private IP address here, assuming both ThingsBoard and performance tests EC2 instances are in same VPC.
export TB_INTERNAL_IP=172.31.16.229
docker run -it --rm --network host --name tb-perf-test \
  --env REST_URL=http://$TB_INTERNAL_IP:8080 \
  --env MQTT_HOST=$TB_INTERNAL_IP \
  --env DEVICE_END_IDX=5000 \
  --env MESSAGES_PER_SECOND=5000 \
  --env ALARMS_PER_SECOND=50 \
  --env DURATION_IN_SECONDS=86400 \
  --env DEVICE_CREATE_ON_START=true \
  thingsboard/tb-ce-performance-test:3.3.3
x3峰值负载生存测试
负载配置:
- 5000台设备;
- 通过MQTT 15000条消息/秒,每条消息含3个数据点,即45000数据点/秒;
- PostgreSQL数据库;
- Kafka队列。
实例:AWS m6a.large(2 vCPU AMD EPYC 3rd、8 GiB、EBS GP3)
进行压力测试,观察Kafka如何为运行带来稳定性。
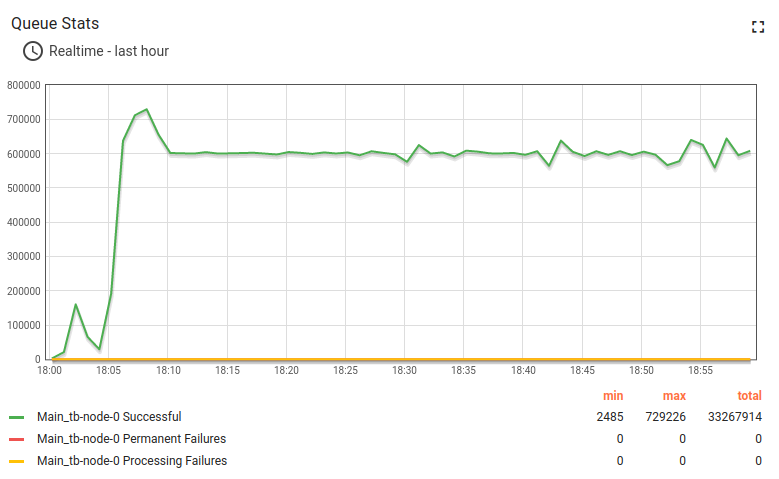
测试执行统计:

可见CPU利用率达100%,系统过载。但所有未处理消息均存于Kafka,将最终由规则引擎处理。
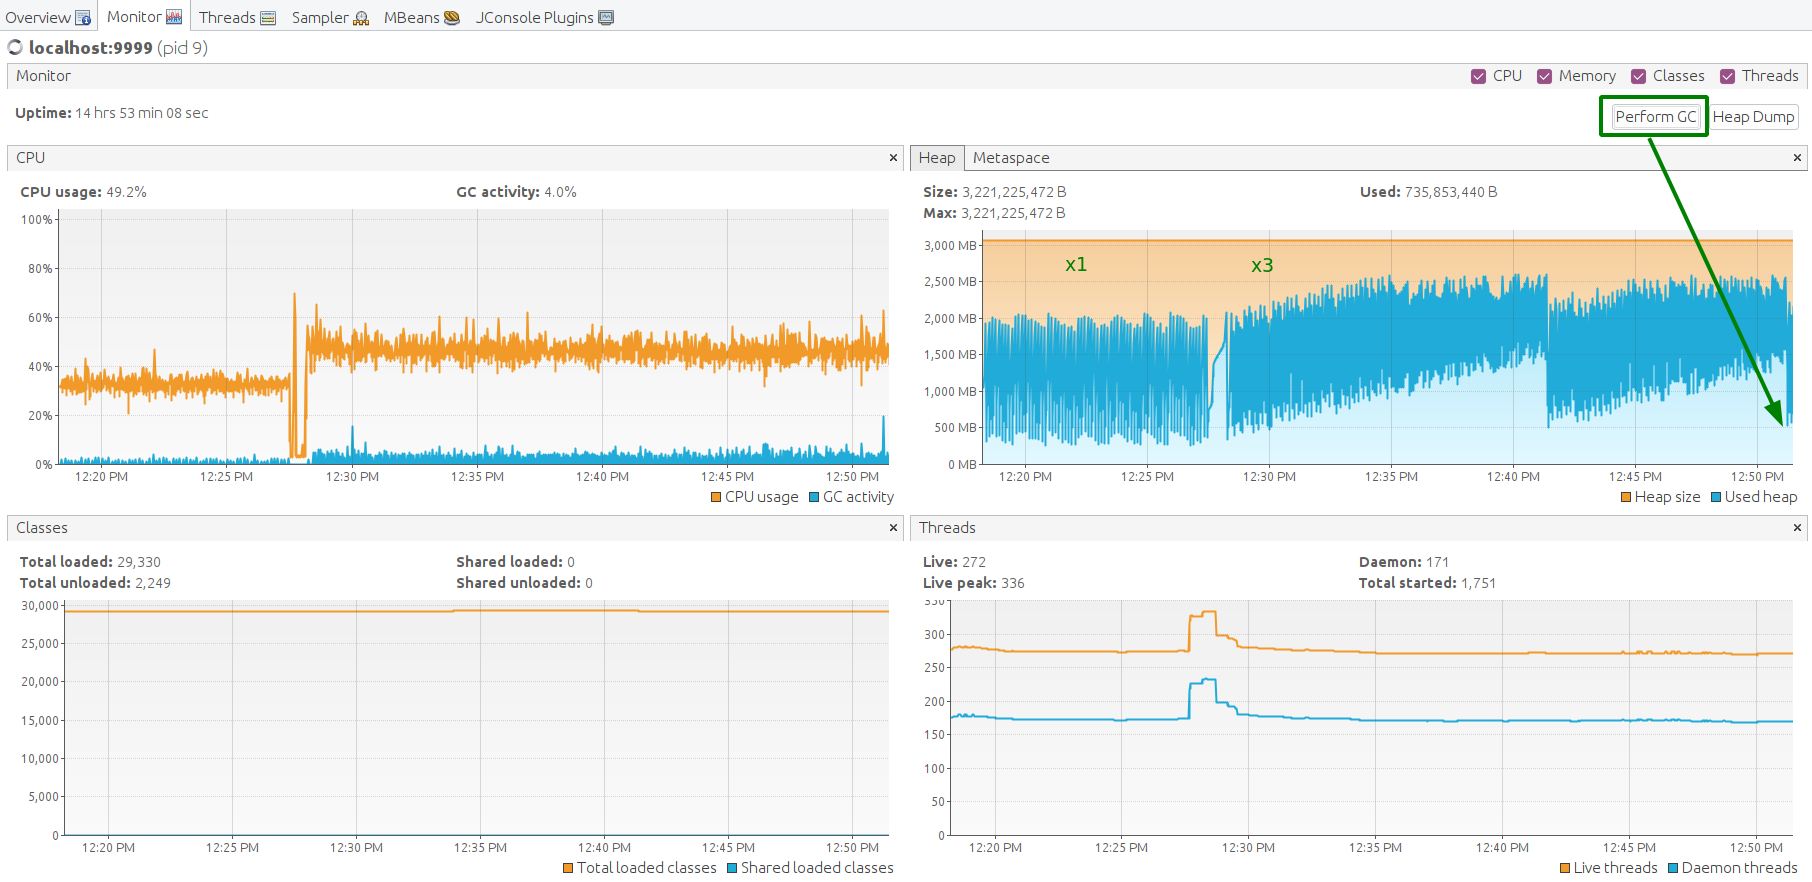
Java虚拟机运行良好,堆内存空间充足。手动执行垃圾回收以观察内存消耗最低点。 空闲内存水平回落至平均值,结果良好。
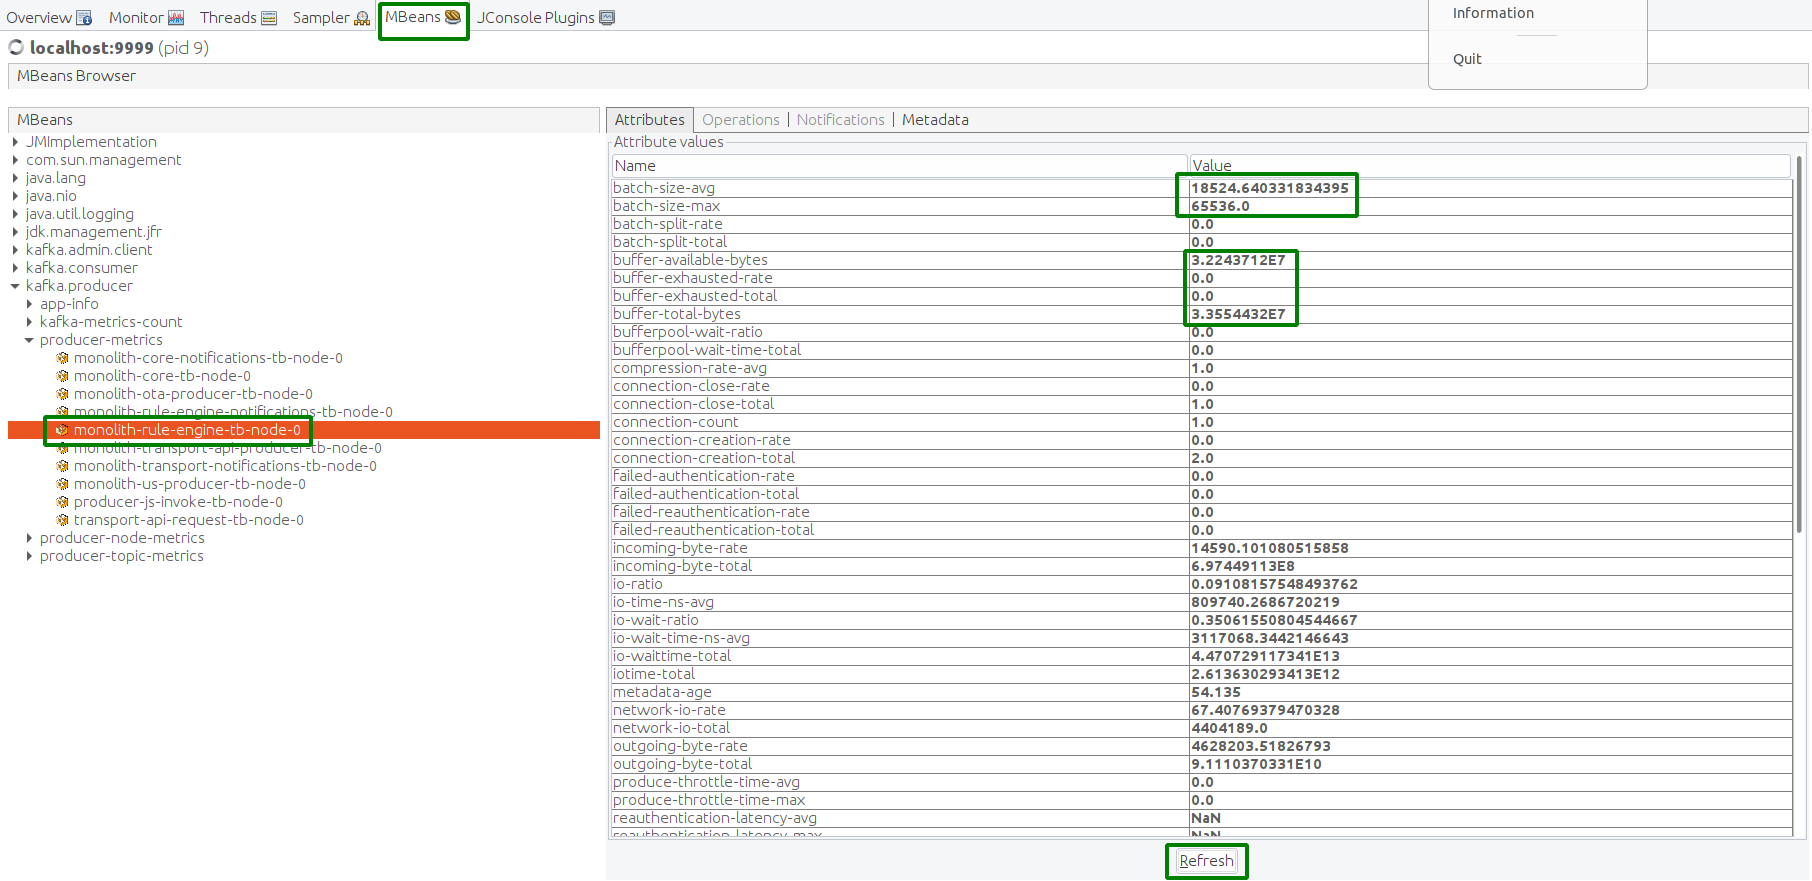
另一种确认稳定运行的方式是通过JMX MBean检查Kafka producer状态。
Kafka Lag正在累积,表示规则引擎处理速度低于入站消息速率。
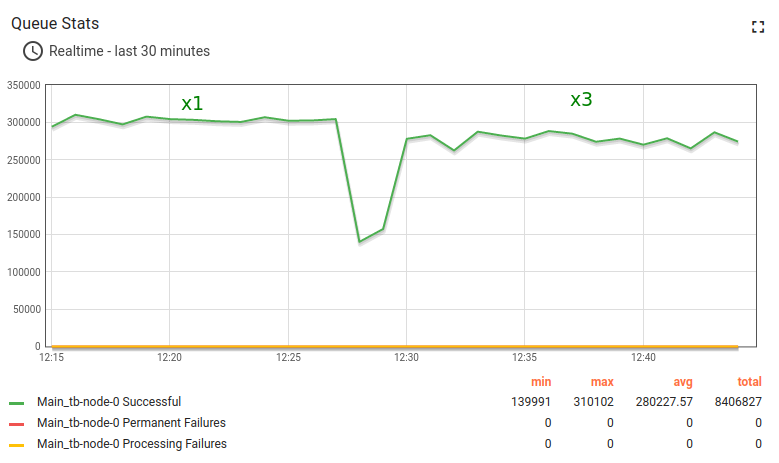

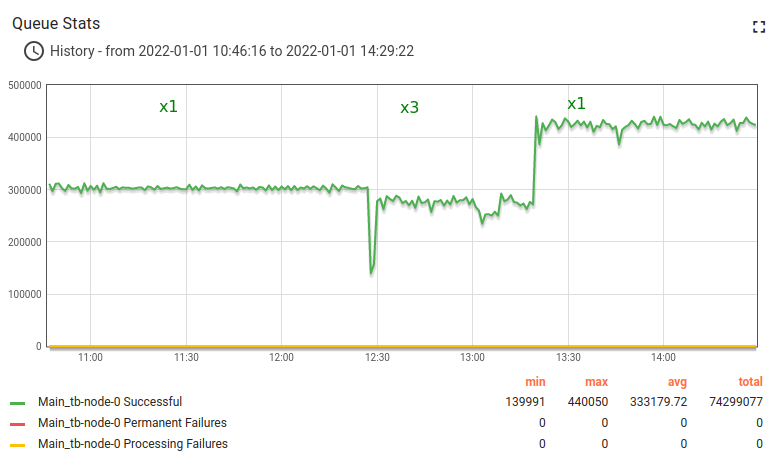
现在停止x3测试,约1分钟内恢复至平均消息速率(5000条/秒)。
稍后可观察到延迟从2.8M降至1.2M,最终恢复至正常值。
启动性能测试工具
根据说明使用下述Docker命令启动性能测试工具。
1
2
3
4
5
6
7
8
9
10
11
# Put your ThingsBoard private IP address here, assuming both ThingsBoard and performance tests EC2 instances are in same VPC.
export TB_INTERNAL_IP=172.31.16.229
docker run -it --rm --network host --name tb-perf-test \
  --env REST_URL=http://$TB_INTERNAL_IP:8080 \
  --env MQTT_HOST=$TB_INTERNAL_IP
  --env DEVICE_END_IDX=5000 \
  --env MESSAGES_PER_SECOND=15000 \
  --env ALARMS_PER_SECOND=50 \
  --env DURATION_IN_SECONDS=86400 \
  --env DEVICE_CREATE_ON_START=false \
  thingsboard/tb-ce-performance-test:3.3.3
经验总结
ThingsBoard + Postgres + Kafka 是承受峰值负载的可靠方案。
尽管上述显示了最大性能,我们仍建议m6a.large实例设计为最高3k条消息/秒、10k数据点/秒。
逻辑很简单:能够应对任何峰值下约2倍的消息负载。
在生产环境中,ThingsBoard可能处理各类用户请求、运行自定义规则链并为仪表板提供Web服务。
需要更高性能时,可升级到m6a.xlarge或c6i.xlarge实例(需重启)。
另一改进途径是自定义PostgreSQL配置,提升仪表板、分析等的读查询性能。
若要更高性能,请考虑使用Cassandra。
优点:
- 可靠应对峰值负载
- 性能与可靠性成本合理
- 可纵向扩展
- 技术栈精简(Postgres、Kafka)
缺点:
- 遥测存储消耗较高,若遥测TTL为一年或无限,成本可能较高。
- 仅支持纵向扩展(更快实例、更高存储IOPS),受硬件限制且成本较高。
- 此处Kafka为单实例,消息最终持久化(未调用fsync)。Kafka崩溃时可能丢失最新消息(少见但可能)。
- 任一组件维护或故障会导致整个系统停机。
Cassandra + Kafka + Postgres性能
场景C
负载配置:
- 25000台设备;
- 通过MQTT 10000条消息/秒,每条消息含3个数据点,即30000数据点/秒;
- PostgreSQL存储实体、属性和时序数据最新值;
- Cassandra存储时序数据;
- Kafka队列。
实例:AWS m6a.2xlarge(8 vCPU AMD EPYC 3rd、32 GiB、EBS GP3)
预估成本:167 USD EC2 m6a.2xlarge + 24 USD EBS GP3 300GB = 191 USD/月。
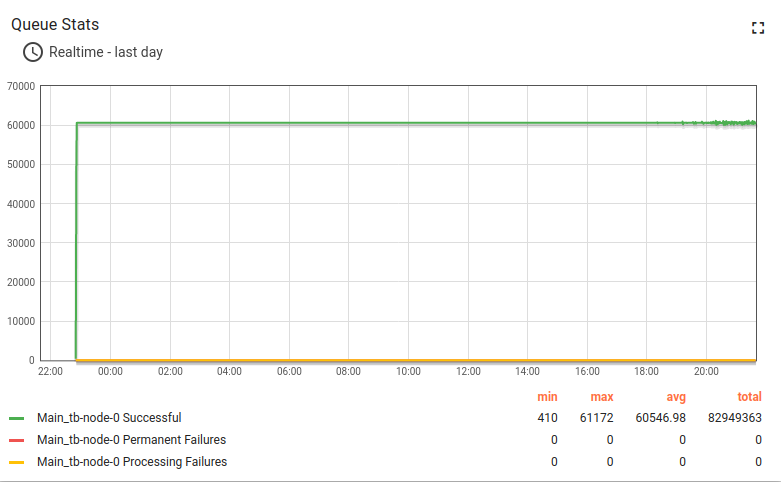
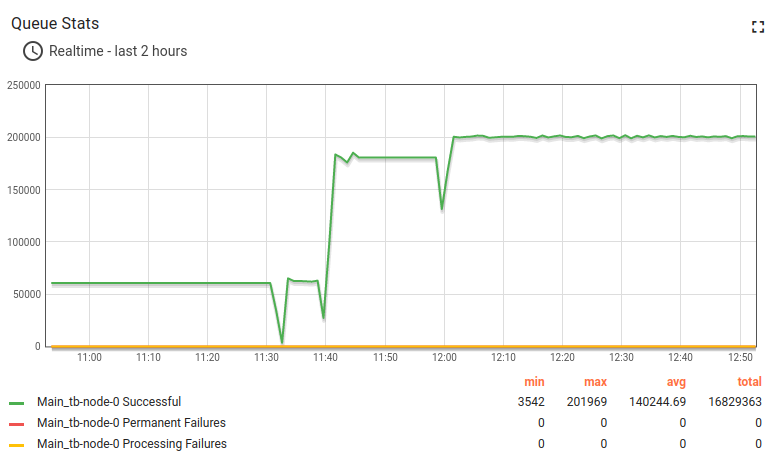
测试运行
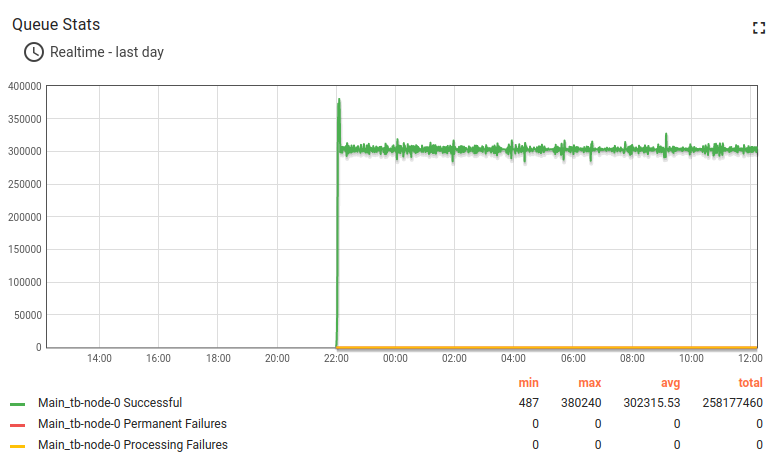
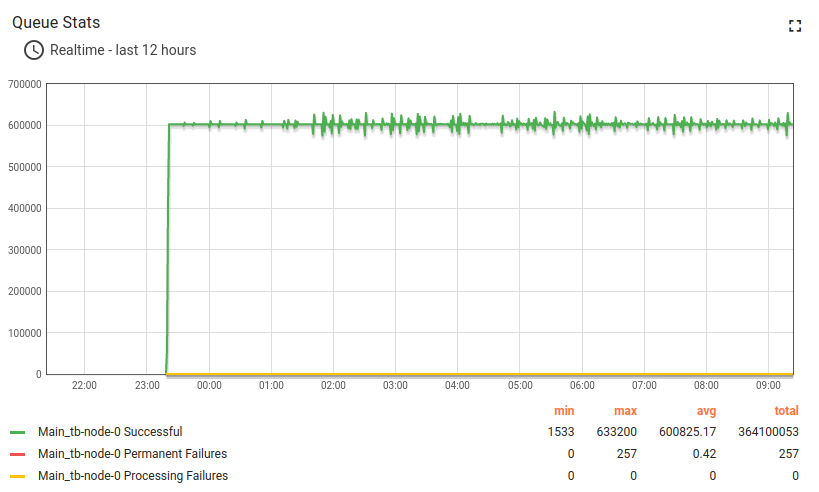
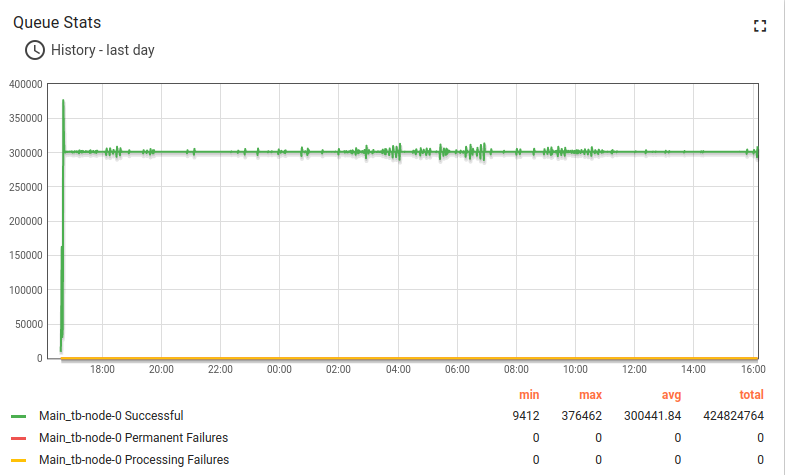
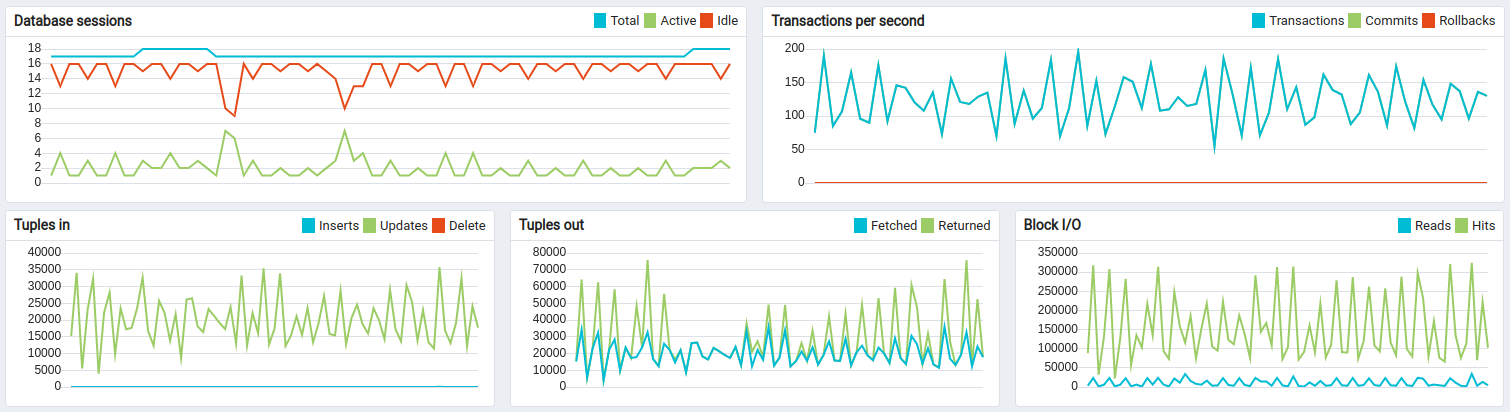
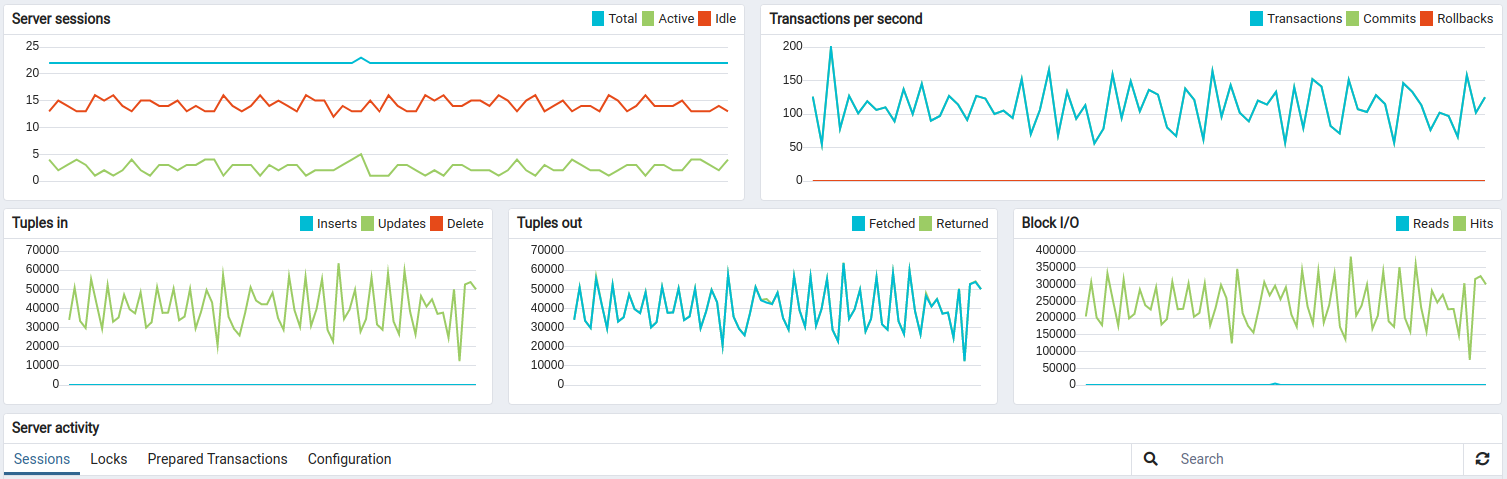
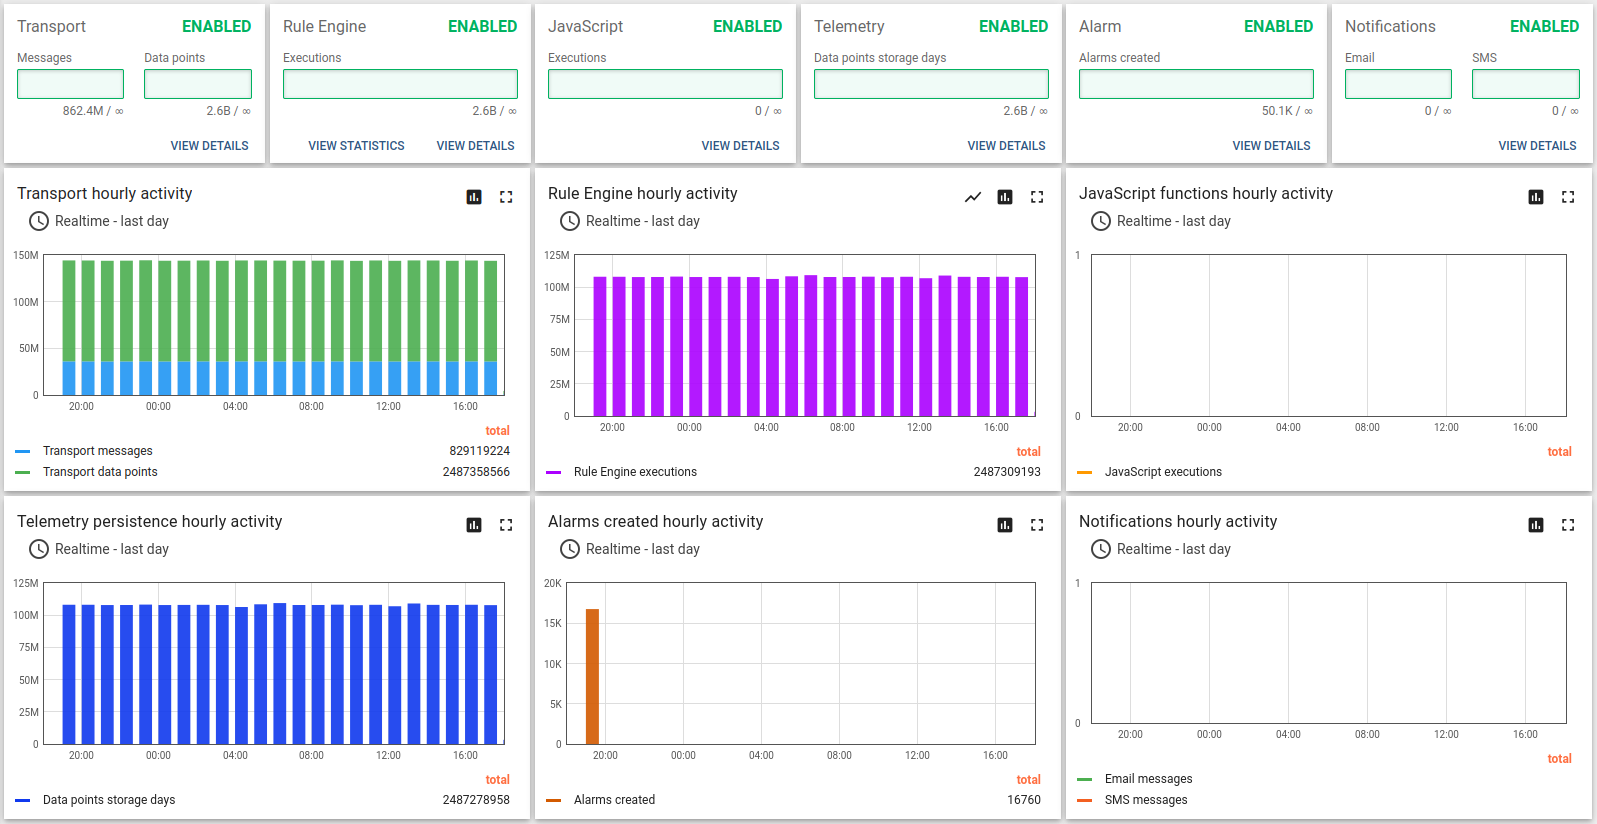
队列统计表现稳定,图表上的小幅波动为正常现象。
所有系统均需在后台运行维护,ThingsBoard单体部署中出现此类图表完全正常。
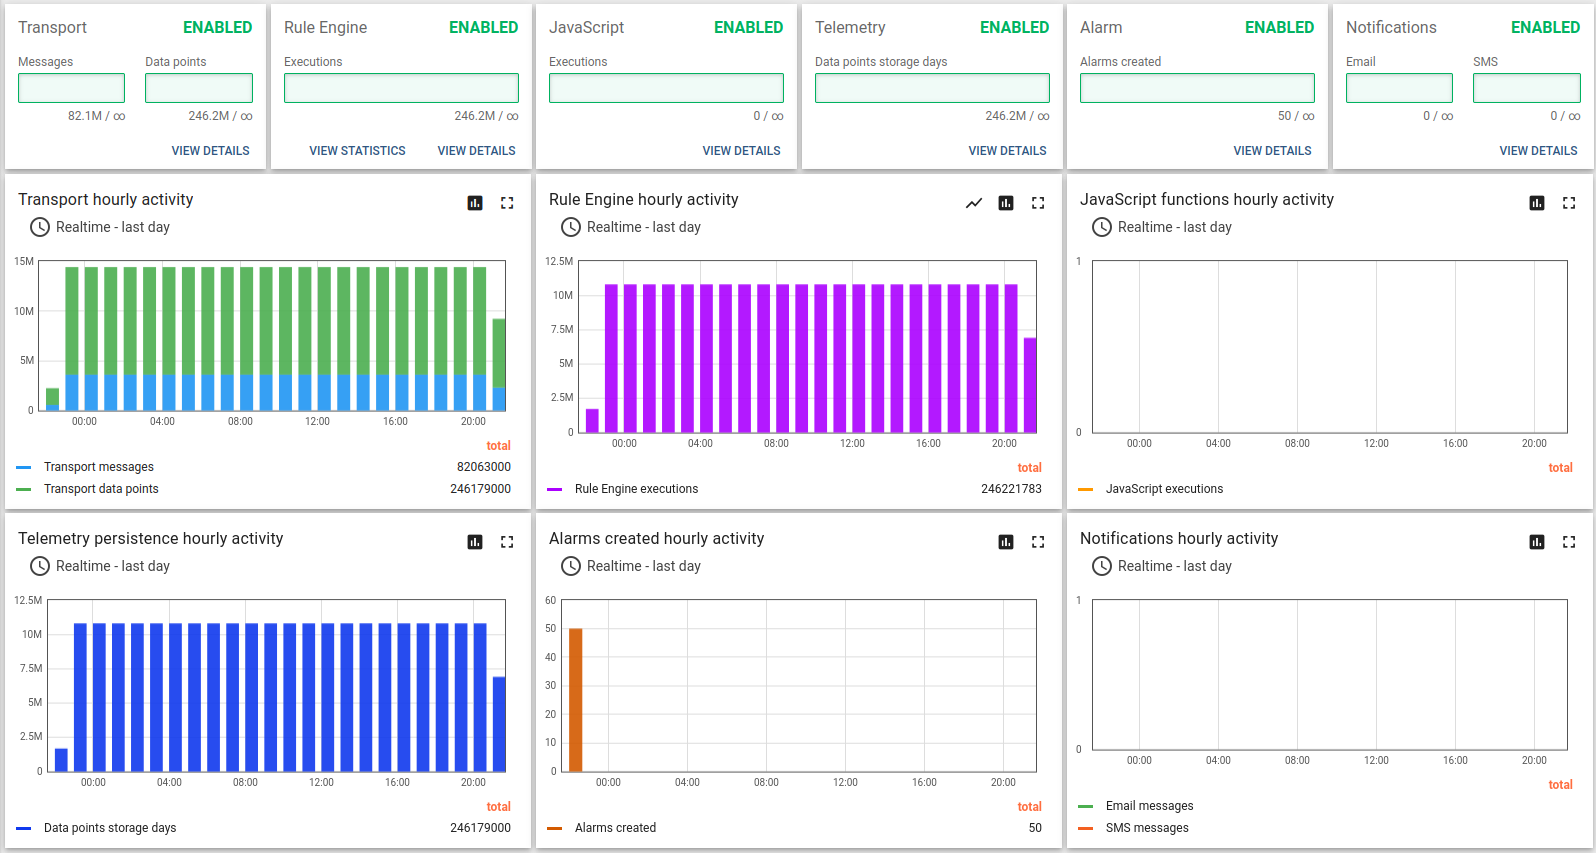
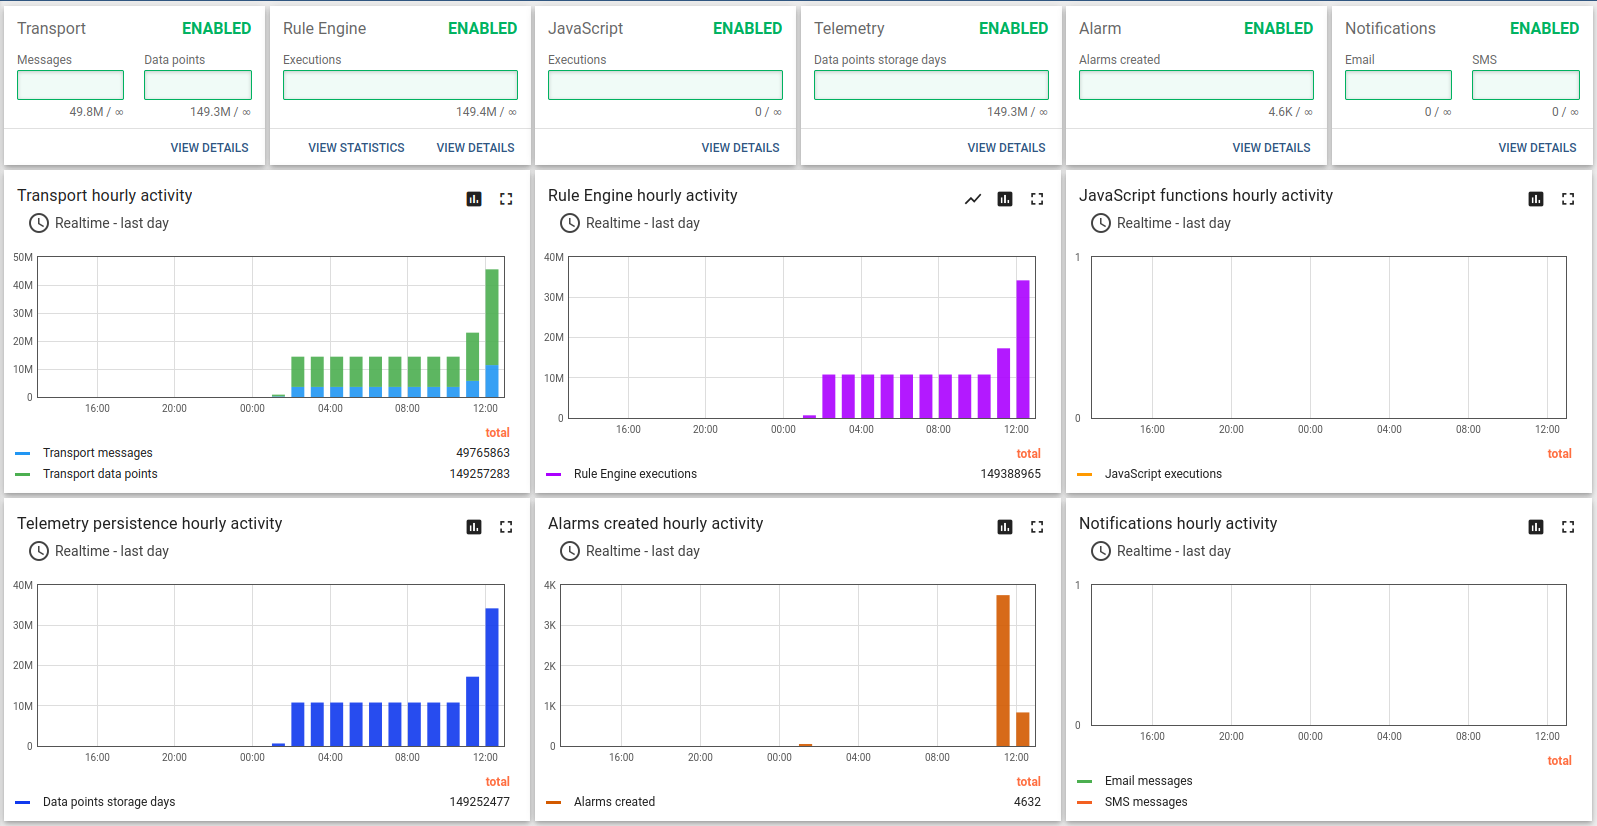
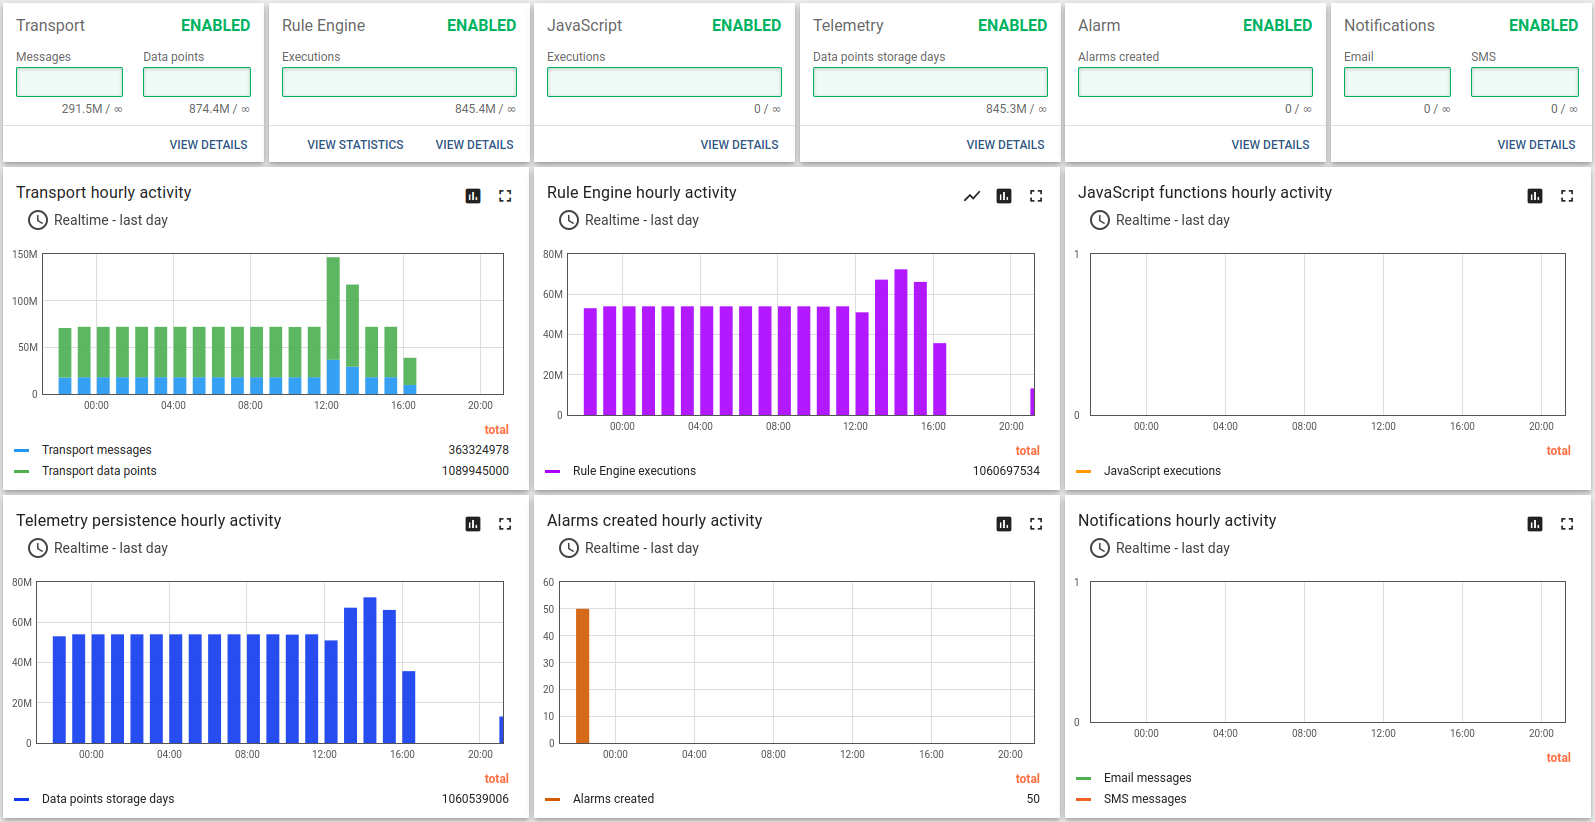
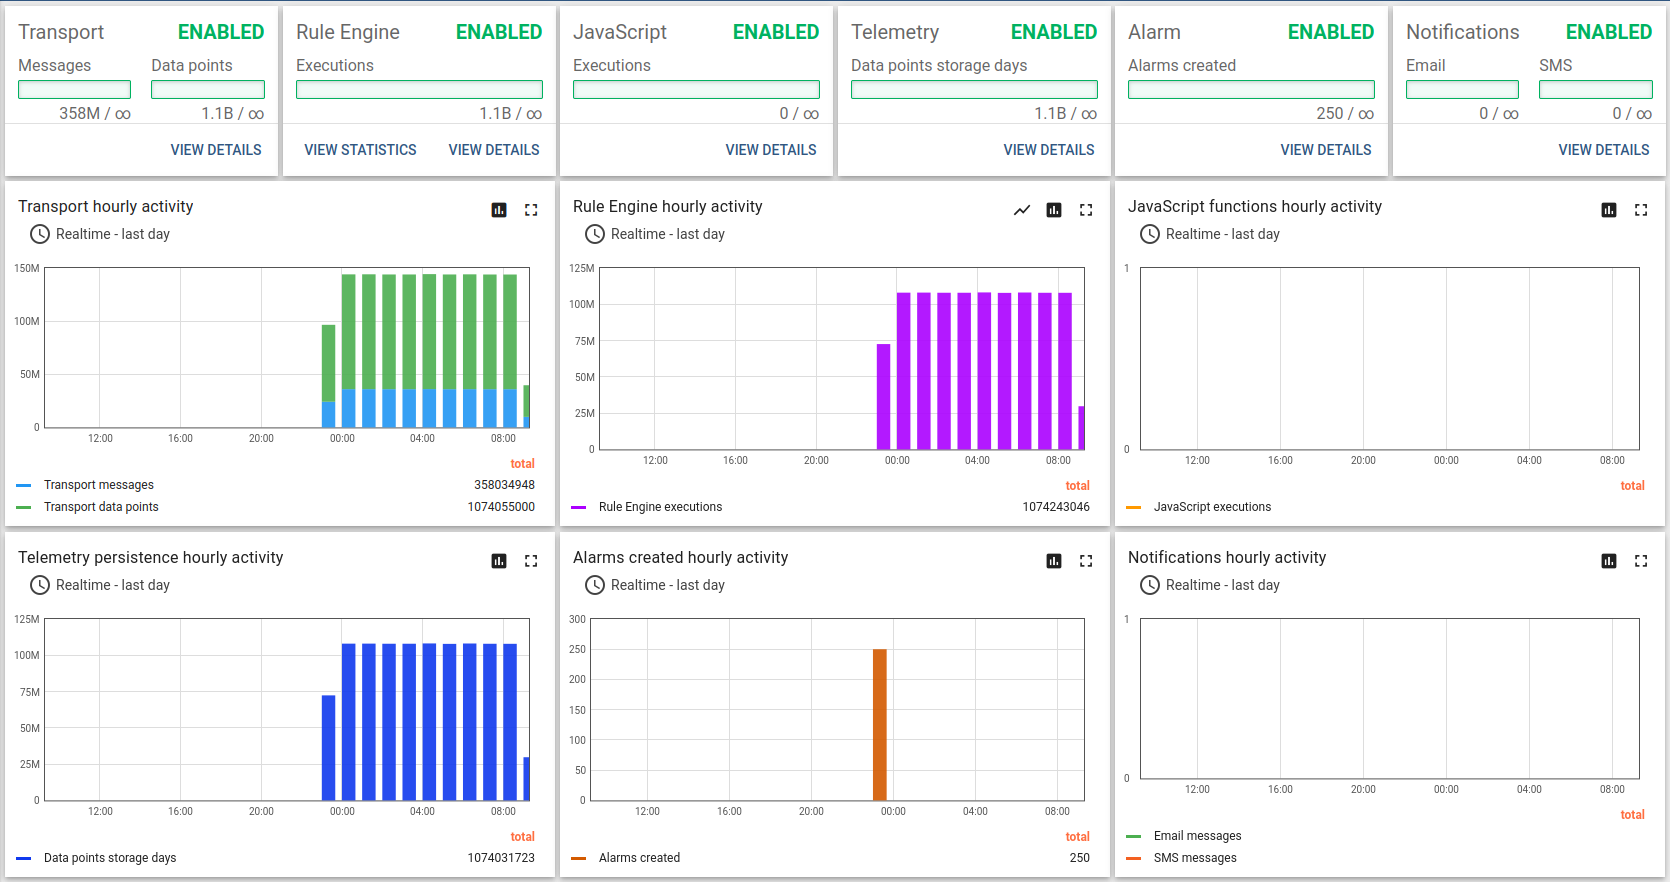
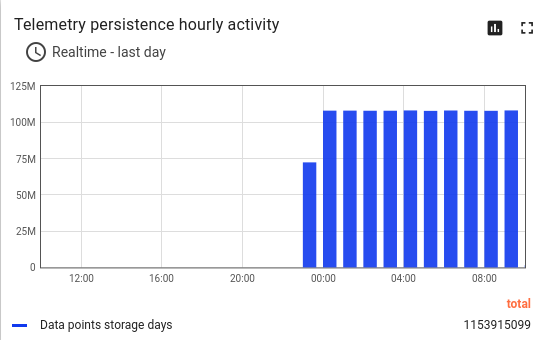
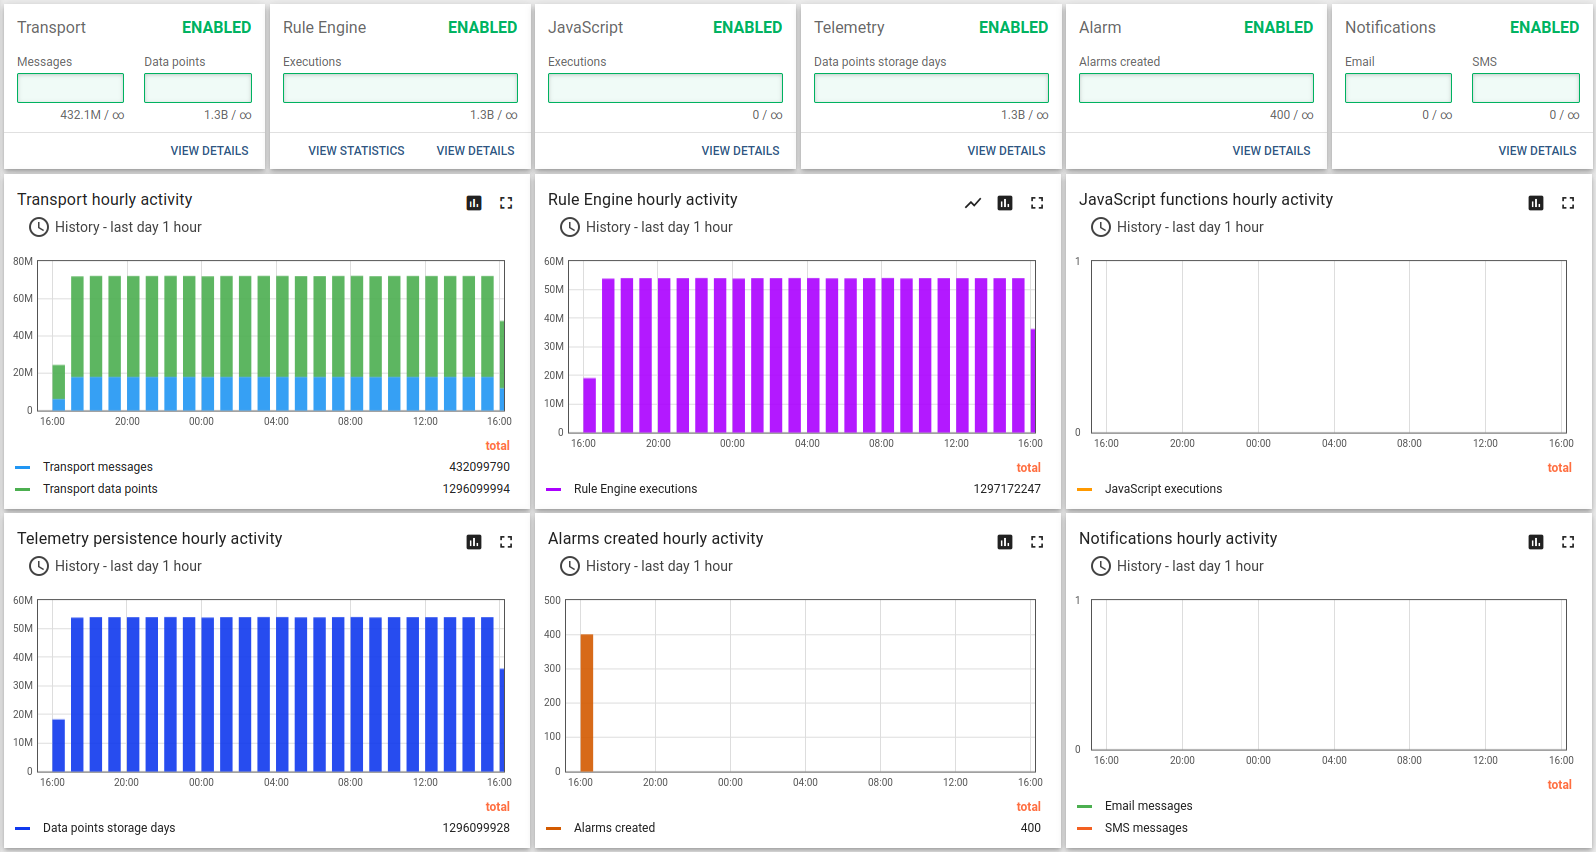
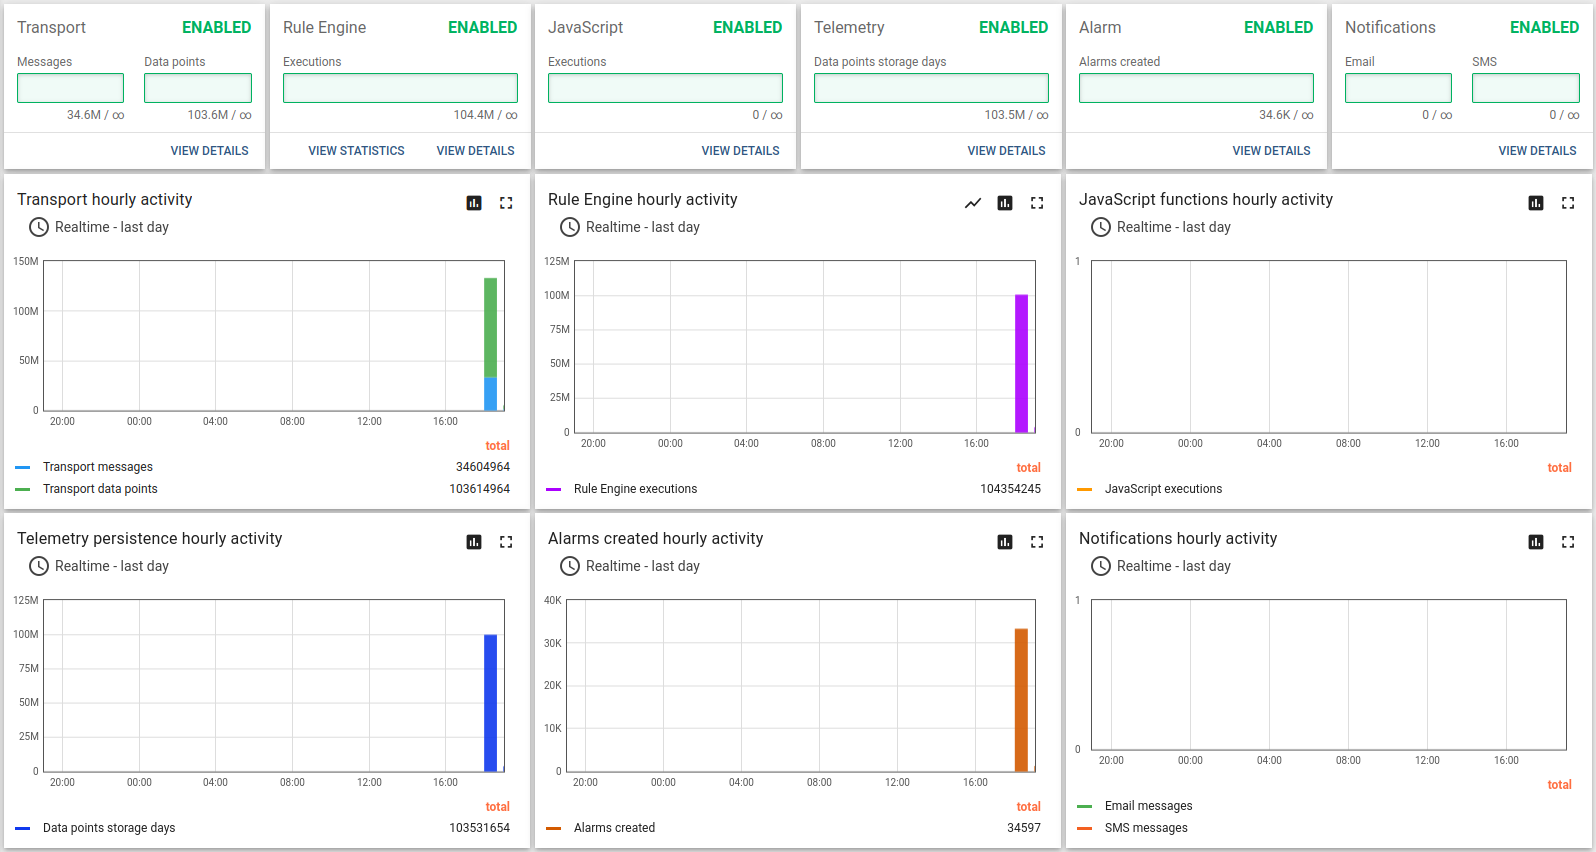
API使用统计显示约10小时处理了11亿数据点。
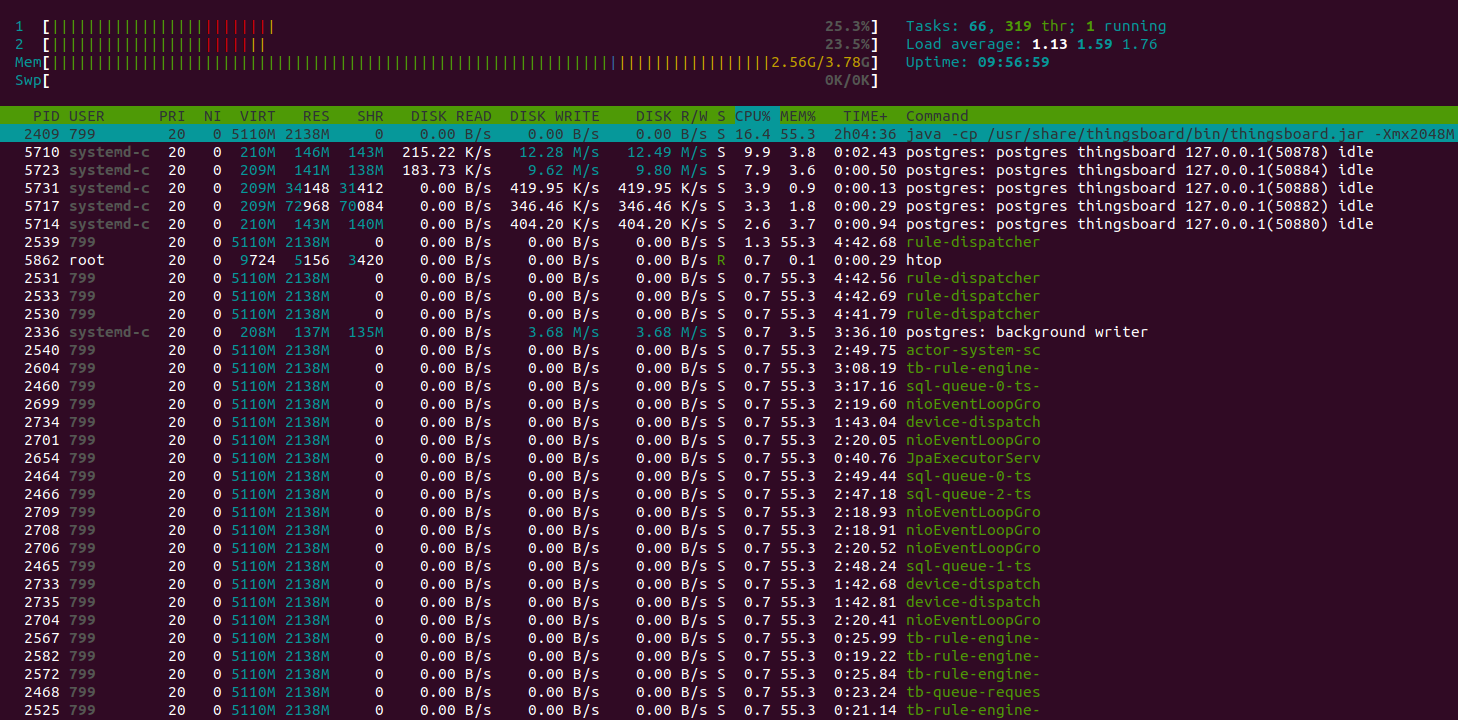
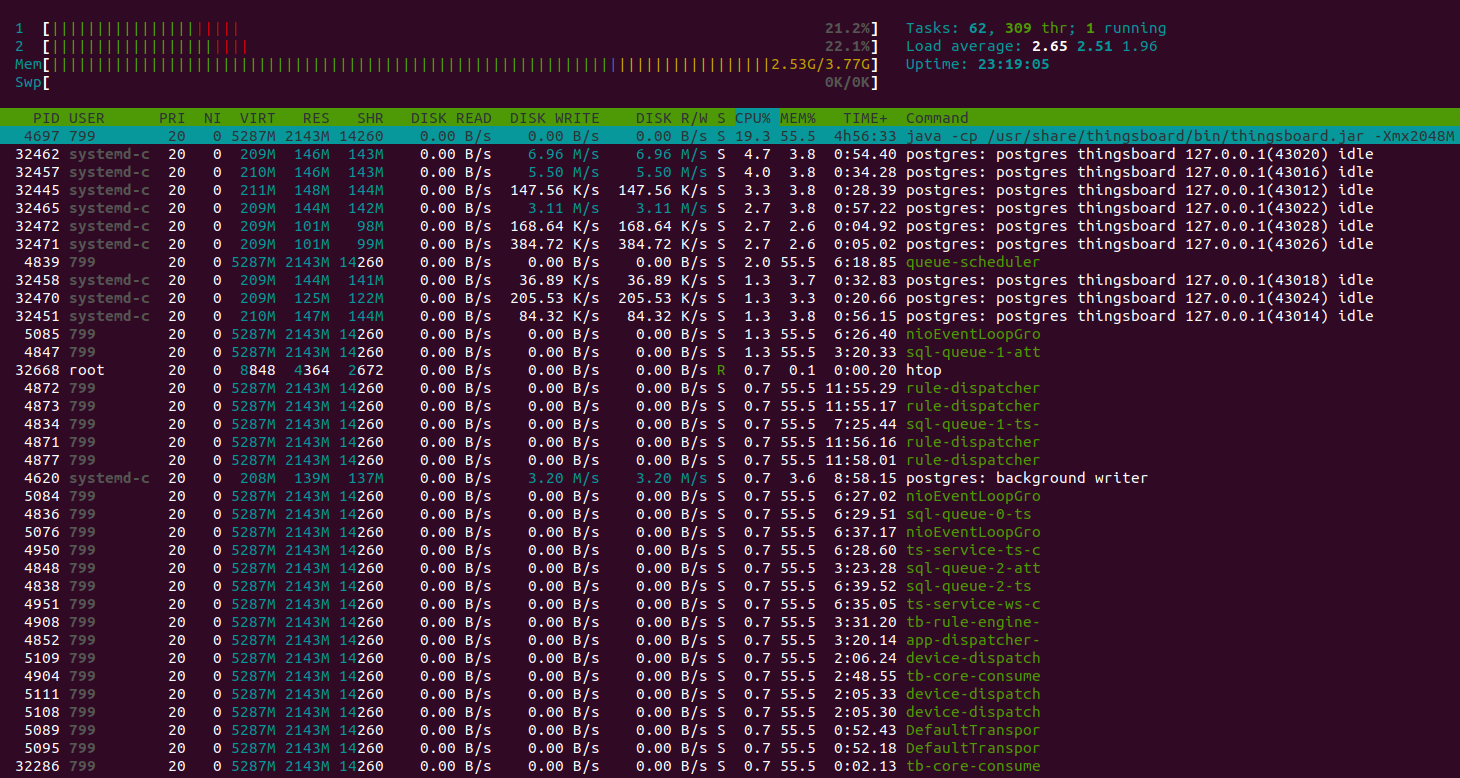
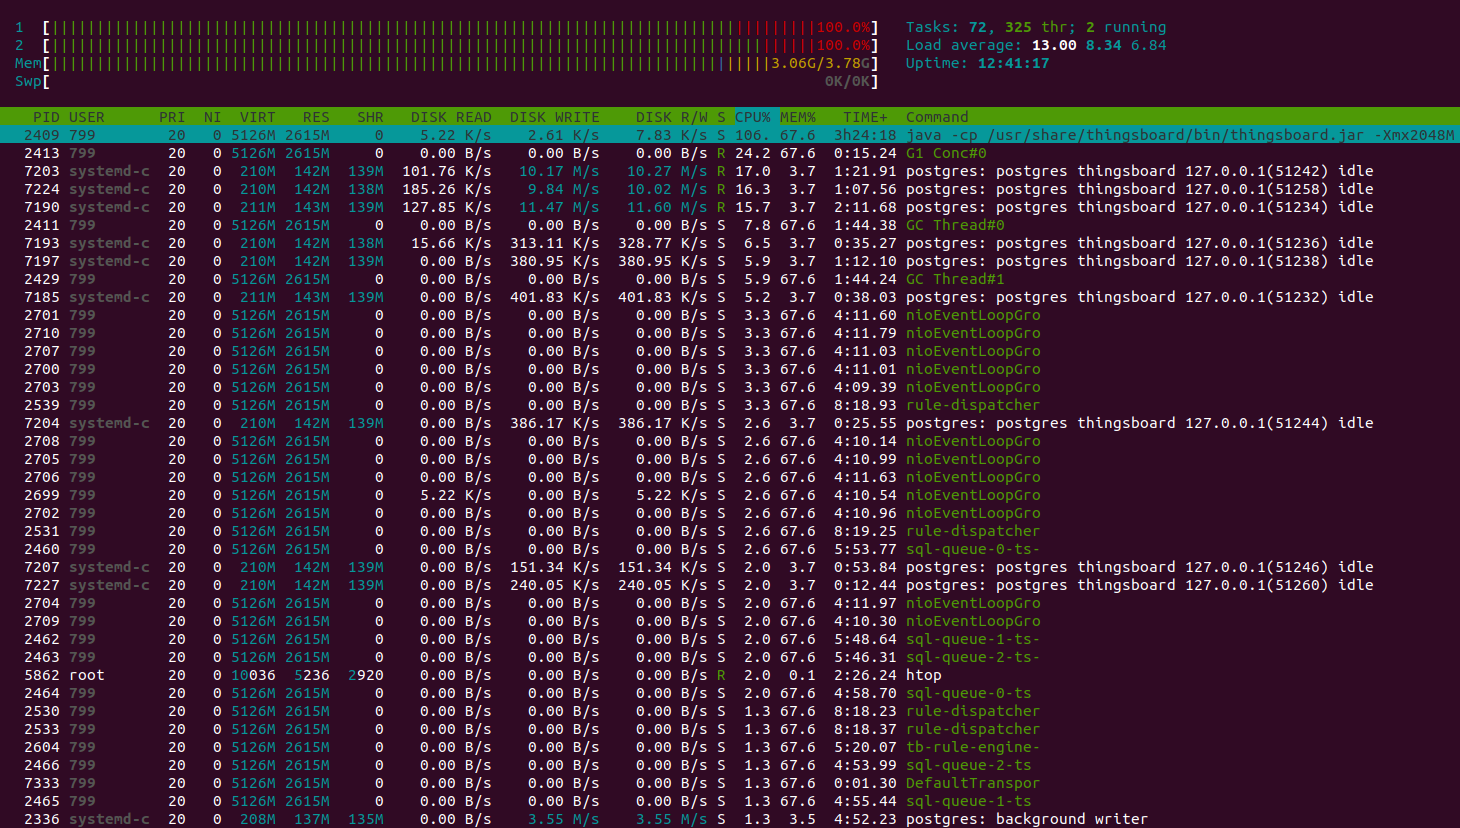
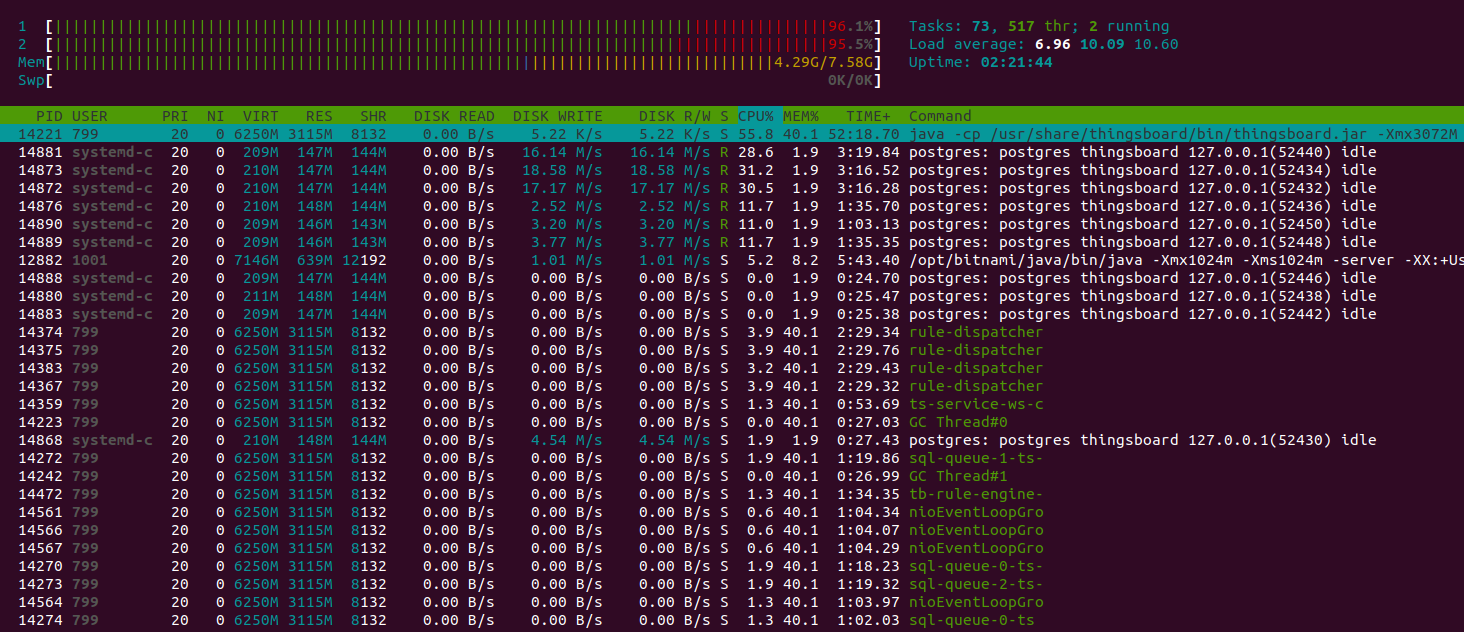
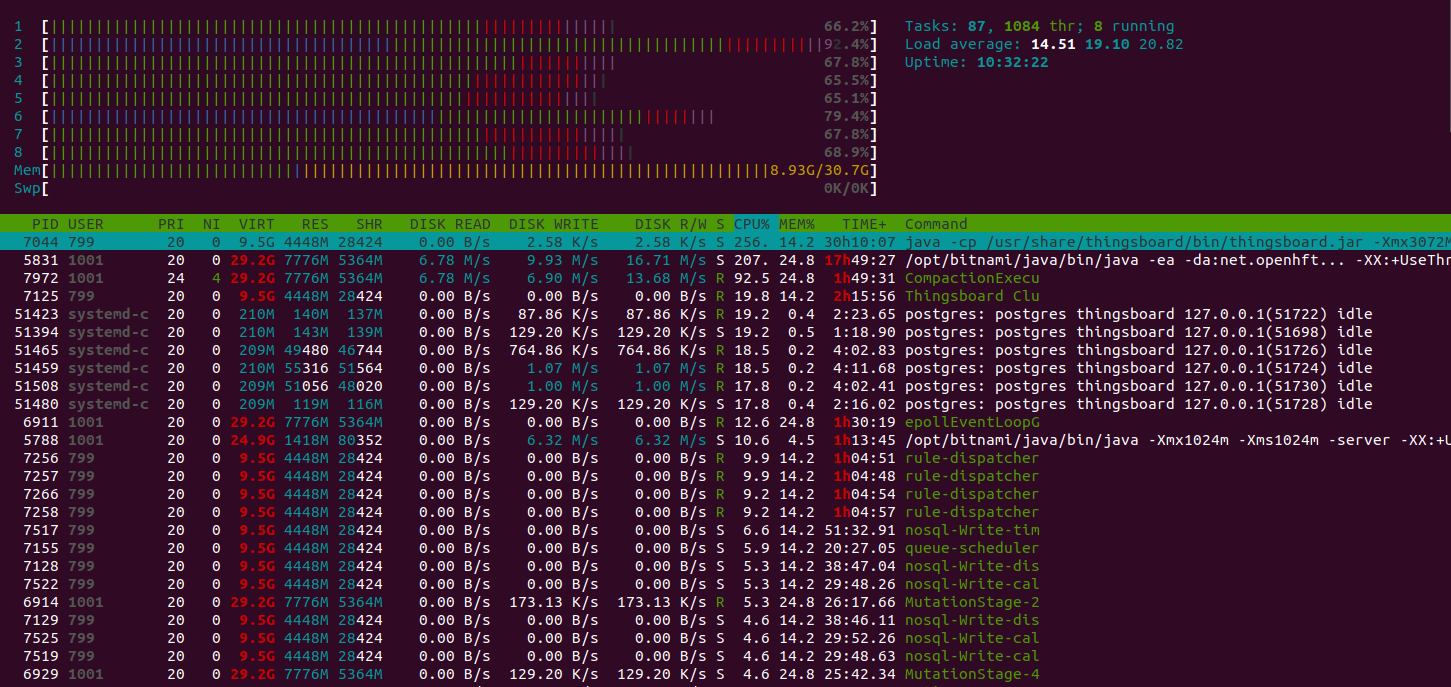
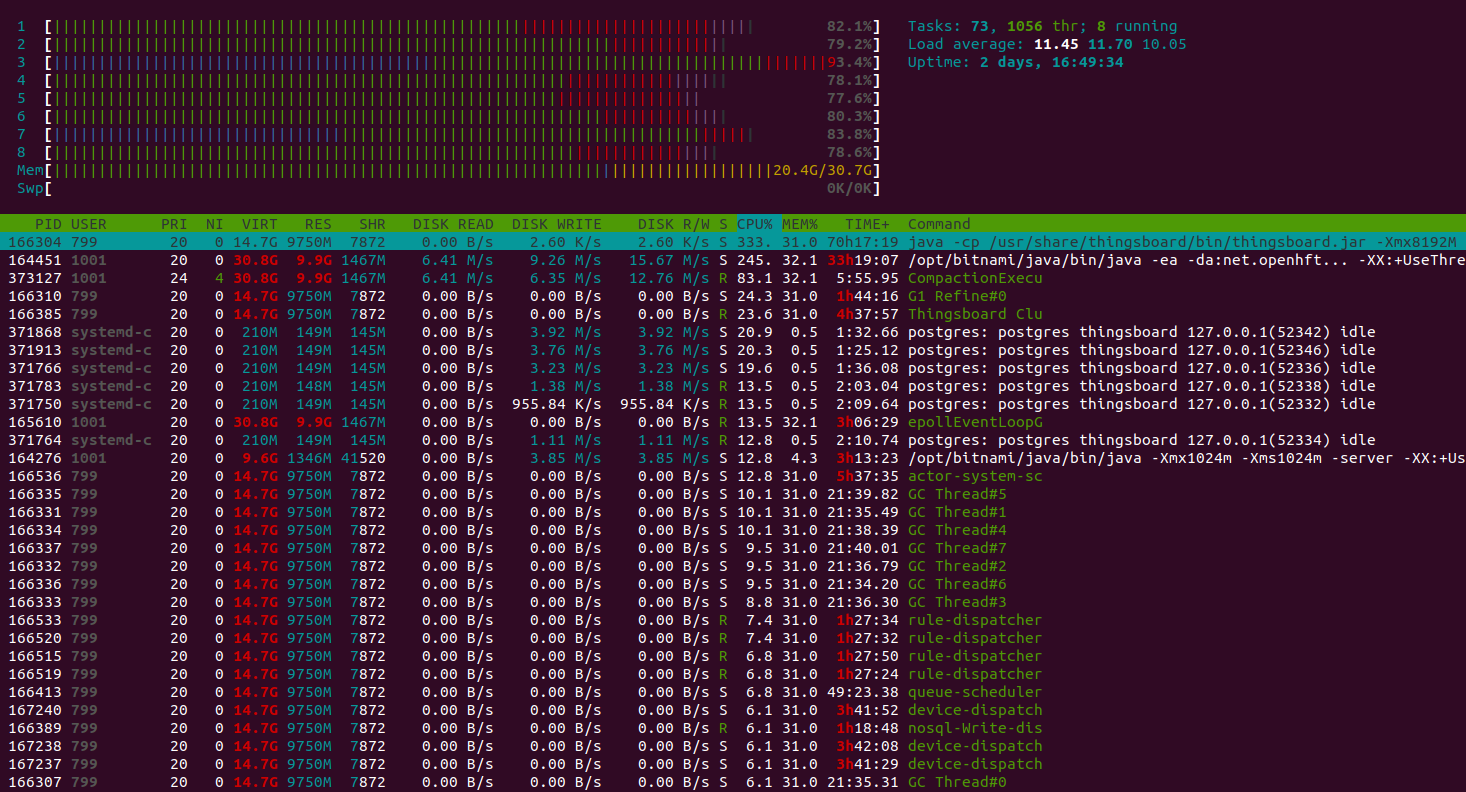
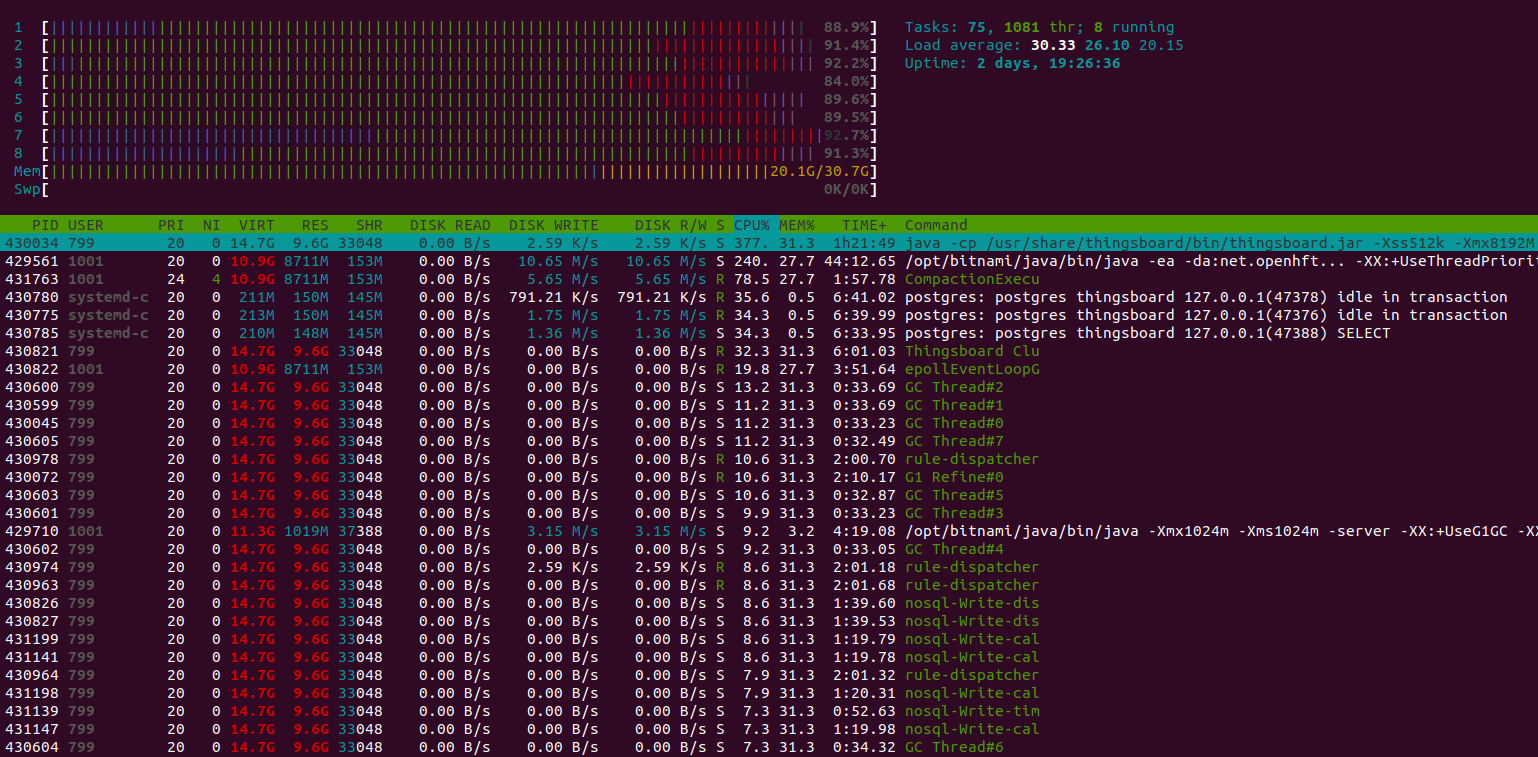
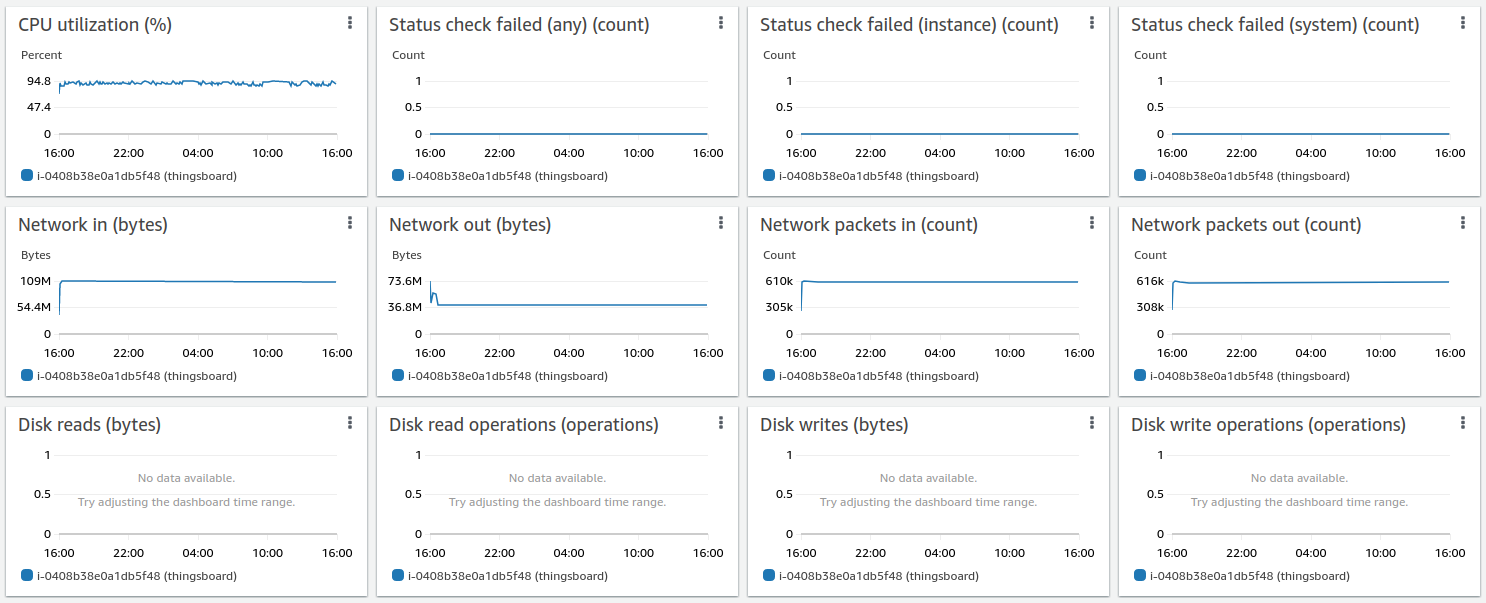
Htop显示系统运行正常,有充足资源处理其他任务。 内存消耗约9GiB,其余为系统文件缓存。 16GiB实例足以承担该负载。
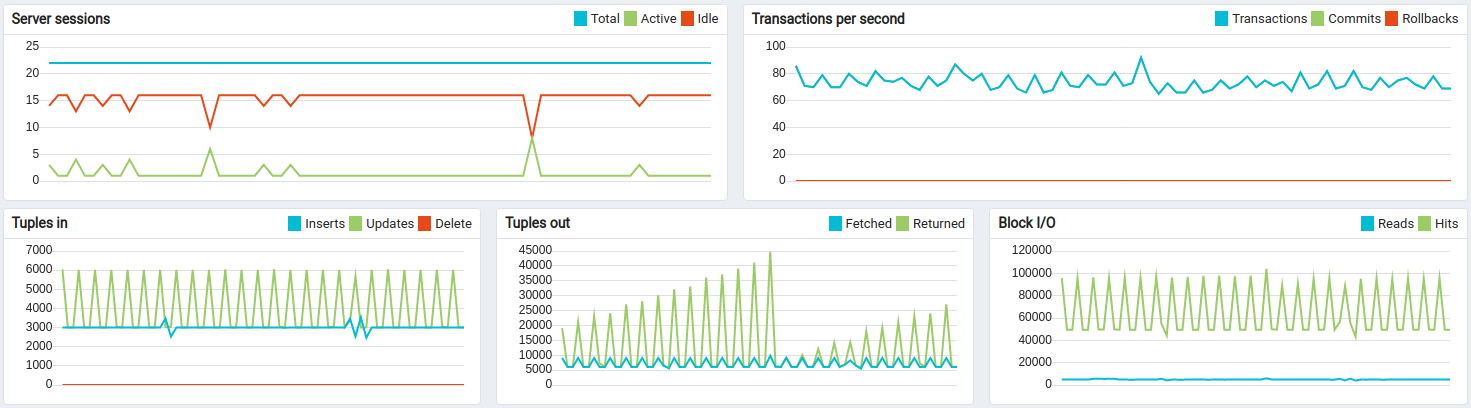
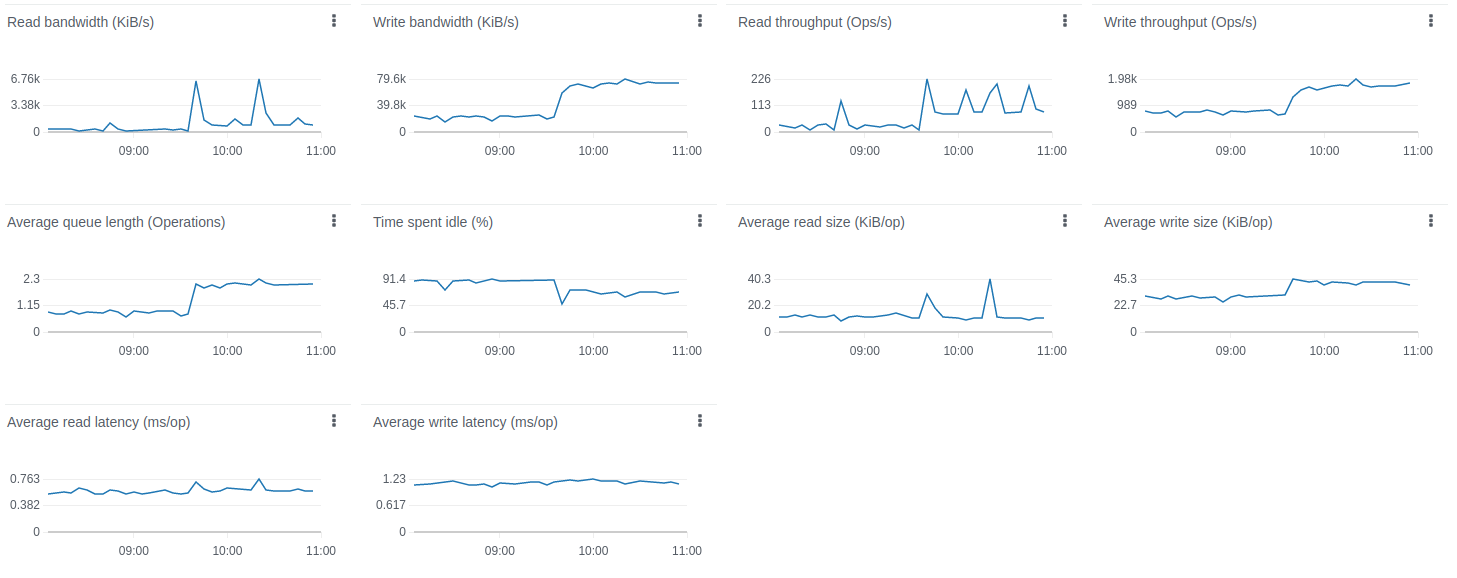
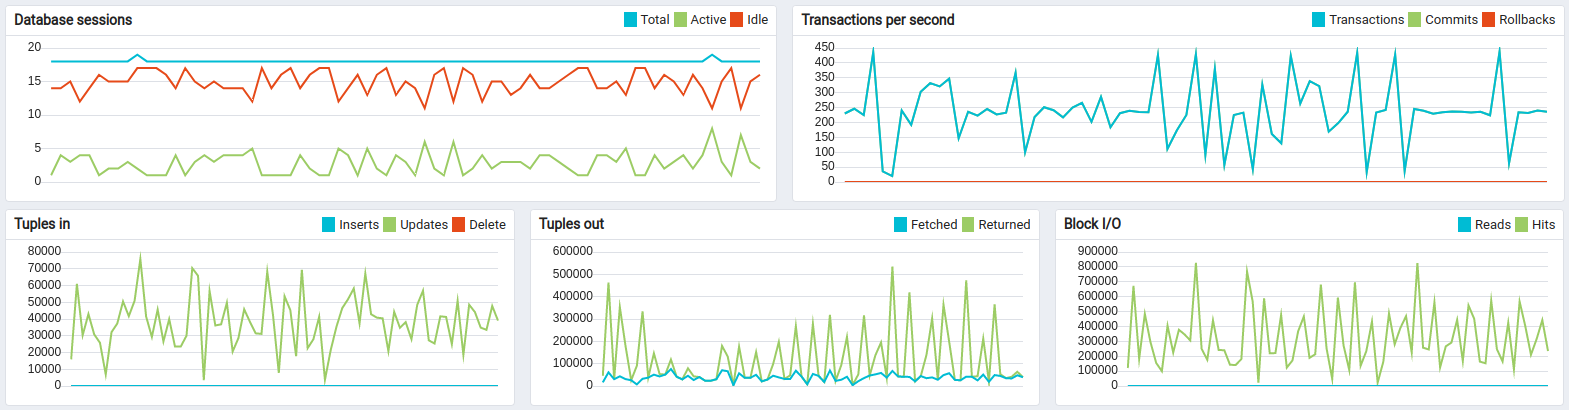
PostgreSQL因需要密集更新存储每台设备时序数据最新值的 “ts_kv_latest” 表而产生CPU负载。 更新速率峰值约60k更新/秒。
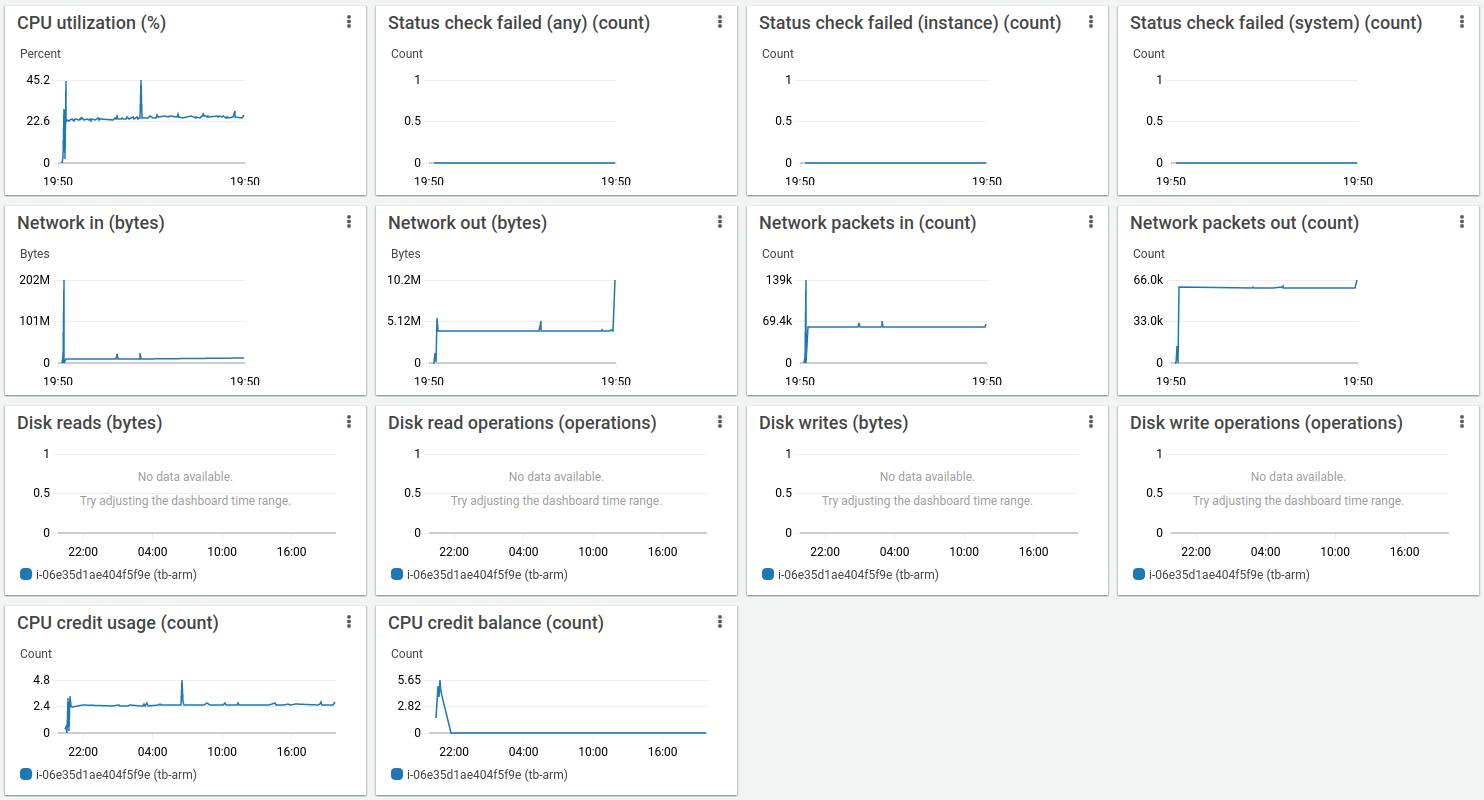
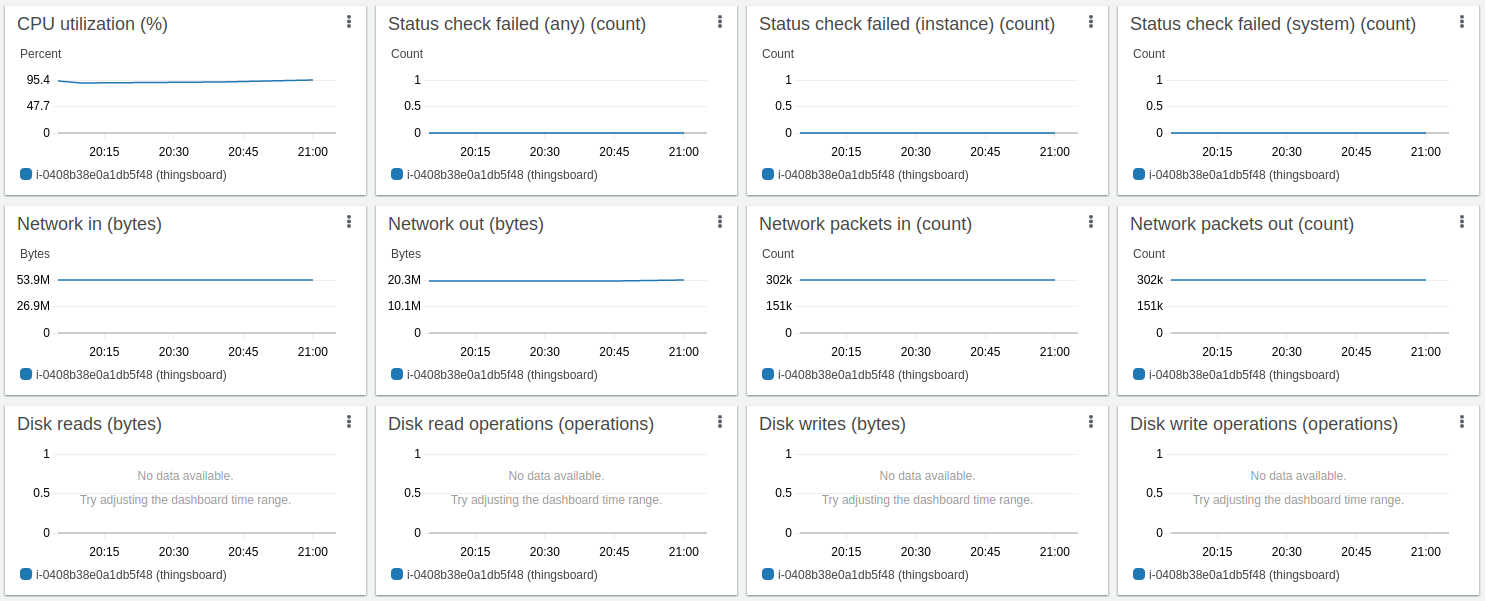
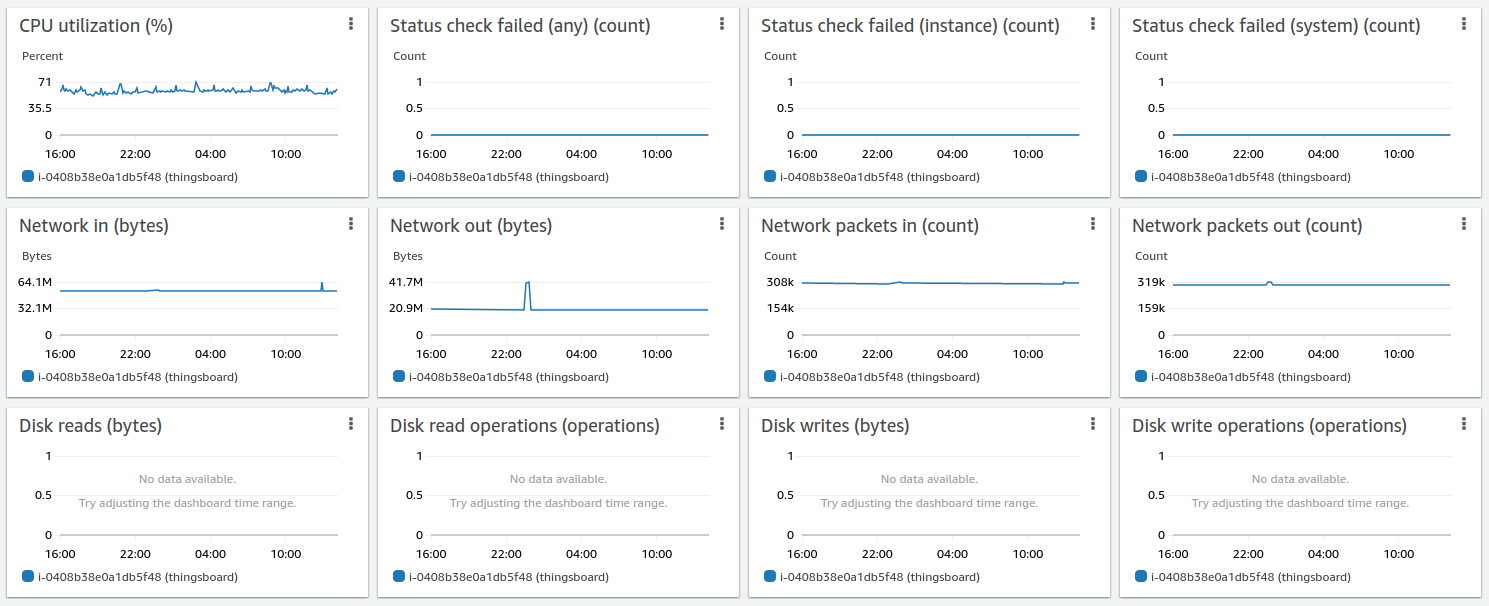
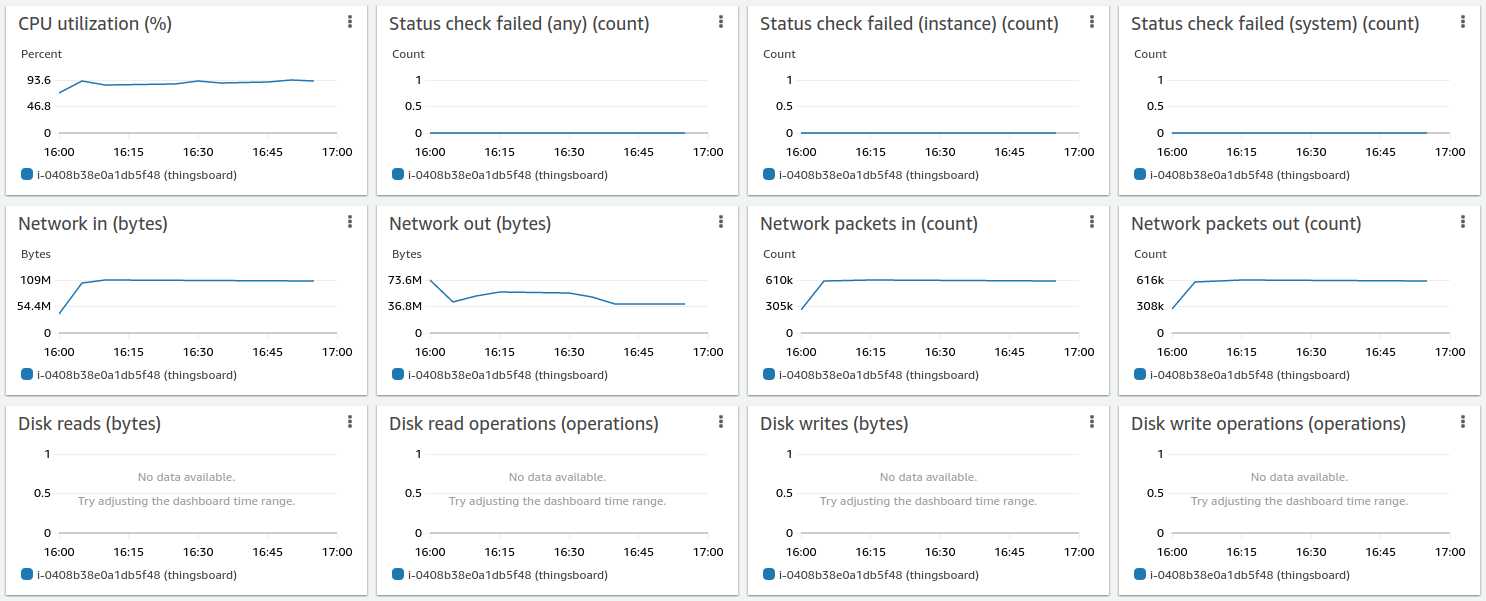
AWS实例监控显示平均CPU负载约75%,峰值达88%。
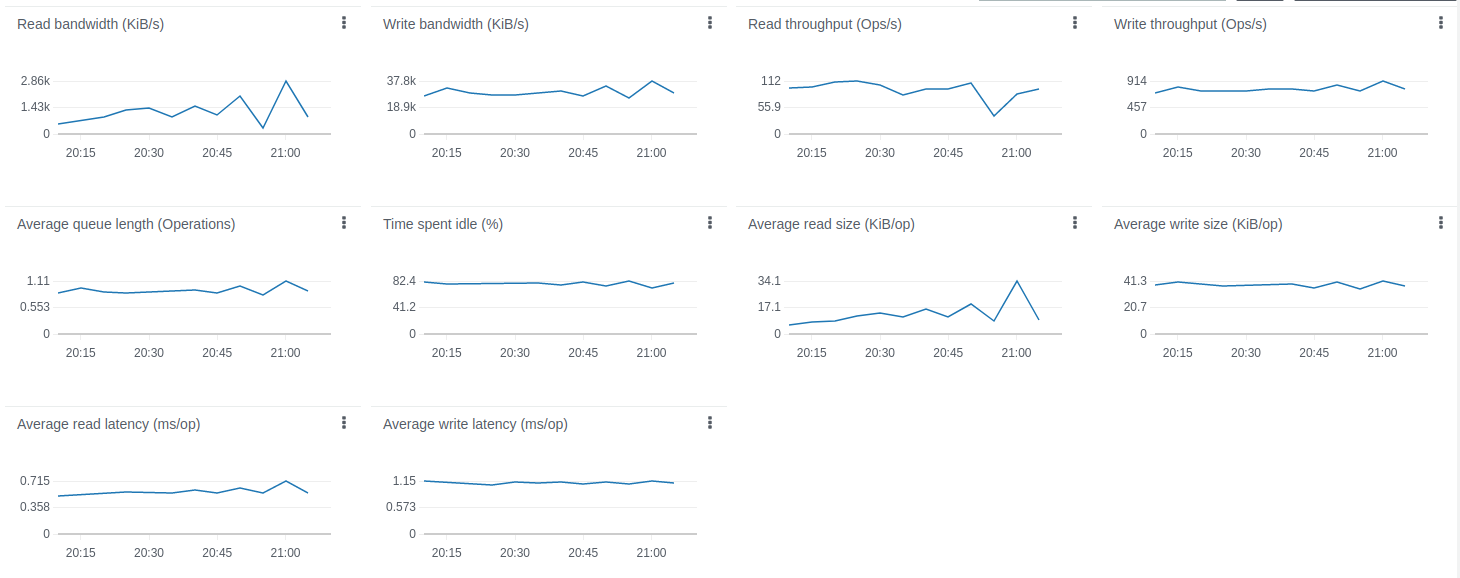
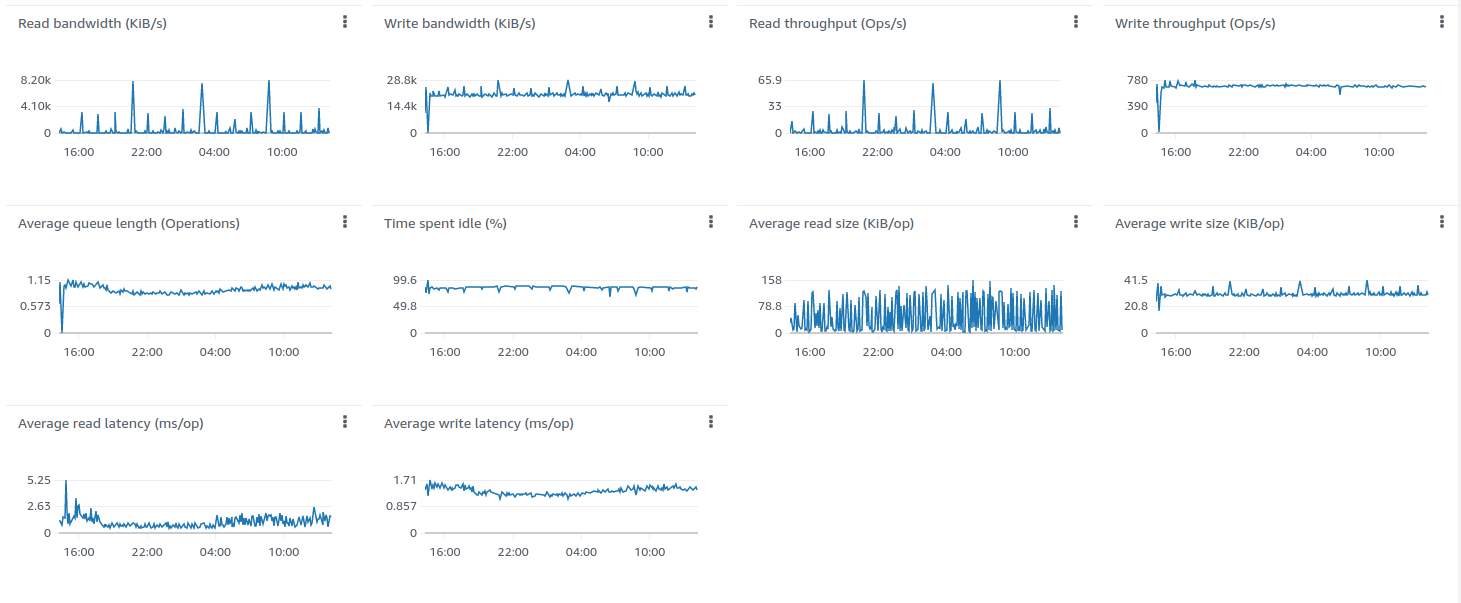
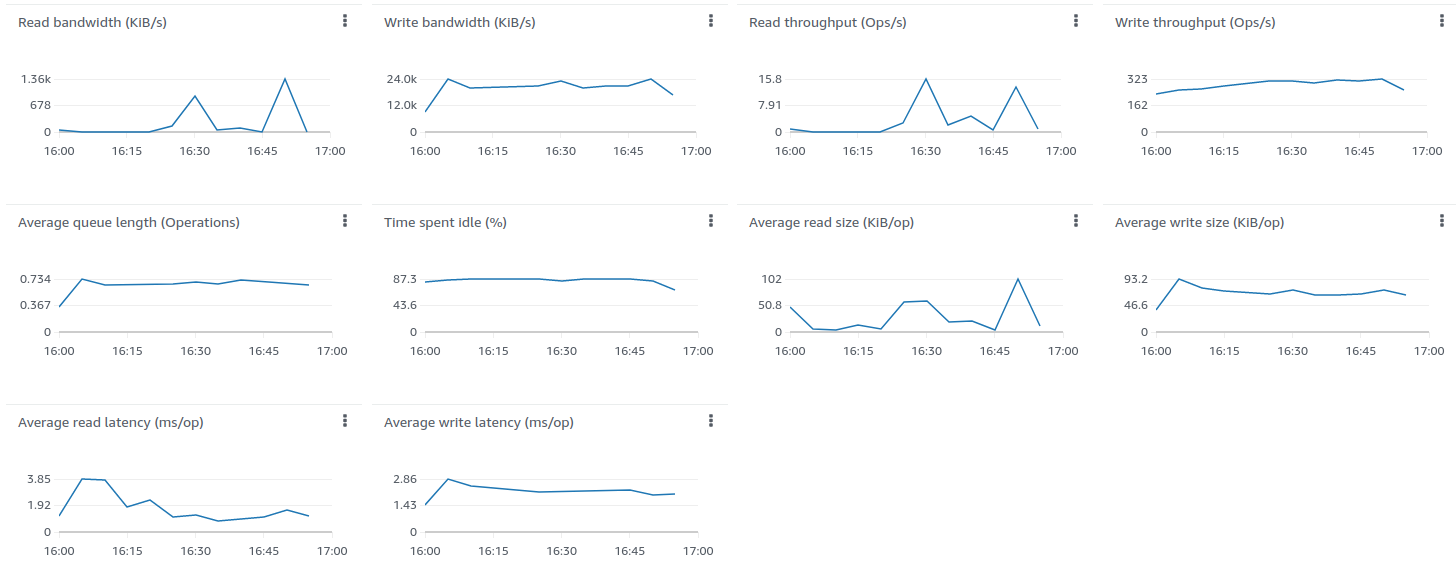
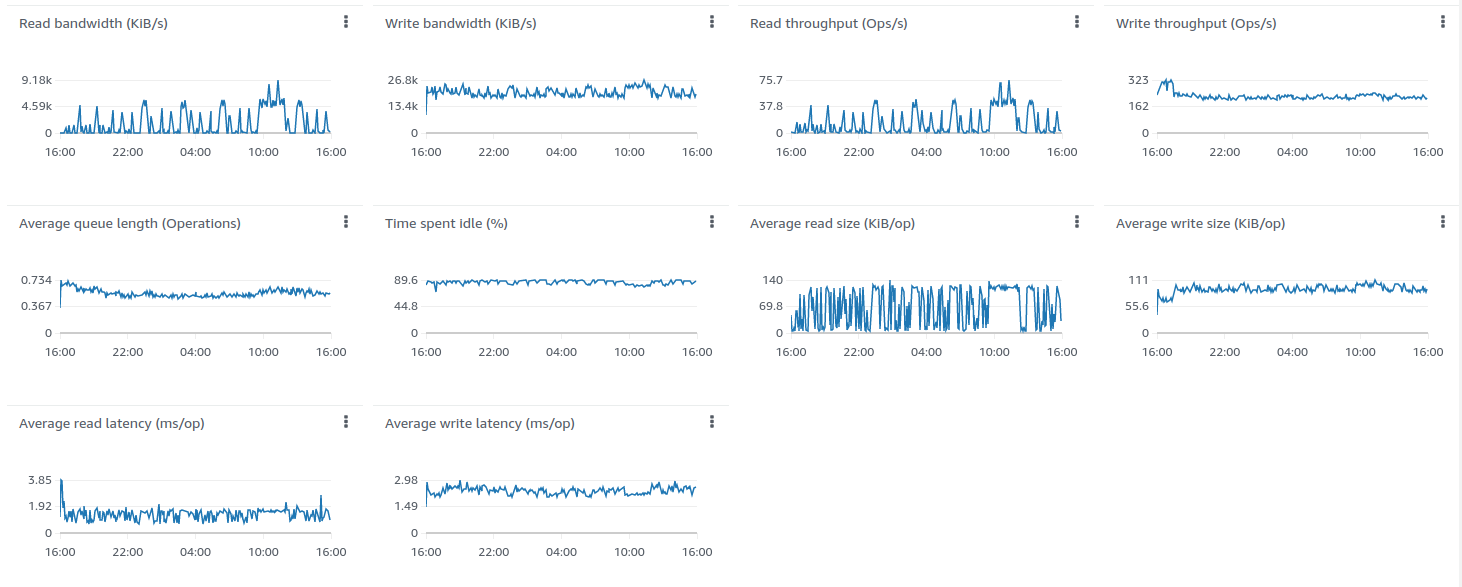
相比仅使用PostgreSQL的部署,磁盘负载极低
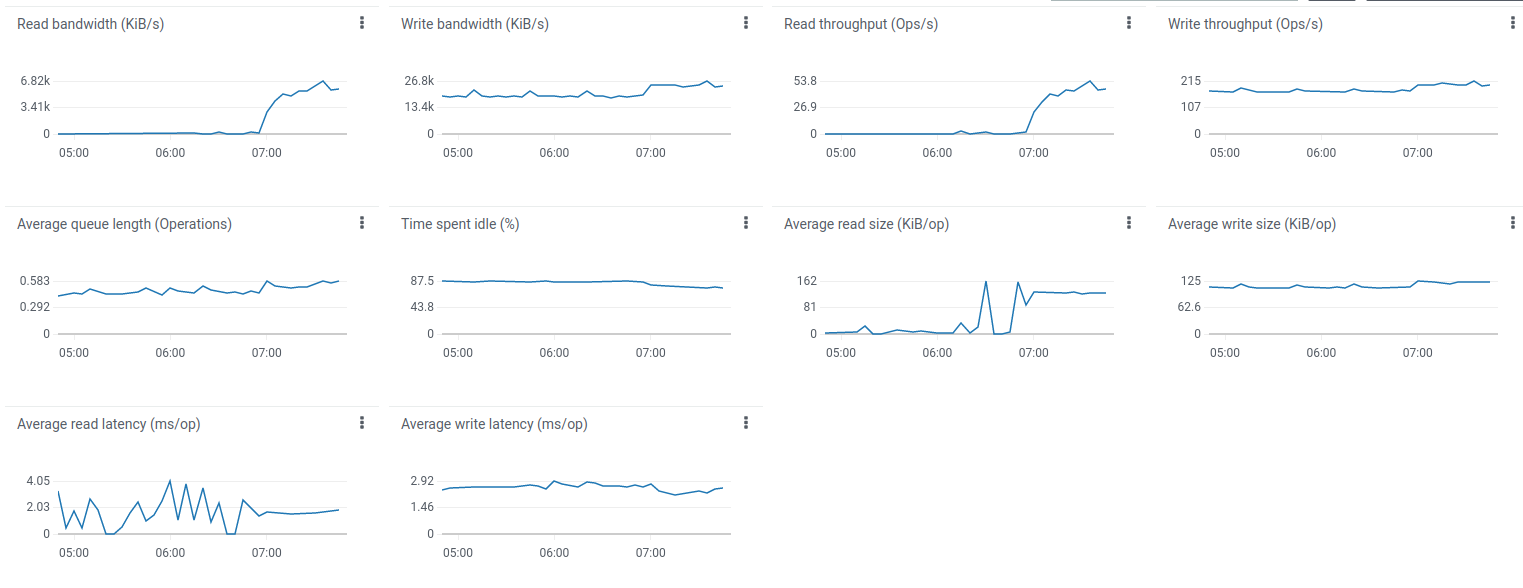
相比仅使用PostgreSQL的部署,Cassandra的磁盘空间和IOPS使用较低(成本更低)。
11.5亿数据点Cassandra约需33GiB磁盘空间(每10亿数据点约29 GiB)。 作为对比,PostgreSQL存储10.6亿数据点约需161 GiB(每10亿数据点约152 GiB)。 磁盘消耗比PostgreSQL低约5倍以上(152/29)!
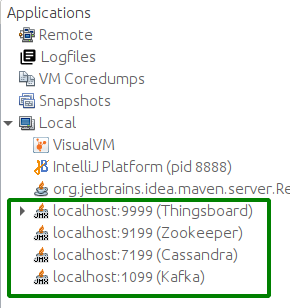
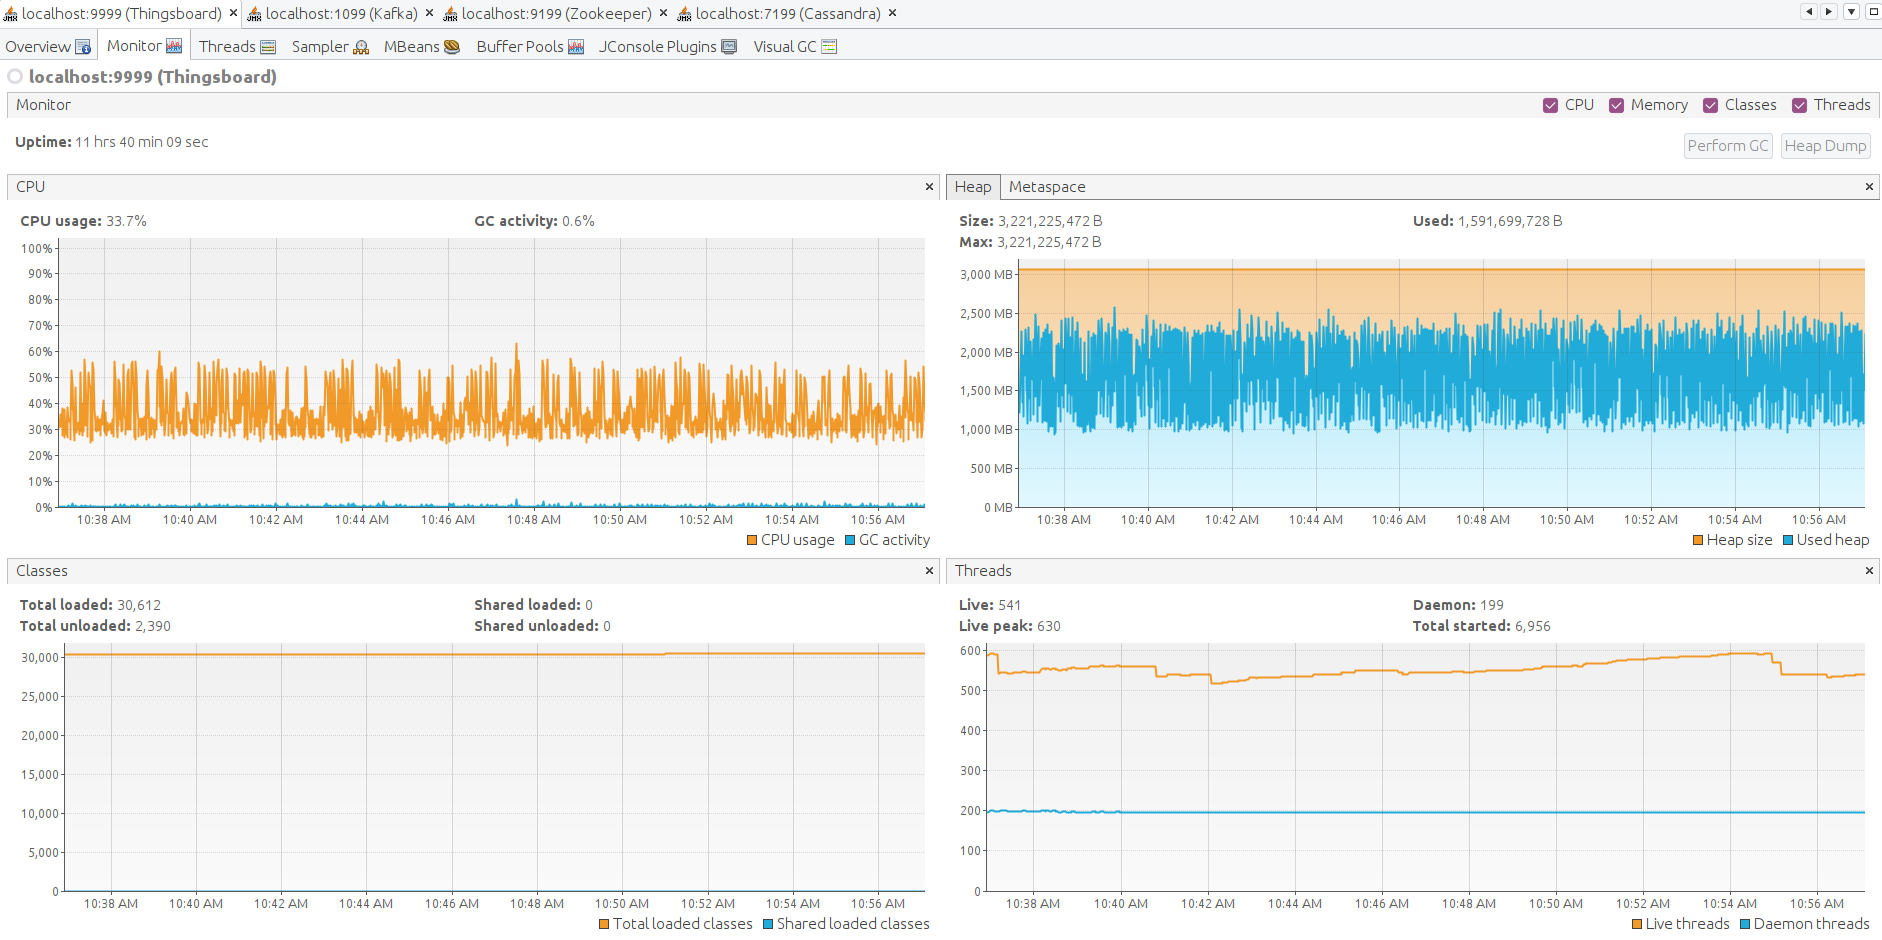
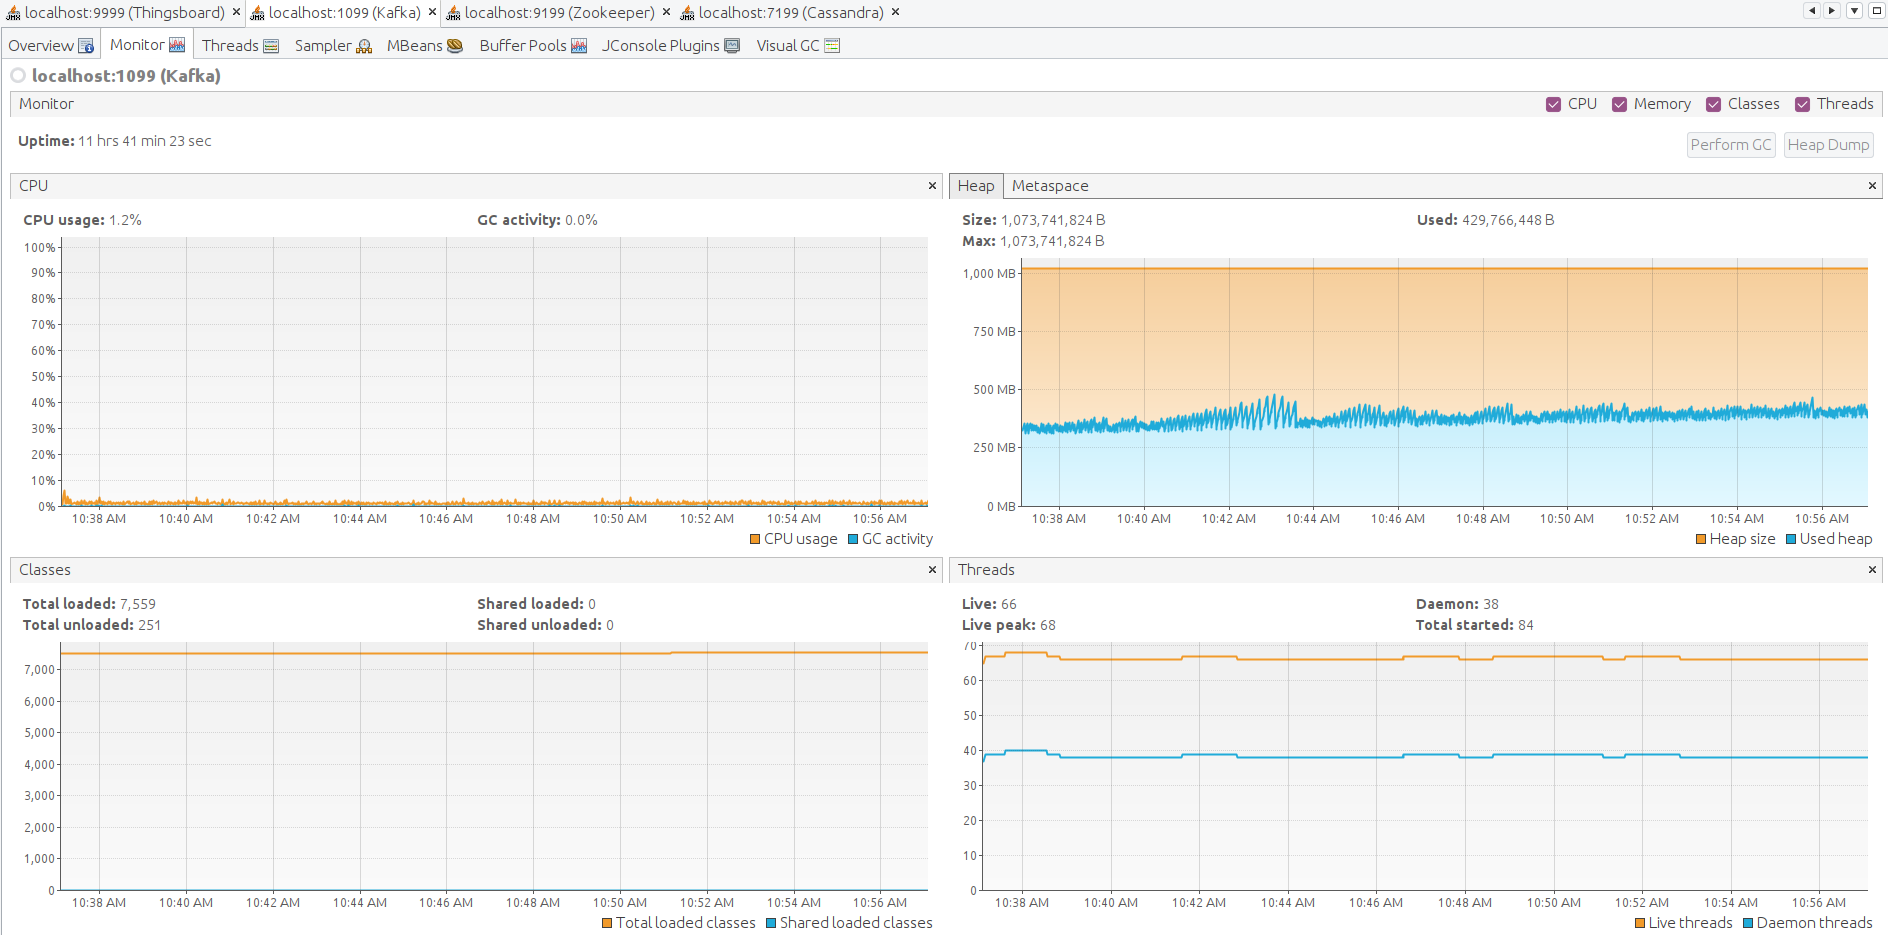
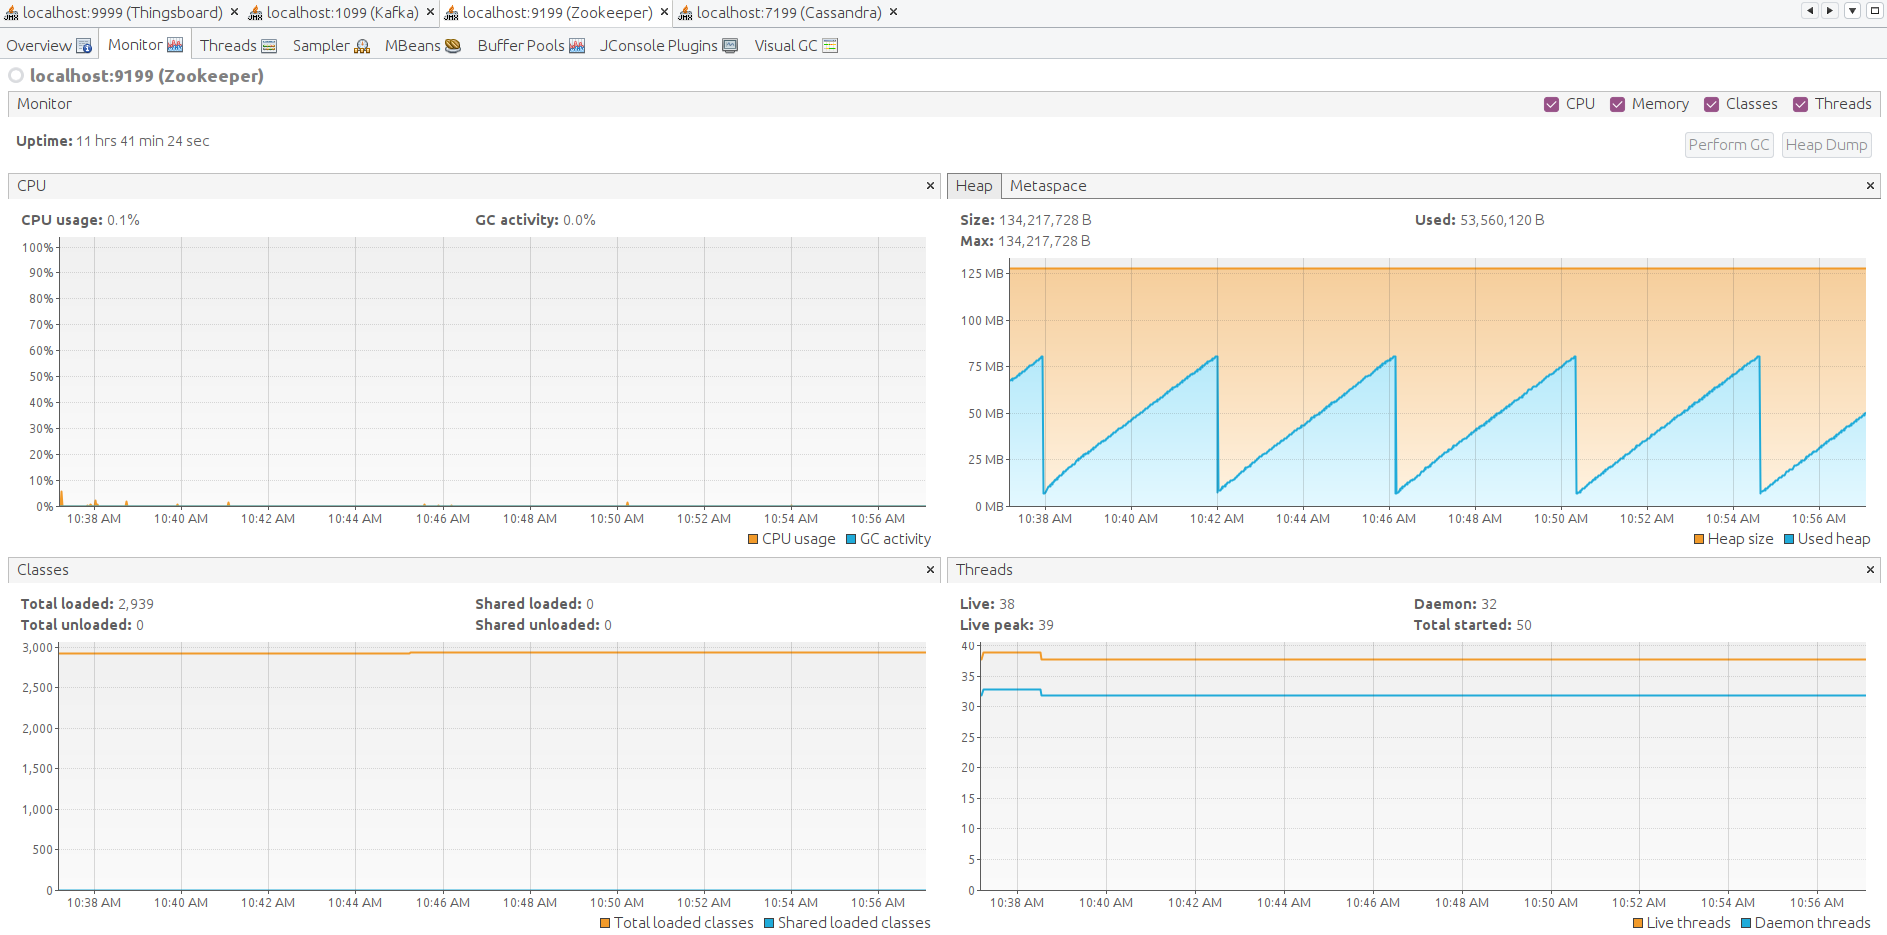
最后检查ThingsBoard、Zookeeper、Kafka和Cassandra各节点的JVM状态。 通过SSH转发JMX端口以连接并监控所有Java应用。
1
ssh -L 9999:127.0.0.1:9999 -L 1099:127.0.0.1:1099 -L 9199:127.0.0.1:9199 -L 7199:127.0.0.1:7199 thingsboard
打开VisualVM,添加本地应用,打开并收集数分钟数据。
以下为ThingsBoard、Kafka、Zookeeper、Cassandra的JMX监控。系统稳定。
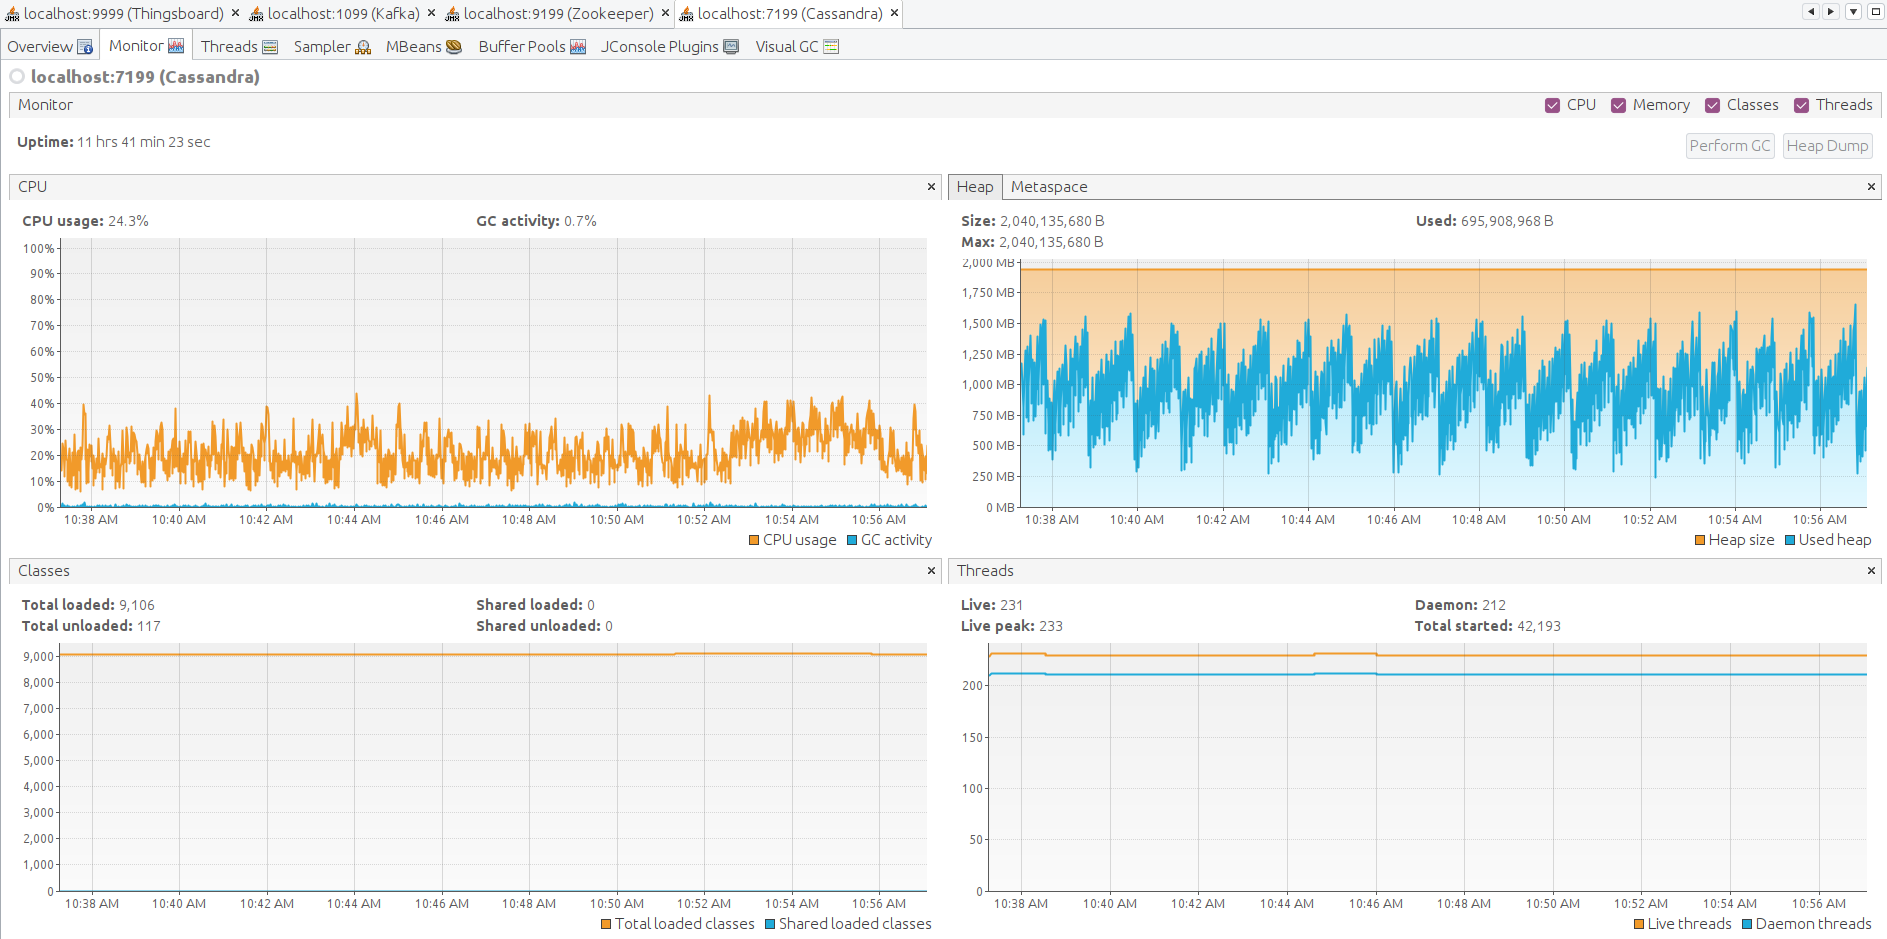
经验总结
Cassandra对海量遥测流至关重要。Kafka队列可应对峰值负载。Kafka + PostgreSQL + Cassandra组合是首选ThingsBoard部署。
Cassandra需要更多CPU资源,但磁盘空间仅约PostgreSQL的1/5,并可大幅降低IOPS负载。 CPU负载平均75%。此配置适用于平均负载10k条消息/秒、30k数据点/秒。
单实例部署下,Cassandra可处理比仅用PostgreSQL多约2–3倍的负载,并可通过向Cassandra集群添加节点横向扩展。
建议从ThingsBoard实例一开始就使用Cassandra,并在整个项目生命周期保持同一技术栈。
对较低消息速率,可通过调整堆大小限制将Cassandra部署适配到更小实例。
系统可纵向扩展约50–100%。若需显著横向扩展,请考虑搭建ThingsBoard集群。
如何复现测试:
在AWS EC2上配置ThingsBoard实例
根据说明使用下述Docker Compose文件在AWS EC2上配置实例。
以下为ThingsBoard + PostgreSQL + Zookeeper + Kafka + Cassandra的docker-compose
1
2
3
4
5
6
7
8
9
10
11
12
13
14
15
16
17
18
19
20
21
22
23
24
25
26
27
28
29
30
31
32
33
34
35
36
37
38
39
40
41
42
43
44
45
46
47
48
49
50
51
52
53
54
55
56
57
58
59
60
61
62
63
64
65
66
67
68
69
70
71
72
73
74
75
76
77
78
79
80
81
82
83
84
85
86
87
88
89
90
91
92
93
94
95
version: '3.0'
services:
  cassandra:
    image: bitnamilegacy/cassandra:4.0
    network_mode: "host"
    restart: "always"
    volumes:
      - cassandra:/bitnami
    environment:
      CASSANDRA_CLUSTER_NAME: "ThingsBoard Cluster"
      HEAP_NEWSIZE: "1024M"
      MAX_HEAP_SIZE: "2048M"
      JVM_EXTRA_OPTS: "-Dcom.sun.management.jmxremote -Dcom.sun.management.jmxremote.port=7199 -Dcom.sun.management.jmxremote.rmi.port=7199  -Dcom.sun.management.jmxremote.authenticate=false -Dcom.sun.management.jmxremote.ssl=false -Djava.rmi.server.hostname=127.0.0.1"
  zookeeper:
    image: bitnamilegacy/zookeeper:3.7
    network_mode: "host"
    restart: "always"
    volumes:
      - zookeeper:/bitnami
    environment:
      ALLOW_ANONYMOUS_LOGIN: "yes"
      ZOO_ENABLE_ADMIN_SERVER: "no"
      JVMFLAGS: "-Xmx128m -Xms128m -Dcom.sun.management.jmxremote -Dcom.sun.management.jmxremote.port=9199 -Dcom.sun.management.jmxremote.rmi.port=9199  -Dcom.sun.management.jmxremote.authenticate=false -Dcom.sun.management.jmxremote.ssl=false -Djava.rmi.server.hostname=127.0.0.1"
  kafka:
    image: bitnamilegacy/kafka:3
    network_mode: "host"
    restart: "always"
    volumes:
      - kafka:/bitnami
    environment:
      KAFKA_CFG_ZOOKEEPER_CONNECT: "localhost:2181"
      ALLOW_PLAINTEXT_LISTENER: "yes"
      KAFKA_JMX_OPTS: "-Dcom.sun.management.jmxremote -Dcom.sun.management.jmxremote.port=1099 -Dcom.sun.management.jmxremote.rmi.port=1099 -Dcom.sun.management.jmxremote.authenticate=false -Dcom.sun.management.jmxremote.ssl=false -Djava.rmi.server.hostname=127.0.0.1"
      JMX_PORT: "1099"
    depends_on:
      - zookeeper
  postgres:
    image: "postgres:14"
    network_mode: "host"
    restart: "always"
    volumes:
      - postgres:/var/lib/postgresql/data
    environment:
      POSTGRES_DB: "thingsboard"
      POSTGRES_PASSWORD: "postgres"
  tb:
    depends_on:
      - postgres
      - kafka
      - cassandra
    image: "thingsboard/tb"
    network_mode: "host"
    restart: "always"
    volumes:
      - thingsboard-data:/data
      - thingsboard-logs:/var/log/thingsboard
    environment:
      DATABASE_TS_TYPE: "cassandra"
      DATABASE_TS_LATEST_TYPE: "sql"
      #Cassandra
      CASSANDRA_CLUSTER_NAME: "ThingsBoard Cluster"
      CASSANDRA_LOCAL_DATACENTER: "datacenter1"
      CASSANDRA_KEYSPACE_NAME: "thingsboard"
      CASSANDRA_URL: "127.0.0.1:9042"
      CASSANDRA_USE_CREDENTIALS: "true"
      CASSANDRA_USERNAME: "cassandra"
      CASSANDRA_PASSWORD: "cassandra"
      CASSANDRA_QUERY_BUFFER_SIZE: "100000"
      CASSANDRA_QUERY_CONCURRENT_LIMIT: "1000"
      CASSANDRA_QUERY_POLL_MS: "10"
      #Kafka
      TB_QUEUE_TYPE: "kafka"
      TB_KAFKA_BATCH_SIZE: "65536" # default is 16384 - it helps to produce messages much efficiently
      TB_KAFKA_LINGER_MS: "5" # default is 1
      TB_QUEUE_KAFKA_MAX_POLL_RECORDS: "2048" # default is 8192
      TB_SERVICE_ID: "tb-node-0"
      HTTP_BIND_PORT: "8080"
      TB_QUEUE_RE_MAIN_PACK_PROCESSING_TIMEOUT_MS: "30000"
      # Postgres connection
      SPRING_DATASOURCE_URL: "jdbc:postgresql://localhost:5432/thingsboard"
      SPRING_DATASOURCE_USERNAME: "postgres"
      SPRING_DATASOURCE_PASSWORD: "postgres"
      # Cache specs
      CACHE_SPECS_DEVICES_MAX_SIZE: "123456" # default is 10000
      CACHE_SPECS_DEVICE_CREDENTIALS_MAX_SIZE: "123456" # default is 10000
      CACHE_SPECS_SESSIONS_MAX_SIZE: "123456" # default is 10000
      # Java options for 8G instance and JMX enabled
      JAVA_OPTS: " -Xmx3072M -Xms3072M -Dcom.sun.management.jmxremote -Dcom.sun.management.jmxremote.port=9999 -Dcom.sun.management.jmxremote.rmi.port=9999 -Dcom.sun.management.jmxremote.authenticate=false -Dcom.sun.management.jmxremote.ssl=false -Djava.rmi.server.hostname=127.0.0.1"
volumes: # to persist data between container restarts or being recreated
  cassandra:
  kafka:
  zookeeper:
  postgres:
  thingsboard-data:
  thingsboard-logs:
启动性能测试工具
根据说明使用下述Docker命令启动性能测试工具。
1
2
3
4
5
6
7
8
9
10
11
# Put your ThingsBoard private IP address here, assuming both ThingsBoard and performance tests EC2 instances are in same VPC.
export TB_INTERNAL_IP=172.31.16.229
docker run -it --rm --network host --name tb-perf-test \
  --env REST_URL=http://$TB_INTERNAL_IP:8080 \
  --env MQTT_HOST=$TB_INTERNAL_IP \
  --env DEVICE_END_IDX=25000 \
  --env MESSAGES_PER_SECOND=10000 \
  --env ALARMS_PER_SECOND=50 \
  --env DURATION_IN_SECONDS=86400 \
  --env DEVICE_CREATE_ON_START=true \
  thingsboard/tb-ce-performance-test:3.3.3
场景D
负载配置:
- 100 000台设备;
- 通过MQTT 5000条消息/秒,每条消息含3个数据点,即15000数据点/秒;
- PostgreSQL存储实体、属性和时序数据最新值;
- Cassandra存储时序数据;
- Kafka队列。
实例:AWS m6a.2xlarge(8 vCPU AMD EPYC 3rd、32 GiB、EBS GP3)
预估成本:167 USD EC2 m6a.2xlarge + 24 USD EBS GP3 300GB = 191 USD/月。
测试运行24小时,结果如下:
经验总结
除Scenario C中的结论外,我们观察到单台ThingsBoard实例可稳定处理100K个并行MQTT连接。 内存消耗从25K设备时的1.5 GB增至100K设备时的6.5 GB,粗略估算每台设备/连接约消耗66KB内存。 我们将在下一版本中努力将该数值降低10倍。
如何复现测试:
在AWS EC2上配置ThingsBoard实例
根据说明使用下述Docker Compose文件在AWS EC2上配置实例。
以下为ThingsBoard + PostgreSQL + Zookeeper + Kafka + Cassandra的docker-compose
1
2
3
4
5
6
7
8
9
10
11
12
13
14
15
16
17
18
19
20
21
22
23
24
25
26
27
28
29
30
31
32
33
34
35
36
37
38
39
40
41
42
43
44
45
46
47
48
49
50
51
52
53
54
55
56
57
58
59
60
61
62
63
64
65
66
67
68
69
70
71
72
73
74
75
76
77
78
79
80
81
82
83
84
85
86
87
88
89
90
91
92
93
94
95
96
97
98
99
100
101
102
103
version: '3.0'
services:
  cassandra:
    image: bitnamilegacy/cassandra:4.0
    network_mode: "host"
    restart: "always"
    volumes:
      - cassandra:/bitnami
    environment:
      CASSANDRA_CLUSTER_NAME: "ThingsBoard Cluster"
      HEAP_NEWSIZE: "4096M"
      MAX_HEAP_SIZE: "8192M"
      JVM_EXTRA_OPTS: "-Dcom.sun.management.jmxremote -Dcom.sun.management.jmxremote.port=7199 -Dcom.sun.management.jmxremote.rmi.port=7199  -Dcom.sun.management.jmxremote.authenticate=false -Dcom.sun.management.jmxremote.ssl=false -Djava.rmi.server.hostname=127.0.0.1"
  zookeeper:
    image: bitnamilegacy/zookeeper:3.7
    network_mode: "host"
    restart: "always"
    volumes:
      - zookeeper:/bitnami
    environment:
      ALLOW_ANONYMOUS_LOGIN: "yes"
      ZOO_ENABLE_ADMIN_SERVER: "no"
      JVMFLAGS: "-Xmx128m -Xms128m -Dcom.sun.management.jmxremote -Dcom.sun.management.jmxremote.port=9199 -Dcom.sun.management.jmxremote.rmi.port=9199  -Dcom.sun.management.jmxremote.authenticate=false -Dcom.sun.management.jmxremote.ssl=false -Djava.rmi.server.hostname=127.0.0.1"
  kafka:
    image: bitnamilegacy/kafka:3
    network_mode: "host"
    restart: "always"
    volumes:
      - kafka:/bitnami
    environment:
      KAFKA_CFG_ZOOKEEPER_CONNECT: "localhost:2181"
      ALLOW_PLAINTEXT_LISTENER: "yes"
      KAFKA_JMX_OPTS: "-Dcom.sun.management.jmxremote -Dcom.sun.management.jmxremote.port=1099 -Dcom.sun.management.jmxremote.rmi.port=1099 -Dcom.sun.management.jmxremote.authenticate=false -Dcom.sun.management.jmxremote.ssl=false -Djava.rmi.server.hostname=127.0.0.1"
      JMX_PORT: "1099"
    depends_on:
      - zookeeper
  postgres:
    image: "postgres:14"
    network_mode: "host"
    restart: "always"
    volumes:
      - postgres:/var/lib/postgresql/data
    environment:
      POSTGRES_DB: "thingsboard"
      POSTGRES_PASSWORD: "postgres"
  tb:
    depends_on:
      - postgres
      - kafka
      - cassandra
    image: "thingsboard/tb"
    network_mode: "host"
    restart: "always"
    volumes:
      - thingsboard-data:/data
      - thingsboard-logs:/var/log/thingsboard
    environment:
      DATABASE_TS_TYPE: "cassandra"
      DATABASE_TS_LATEST_TYPE: "sql"
      #Cassandra
      CASSANDRA_CLUSTER_NAME: "ThingsBoard Cluster"
      CASSANDRA_LOCAL_DATACENTER: "datacenter1"
      CASSANDRA_KEYSPACE_NAME: "thingsboard"
      CASSANDRA_URL: "127.0.0.1:9042"
      CASSANDRA_USE_CREDENTIALS: "true"
      CASSANDRA_USERNAME: "cassandra"
      CASSANDRA_PASSWORD: "cassandra"
      CASSANDRA_QUERY_BUFFER_SIZE: "200000"
      CASSANDRA_QUERY_CONCURRENT_LIMIT: "1000"
      CASSANDRA_QUERY_POLL_MS: "5"
      #Kafka
      TB_QUEUE_TYPE: "kafka"
      TB_KAFKA_BATCH_SIZE: "65536" # default is 16384 - it helps to produce messages much efficiently
      TB_KAFKA_LINGER_MS: "5" # default is 1
      TB_QUEUE_KAFKA_MAX_POLL_RECORDS: "2048" # default is 8192
      TB_SERVICE_ID: "tb-node-0"
      HTTP_BIND_PORT: "8080"
      TB_QUEUE_RE_MAIN_PACK_PROCESSING_TIMEOUT_MS: "30000"
      # Postgres connection
      SPRING_DATASOURCE_URL: "jdbc:postgresql://localhost:5432/thingsboard"
      SPRING_DATASOURCE_USERNAME: "postgres"
      SPRING_DATASOURCE_PASSWORD: "postgres"
      # Cache specs
      CACHE_SPECS_DEVICES_MAX_SIZE: "512000" # default is 10000
      CACHE_SPECS_DEVICE_CREDENTIALS_MAX_SIZE: "512000" # default is 10000
      CACHE_SPECS_SESSIONS_MAX_SIZE: "512000" # default is 10000
      TS_KV_PARTITIONS_MAX_CACHE_SIZE: "3000000" # default is 100000
      # Device state service
      DEFAULT_INACTIVITY_TIMEOUT: "1800" # defailt is 600 (10min)
      DEFAULT_STATE_CHECK_INTERVAL: "600" # default is 60 (1min)
      # Java options for 16G instance and JMX enabled
      JAVA_OPTS: " -Xmx8192M -Xms8192M -Dcom.sun.management.jmxremote -Dcom.sun.management.jmxremote.port=9999 -Dcom.sun.management.jmxremote.rmi.port=9999 -Dcom.sun.management.jmxremote.authenticate=false -Dcom.sun.management.jmxremote.ssl=false -Djava.rmi.server.hostname=127.0.0.1"
    ulimits:
      nofile:
        soft: 1048576
        hard: 1048576
volumes: # to persist data between container restarts or being recreated
  cassandra:
  kafka:
  zookeeper:
  postgres:
  thingsboard-data:
  thingsboard-logs:
在两节点上启动性能测试工具
根据说明使用下述Docker命令启动性能测试工具。
需要至少两个性能测试实例才能产生100k个同时连接,因为每个测试实例最多可向同一外部服务器建立65535个同时连接。 默认情况下,Ubuntu Linux允许您发起28232个出站连接,本地端口范围为32768到60999。 因此,我们需要在建立大量出站连接的性能测试实例上增大IP本地端口范围。调整后最多可开放64511个IP端口。
1
2
3
4
5
6
7
8
9
10
ssh pt
cat /proc/sys/net/ipv4/ip_local_port_range
#32768	60999
echo "net.ipv4.ip_local_port_range = 1024 65535" | sudo tee -a /etc/sysctl.conf
sudo -s sysctl -p
cat /proc/sys/net/ipv4/ip_local_port_range
#1024	65535
ulimit -n 1048576
sudo sysctl -a | grep conntrack_max
sudo sysctl -w net.netfilter.nf_conntrack_max=1048576
以下是_第一个节点_的运行脚本。
1
2
3
4
5
6
7
8
9
10
11
12
# Put your ThingsBoard private IP address here, assuming both ThingsBoard and performance tests EC2 instances are in same VPC.
export TB_INTERNAL_IP=172.31.16.229
docker run -it --rm --network host --name tb-perf-test \
  --env REST_URL=http://$TB_INTERNAL_IP:8080 \
  --env MQTT_HOST=$TB_INTERNAL_IP \
  --env DEVICE_START_IDX=0 \
  --env DEVICE_END_IDX=50000 \
  --env MESSAGES_PER_SECOND=2500 \
  --env ALARMS_PER_SECOND=10 \
  --env DURATION_IN_SECONDS=86400 \
  --env DEVICE_CREATE_ON_START=true \
  thingsboard/tb-ce-performance-test:3.3.3
以下是_第二个节点_的运行脚本。注意DEVICE_START_IDX和DEVICE_END_IDX与第一个节点不同。
1
2
3
4
5
6
7
8
9
10
11
12
# Put your ThingsBoard private IP address here, assuming both ThingsBoard and performance tests EC2 instances are in same VPC.
export TB_INTERNAL_IP=172.31.16.229
docker run -it --rm --network host --name tb-perf-test \
  --env REST_URL=http://$TB_INTERNAL_IP:8080 \
  --env MQTT_HOST=$TB_INTERNAL_IP \
  --env DEVICE_START_IDX=50000 \
  --env DEVICE_END_IDX=100000 \
  --env MESSAGES_PER_SECOND=2500 \
  --env ALARMS_PER_SECOND=10 \
  --env DURATION_IN_SECONDS=86400 \
  --env DEVICE_CREATE_ON_START=true \
  thingsboard/tb-ce-performance-test:3.3.3
场景E
负载配置:
- 100 000台设备;
- 通过MQTT 10000条消息/秒,每条消息含3个数据点,即30000数据点/秒;
- PostgreSQL存储实体、属性和时序数据最新值;
- Cassandra存储时序数据;
- Kafka队列。
实例:AWS m6a.2xlarge(8 vCPU AMD EPYC 3rd、32 GiB、EBS GP3)
预估成本:167 USD EC2 m6a.2xlarge + 24 USD EBS GP3 300GB = 191 USD/月。
必要的性能调优
100k设备、10k条消息/秒时,系统平均约可处理9k条/秒。 CPU负载90%,面临PostgreSQL性能瓶颈。 不同键的属性更新过多。 属性 ‘lastActivityTime’ 在每条设备消息到达时都尝试更新。 5k设备时无问题,100k设备时事务明显变慢。 后续将把设备状态写入Cassandra。
将设备状态持久化到Cassandra遥测可显著提升性能,使用以下环境变量:
1
      PERSIST_STATE_TO_TELEMETRY: "true" # Persist device state to the Cassandra. Default is false (Postgres, as device server_scope attributes)
测试结果良好:
24小时运行结果如下:
经验总结:
m6a.2xlarge最多可支撑100k台设备、10k条消息/秒。 CPU使用率93%,峰值负载和用户活动几乎无剩余资源。
如何复现测试:
在AWS EC2上配置ThingsBoard实例
根据说明使用下述Docker Compose文件在AWS EC2上配置实例。
以下为ThingsBoard + PostgreSQL + Zookeeper + Kafka + Cassandra的docker-compose
1
2
3
4
5
6
7
8
9
10
11
12
13
14
15
16
17
18
19
20
21
22
23
24
25
26
27
28
29
30
31
32
33
34
35
36
37
38
39
40
41
42
43
44
45
46
47
48
49
50
51
52
53
54
55
56
57
58
59
60
61
62
63
64
65
66
67
68
69
70
71
72
73
74
75
76
77
78
79
80
81
82
83
84
85
86
87
88
89
90
91
92
93
94
95
96
97
98
99
100
101
102
103
104
version: '3.0'
services:
  cassandra:
    image: bitnamilegacy/cassandra:4.0
    network_mode: "host"
    restart: "always"
    volumes:
      - cassandra:/bitnami
    environment:
      CASSANDRA_CLUSTER_NAME: "ThingsBoard Cluster"
      HEAP_NEWSIZE: "4096M"
      MAX_HEAP_SIZE: "8192M"
      JVM_EXTRA_OPTS: "-Dcom.sun.management.jmxremote -Dcom.sun.management.jmxremote.port=7199 -Dcom.sun.management.jmxremote.rmi.port=7199  -Dcom.sun.management.jmxremote.authenticate=false -Dcom.sun.management.jmxremote.ssl=false -Djava.rmi.server.hostname=127.0.0.1"
  zookeeper:
    image: bitnamilegacy/zookeeper:3.7
    network_mode: "host"
    restart: "always"
    volumes:
      - zookeeper:/bitnami
    environment:
      ALLOW_ANONYMOUS_LOGIN: "yes"
      ZOO_ENABLE_ADMIN_SERVER: "no"
      JVMFLAGS: "-Xmx128m -Xms128m -Dcom.sun.management.jmxremote -Dcom.sun.management.jmxremote.port=9199 -Dcom.sun.management.jmxremote.rmi.port=9199  -Dcom.sun.management.jmxremote.authenticate=false -Dcom.sun.management.jmxremote.ssl=false -Djava.rmi.server.hostname=127.0.0.1"
  kafka:
    image: bitnamilegacy/kafka:3
    network_mode: "host"
    restart: "always"
    volumes:
      - kafka:/bitnami
    environment:
      KAFKA_CFG_ZOOKEEPER_CONNECT: "localhost:2181"
      ALLOW_PLAINTEXT_LISTENER: "yes"
      KAFKA_JMX_OPTS: "-Dcom.sun.management.jmxremote -Dcom.sun.management.jmxremote.port=1099 -Dcom.sun.management.jmxremote.rmi.port=1099 -Dcom.sun.management.jmxremote.authenticate=false -Dcom.sun.management.jmxremote.ssl=false -Djava.rmi.server.hostname=127.0.0.1"
      JMX_PORT: "1099"
    depends_on:
      - zookeeper
  postgres:
    image: "postgres:14"
    network_mode: "host"
    restart: "always"
    volumes:
      - postgres:/var/lib/postgresql/data
    environment:
      POSTGRES_DB: "thingsboard"
      POSTGRES_PASSWORD: "postgres"
  tb:
    depends_on:
      - postgres
      - kafka
      - cassandra
    image: "thingsboard/tb"
    network_mode: "host"
    restart: "always"
    volumes:
      - thingsboard-data:/data
      - thingsboard-logs:/var/log/thingsboard
    environment:
      DATABASE_TS_TYPE: "cassandra"
      DATABASE_TS_LATEST_TYPE: "sql"
      #Cassandra
      CASSANDRA_CLUSTER_NAME: "ThingsBoard Cluster"
      CASSANDRA_LOCAL_DATACENTER: "datacenter1"
      CASSANDRA_KEYSPACE_NAME: "thingsboard"
      CASSANDRA_URL: "127.0.0.1:9042"
      CASSANDRA_USE_CREDENTIALS: "true"
      CASSANDRA_USERNAME: "cassandra"
      CASSANDRA_PASSWORD: "cassandra"
      CASSANDRA_QUERY_BUFFER_SIZE: "200000"
      CASSANDRA_QUERY_CONCURRENT_LIMIT: "1000"
      CASSANDRA_QUERY_POLL_MS: "5"
      #Kafka
      TB_QUEUE_TYPE: "kafka"
      TB_KAFKA_BATCH_SIZE: "65536" # default is 16384 - it helps to produce messages much efficiently
      TB_KAFKA_LINGER_MS: "5" # default is 1
      TB_QUEUE_KAFKA_MAX_POLL_RECORDS: "2048" # default is 8192
      TB_SERVICE_ID: "tb-node-0"
      HTTP_BIND_PORT: "8080"
      TB_QUEUE_RE_MAIN_PACK_PROCESSING_TIMEOUT_MS: "30000"
      # Postgres connection
      SPRING_DATASOURCE_URL: "jdbc:postgresql://localhost:5432/thingsboard"
      SPRING_DATASOURCE_USERNAME: "postgres"
      SPRING_DATASOURCE_PASSWORD: "postgres"
      # Cache specs
      CACHE_SPECS_DEVICES_MAX_SIZE: "512000" # default is 10000
      CACHE_SPECS_DEVICE_CREDENTIALS_MAX_SIZE: "512000" # default is 10000
      CACHE_SPECS_SESSIONS_MAX_SIZE: "512000" # default is 10000
      TS_KV_PARTITIONS_MAX_CACHE_SIZE: "3000000" # default is 100000
      # Device state service
      DEFAULT_INACTIVITY_TIMEOUT: "1800" # defailt is 600 (10min)
      DEFAULT_STATE_CHECK_INTERVAL: "600" # default is 60 (1min)
      PERSIST_STATE_TO_TELEMETRY: "true" # Persist device state to the Cassandra. Default is false (Postgres, as device server_scope attributes)
      # Java options for 16G instance and JMX enabled
      JAVA_OPTS: " -Xmx8192M -Xms8192M -Dcom.sun.management.jmxremote -Dcom.sun.management.jmxremote.port=9999 -Dcom.sun.management.jmxremote.rmi.port=9999 -Dcom.sun.management.jmxremote.authenticate=false -Dcom.sun.management.jmxremote.ssl=false -Djava.rmi.server.hostname=127.0.0.1"
    ulimits:
      nofile:
        soft: 1048576
        hard: 1048576
volumes: # to persist data between container restarts or being recreated
  cassandra:
  kafka:
  zookeeper:
  postgres:
  thingsboard-data:
  thingsboard-logs:
在两节点上启动性能测试工具
根据说明使用下述Docker命令启动性能测试工具。
需要至少两个性能测试实例才能产生100k个同时连接,因为每个测试实例最多可向同一外部服务器建立65535个同时连接。 默认情况下,Ubuntu Linux允许您发起28232个出站连接,本地端口范围为32768到60999。 因此,我们需要在建立大量出站连接的性能测试实例上增大IP本地端口范围。调整后最多可开放64511个IP端口。
1
2
3
4
5
6
7
8
9
10
ssh pt
cat /proc/sys/net/ipv4/ip_local_port_range
#32768	60999
echo "net.ipv4.ip_local_port_range = 1024 65535" | sudo tee -a /etc/sysctl.conf
sudo -s sysctl -p
cat /proc/sys/net/ipv4/ip_local_port_range
#1024	65535
ulimit -n 1048576
sudo sysctl -a | grep conntrack_max
sudo sysctl -w net.netfilter.nf_conntrack_max=1048576
以下是_第一个节点_的运行脚本。
1
2
3
4
5
6
7
8
9
10
11
12
# Put your ThingsBoard private IP address here, assuming both ThingsBoard and performance tests EC2 instances are in same VPC.
export TB_INTERNAL_IP=172.31.16.229
docker run -it --rm --network host --name tb-perf-test \
  --env REST_URL=http://$TB_INTERNAL_IP:8080 \
  --env MQTT_HOST=$TB_INTERNAL_IP \
  --env DEVICE_START_IDX=0 \
  --env DEVICE_END_IDX=50000 \
  --env MESSAGES_PER_SECOND=2500 \
  --env ALARMS_PER_SECOND=10 \
  --env DURATION_IN_SECONDS=86400 \
  --env DEVICE_CREATE_ON_START=true \
  thingsboard/tb-ce-performance-test:3.3.3
以下是_第二个节点_的运行脚本。注意DEVICE_START_IDX和DEVICE_END_IDX与第一个节点不同。
1
2
3
4
5
6
7
8
9
10
11
12
# Put your ThingsBoard private IP address here, assuming both ThingsBoard and performance tests EC2 instances are in same VPC.
export TB_INTERNAL_IP=172.31.16.229
docker run -it --rm --network host --name tb-perf-test \
  --env REST_URL=http://$TB_INTERNAL_IP:8080 \
  --env MQTT_HOST=$TB_INTERNAL_IP \
  --env DEVICE_START_IDX=50000 \
  --env DEVICE_END_IDX=100000 \
  --env MESSAGES_PER_SECOND=2500 \
  --env ALARMS_PER_SECOND=10 \
  --env DURATION_IN_SECONDS=86400 \
  --env DEVICE_CREATE_ON_START=true \
  thingsboard/tb-ce-performance-test:3.3.3
附加检查
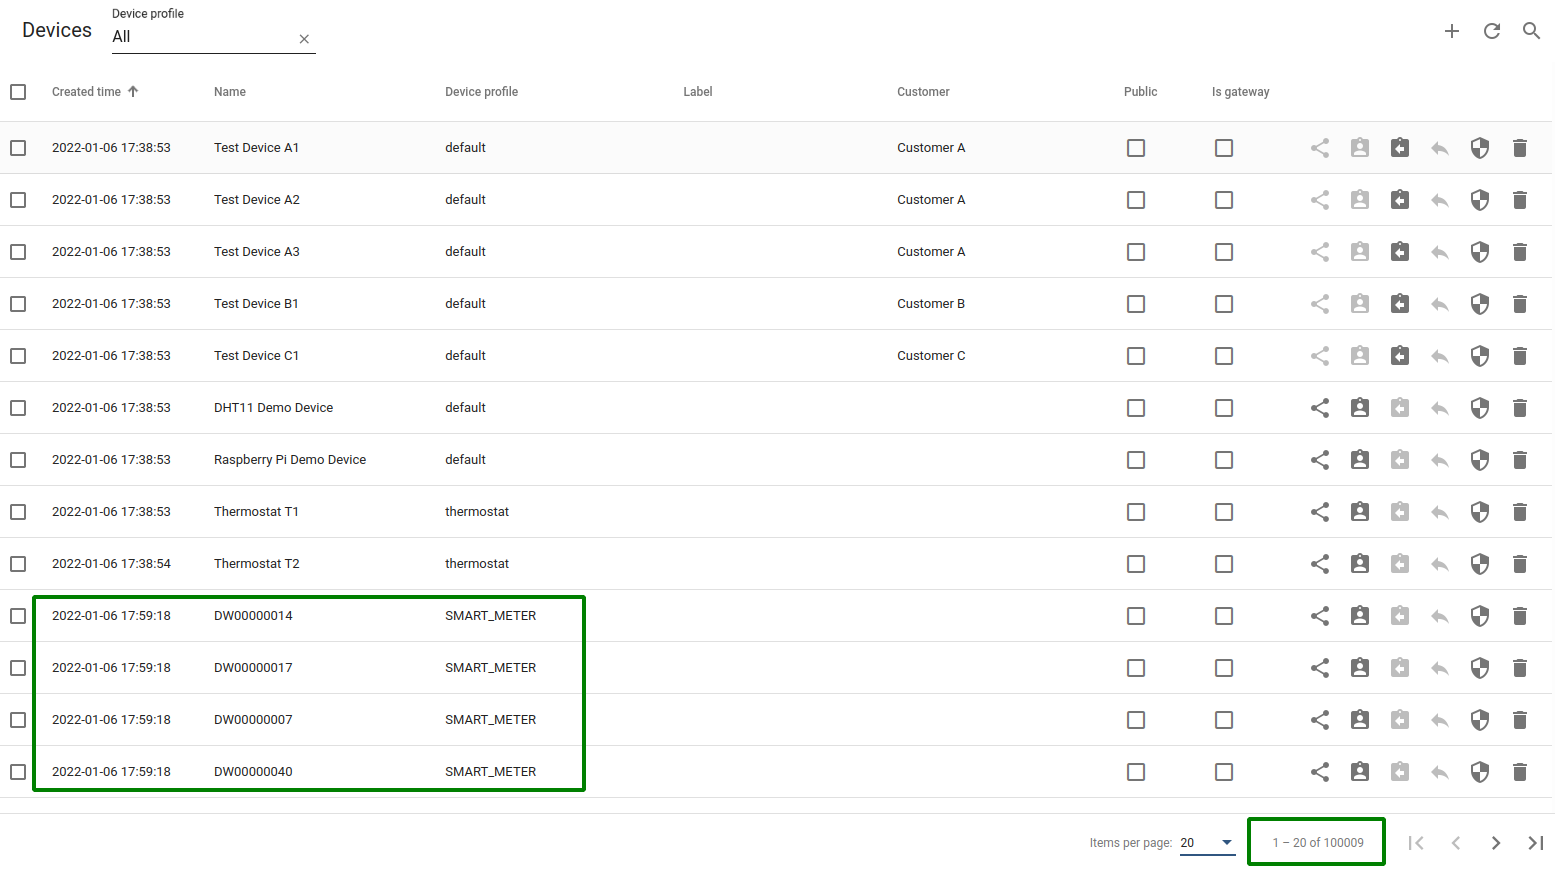
以下为确认测试有效运行、所有设备已创建并连接的要点:
-
所有设备已创建。打开设备列表,检查设备总数,须大于100k。
-
所有设备已连接。在日志中查看Transport Stats。
1
tb_1         | 2022-01-06 16:37:11,716 [TB-Scheduling-3] INFO  o.t.s.c.t.s.DefaultTransportService - Transport Stats: openConnections [100000]
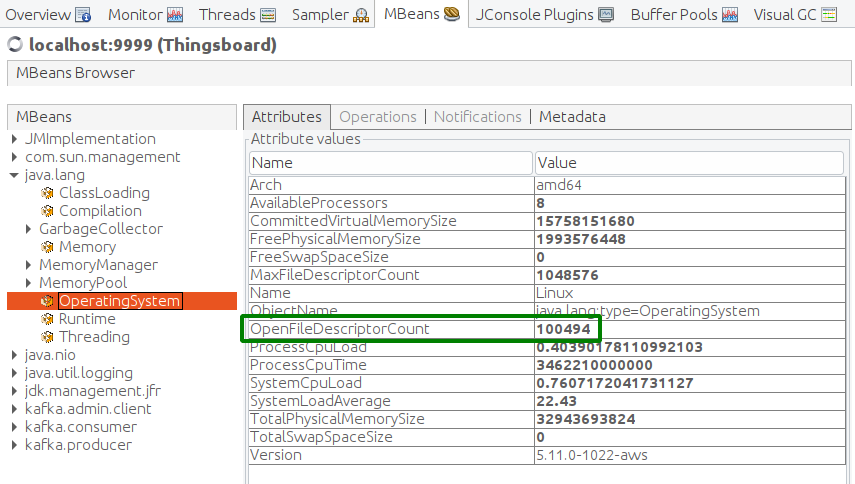
- 所有设备已连接。Java JMX:VisualVM -> ThingsBoard -> MBeans -> java.lang -> OpenFileDescriptorCount -> 应大于100000
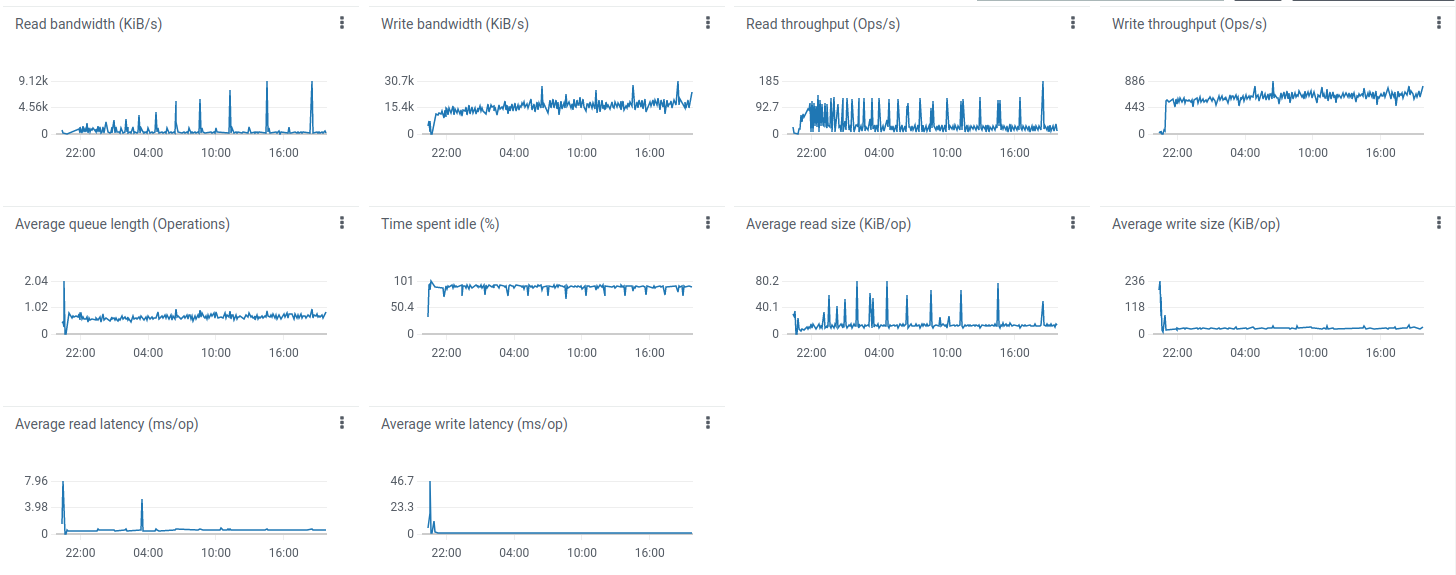
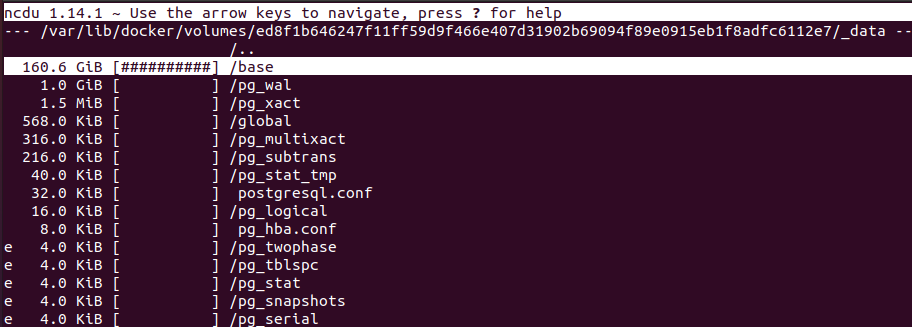
磁盘使用
Postgres磁盘使用
Scenario B测试结束当日,系统磁盘空间耗尽。
平均5k条消息/秒、15k数据点/秒下,200GB磁盘约24小时填满;总消息3.63亿,数据点11亿。
Postgres数据库约160GiB,每1 GiB磁盘空间约7M数据点。更高的磁盘利用率请参见Cassandra磁盘使用情况。
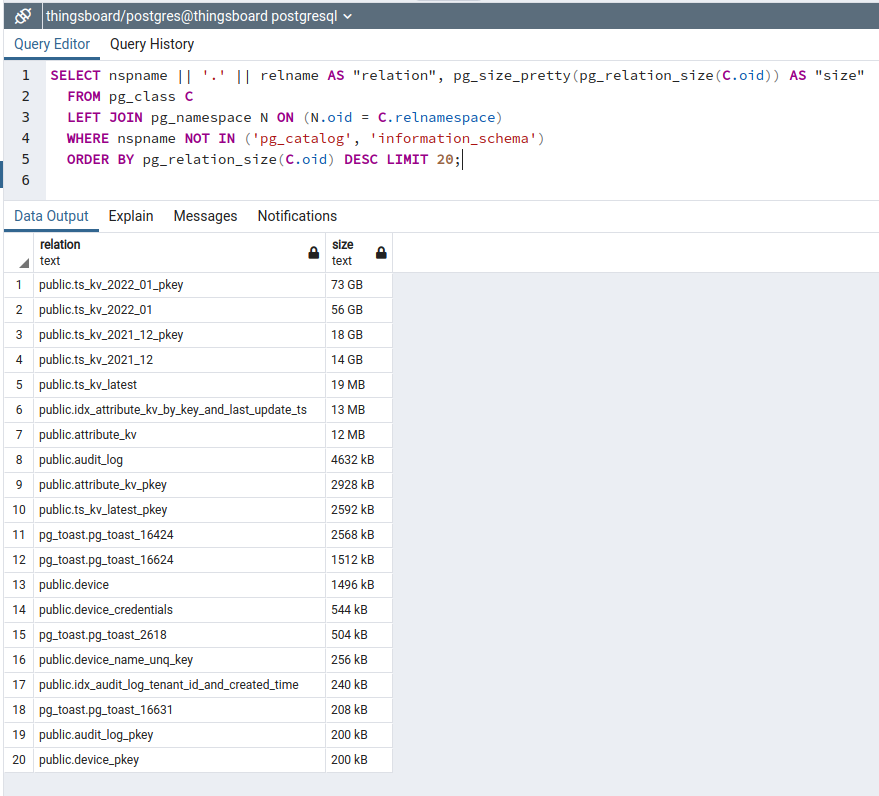
按表和索引查看PostgreSQL磁盘使用详情
1
2
3
4
5
SELECT nspname || '.' || relname AS "relation", pg_size_pretty(pg_relation_size(C.oid)) AS "size"
  FROM pg_class C
  LEFT JOIN pg_namespace N ON (N.oid = C.relnamespace)
  WHERE nspname NOT IN ('pg_catalog', 'information_schema')
  ORDER BY pg_relation_size(C.oid) DESC LIMIT 20;
可见最大的表为时序(TS、遥测、数据点)及TS索引。所有遥测按月分区以保持稳定性能。
测试于12月启动、1月结束,TS包含2021_12和2022_01两张表。
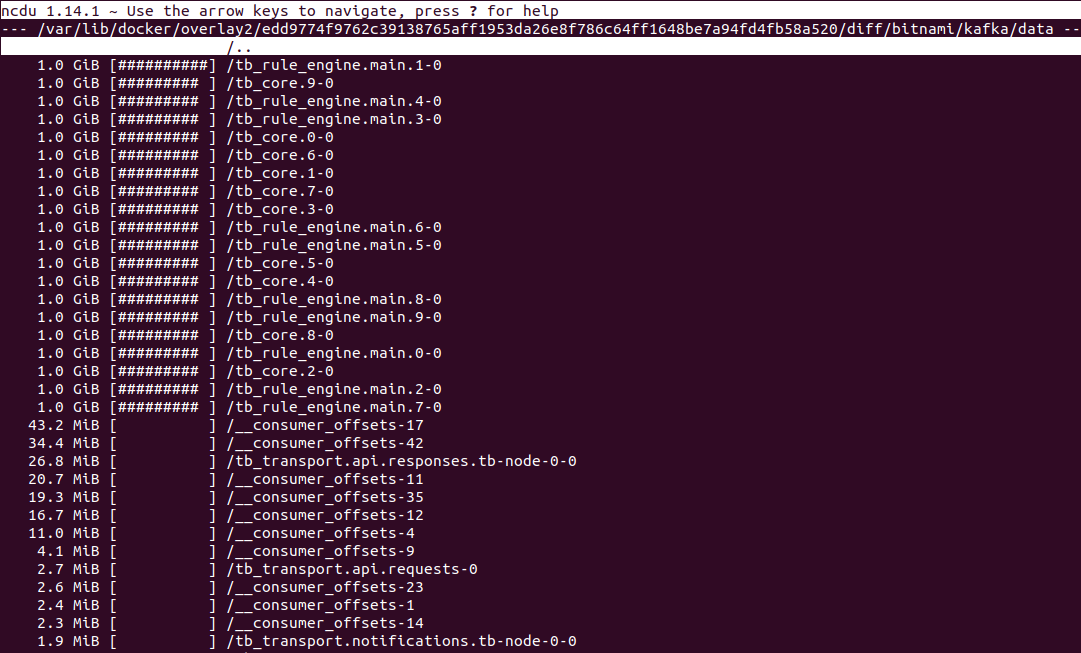
Kafka约20GiB。
提示:规划和管理Kafka磁盘空间时,请调整大小保留策略和时长保留策略。

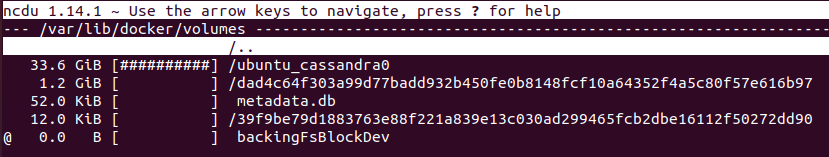
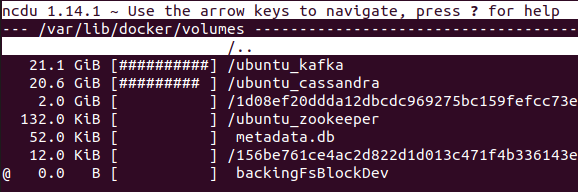
Cassandra磁盘使用
24小时内(100k设备、4.32亿消息)存储的数据点总计13亿。
Cassandra约20 GiB存储13亿数据点,即每1 GiB磁盘空间约6500万数据点。
注:磁盘上的数据大小可能因内容而异。
磁盘使用总结
相比PostgreSQL,Cassandra的磁盘空间消耗约低5–10倍。
Cassandra的优势在于数据压缩及数据结构开销更小。
另一优点是Cassandra写入操作少于Postgres。标准IOPS方案即可满足存储需求并降低成本。
致谢
感谢您花时间阅读本文。 感谢ThingsBoard社区持续提出问题并分享性能解决方案。 感谢Sergey执行测试、进行性能优化并为本文做出贡献。
测试基于ThingsBoard 3.3.3版本。我们将在3.4.x中继续优化性能。
欢迎在GitHub反馈或分享您的部署经验。