本指南描述如何为可视化准备数据集
数据分析中常需定义大数据集的聚合方式。 该任务可分为2个阶段:定义分析中使用的分组,以及定义分组的聚合函数。
定义分析分组
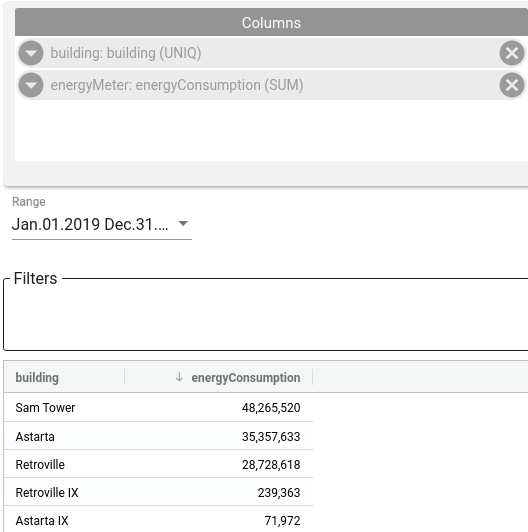
在此步骤中,定义数据的逻辑层级。以能源计量场景为例,可在城市、区域、建筑、公寓或具体能量表等不同层级分析。 Trendz实时自动提供此分组,无需在分析前显式定义聚合规则或预计算各层级值。
本示例只需添加2个字段——Building name和Energy Consumption。Rule Engine中无聚合规则。 Trendz知道每栋建筑下注册了哪些Energy Meter,因此按建筑将能量表分为不同组。
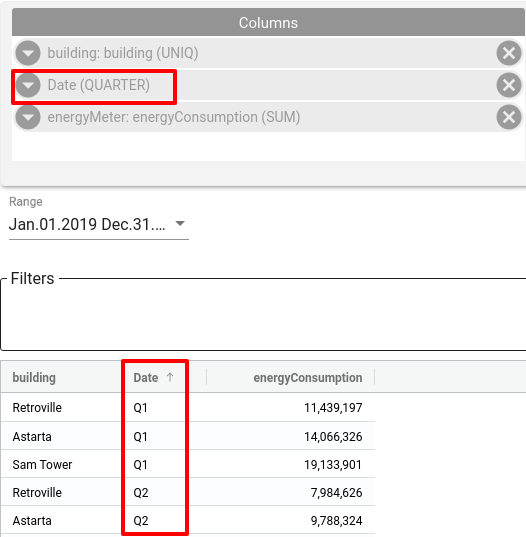
可看到去年总消耗。若按季度分组,添加类型为 quarter 的 Date 字段:
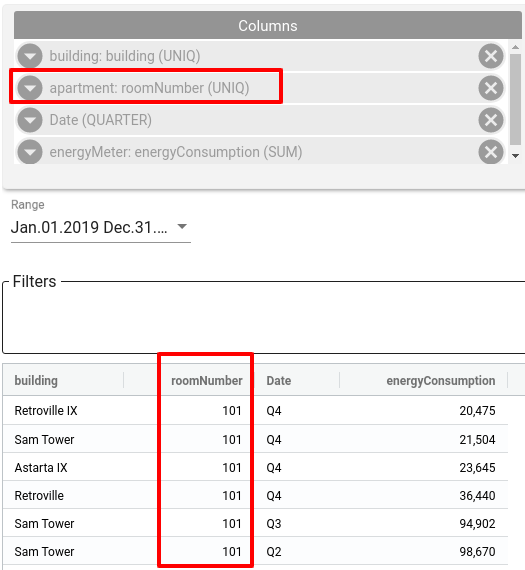
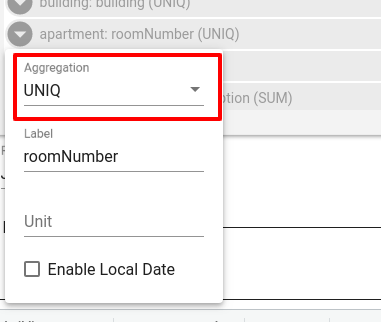
若要按房间号查看消耗,可从 Apartment 业务实体添加 Room Number 属性:
遥测与分组聚合
下一步是定义数据如何聚合。支持的聚合类型:
- AVG
- SUM
- MIN
- MAX
- LATEST
- COUNT
- UNIQ
- DELTA - 特殊情况,本指南后文说明
修改聚合类型:点击字段并选择所需值。
脉冲输出遥测的处理
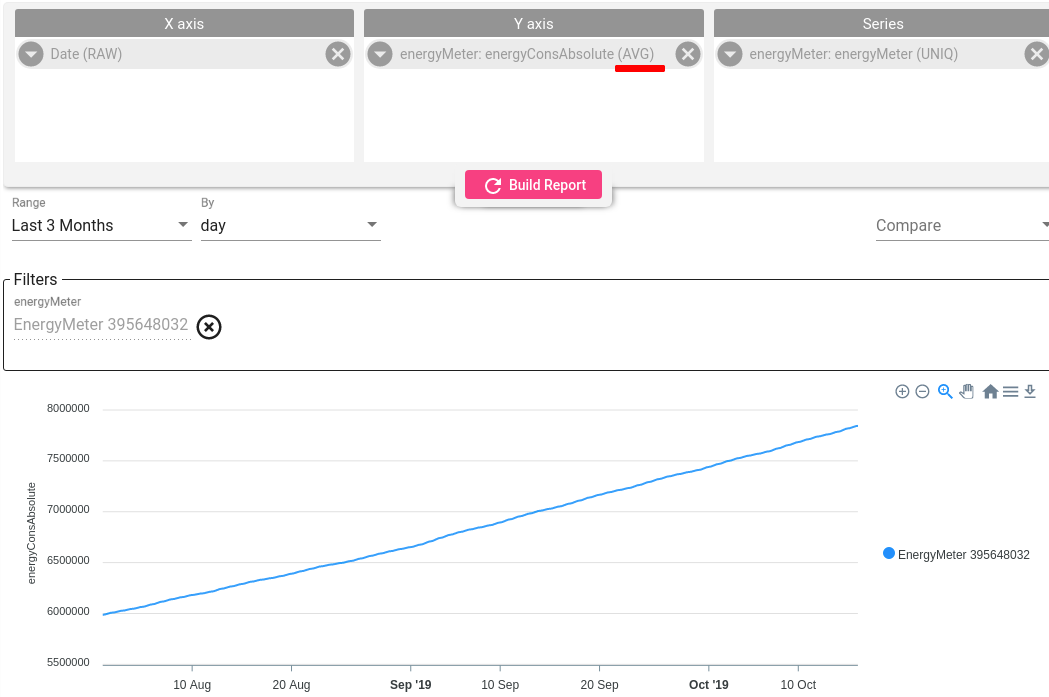
水表是典型的 pulse output 设备——telemetry值持续增长,分析中需将其转为delta值。 示例如下:
对该字段应用DELTA聚合后的效果:
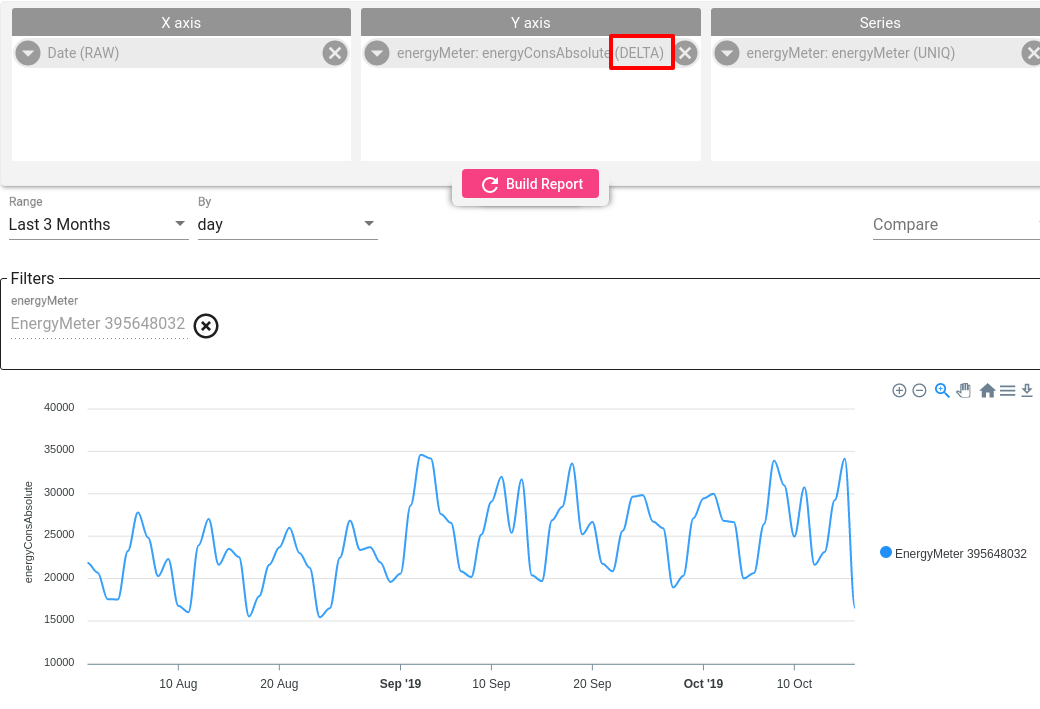
Trendz按定义的时间范围和粒度自动计算该字段的delta。 若对多台设备应用DELTA聚合,Trendz会对聚合组应用SUM,从而在不同层级(城市、建筑等)看到总 consumption。
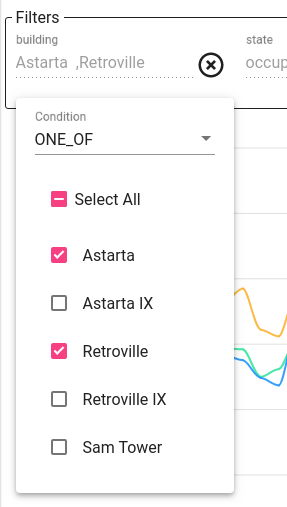
筛选数据
为获得更好的分析结果,需过滤噪声源或聚焦特定实体子集。 将要过滤的字段拖入Filter区域并应用所需过滤条件。
可对未用于可视化的字段应用过滤器。例如能耗分析中过滤空公寓,聚焦二、三层公寓,配置示例如下:
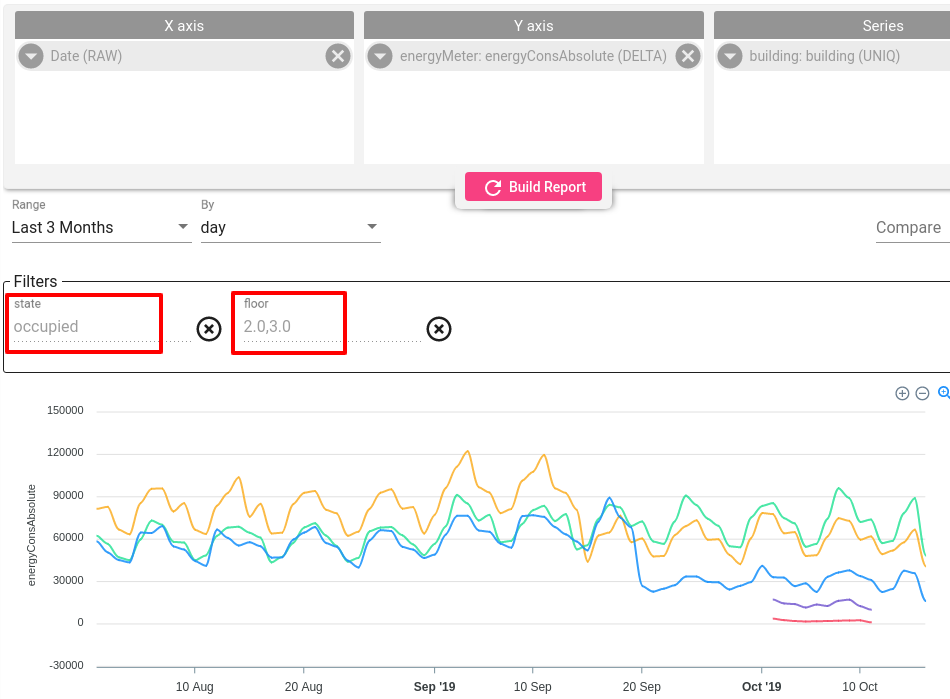
可过滤任意字段类型(string、numeric、date等)。修改过滤条件:点击过滤字段并选择所需选项: