- Introduction
- Getting started:
- Prerequisites
- Step 1: Compute hourly occupancy rate as a percent from max capacity for each area
- Step 2: Compute occupancy rate for the whole floor and building
- Step 3: Predict an occupancy rate for the upcoming week with hourly breakdown
- Step 4: Bar chart with top-5 overcrowded/underutilized areas in the hotel
- Step 5: Create occupancy analysis dashboard in ThingsBoard
- Summary
Introduction
某中型酒店希望提升客户体验、降低运营成本,因此引入occupancy monitoring。 希望通过分析不同区域的受欢迎程度和时段,更合理地调配人力和资源。 同时希望减少能耗、识别HVAC系统潜在问题,降低环境影响。
任务定义 - 分析酒店内不同区域的occupancy rate,并预测未来一周的 hourly occupancy rate。
Implementation plan
- 计算各区域按最大容量百分比的hourly occupancy rate
- 计算整层、整栋建筑的occupancy rate
- 构建未来一周occupancy rate预测
- 展示各区域/楼层/建筑的周heatmap
- 显示top-5拥挤区域
- 显示top-5低利用率区域
- 在ThingsBoard创建occupancy分析dashboard
Key outcomes
- 公共事业成本降低12%
- 人力成本降低15%
- 正面客户评价提升10%
Getting started:
Prerequisites
本指南聚焦数据分析和可视化,传感器安装与配置从简。系统概况如下:
- 酒店各区域已安装occupancy sensors,通过LoRaWAN integration连接ThingsBoard
- ThingsBoard中有3种asset类型:building、floor、area。Building关联多个floor,floor关联多个area,每个area关联occupancy sensor
- 传感器上报当前区域内人数
- Occupancy sensor payload——
{"ts": 1651419204000, peopleCnt": 5} - 每个area有最大容量attribute。用于计算occupancy rate。provision时设置初始值
Step 1: Compute hourly occupancy rate as a percent from max capacity for each area
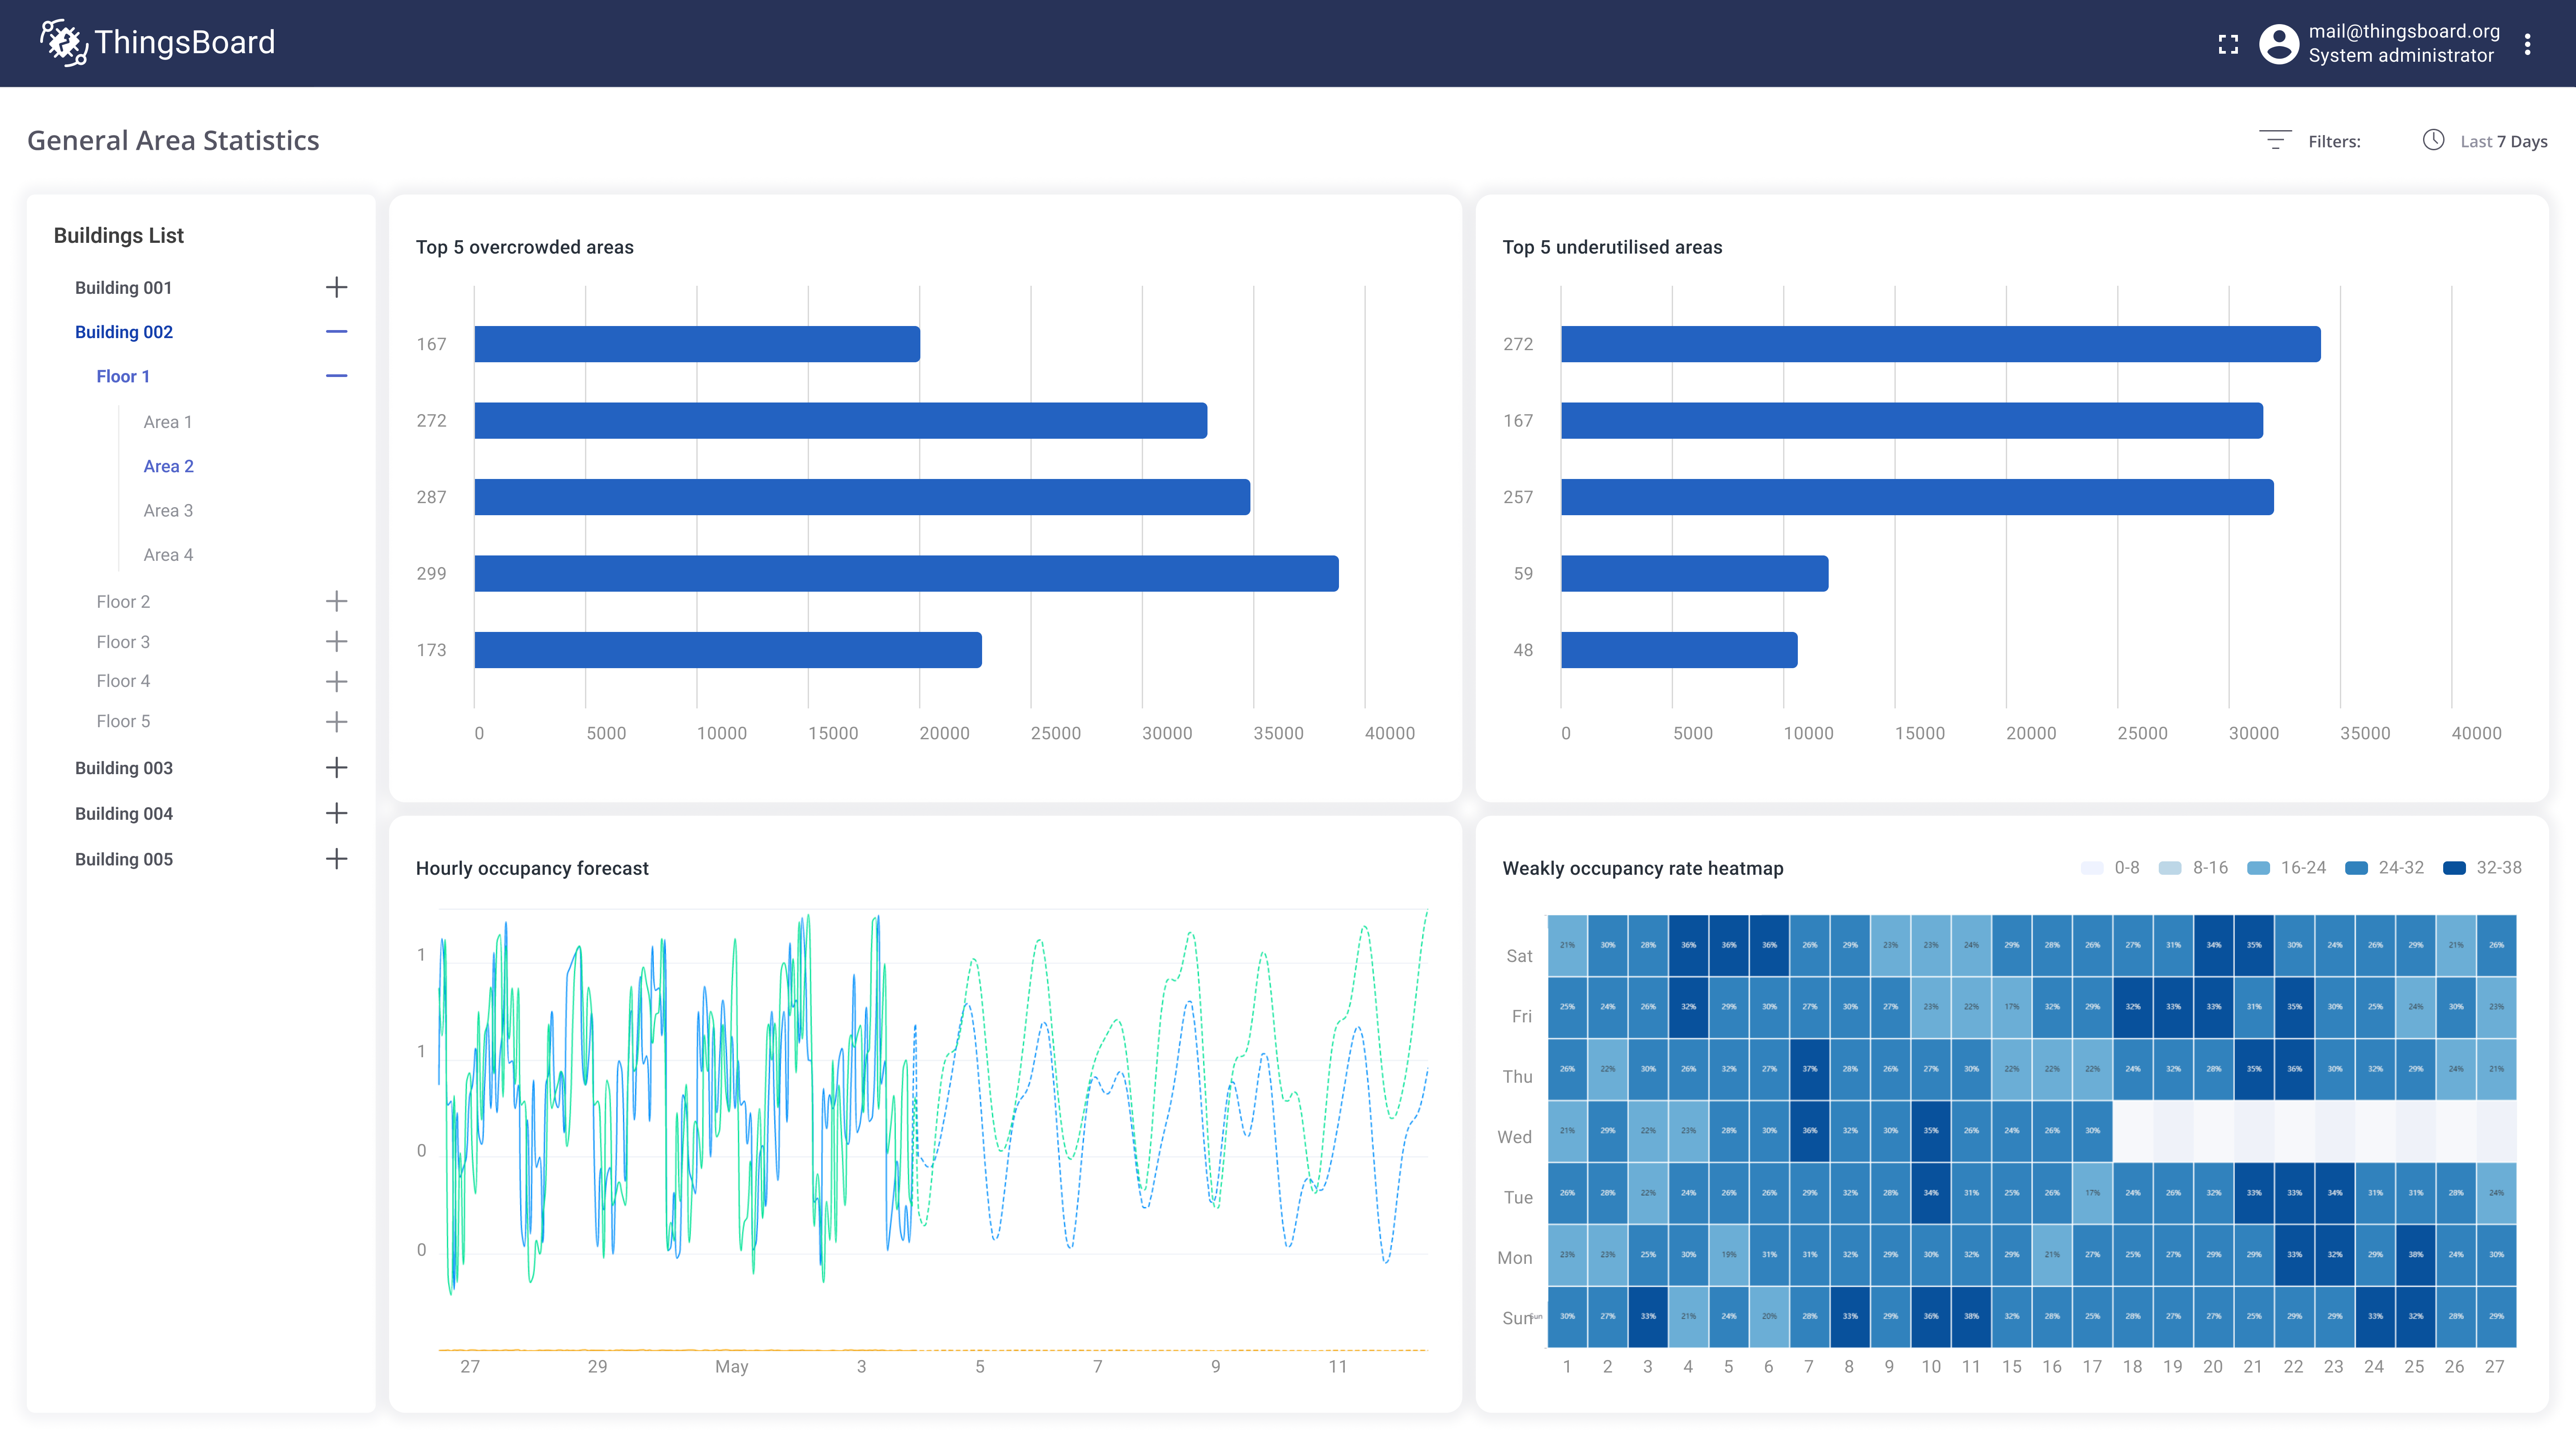
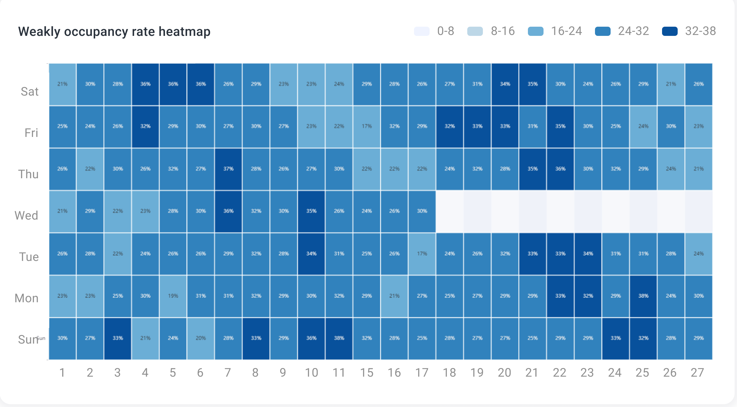
先计算各区域的occupancy rate。使用Trendz calculated field,基于区域最大容量和传感器上报的历史occupancy定义公式。 使用heatmap展示过去7天各小时的occupancy rate。用户可切换时间范围,聚焦实时或历史数据。
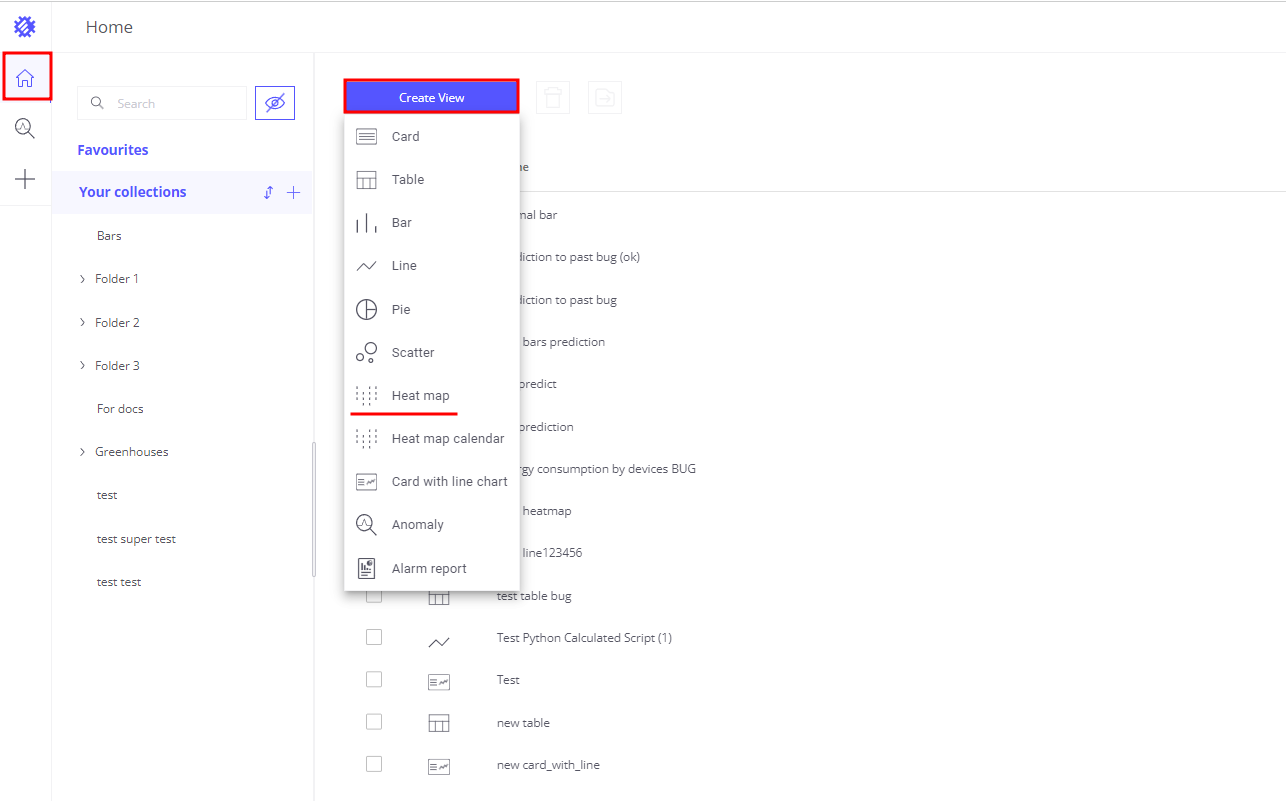
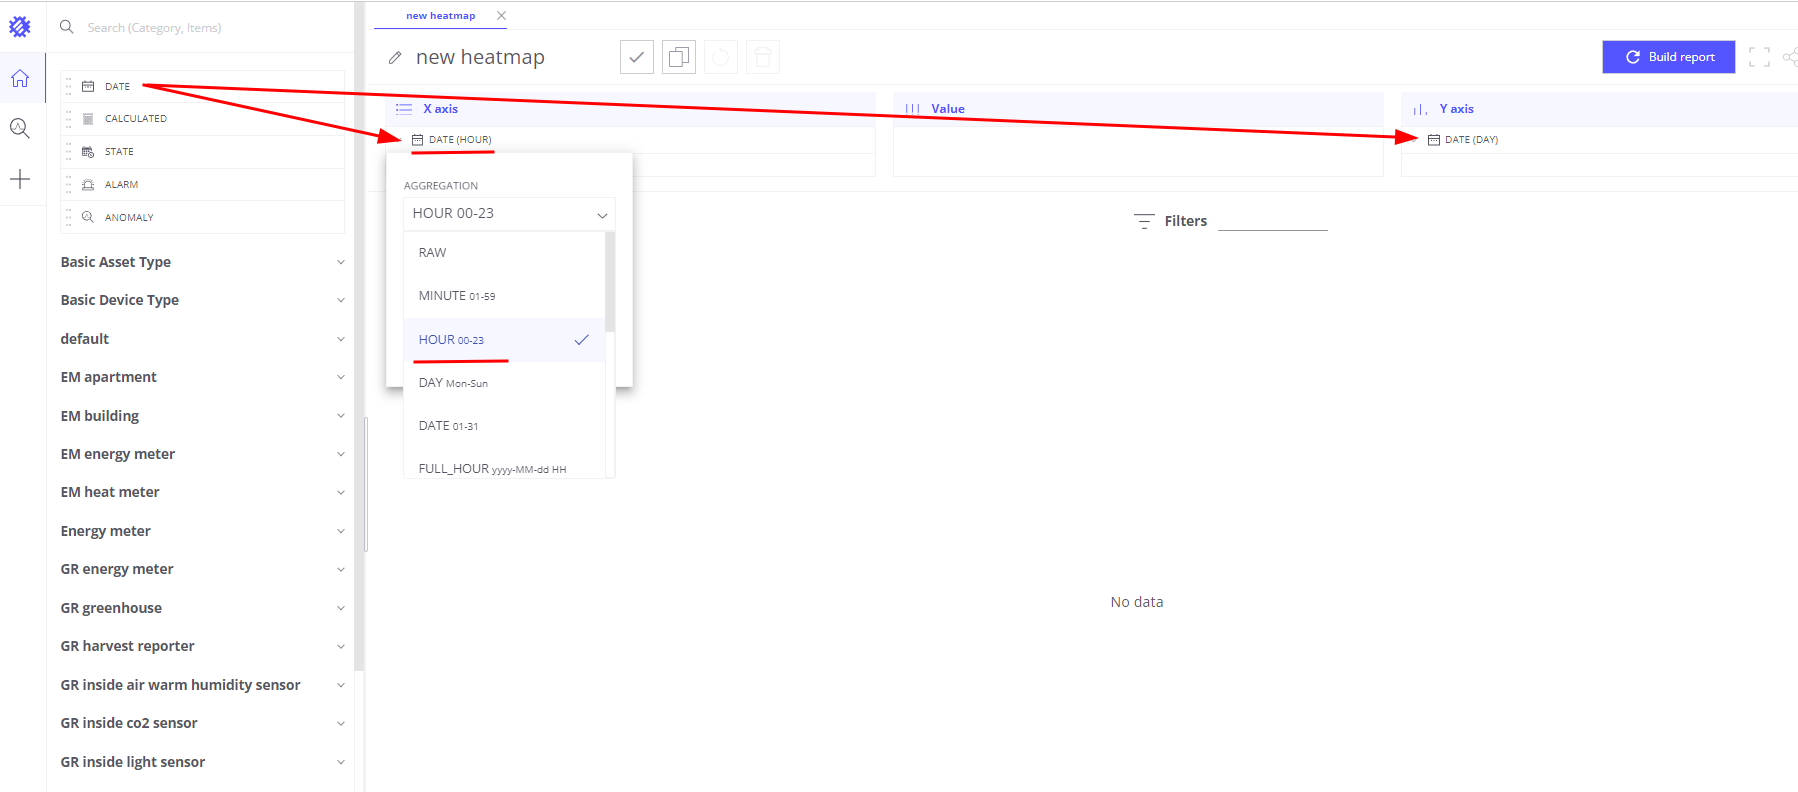
- 创建Heatmap视图
- 在
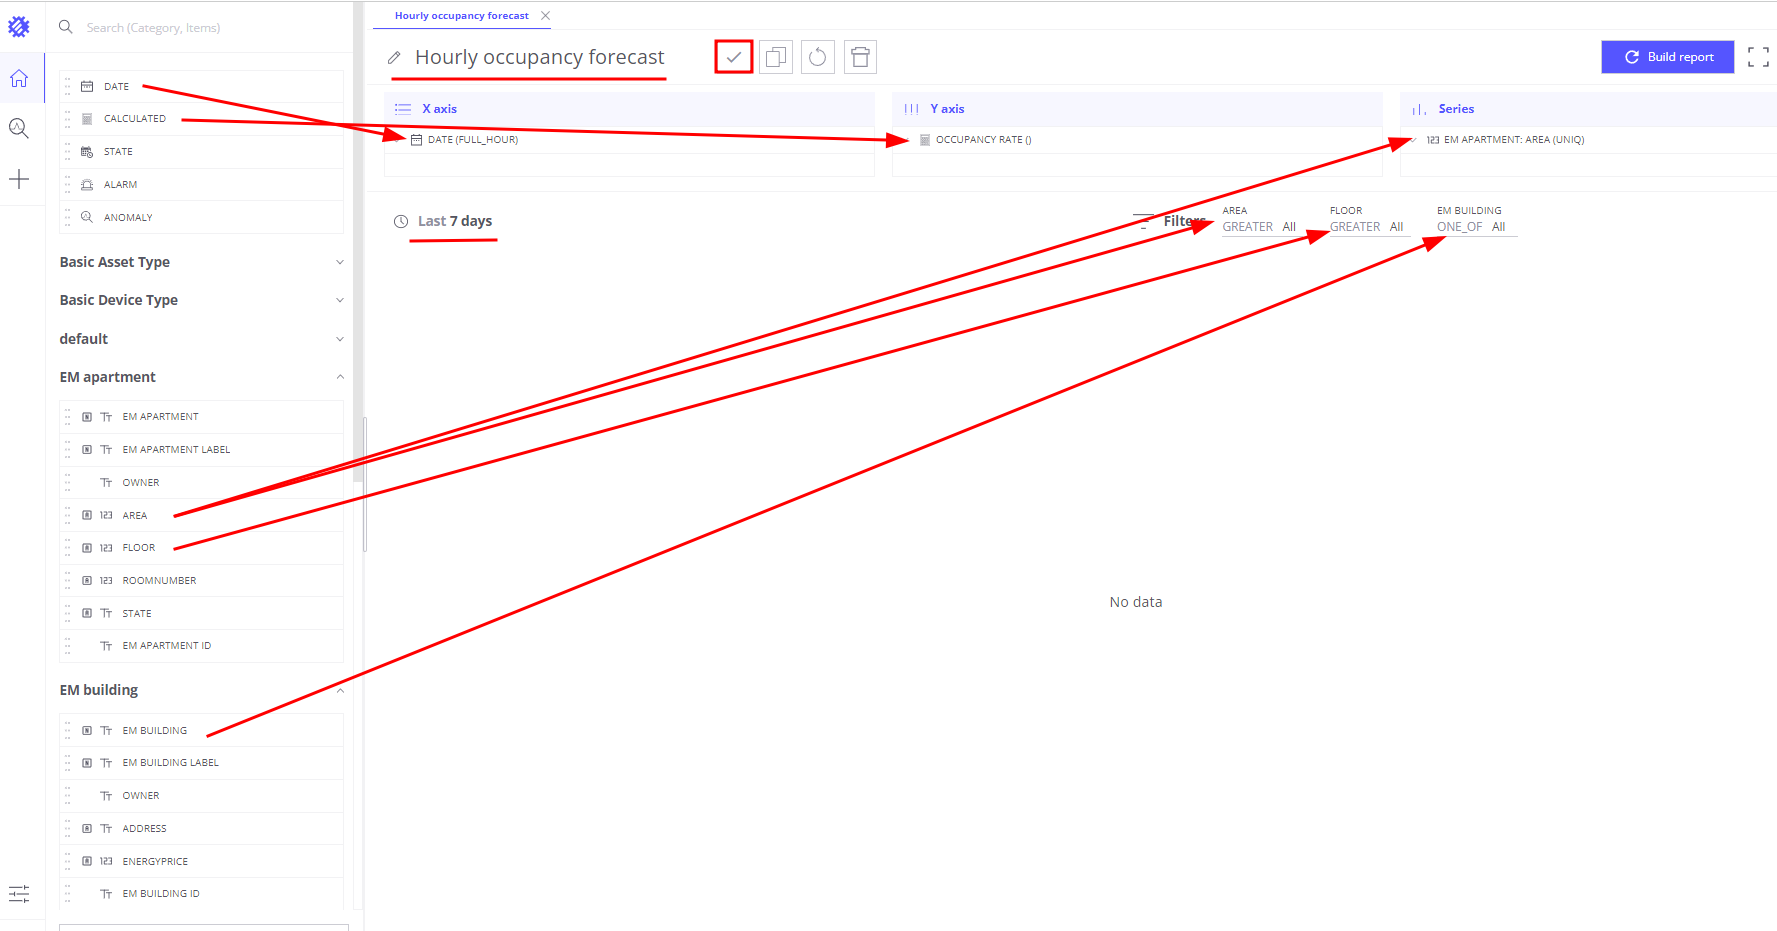
X-axis区域添加Date(Hour) - 在
Y-axis区域添加Date(Day) - 在
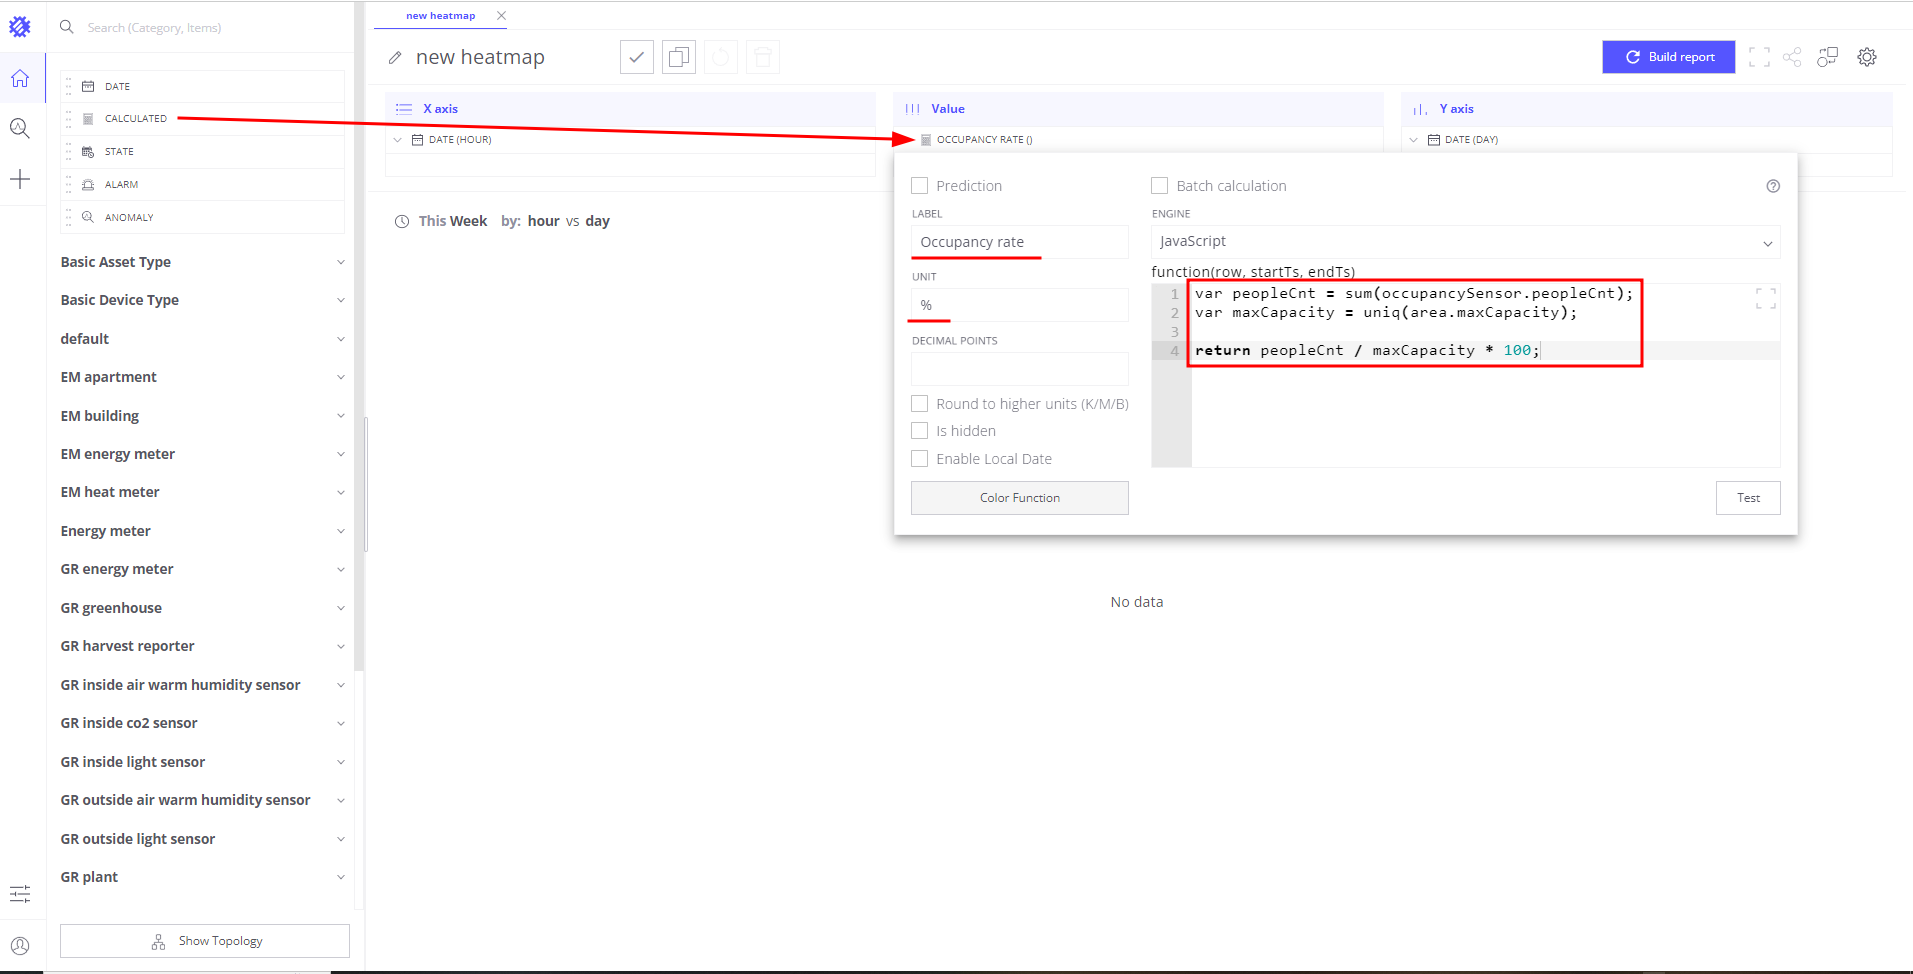
Value区域添加Calculated字段,Label改为Occupancy rate - 编写返回按最大容量百分比的occupancy rate的函数
1
2
3
4
var peopleCnt = sum(occupancySensor.peopleCnt);
var maxCapacity = uniq(area.maxCapacity);

return peopleCnt / maxCapacity * 100;
- 字段计算Unit设为%
- 在
filter区域添加Area、Floor、Building字段,便于聚焦酒店特定区域 - 默认时间范围——Last 7 days
- 以名称Weekly occupancy rate heatmap保存

Step 2: Compute occupancy rate for the whole floor and building
Step 1创建的heatmap包含filter字段。未选择filter时,heatmap显示全系统的occupancy rate。所有区域、楼层、建筑的数据会聚合显示。
实际中通常聚焦特定建筑或区域。使用filter实现。例如在filter中选择特定建筑,heatmap仅显示该建筑的occupancy rate。 Trendz在后台会:
- 拉取所选建筑的所有floor
- 拉取各floor的所有area
- 拉取各area内sensor的occupancy数据
- 对每个sensor应用计算
- 在建筑层面聚合结果
因此查看整层或整栋建筑的occupancy rate时,可使用同一视图,只需在filter中选择楼层或建筑即可。
Step 3: Predict an occupancy rate for the upcoming week with hourly breakdown
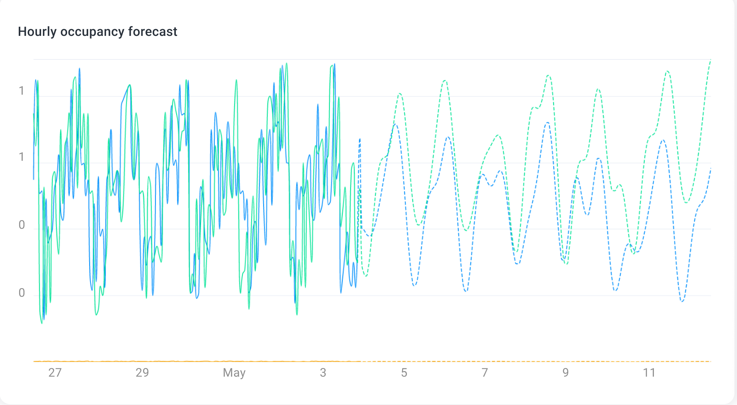
此前使用历史数据。现在使用Trendz prediction工具构建未来一周预测。先创建展示过去7天、按小时拆分的occupancy rate折线图。
- 创建Line chart视图
- 在
X-axis区域添加Date(Full Hour) - 在
Y-axis区域添加Calculated字段,Label改为Occupancy rate - 编写返回按最大容量百分比的occupancy rate的函数
1
2
3
4
var peopleCnt = sum(occupancySensor.peopleCnt);
var maxCapacity = uniq(area.maxCapacity);

return peopleCnt / maxCapacity * 100;
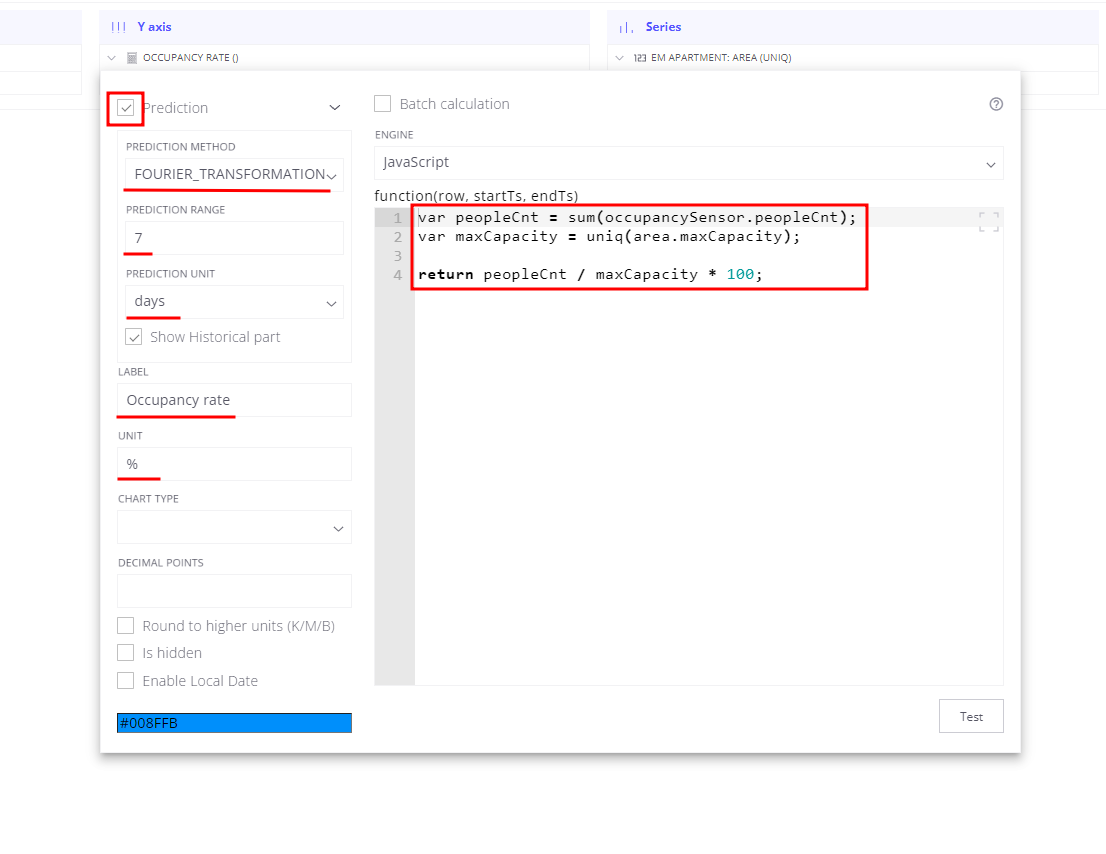
- 勾选
Prediction- Prediction method——Fourier transformation
- Prediction range——7
- Prediction unit——days
- 字段计算Unit设为%
- 在
Series区域添加Area name——各区域occupancy rate显示为独立线 - 在
filter区域添加Area、Floor、Building,便于聚焦酒店特定区域 - 默认时间范围——Last 7 days
最后,对字段计算Occupancy rate预测未来7天。使用Fourier transformation prediction method,对季节性时序效果较好。
- 点击
Y-axis区域中的Occupancy rate字段 - 勾选
Prediction- Prediction method——Fourier transformation
- Prediction range——7
- Prediction unit——days
- 以名称Hourly occupancy forecast保存
各区域历史数据以实线显示,预测以虚线显示。
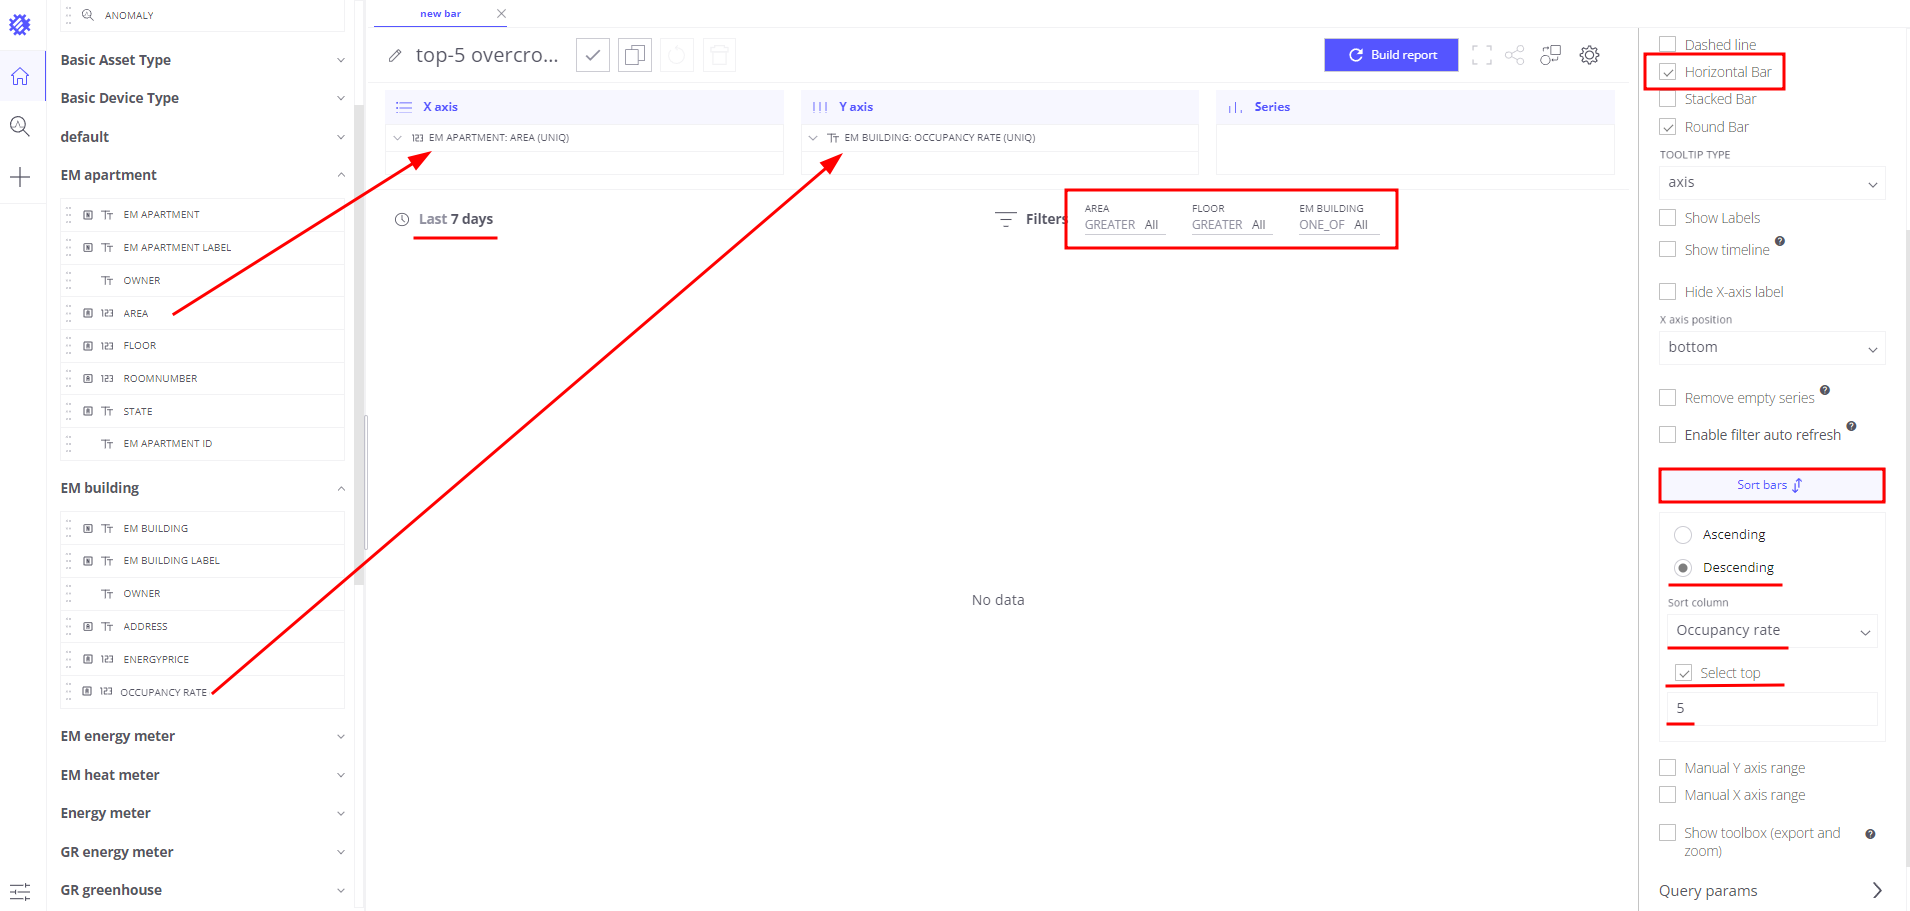
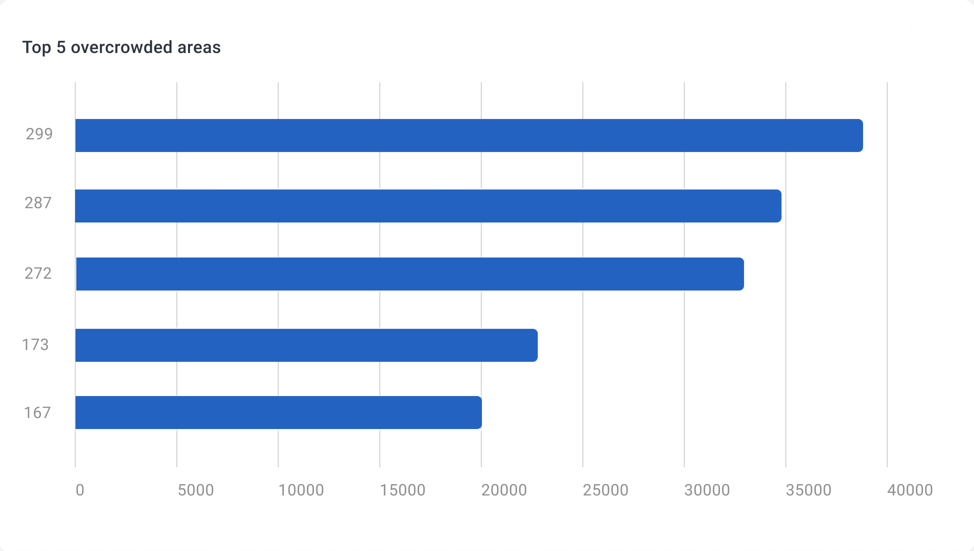
Step 4: Bar chart with top-5 overcrowded/underutilized areas in the hotel
Top-5 bar chart便于在较大时间范围内理解系统、对比asset、识别拥挤与低利用率区域。先从拥挤区域开始。
- 创建Bar chart视图
- 在
X-axis区域添加Area name - 在
Y-axis区域添加Occupancy rate。复用Step 1的字段计算 - 打开View settings
- 排序——Descending
Limit——5- 启用Horizontal bar chart
- 在
filter区域添加Area、Floor、Building,便于聚焦酒店特定区域 - 默认时间范围——Last 7 days
- 以名称top-5 overcrowded areas保存
top-5低利用率区域的bar chart步骤几乎相同。仅将排序改为Ascending,视图名称改为top-5 underutilized areas。
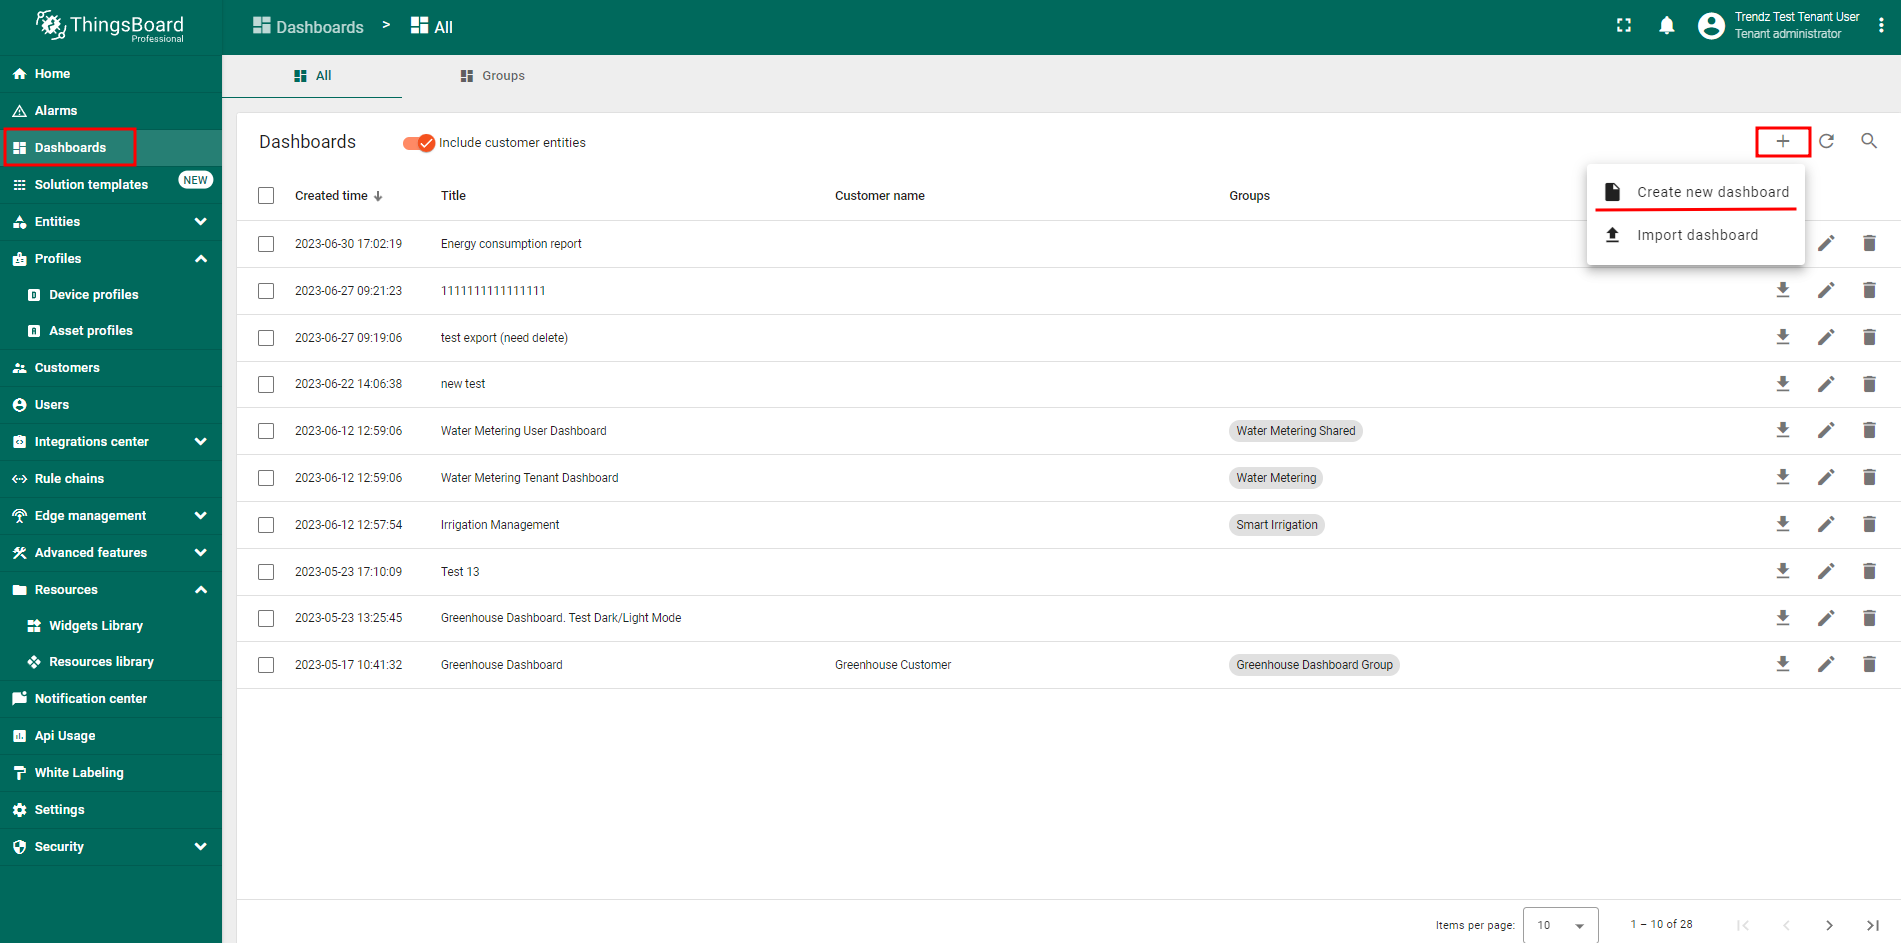
Step 5: Create occupancy analysis dashboard in ThingsBoard
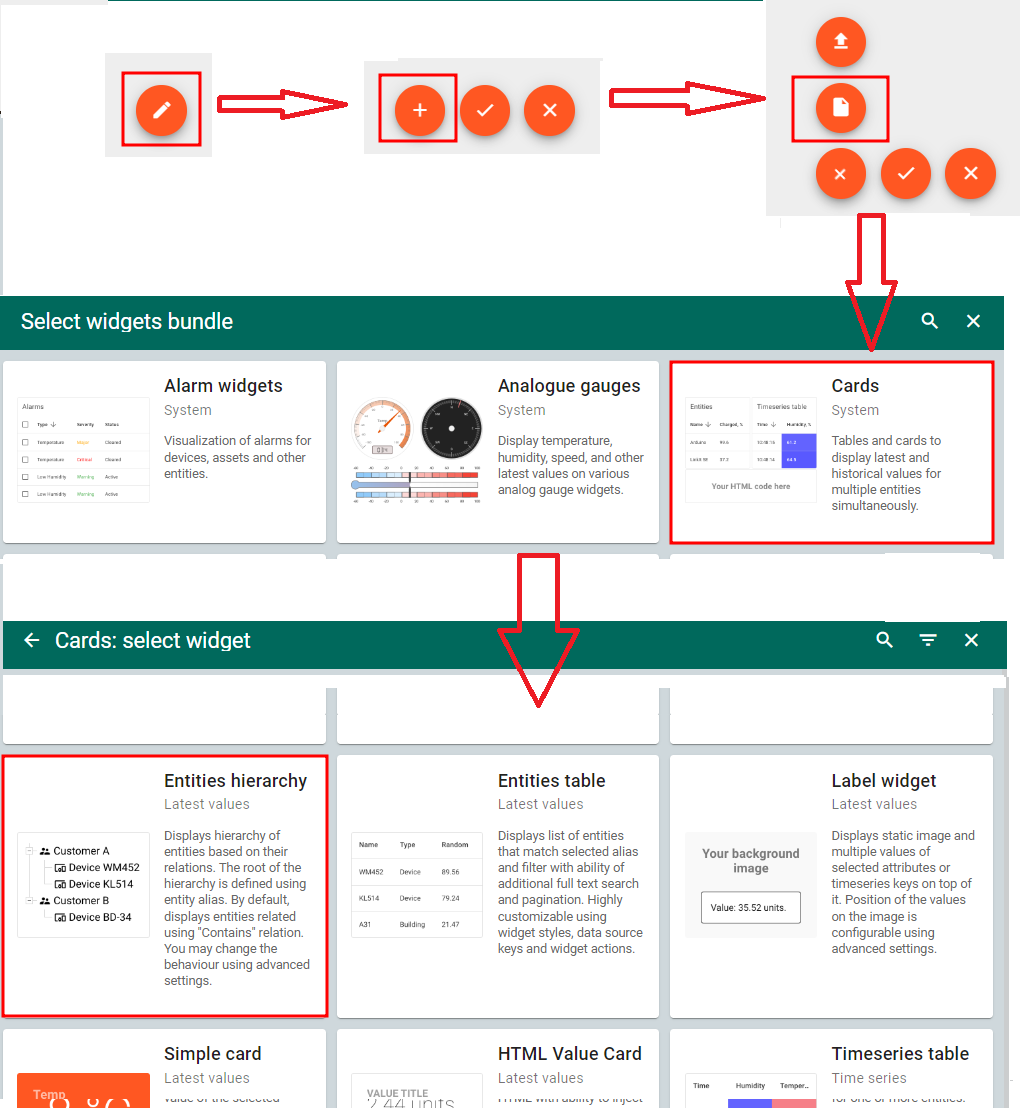
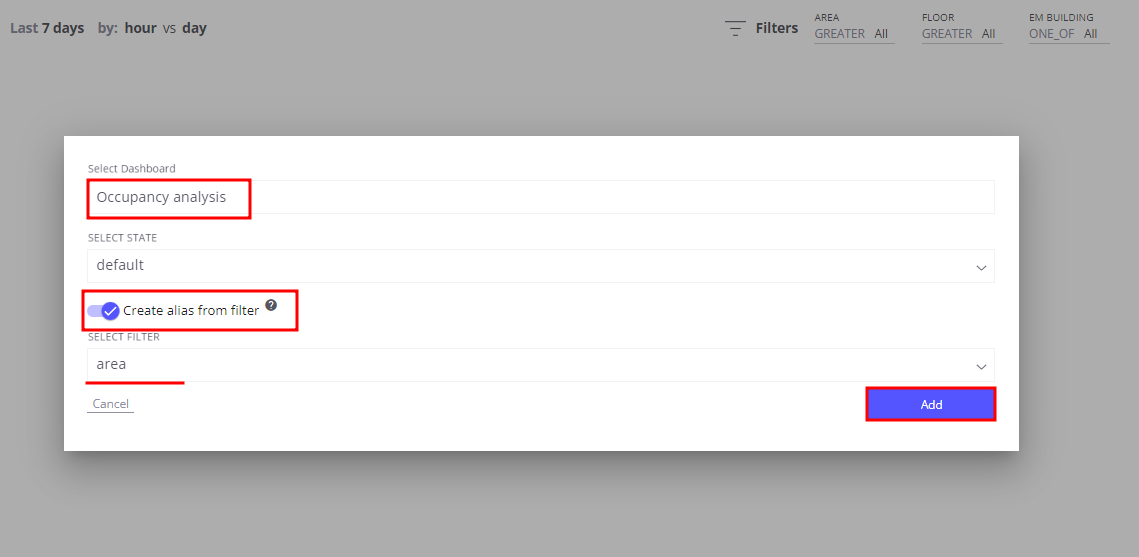
所有Trendz分析chart已就绪,可在ThingsBoard创建用户dashboard。注意用户可能访问多家酒店,需创建适用于所有酒店的dashboard。用户应能选择酒店、楼层、区域。 首先添加所有Trendz视图到dashboard:
- 在ThingsBoard创建名为Occupancy analysis的dashboard
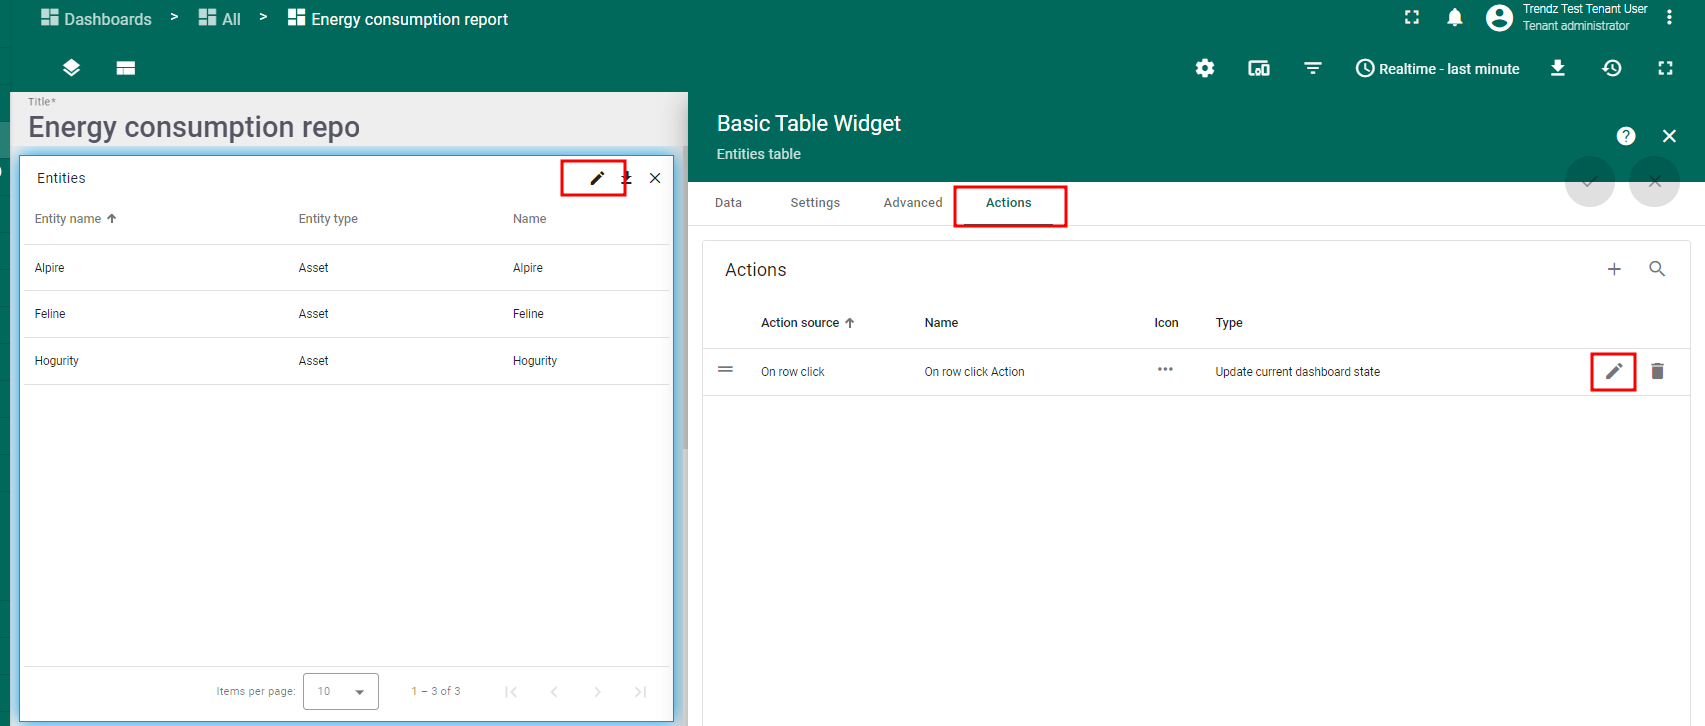
- 在Trendz:对前几步创建的每个部件:
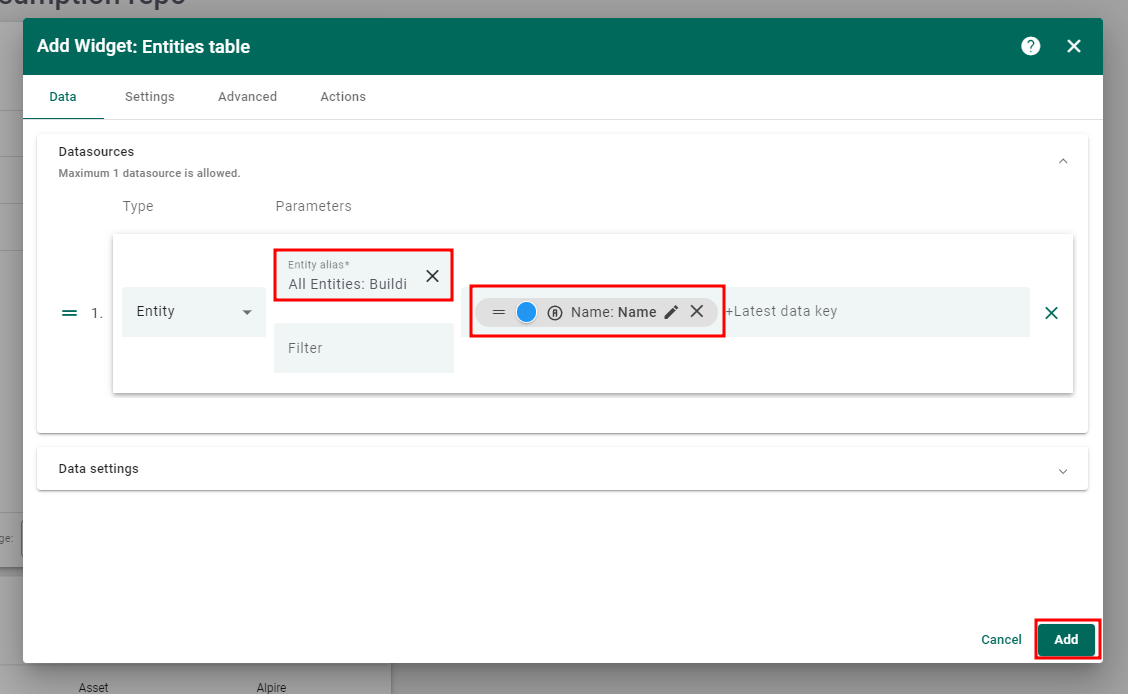
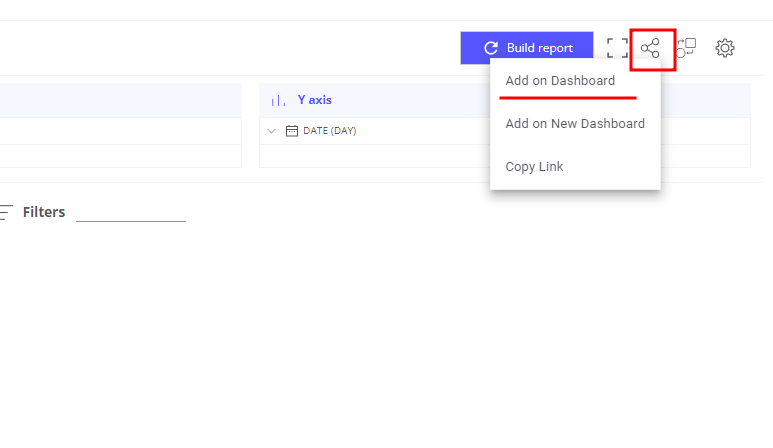
- 点击
Share to ThingsBoard,复制Add on Dashboard - 选择Occupancy analysis dashboard
- 勾选Create alias
- Filter选择Area name
- 点击
- 返回ThingsBoard Occupancy analysis dashboard并调整布局
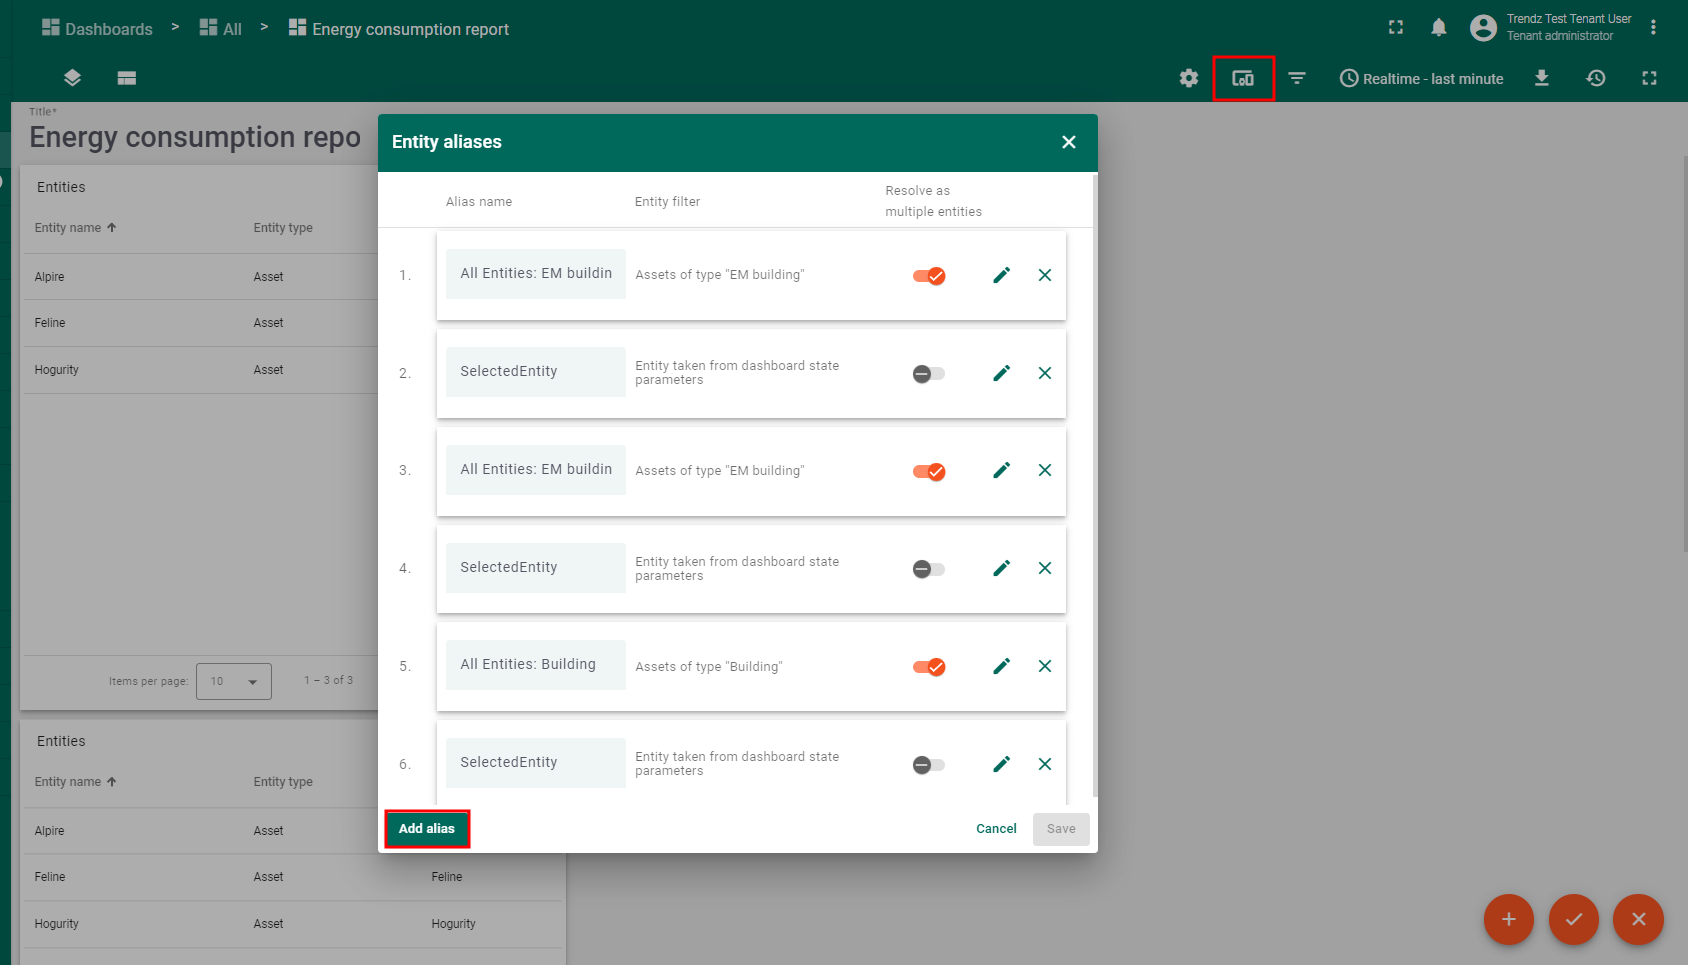
然后创建用于dashboard过滤的aliases:
- 创建新alias All buildings——保存用户可见的所有建筑
- Filter type——Asset type
- Asset type——Building
- 创建新alias Selected entity——保存用户点击的实体
- Filter type——Entity from dashboard state
- State entity parameter name——selectedEntity
- 创建新alias Filtered areas——保存用户要聚焦的Area
- Filter type——Asset search query
- 勾选Root entity,entity parameter name——selectedEntity
- 勾选Fetch last level relation only
- Direction——From
- Max relation level——3
- Asset types——Area
最后添加hierarchy部件,展示酒店内所有建筑/楼层/区域,供用户选择。用户点击实体后,Filtered areas alias会刷新并加载所选实体的所有区域。 之后dashboard上所有Trendz部件会更新,因其以Filtered areas alias为数据源。用户将看到所选区域的occupancy数据。
- 在dashboard添加hierarchy部件
Cards->Entities hierarchy,展示酒店内所有建筑/楼层/区域- 数据源alias——All buildings
- Latest data key——Name
- 为hierarchy部件添加
On node selectedaction,更新dashboard state中的selectedEntity参数- Action type——Update current dashboard state
- State entity parameter name——selectedEntity
- 所有dashboard上的Trendz部件的数据源alias设为Filtered areas
- 保存dashboard


Summary
综上所述,occupancy monitoring技术的实施帮助客户实现了提升客户体验、降低运营成本、减少环境影响的目标。 借助实时数据和预测分析,他们优化了人员配置、更有效地分配资源、降低了能耗。 实施的主要成效包括公共事业和人力成本下降,以及正面客户评价提升。