时间序列数据聚合是一个字段计算,计算当前实体的历史遥测的聚合指标(小时/天/周/月等),并将结果存储为新的遥测键。
与跨关联实体的”最新值”聚合不同,此类型针对历史时间序列数据进行操作——最适合分析、报表和长期KPI。
何时使用
- 分析与KPI
- 生成按小时/天/周的聚合值(例如每小时平均温度)
- 从历史数据构建KPI(日运行时长、峰值负载、总消耗量)
- 为导出、审计或自动化生成可直接使用的统计数据
- 性能与可靠性
- 通过存储预聚合指标减少仪表板/API负载
- 处理延迟遥测并自动修正历史聚合
- 使用中间结果跟踪近实时聚合(例如”当前小时截至目前的平均值”)
Configuration
打开 创建字段计算 对话框并指定:
- 字段计算 title;
- 将应用字段计算的 entity或entity profile;
- 选择 “Time series data aggregation” 作为字段计算 type。
参数
Arguments定义用于聚合的遥测值。 本字段计算类型仅从当前实体读取历史遥测。
点击 Add argument 并填写必填项:
- 时间序列键 — 要聚合的遥测键(例如,温度、功率、电压)
- 参数名称 — 指标引用的变量名称
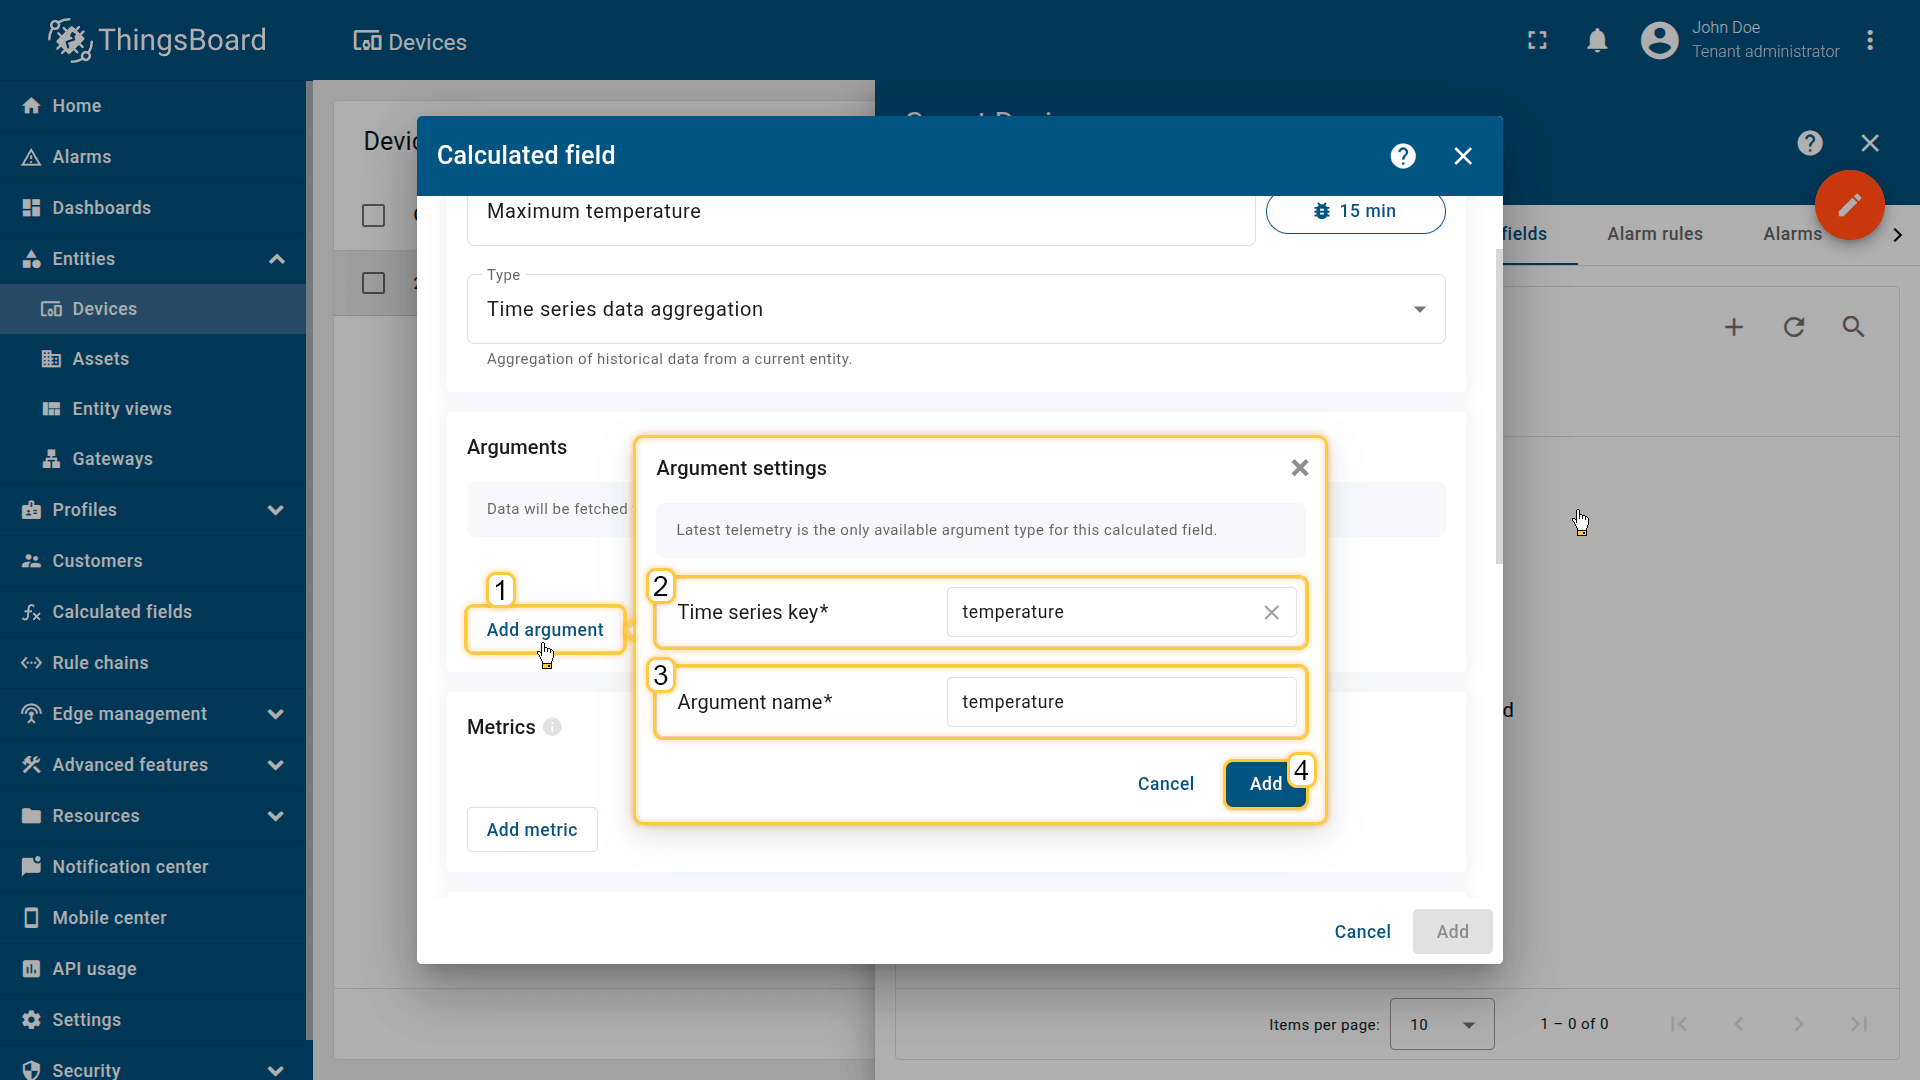
Click Add argument (1) and fill in the required fields:
- Time series key (2) — the telemetry key whose data will be aggregated (for example, temperature, power, voltage)
- Argument name (3) — the variable name referenced by metrics.
Then click Add (4).
指标
每个指标通过为一个参数应用一个聚合函数,产生一个输出遥测键(指标名称)。
点击添加指标按钮并填写必填项:
- 指标名称:输出遥测键名称(例如tempAvg、tempMax)
- 聚合:平均 / 最小 / 最大 / 总和 / 计数
- 参数名称:要聚合的参数
- 默认值:当区间内无数据时使用
可以为同一个参数创建多个指标(例如, tempAvg、tempMin、tempMax)。
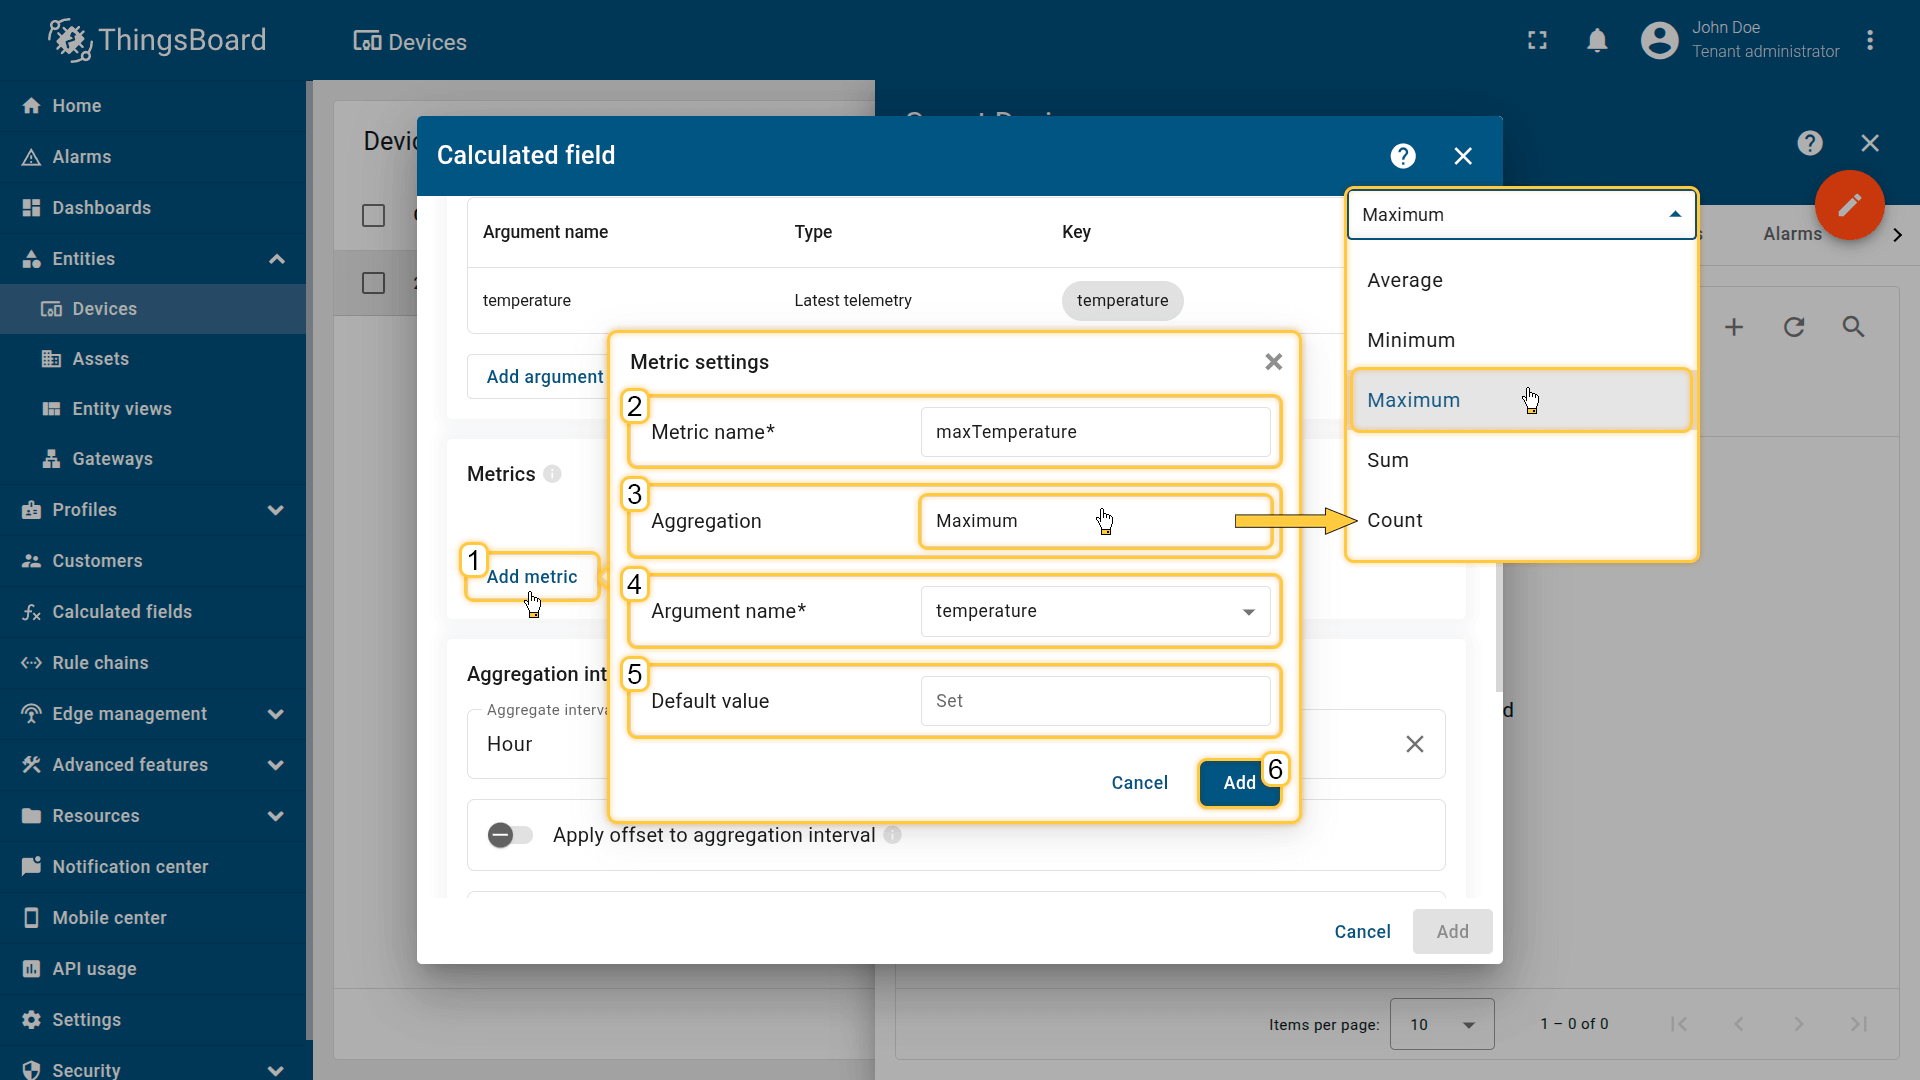
Click the Add metric button (1) and fill in the required fields:
- Metric name (2): output telemetry key name (e.g., tempAvg, tempMax)
- Aggregation (3): Average / Min / Max / Sum / Count
- Argument name (4): the argument whose value is being aggregated.
- Default value (5): used if the interval contains no data
Then click Add (6).
聚合区间
定义聚合运行的频率以及时间边界如何对齐。 例如:每小时区间的边界为00:00、01:00、02:00等。
- 聚合区间类型:小时 / 天 / 星期(星期一至星期日) / 星期(星期日至星期六) / 月 / 季 / 年 / 自定义
- 时区:用于对齐每天/每周报表及特定地域KPI的区间边界。
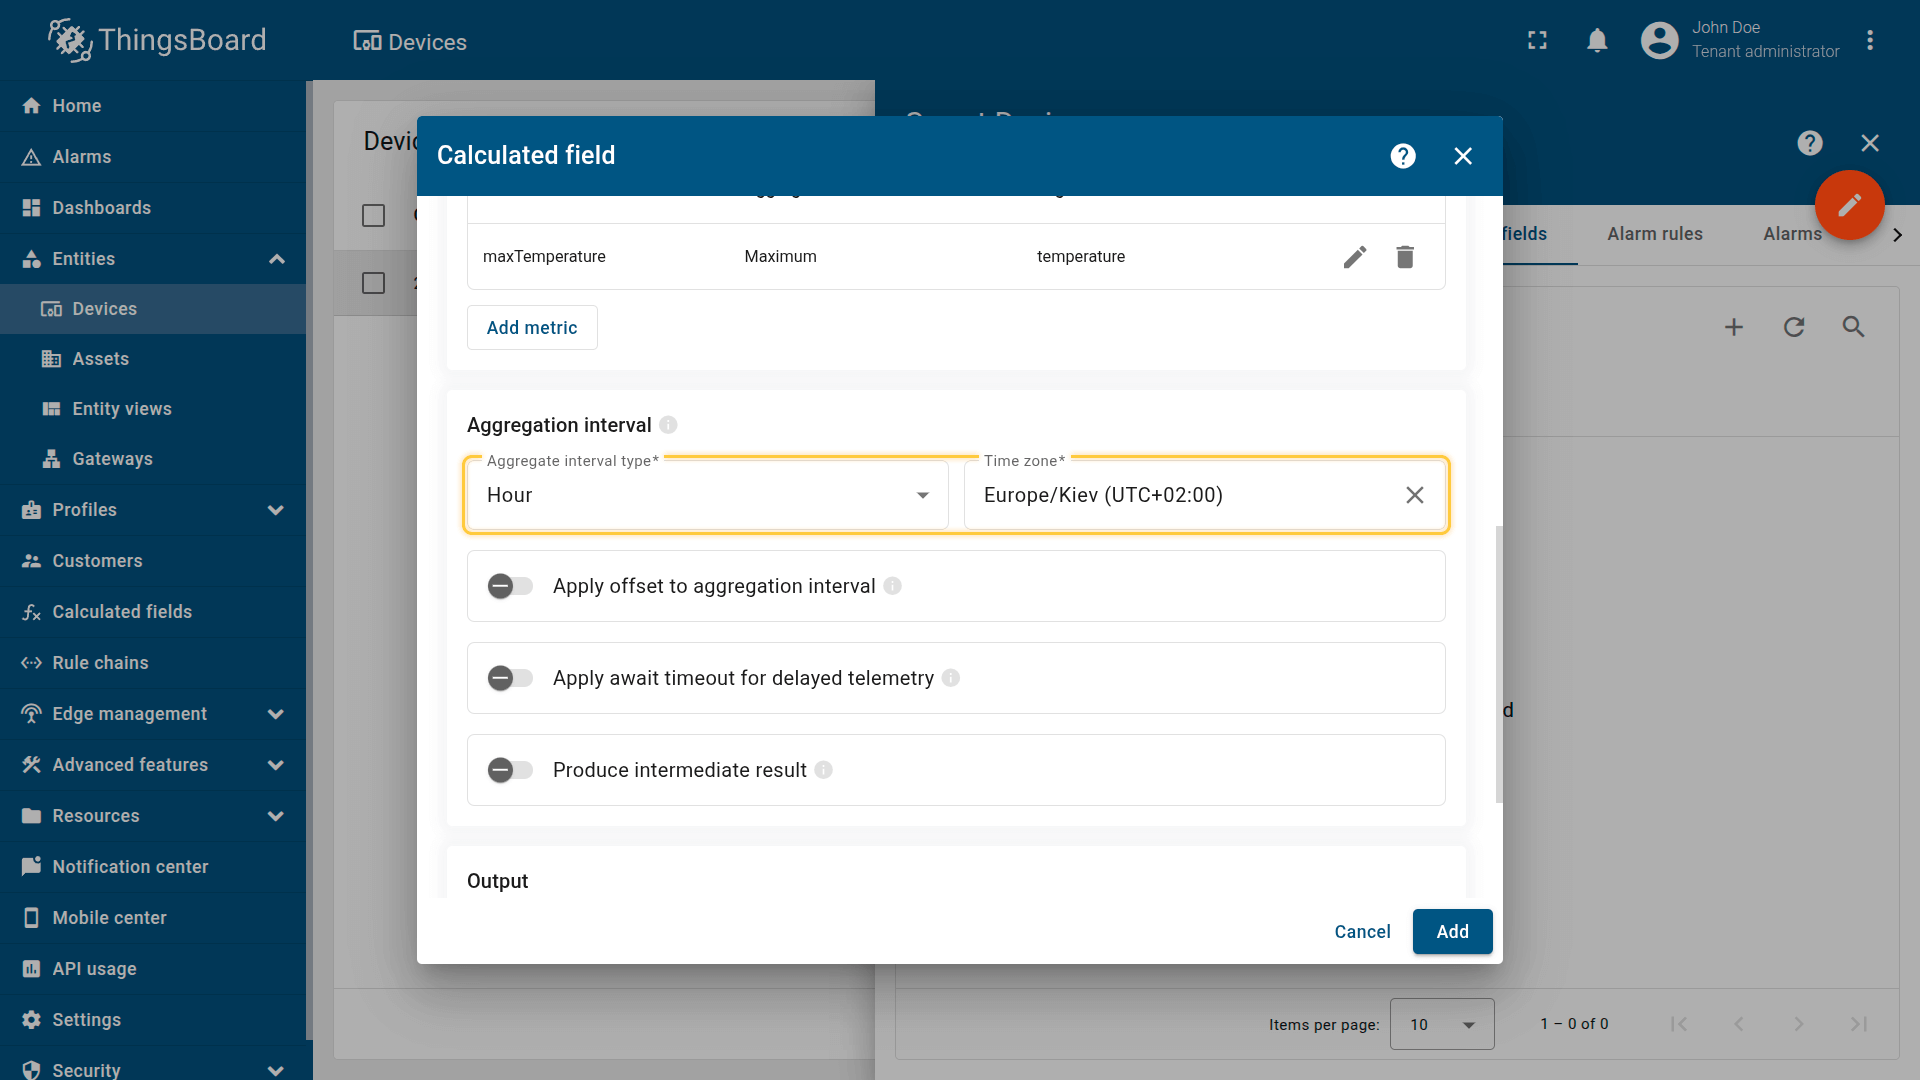
Defines how often aggregation runs and how time boundaries are aligned.
高级区间选项
向聚合区间应用偏移
按固定偏移量移位每个区间的开始(例如,+10分钟 → 00:10、01:10…)。
当遥测数据晚于整点到达,或需要与外部系统对齐时非常有用。
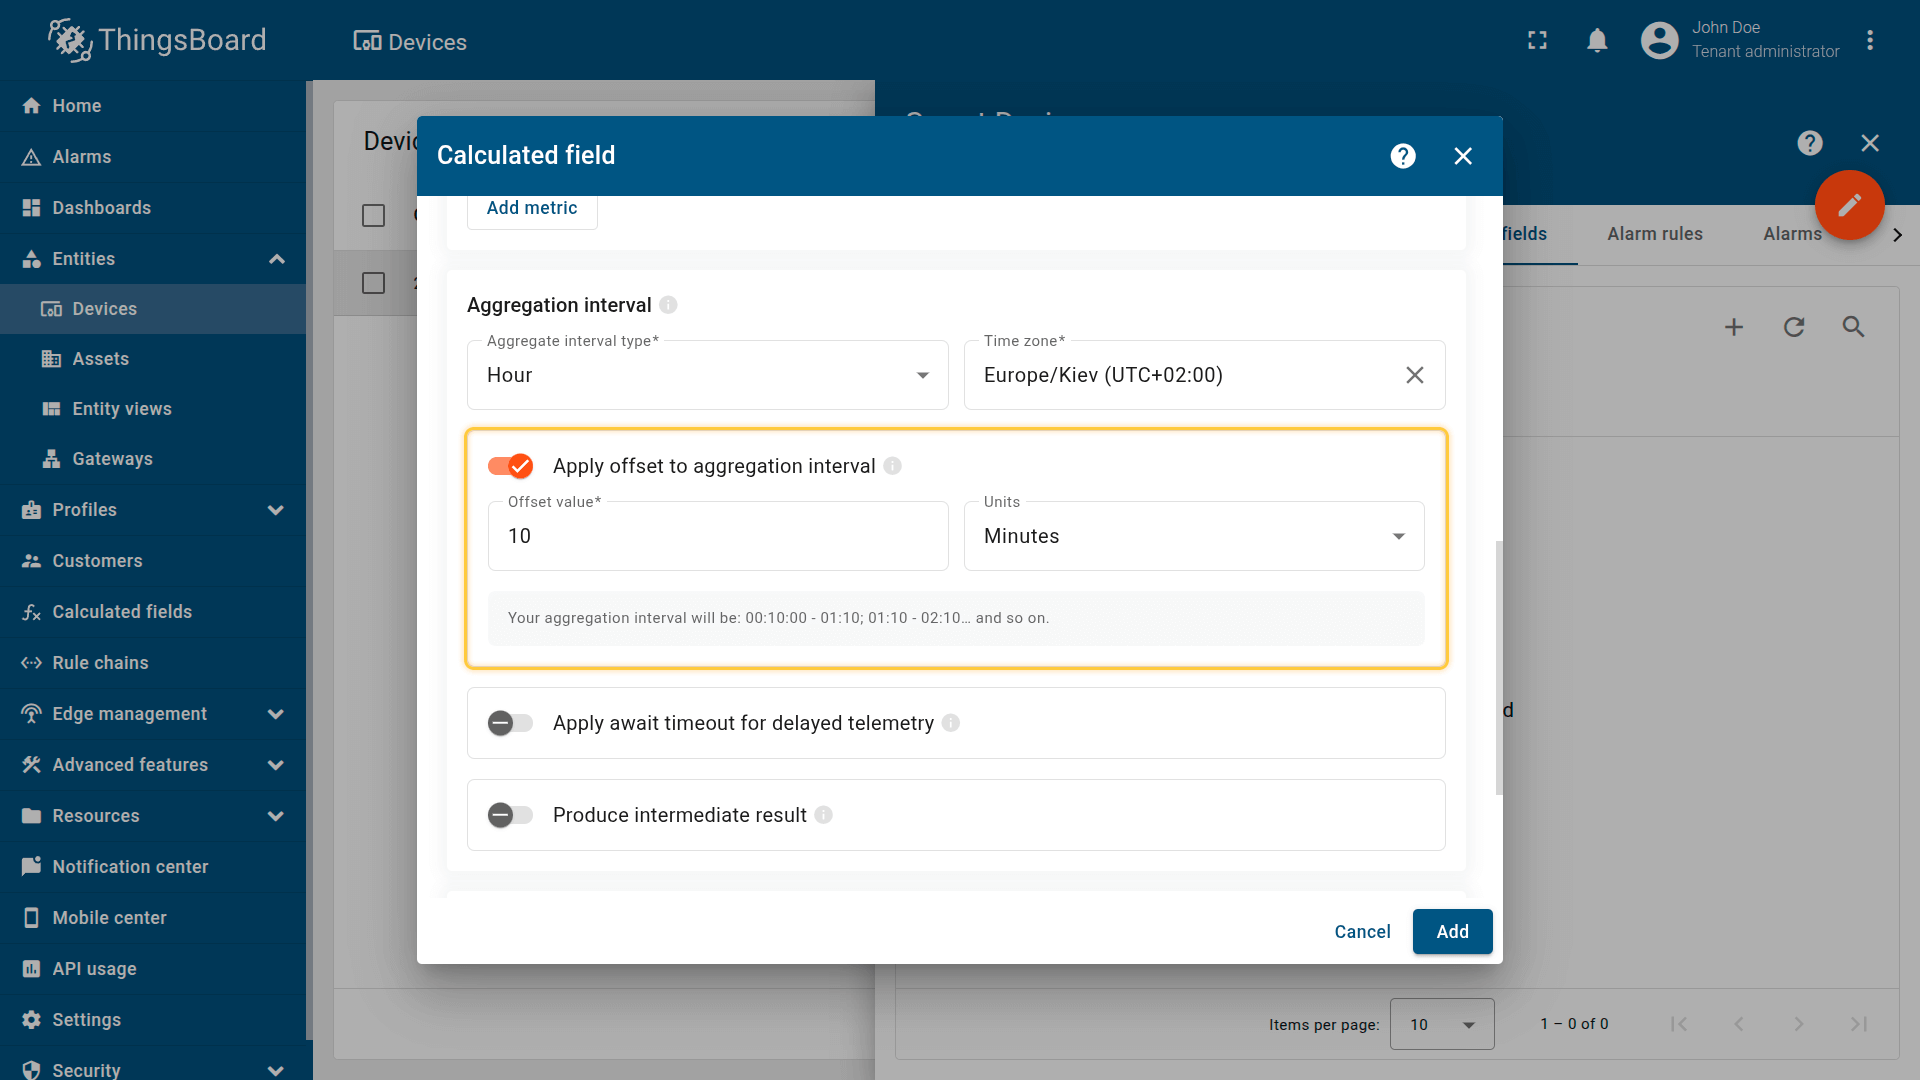
Shifts the start of each interval by a fixed offset (e.g., +10 minutes → 00:10, 01:10…).
为延迟遥测设置等待超时
定义系统在区间结束后等待延迟遥测的时长。
若此期间收到属于该区间的遥测,系统会重新计算结果以提高精确度。
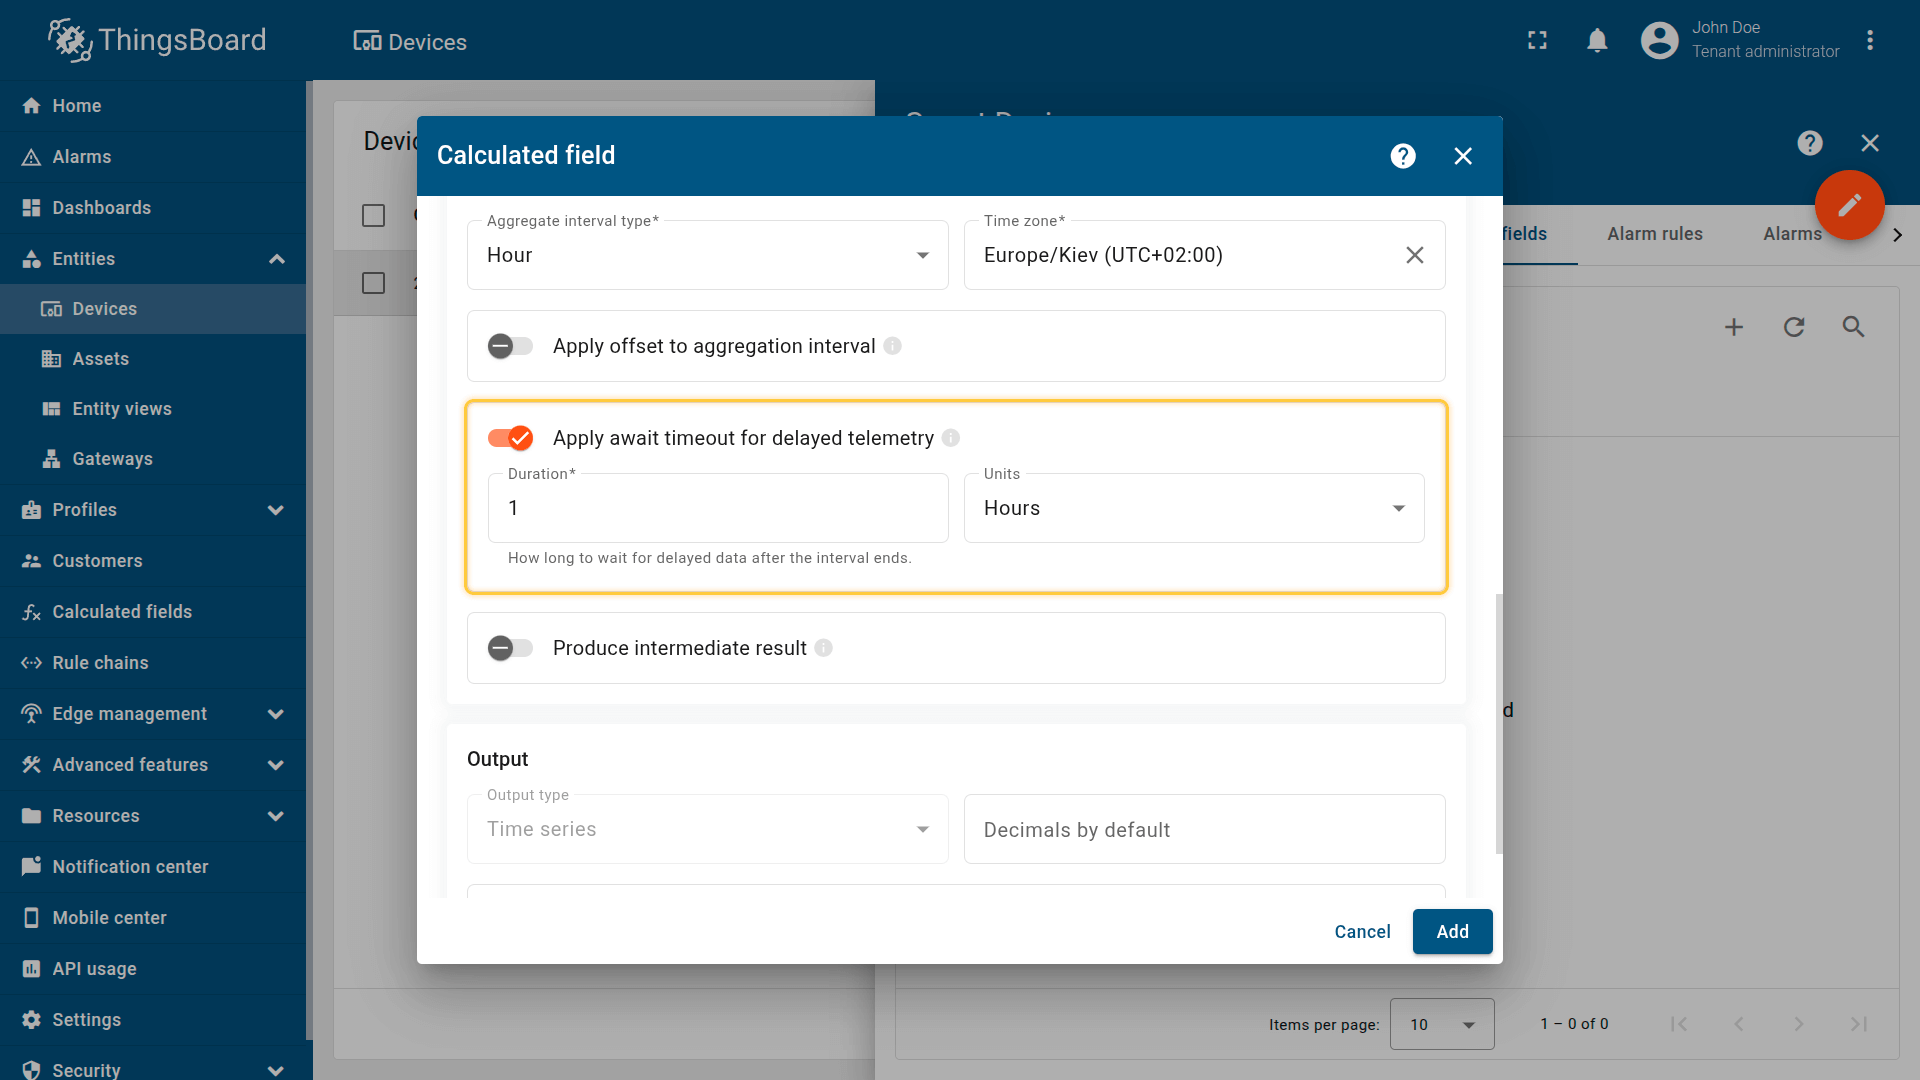
定义系统在区间结束后等待延迟遥测的时间。
生成中间结果
在当前(尚未完成的)区间内计算聚合并存储中间值:
- 更新频率不超过每5分钟一次
- 对于需要”当前区间”实时数据的仪表板非常有用(例如”当前小时截至目前的平均值”)
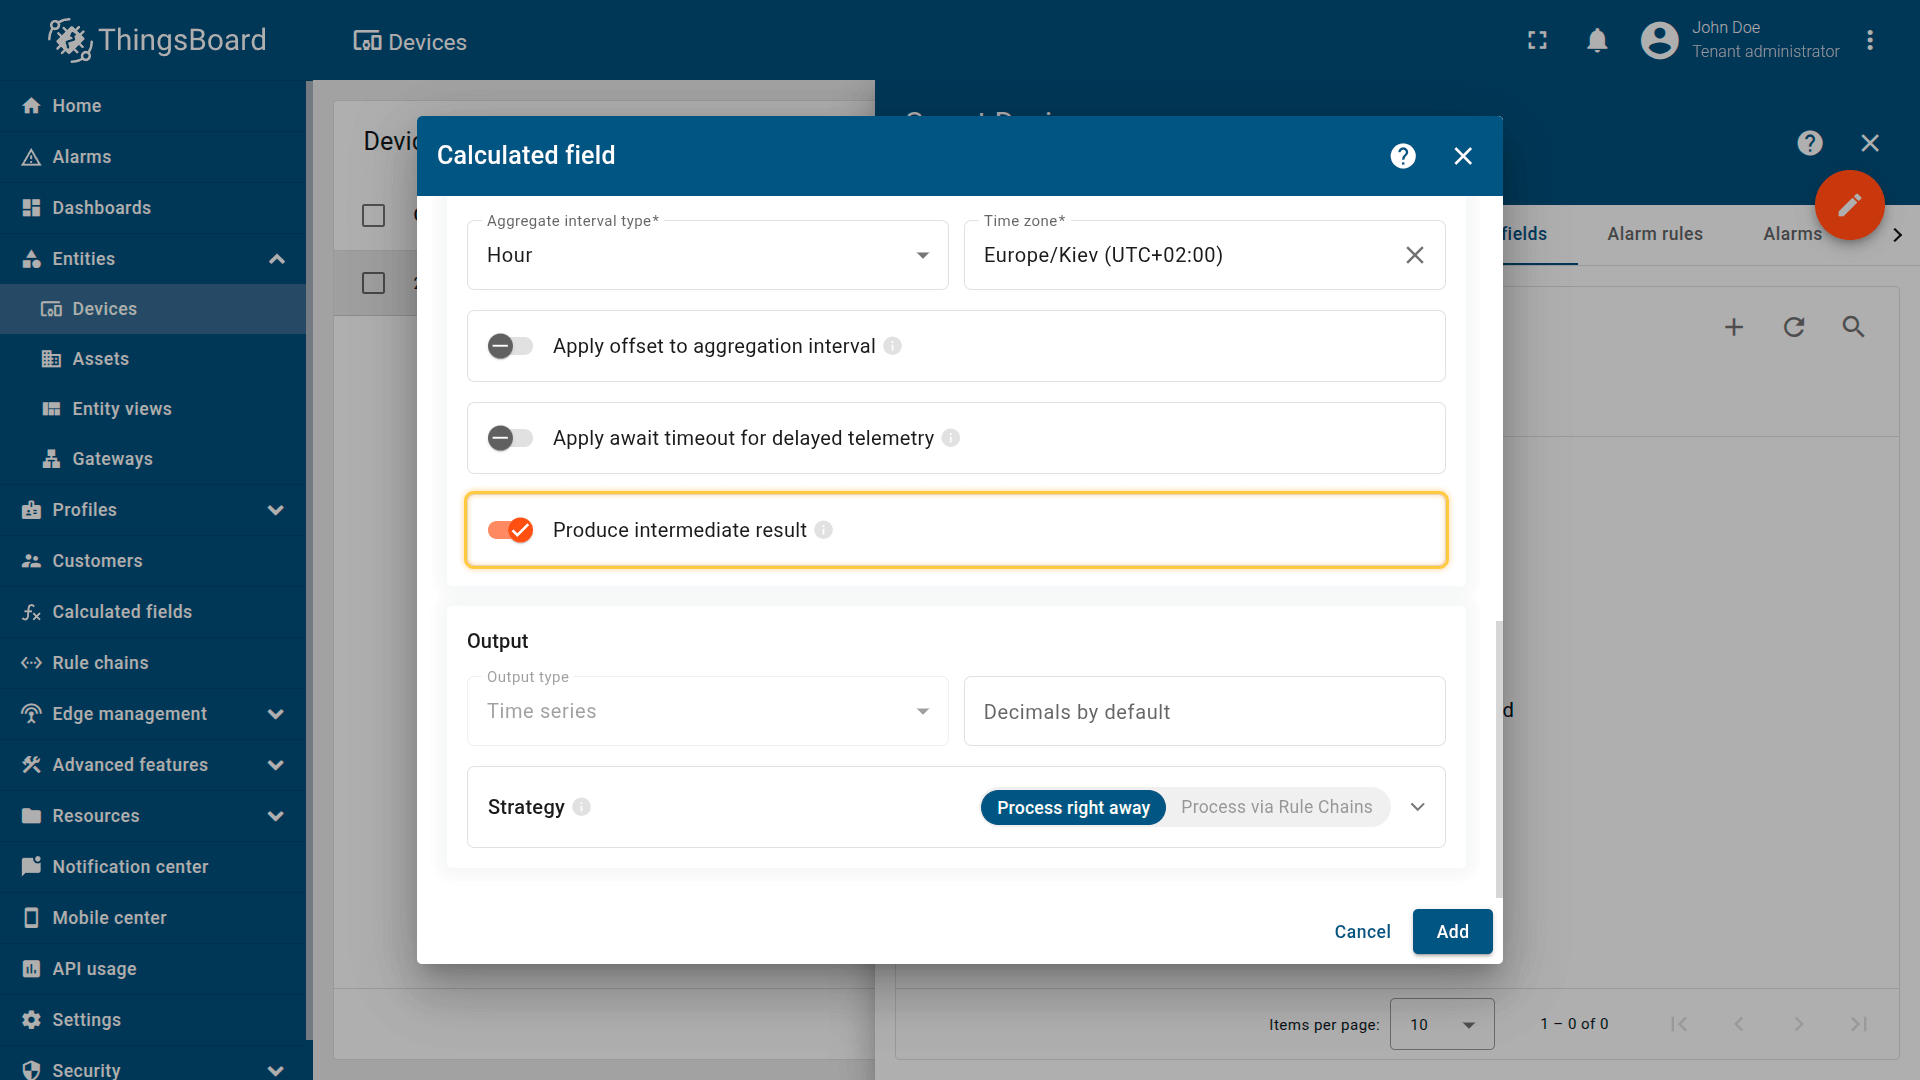
在当前(不等完成)区间内计算聚合并存储中间值。
输出
聚合值作为 telemetry 存储在当前实体上,使用配置的指标名称(输出键)。
此字段计算仅作为时间序列存储结果。
有关输出处理策略的更多详细信息,请参阅 Output 部分。
Example: Hourly energy KPIs
Scenario
An Energy Meter device installed in Building A continuously publishes historical telemetry values such as:
- power (kW) — current power usage
- energy (kWh) — total consumption counter
Goal
Compute hourly aggregates from historical telemetry and store them as new time series keys on the Energy Meter device:
- energyHourlySum — total energy consumption per hour (sum)
- powerHourlyAvg — average power per hour (avg)
- powerHourlyMax — maximum power per hour (max)
This produces reporting-ready KPIs and reduces dashboard/API load by storing pre-aggregated metrics instead of computing them on the fly.
Calculated field configuration
Download the “Time series data aggregation” calculated field configuration file (JSON).
Configuration steps
1. Import demo devices
Import a device that publishes power and energy telemetry.
- Download the CSV file: energy-meter-with-telemetry.csv
- Go to the Devices and import the CSV file.
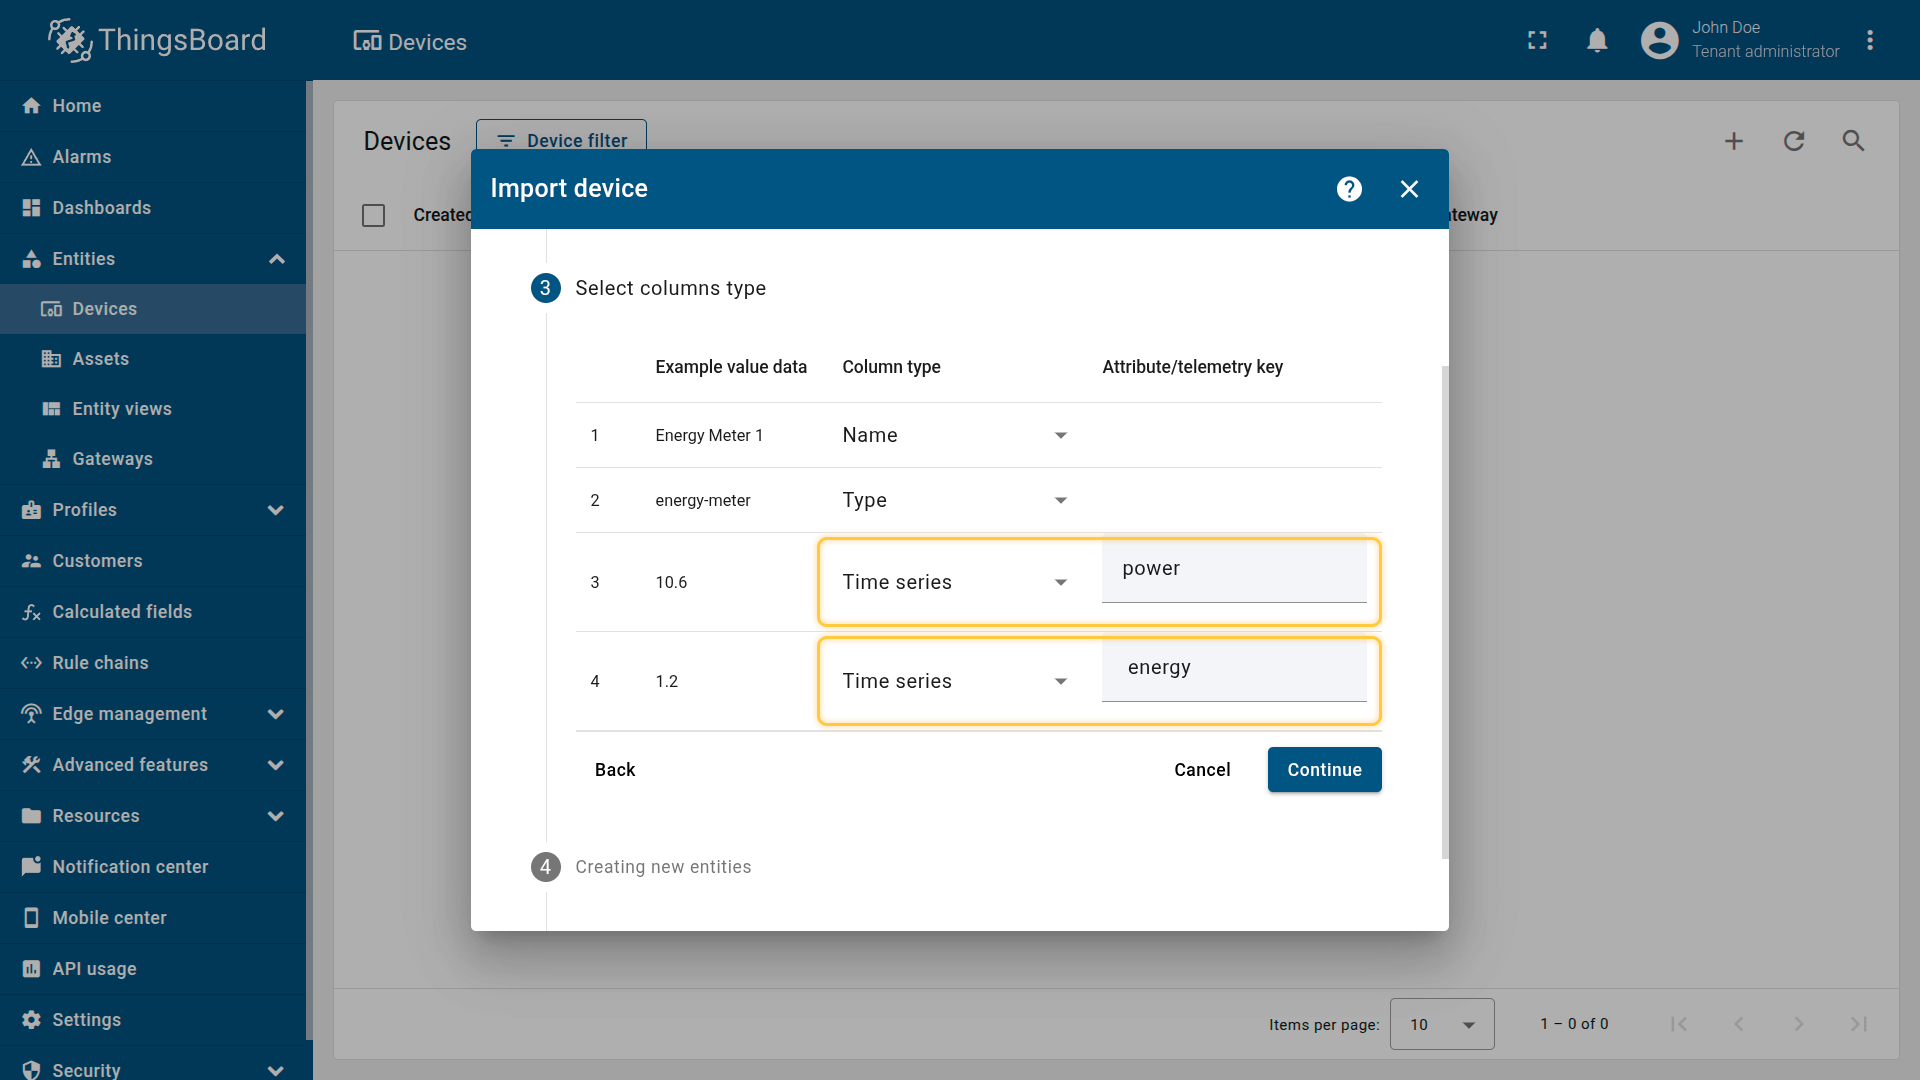
CSV includes:
- Name: Energy Meter 1
- Type: energy-meter
- Time series: power, energy
Important note about the CSV: the column type for the power and energy keys must be set to “Time series”.
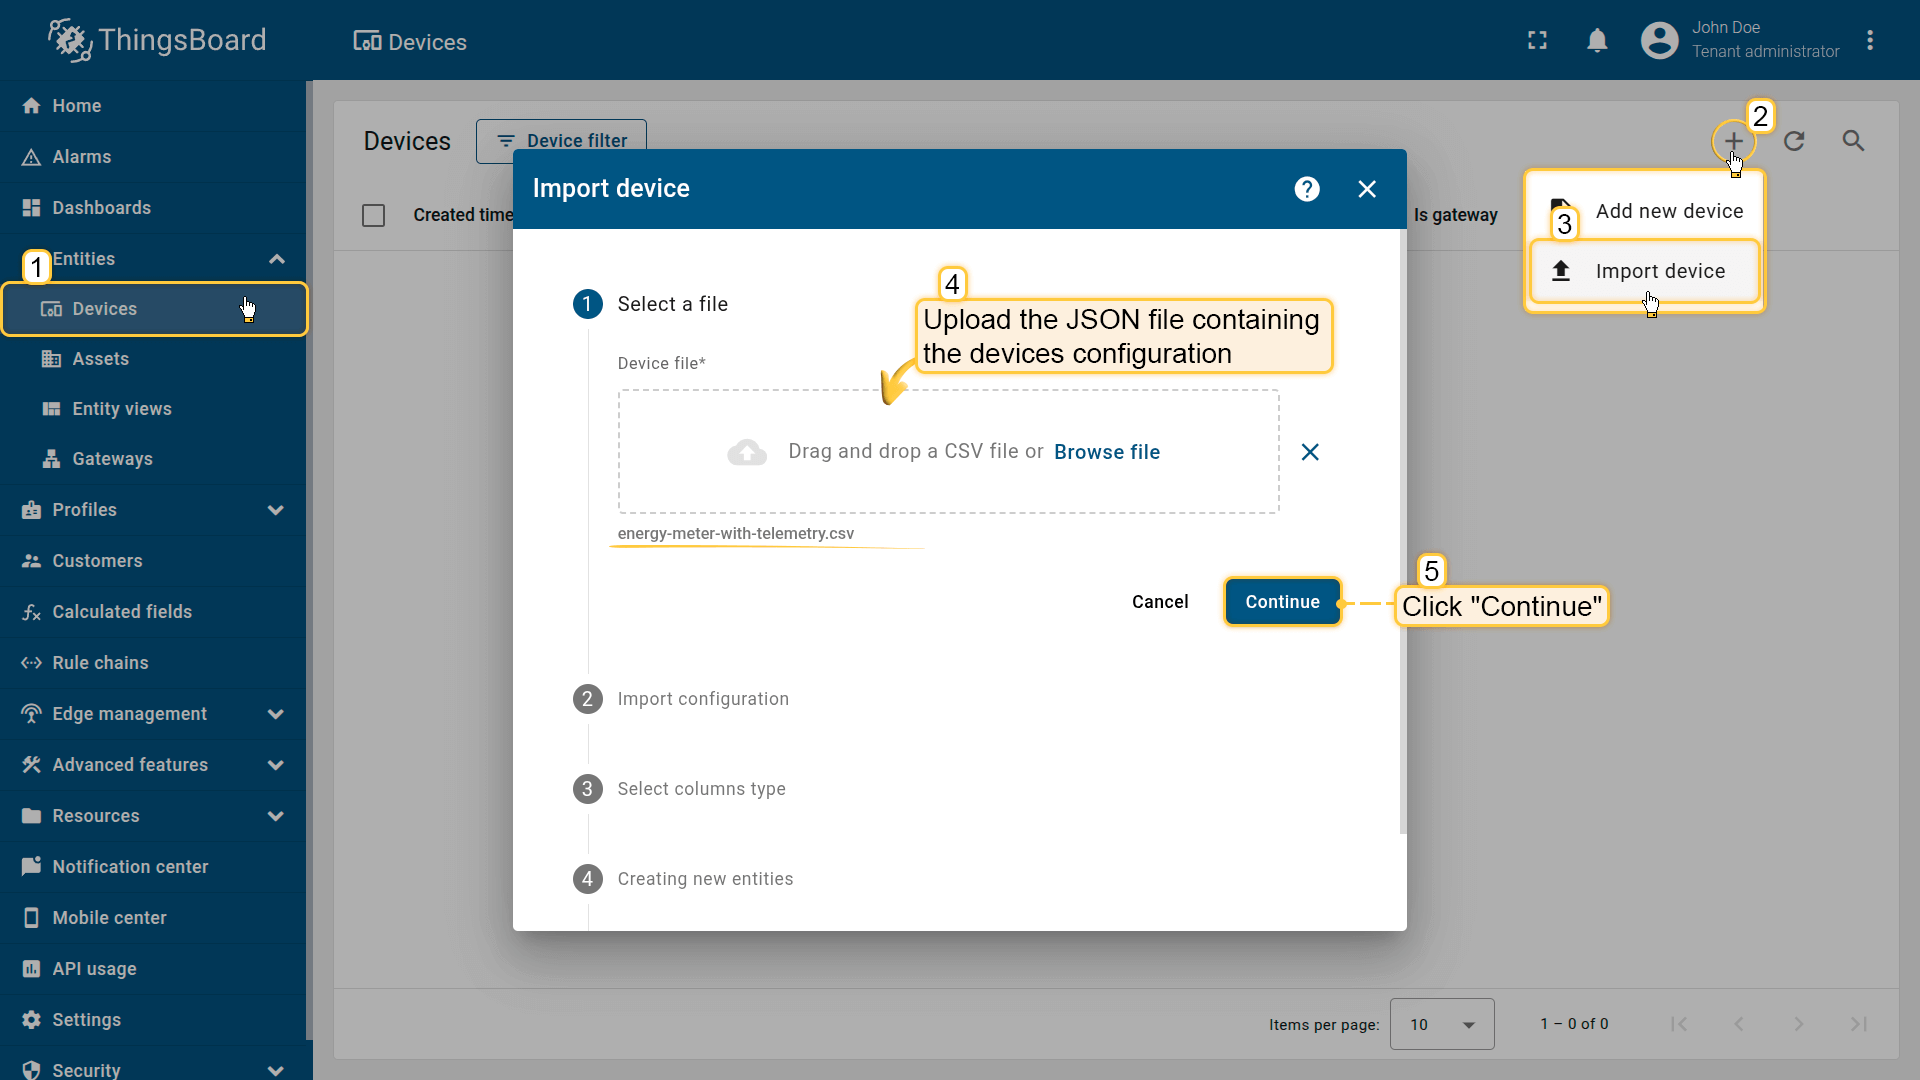
Go to the Devices and import device configurations from a CSV file.
Name: Energy Meter 1
Type: energy-meter
Time series: power, energy
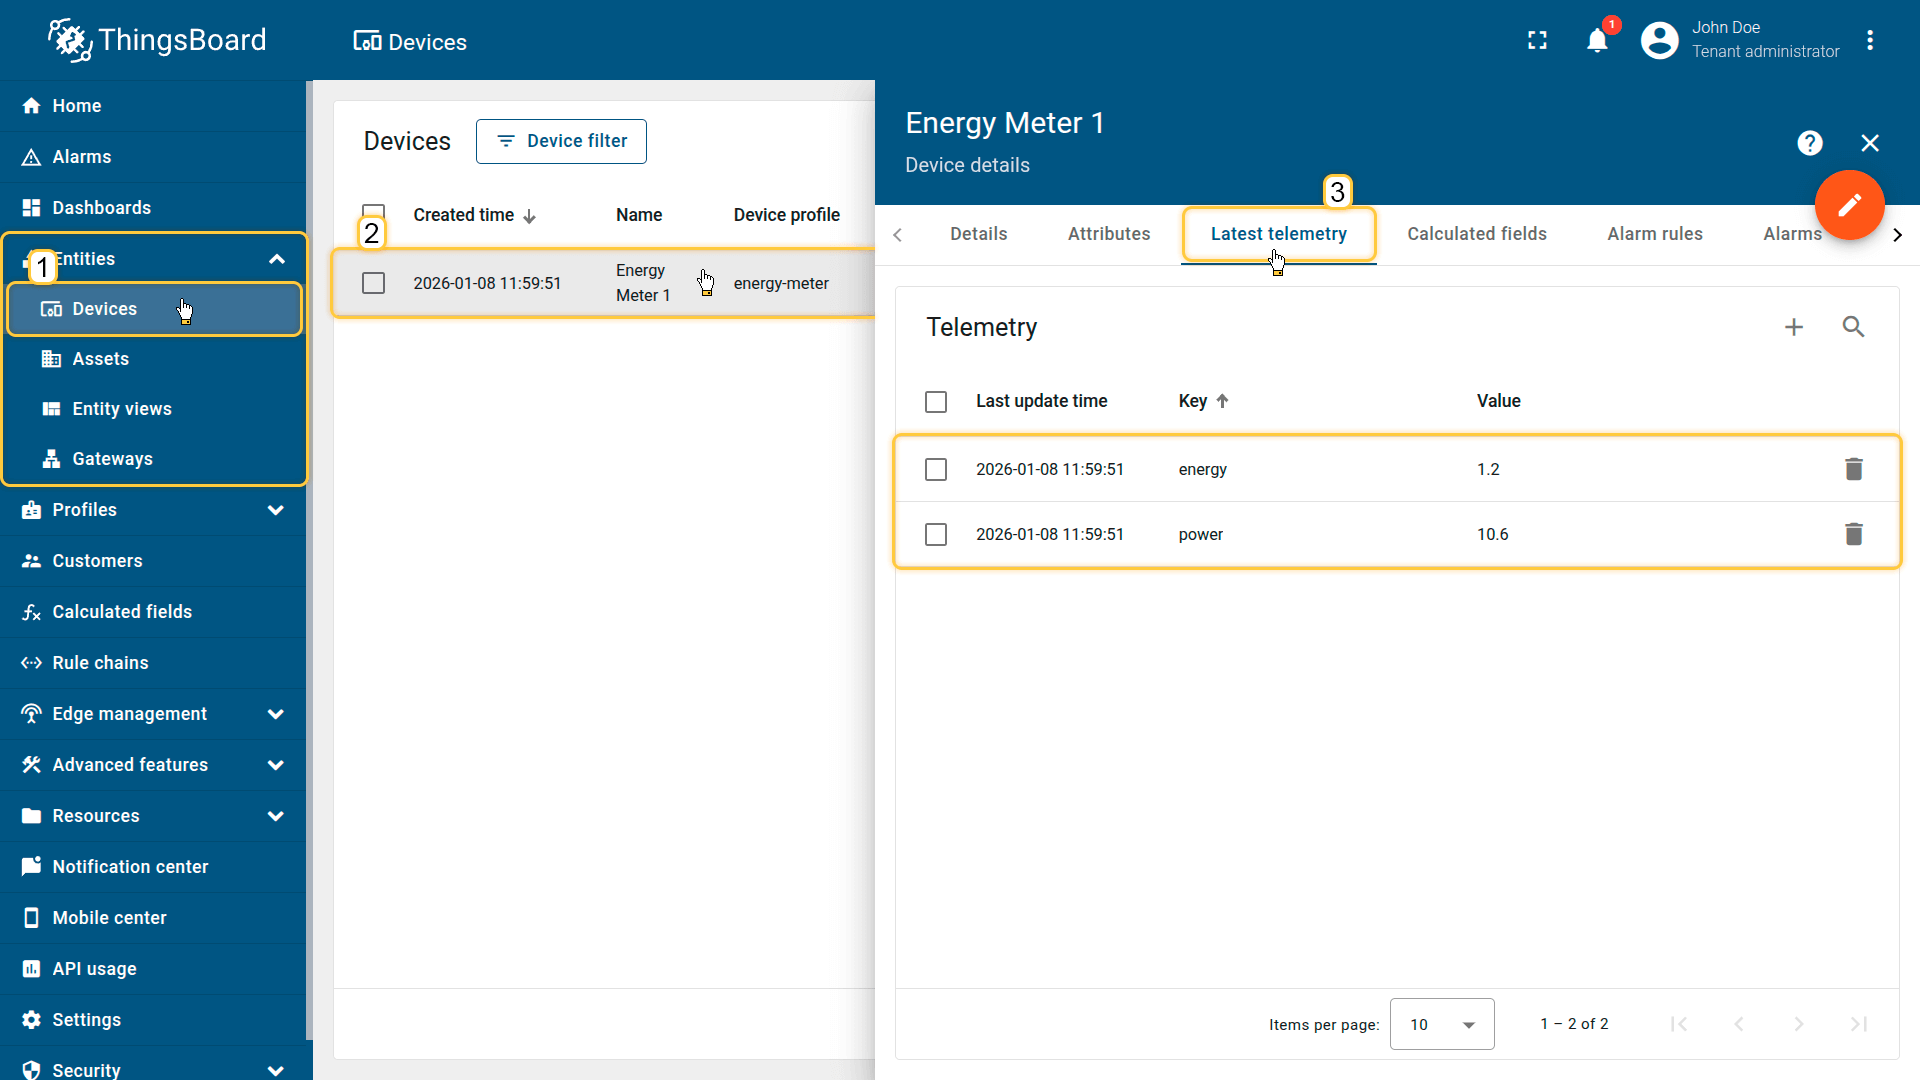
The imported device that publishes power and energy telemetry.
Note: make sure the device already has historical telemetry for at least 1–2 hours, otherwise the first aggregation interval may use default values.
2. Apply the calculated field to the device
Apply the Time series data aggregation calculated field to the Energy Meter 1 device.
- Download the calculated field configuration file.
- Go to the Calculated fields tab and import the configuration.
Ensure the calculated field is configured as:
- Type: Time series data aggregation
- Arguments (Current entity only):
- power → argument name power
- energy → argument name energy
- Metrics:
- powerHourlyAvg → Average of power
- powerHourlyMax → Max of power
- energyHourlySum → Sum of energy
- Aggregation interval: Hour
- Time zone: your reporting time zone (recommended: local time zone)
(Optional) Enable Debug mode and review execution events using the Events icon.
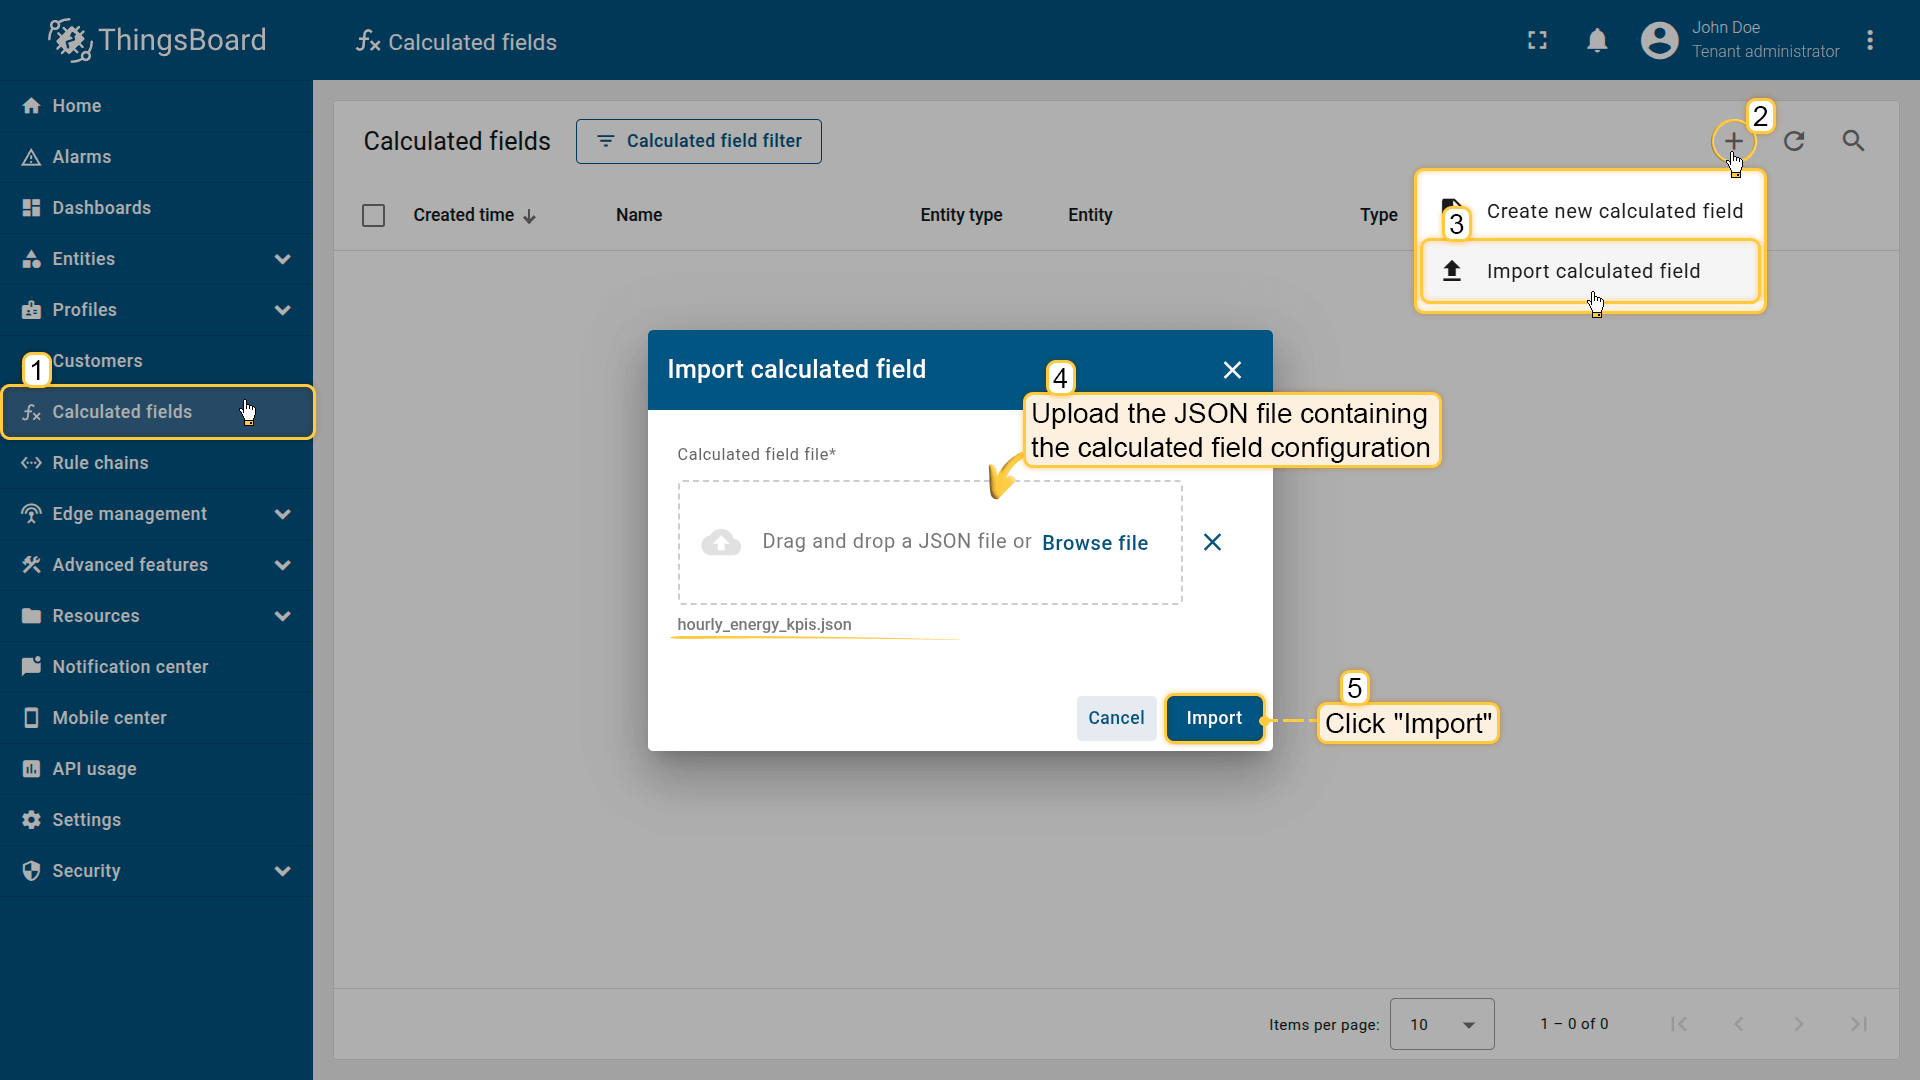
Go to the Calculated fields tab and import the calculated field configuration.
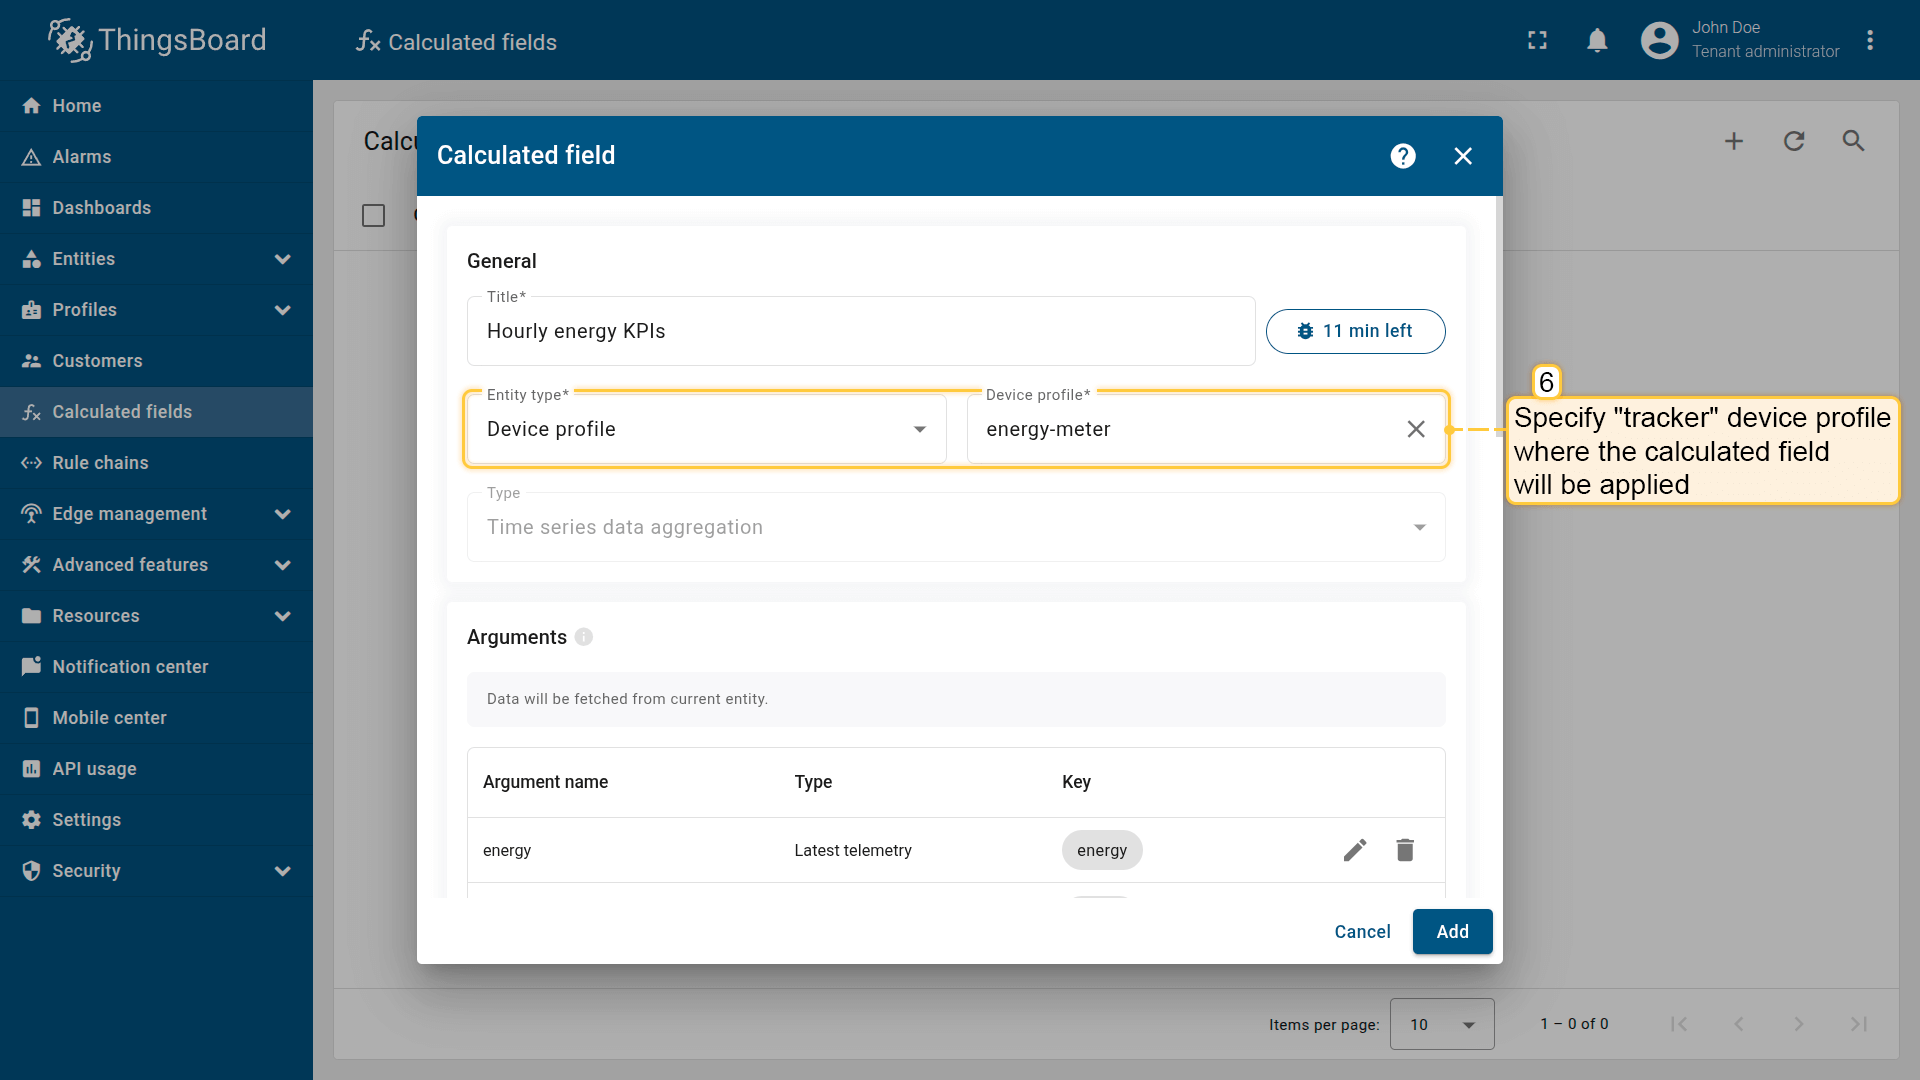
Apply the calculated field to the energy-meter device profile.

First argument settings:
- Time series key: energy
- Argument name: energy.
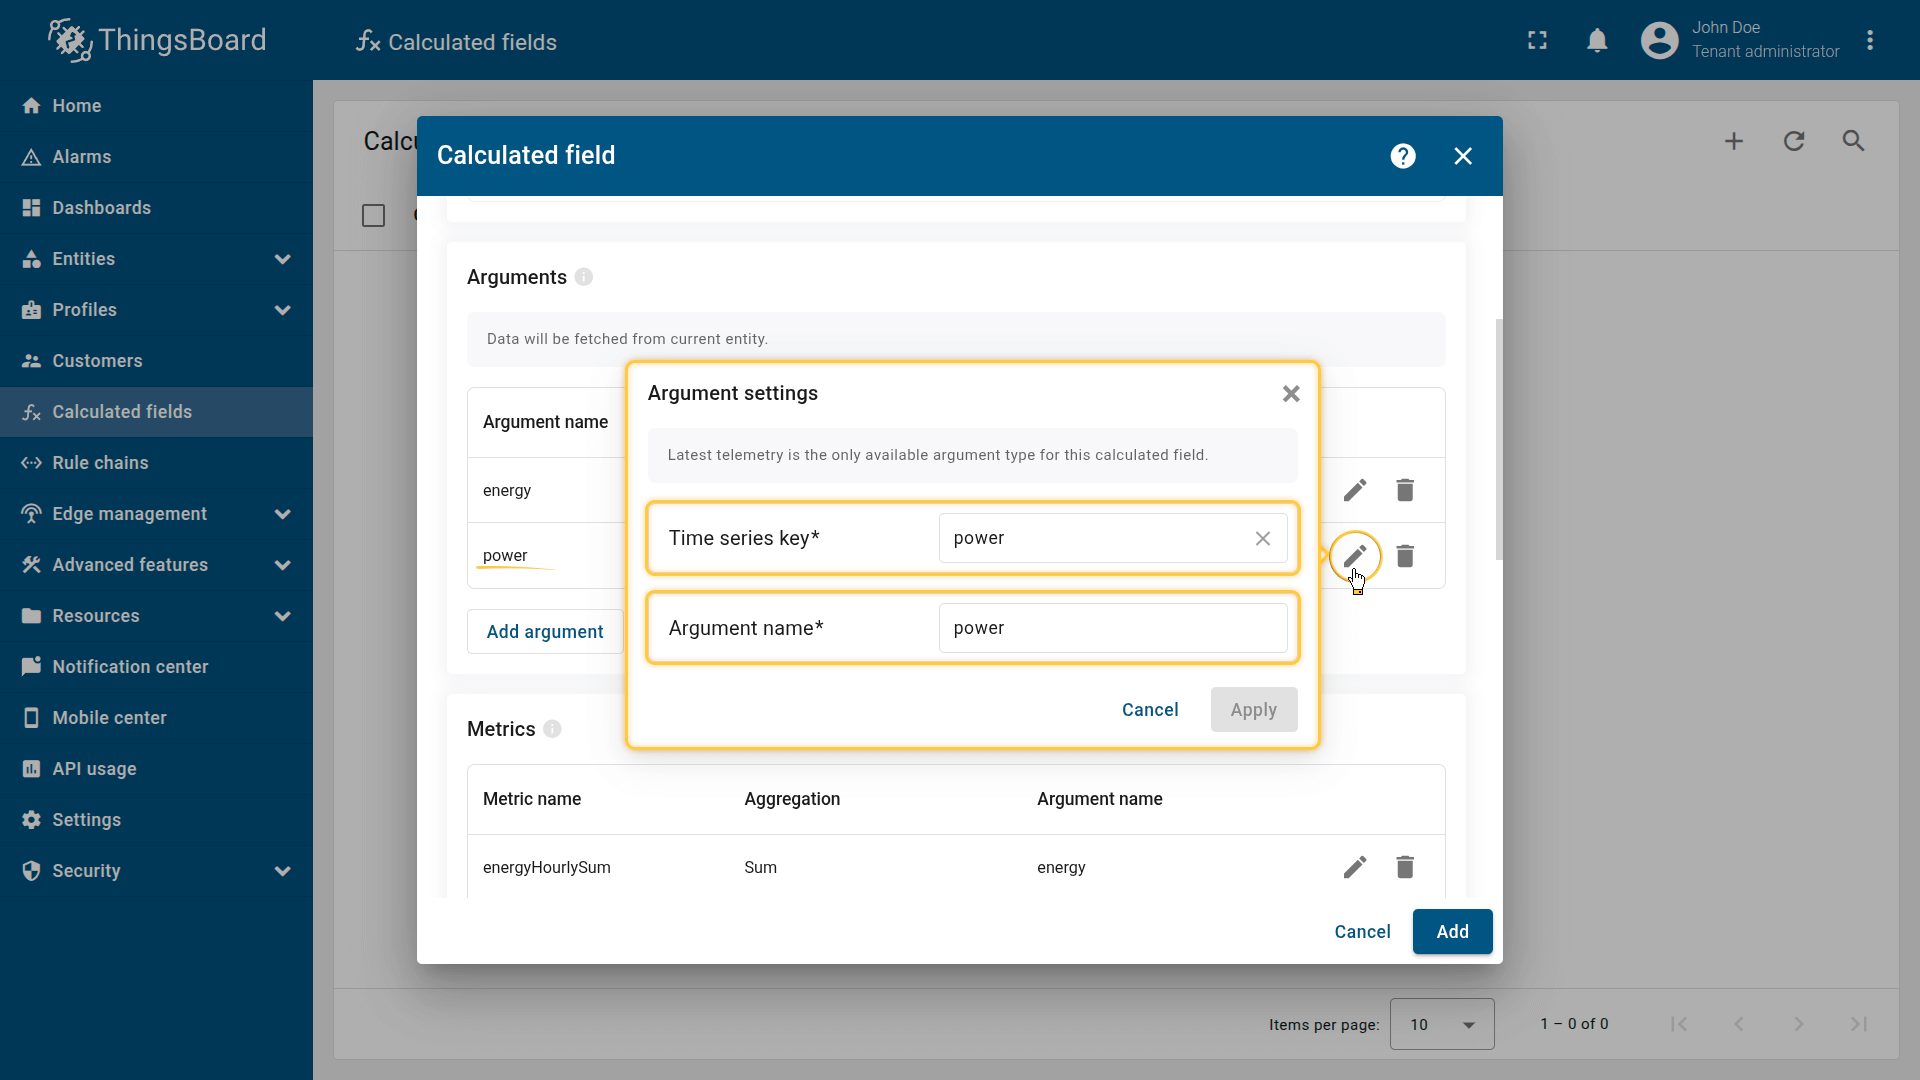
Second argument settings:
- Time series key: power
- Argument name: power.

First metric settings:
- Metric name: energyHourlySum
- Aggregation: Sum
- Argument name: energy.
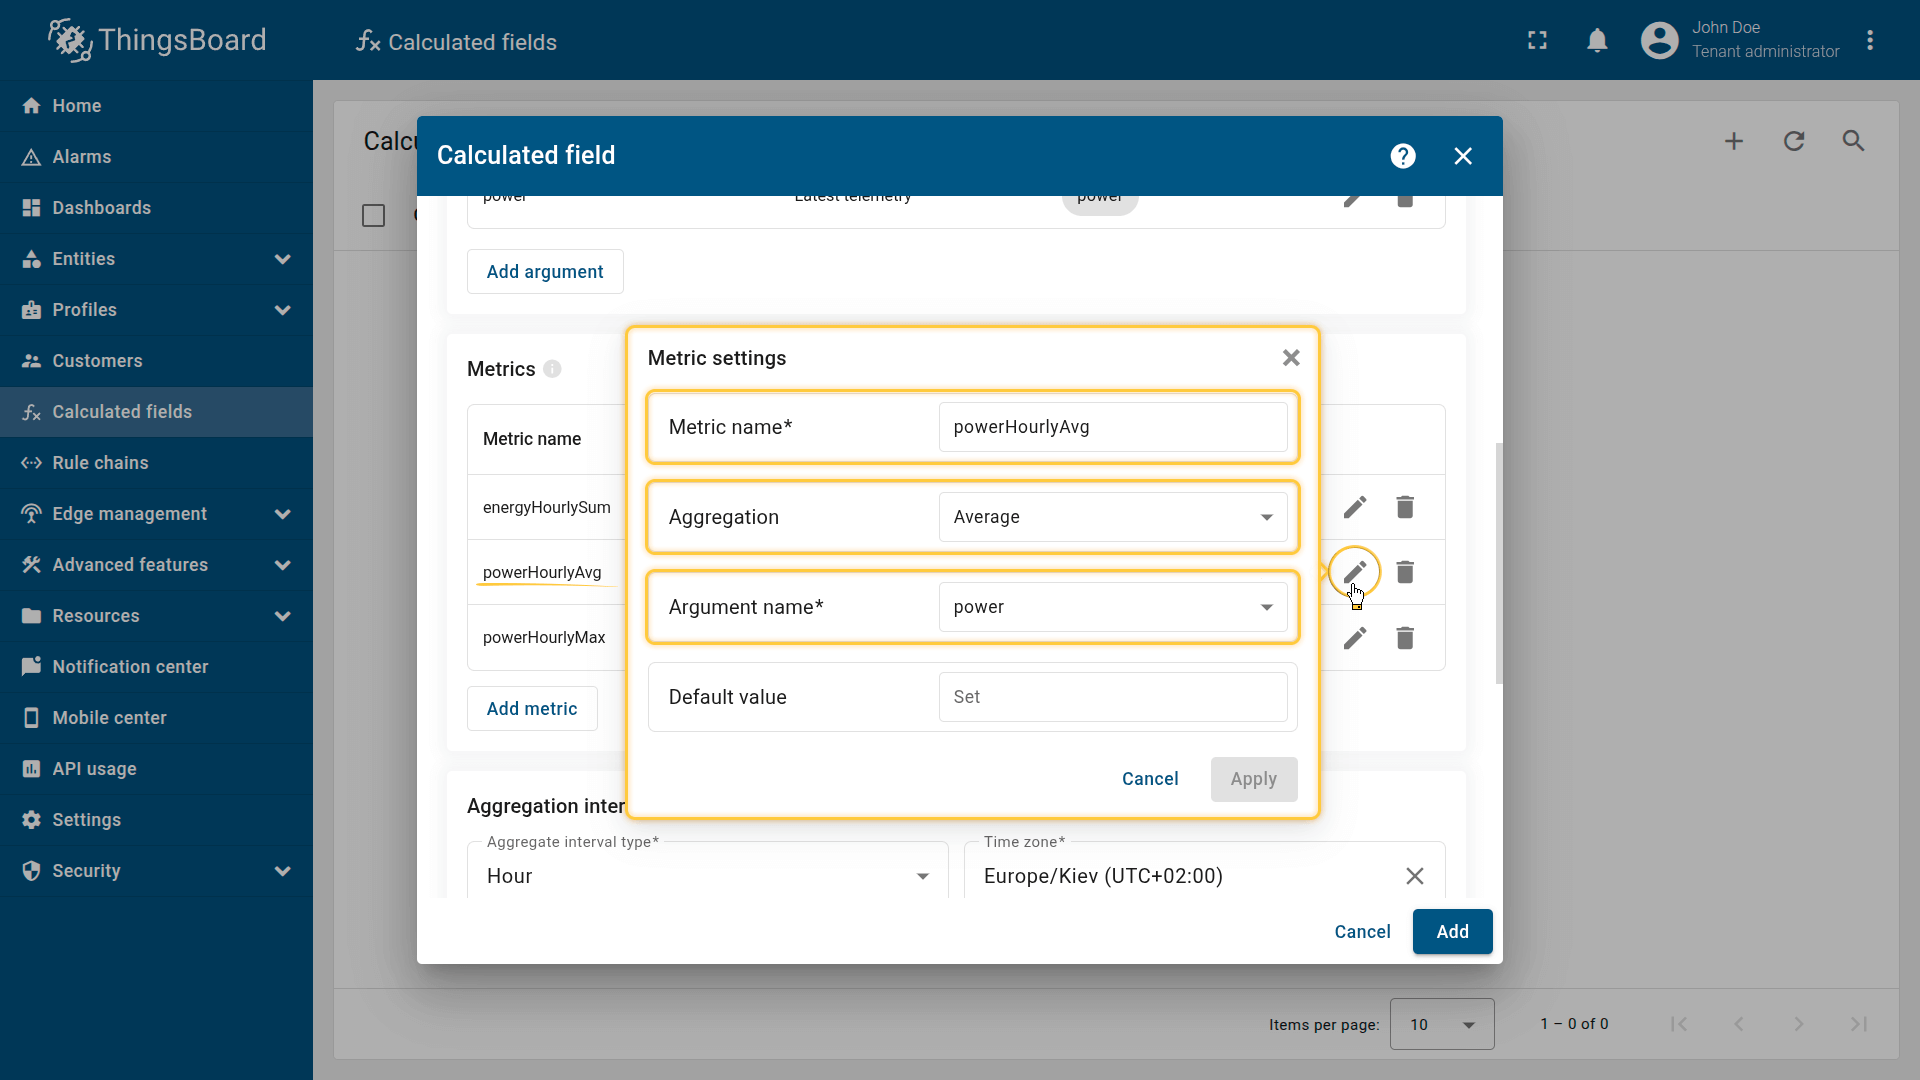
Second metric settings:
- Metric name: powerHourlyAvg
- Aggregation: Average
- Argument name: power.
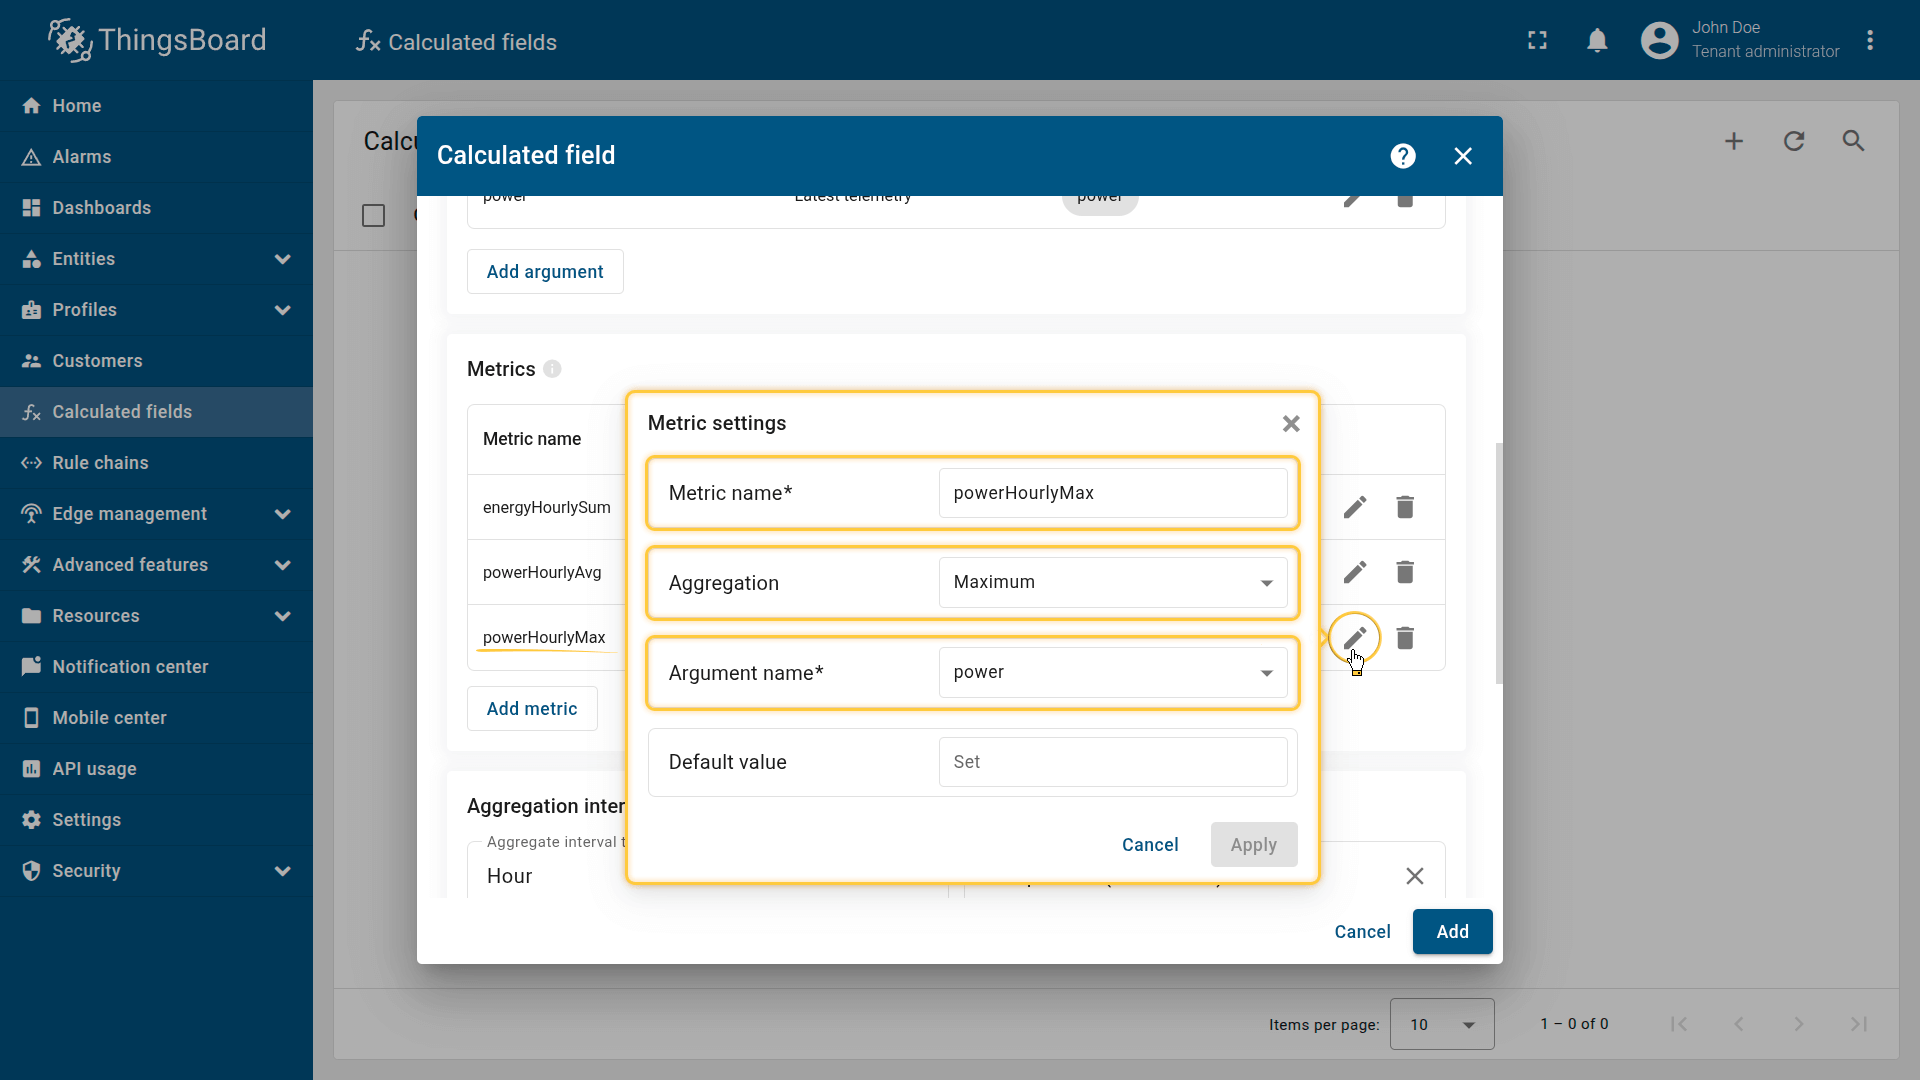
Third metric settings:
- Metric name: powerHourlyMax
- Aggregation: Maximum
- Argument name: power.
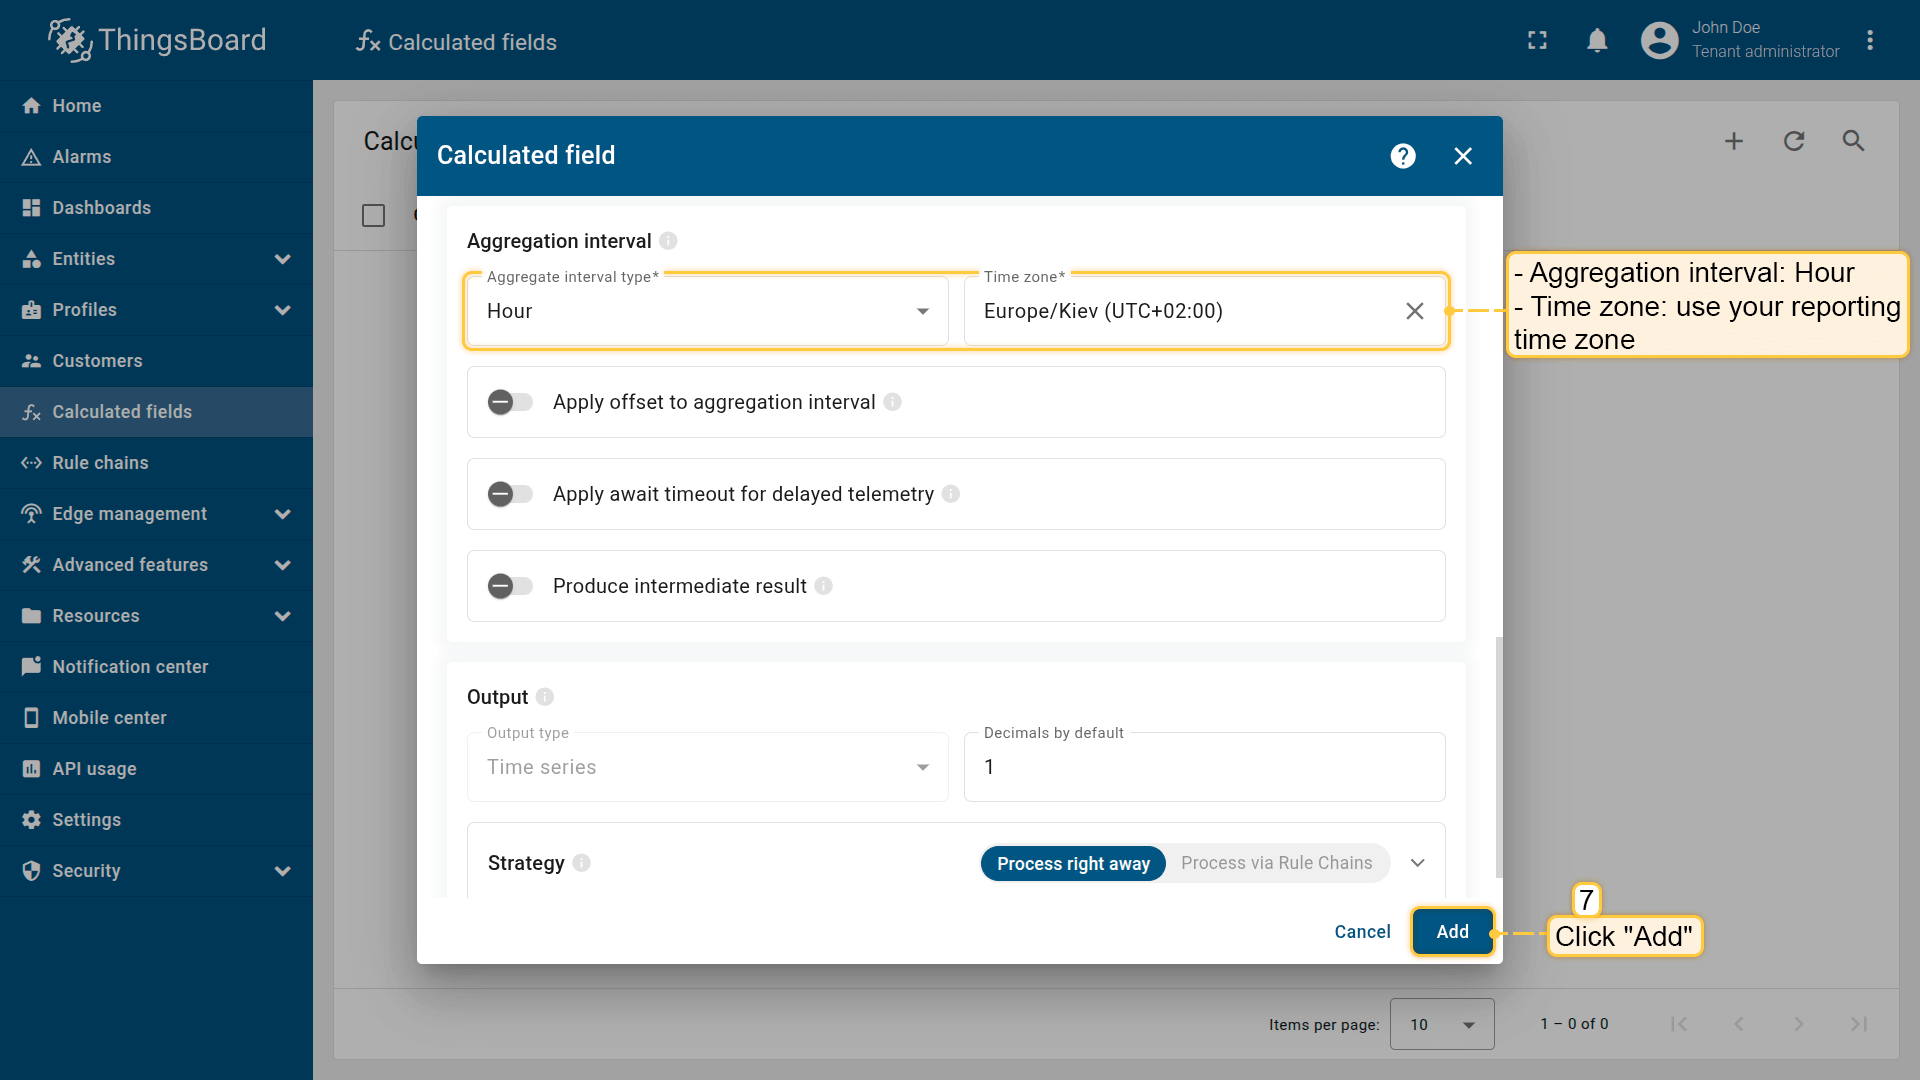
Aggregation interval: Hour; Time zone: use your reporting time zone.
The computed values are stored as telemetry (time series) keys.
Click Add to save the calculation field.
Result
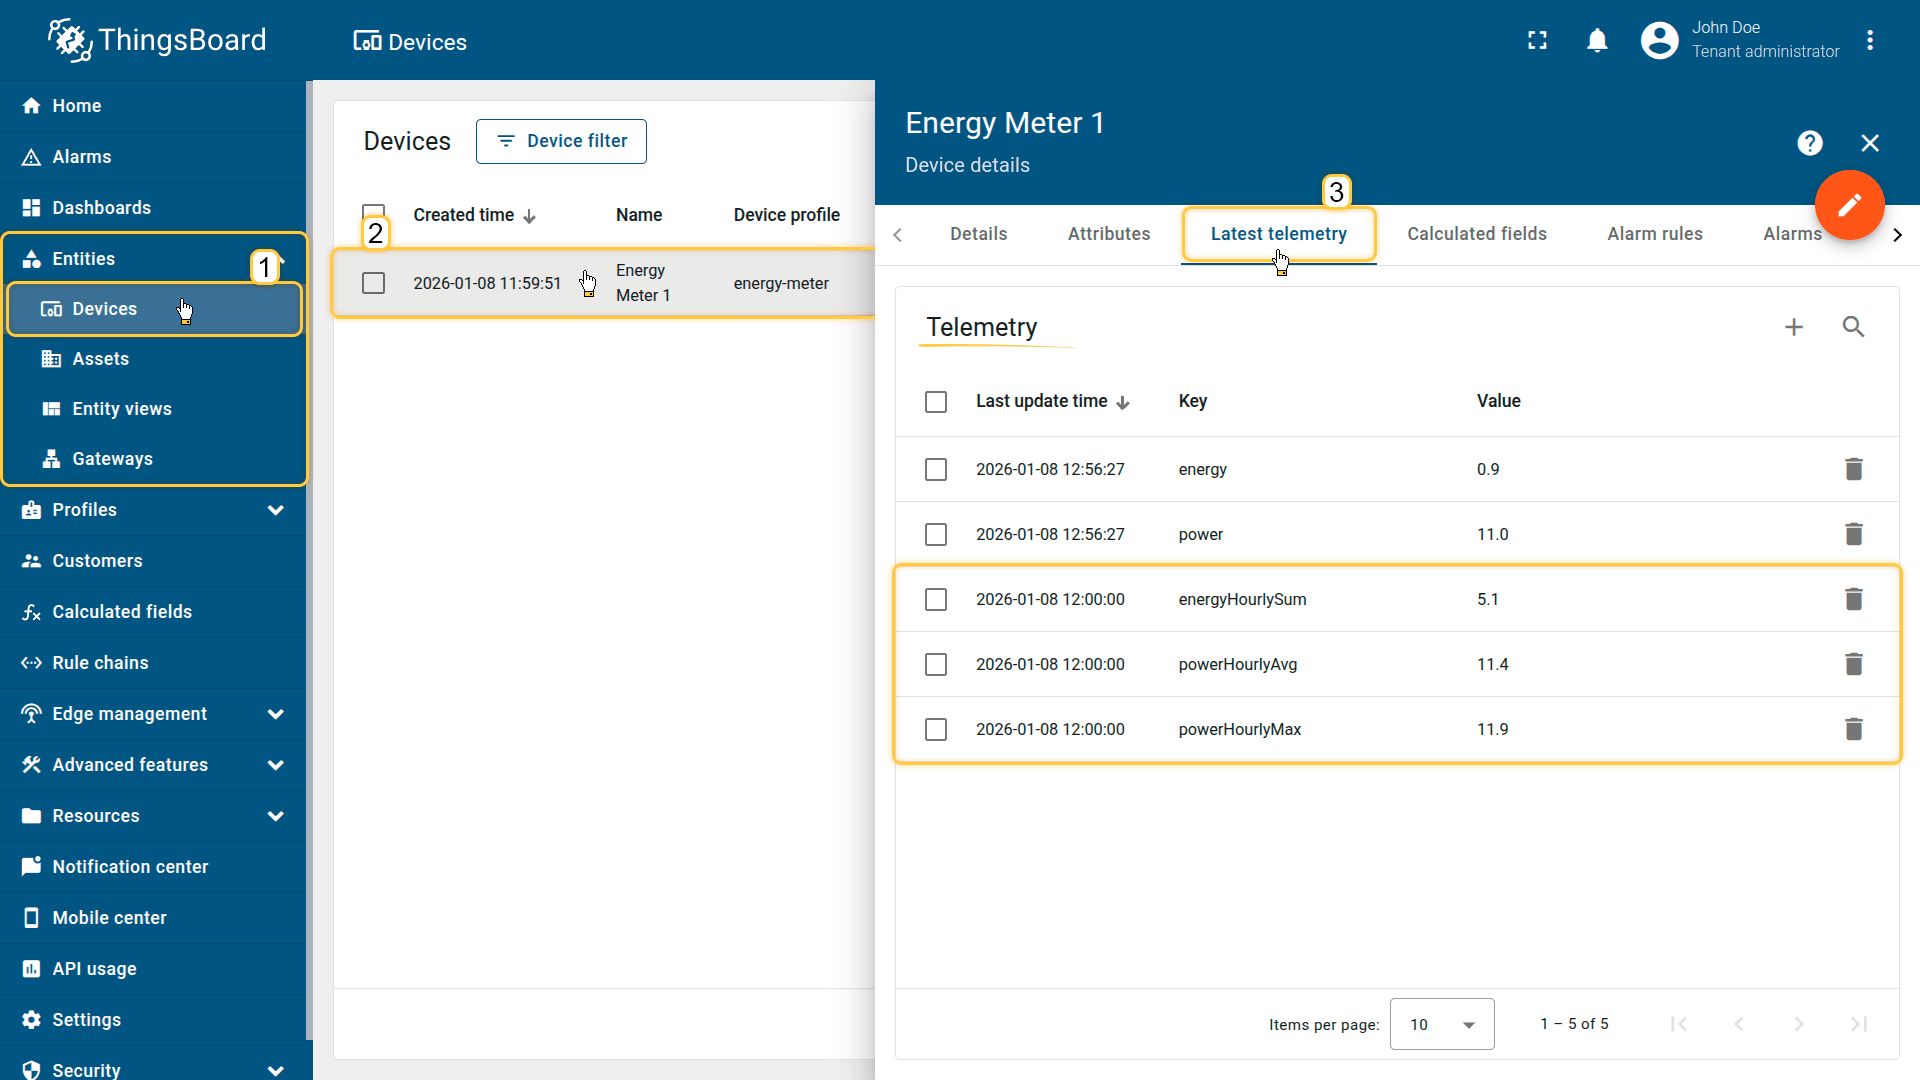
New values will be calculated at the beginning of the next hour (in my case, at 13:00).
On the Energy Meter 1 device, the aggregated values are stored as telemetry (time series) keys:
- powerHourlyAvg — hourly average power usage
- powerHourlyMax — hourly peak power usage
- energyHourlySum — hourly energy consumption
Example output for one interval:
1
2
3
4
5
{
  "powerHourlyAvg": 12.4,
  "powerHourlyMax": 18.9,
  "energyHourlySum": 6.7
}
On the Energy Meter 1 device, the aggregated values are stored as telemetry (time series) keys:
- powerHourlyAvg— hourly average power usage
- powerHourlyMax —hourly peak power usage
- energyHourlySum — hourly energy consumption