- Simulation of the devices’ telemetry data
- Displaying devices telemetry in Office sensors list widget
- Time window
- Adding state for each device & navigation between states
- Configuring air_sensor state
- Configuring energy_sensor state
- Configuring water_sensor state
- Final view of the dashboard for this lesson
- Next step
本课为dashboard系列第三课,用于可视化和监控楼宇内集成设备的数据。 前两课已介绍assets和devices、添加dashboard、为建筑和办公室创建states并实现它们之间的导航。 继续前强烈建议先复习前两课。
Lesson 2: Dashboard states, widget actions, and Image Map widget
本课将为每台设备添加独立states,模拟设备telemetry并在card部件上展示。
Simulation of the devices’ telemetry data
由于使用虚拟设备,它们不会向ThingsBoard发送telemetry。但我们可以实时模拟此类数据的发送。 为此将使用 Rule Engine。
We will add a new Rule Chain with four generator nodes that will periodically generate simple messages with random telemetry readings, unique to each of our devices. Then, we will save this telemetry in the database using the save time series node. Let's get started.
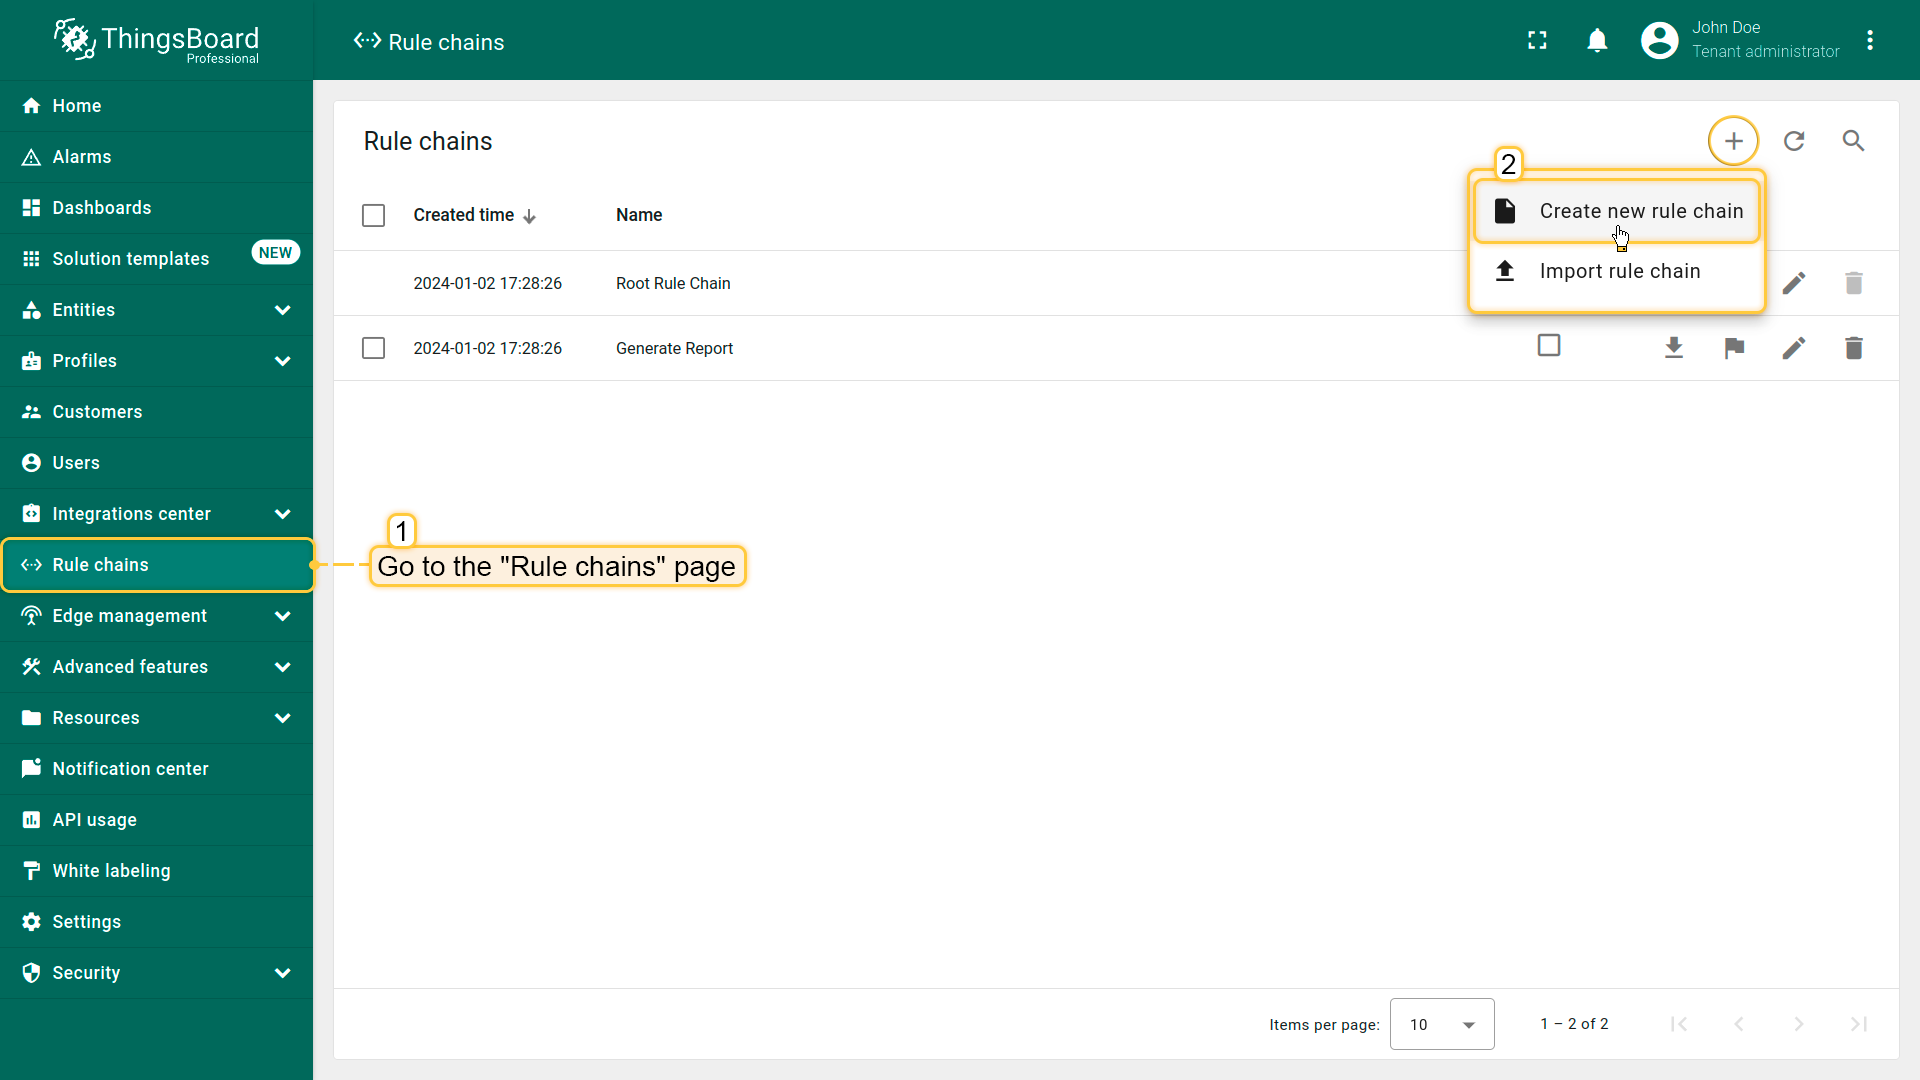
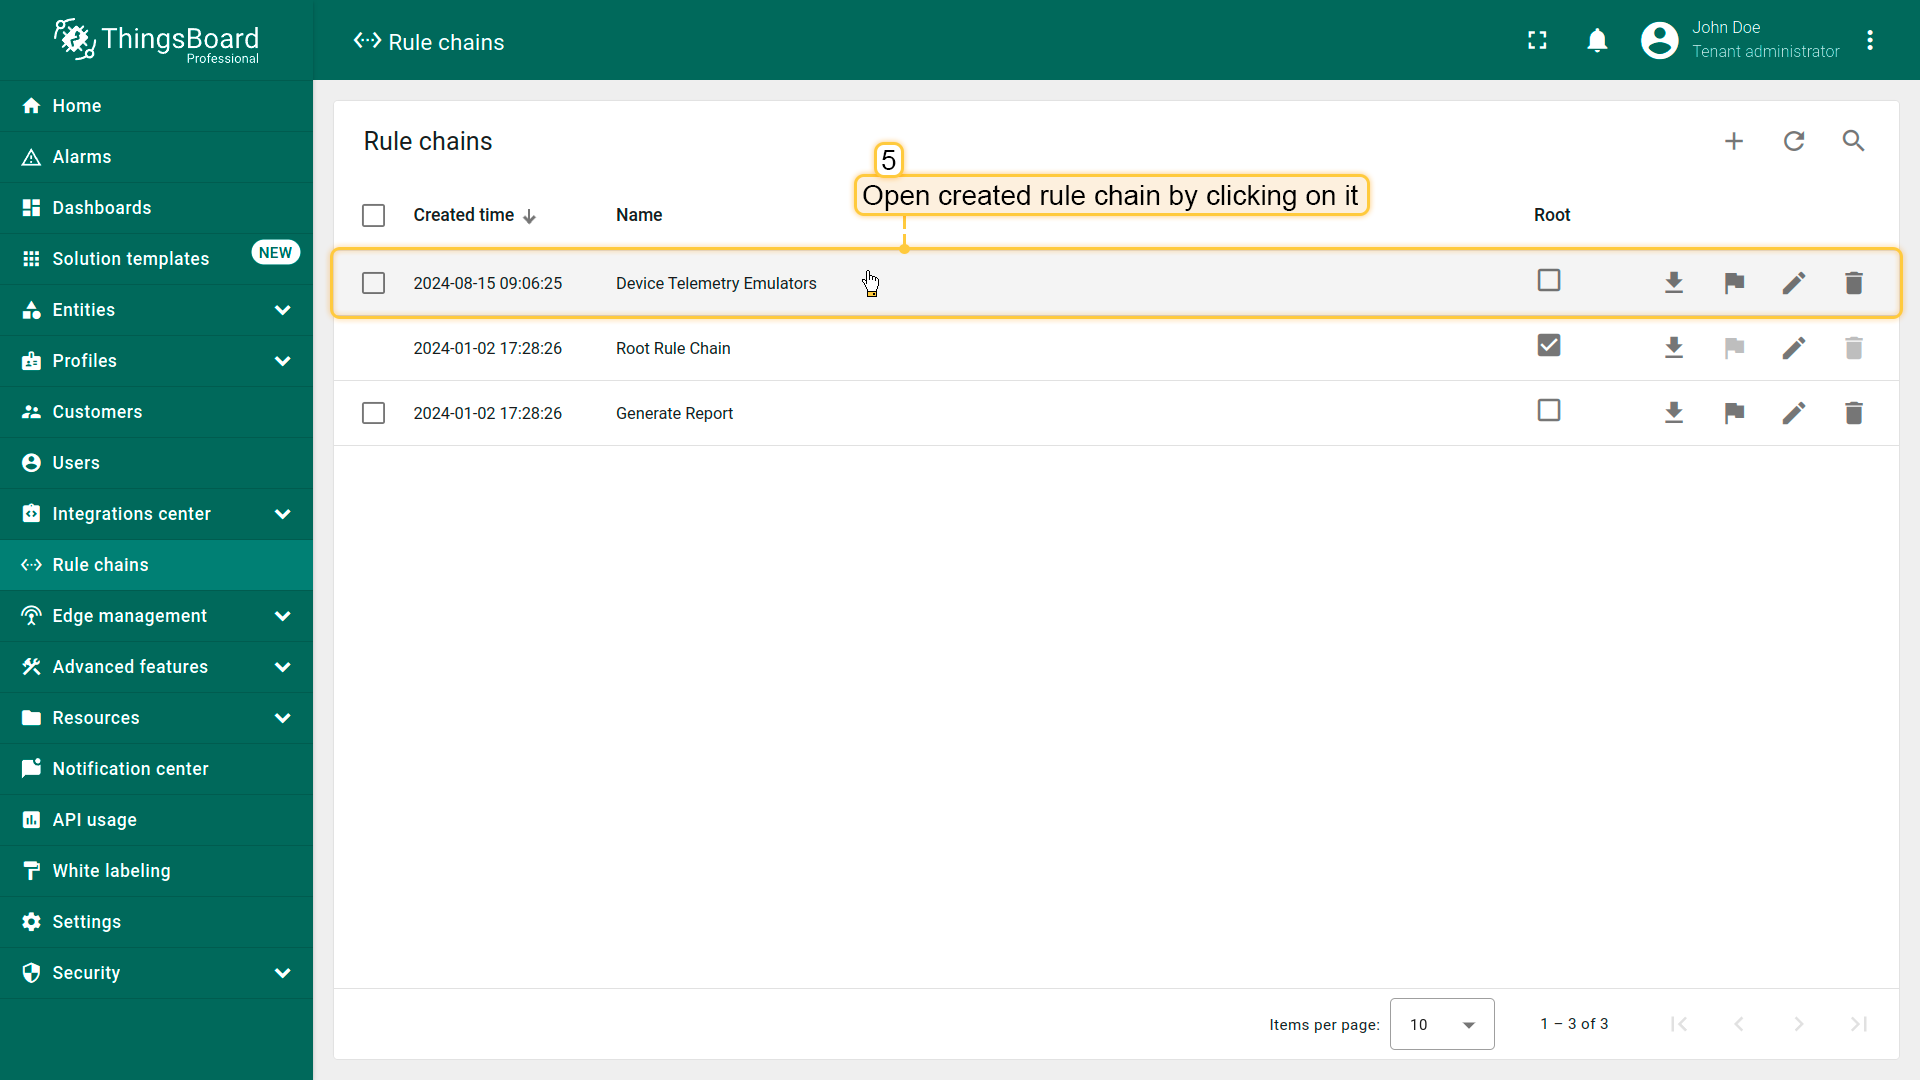
First, create the new rule chain:
- Go to the “Rule chains” page and click “plus” icon, then select the “Create new rule chain” from drop-down menu;
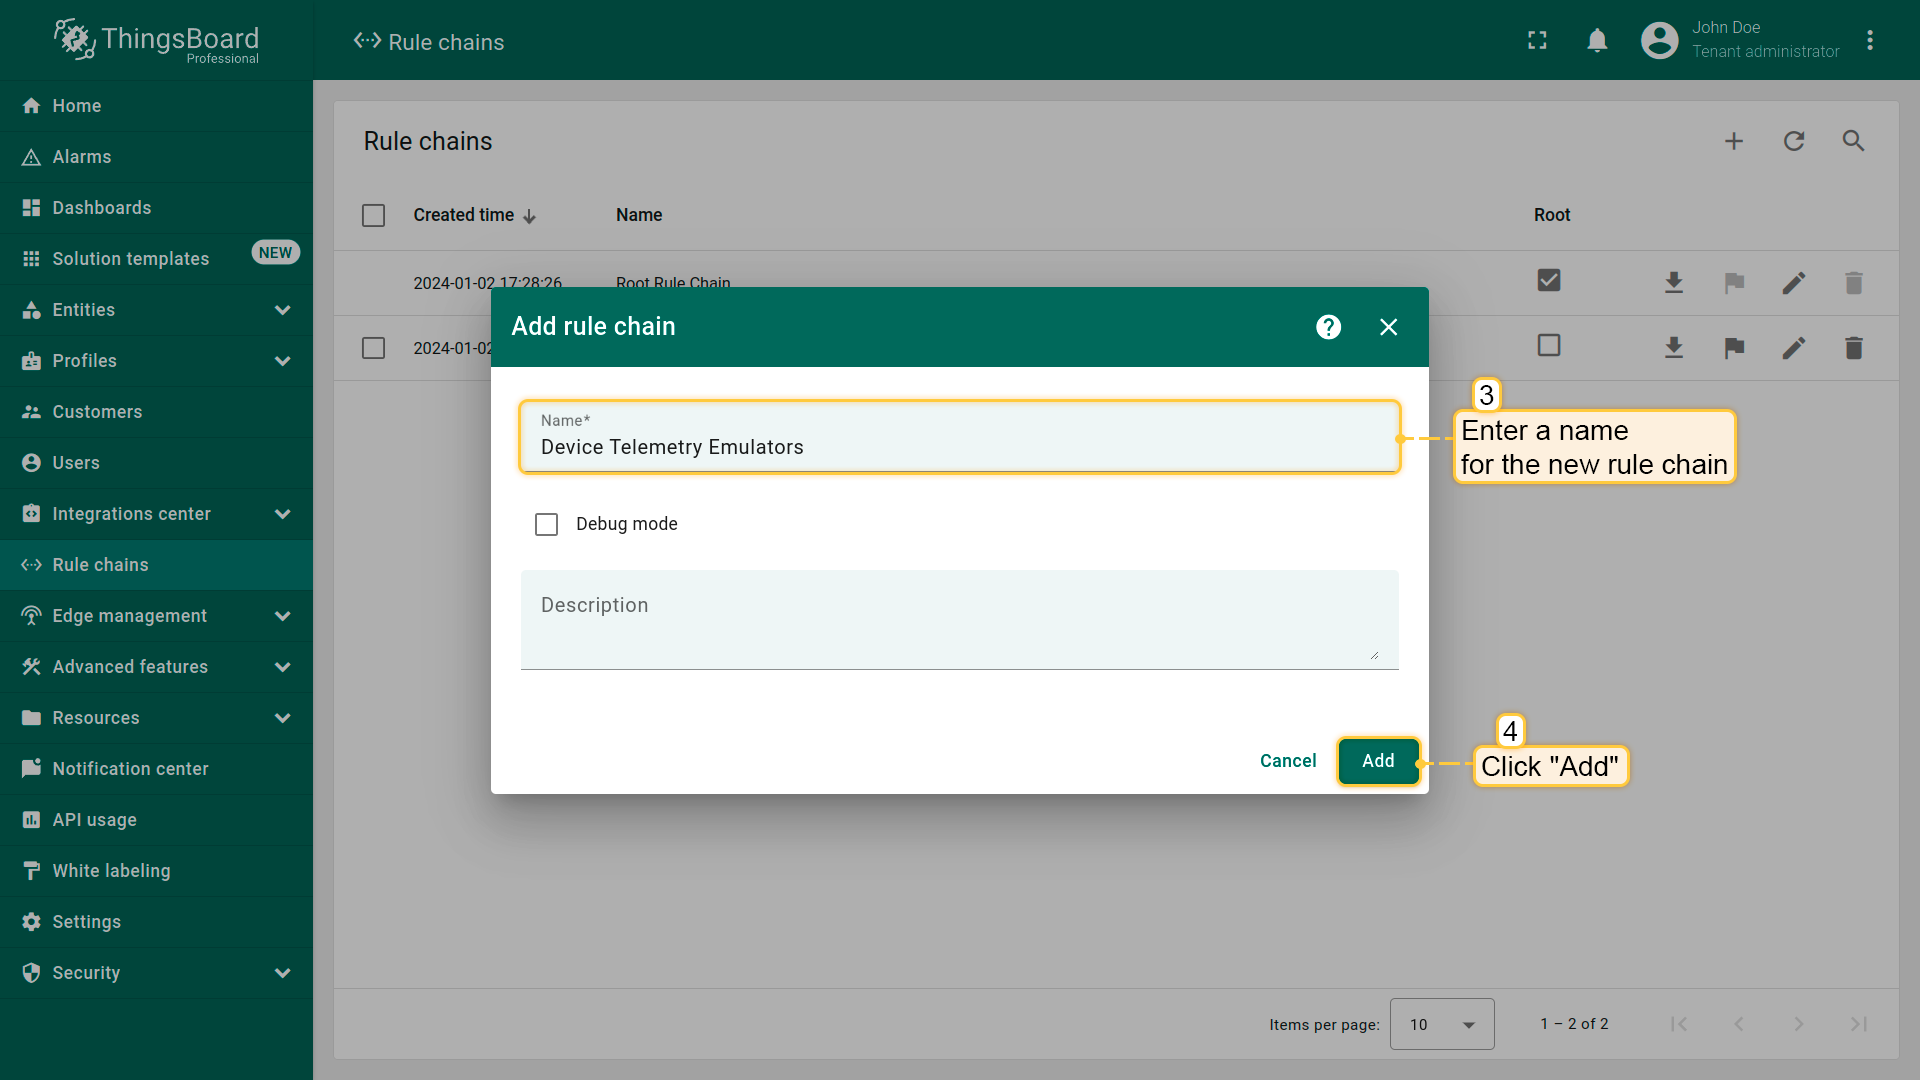
- Name it “Device Telemetry Emulators”, and click “Add”;
- Open created rule chain by clicking on it.
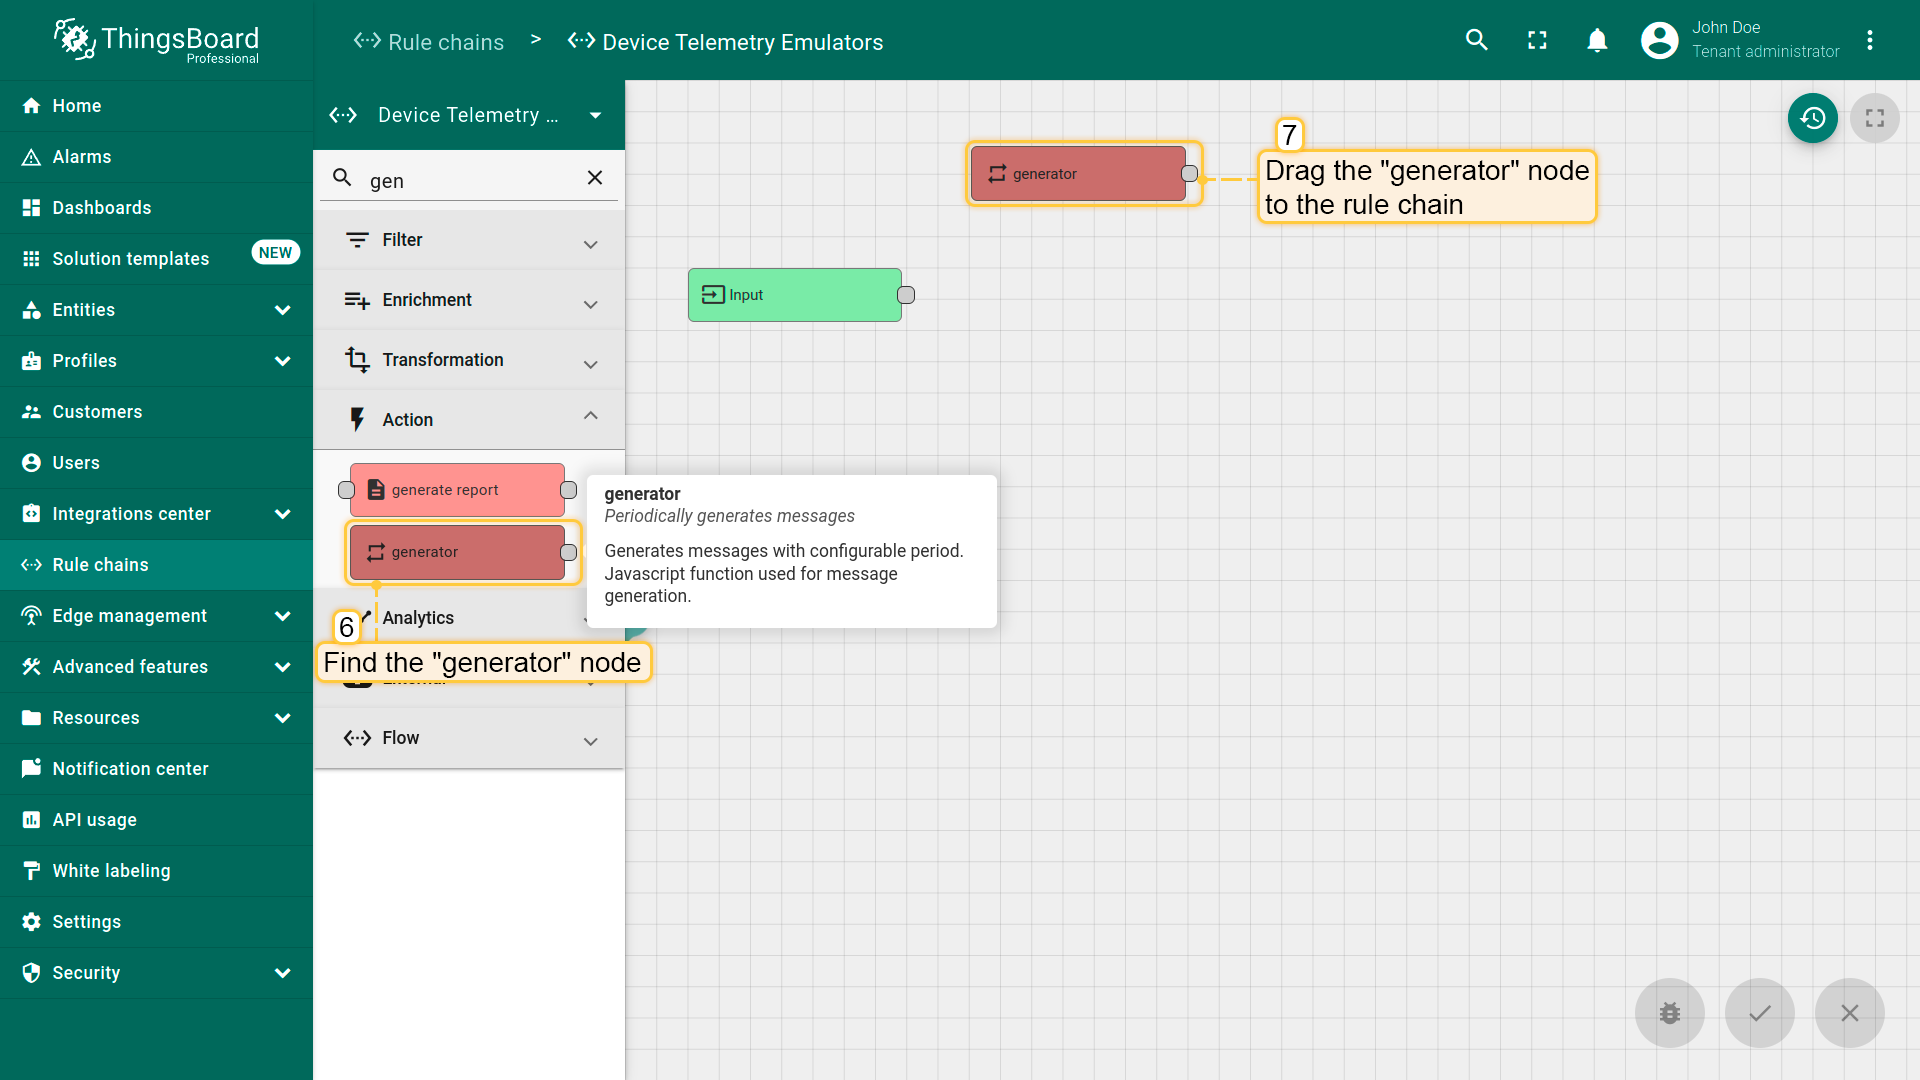
Now, let's add the necessary nodes:
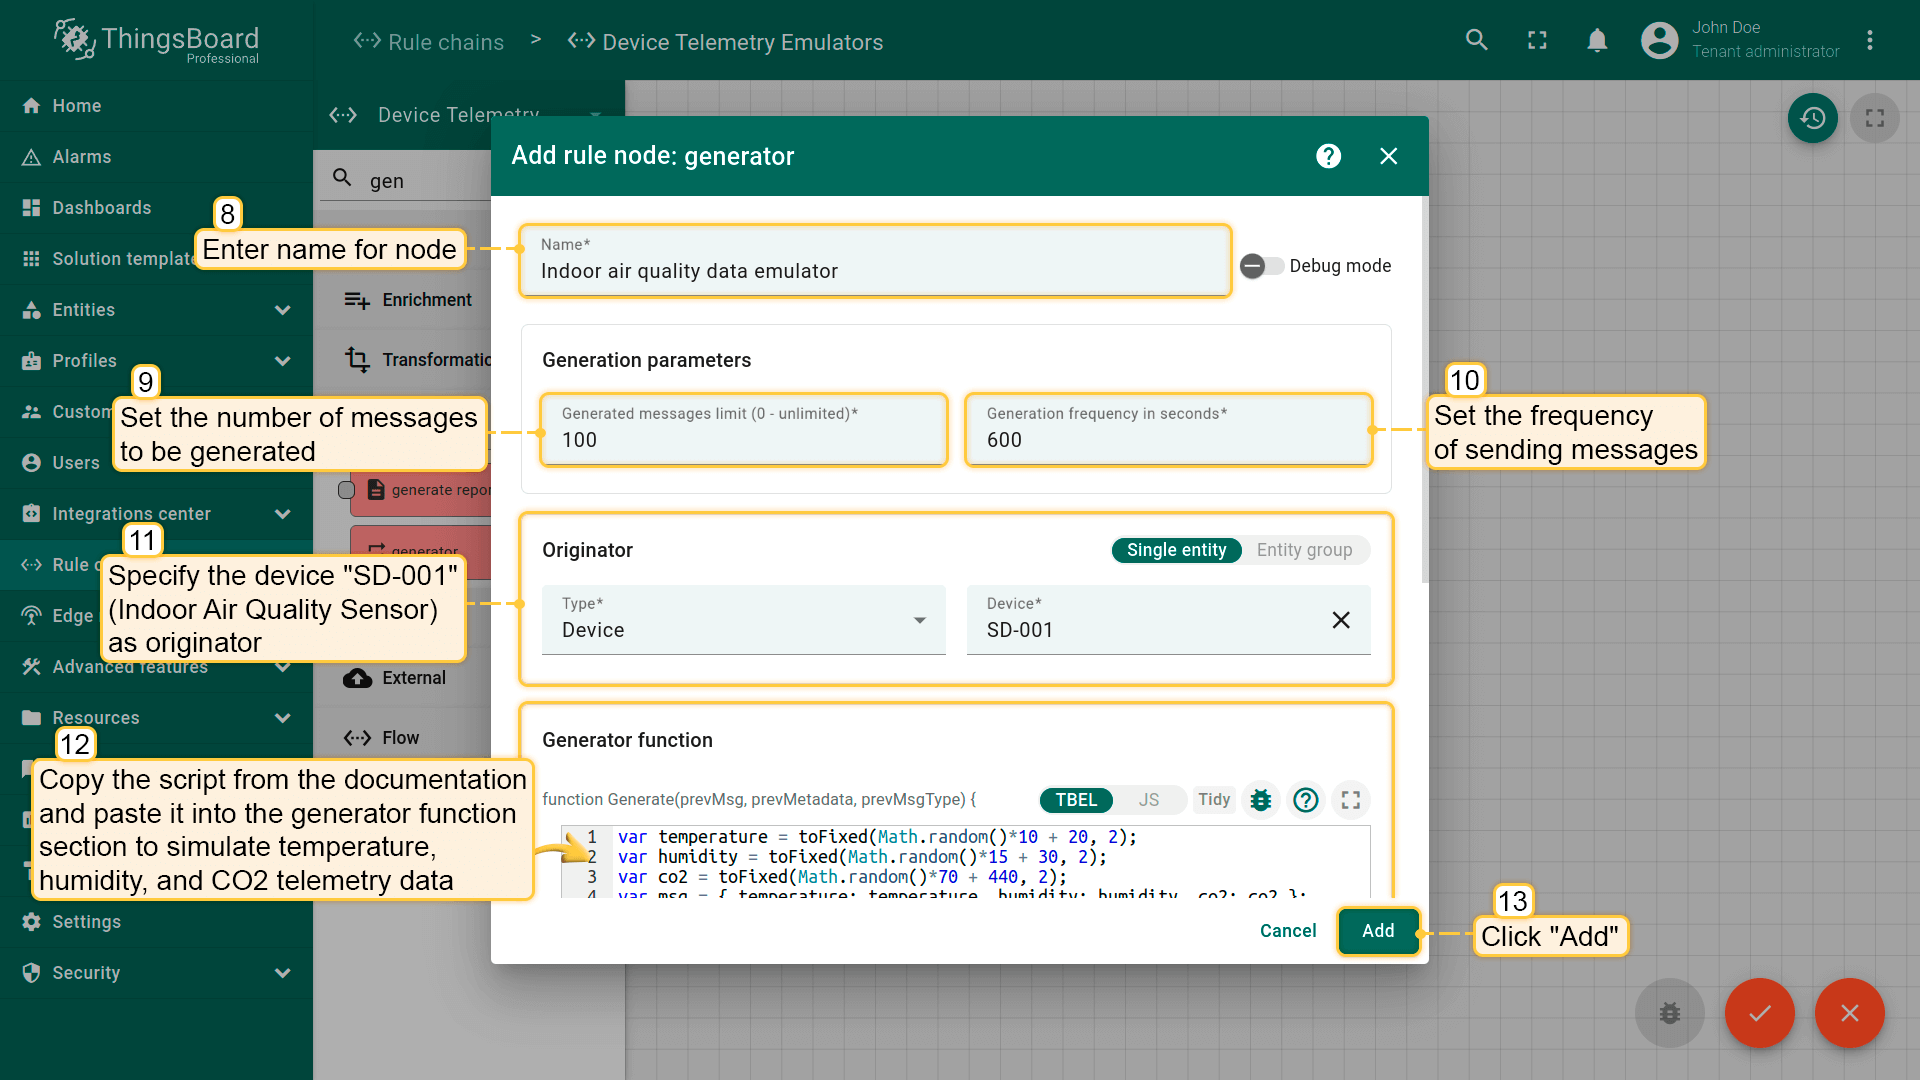
- Find the generator node and drag it to the rule chain. With its help, we will generate telemetry values for further visualization on the dashboard. Name it “Indoor air quality data emulator”, and set the number of messages to send to 100 and the sending period to 600;
- Specify the device “SD-001” (Indoor Air Quality Sensor) as originator;
- Copy the following script from the documentation:
1
2
3
4
5
6
7
var temperature = toFixed(Math.random()*10 + 18, 2);
var humidity = toFixed(Math.random()*15 + 40, 2);
var co2 = toFixed(Math.random()*70 + 440, 2);
var msg = { temperature: temperature, humidity: humidity, co2: co2 };
var metadata = { data: 40 };
var msgType = "POST_TELEMETRY_REQUEST";
return { msg: msg, metadata: metadata, msgType: msgType };
- Paste the copied script into the generator function section to simulate temperature, humidity, and CO2 telemetry data;
- Click “Add”.
We added a “generator” node that will send telemetry to ThingsBoard on behalf of the “Indoor Air Quality Sensor” device every 10 minutes (600 seconds). There will be 100 such messages.
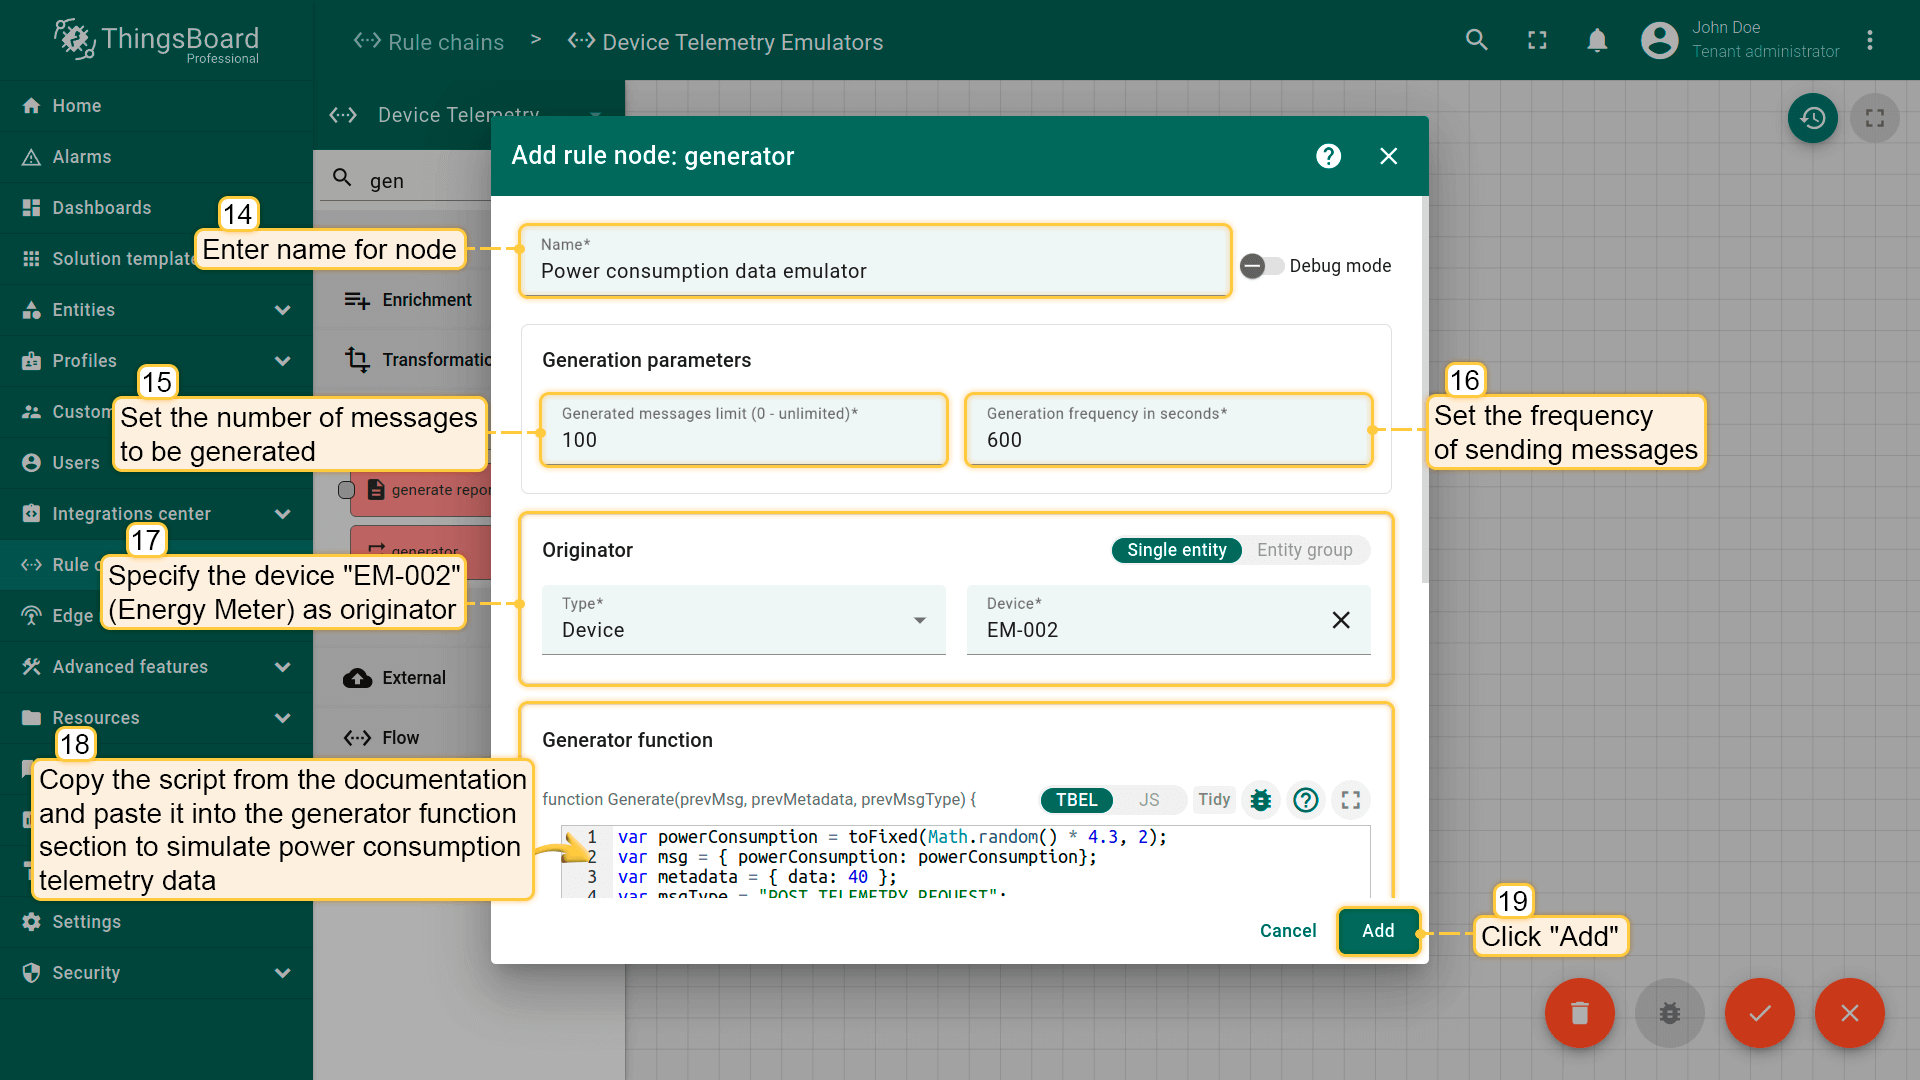
Similarly, add data emulator for “Energy Meter” device:
- Name it “Power consumption data emulator”;
- Set the number of messages to send to 100 and the sending period to 600;
- Specify the device “EM-002” (Energy Meter) as originator;
- Use the following script to simulate power consumption telemetry data:
1
2
3
4
5
var powerConsumption = toFixed(Math.random() * 2.2, 2);
var msg = { powerConsumption: powerConsumption};
var metadata = { data: 40 };
var msgType = "POST_TELEMETRY_REQUEST";
return { msg: msg, metadata: metadata, msgType: msgType };
- Click “Add.
Add data emulator for “Water Flow Meter” device.
- Name it “Water consumption data emulator”;
- Set the number of messages to send to 100 and the sending period to 600;
- Specify the device “WM-003” (Water Flow Meter) as originator;
- Use the following script to simulate water consumption telemetry data, and battery voltage data:
1
2
3
4
5
6
var waterConsumption = toFixed(Math.random()*1.3, 2);
var batteryLevel = toFixed(Math.random()*1 + 45, 2);
var msg = { waterConsumption: waterConsumption, batteryLevel: batteryLevel };
var metadata = { data: 40 };
var msgType = "POST_TELEMETRY_REQUEST";
return { msg: msg, metadata: metadata, msgType: msgType };
- Click “Add.

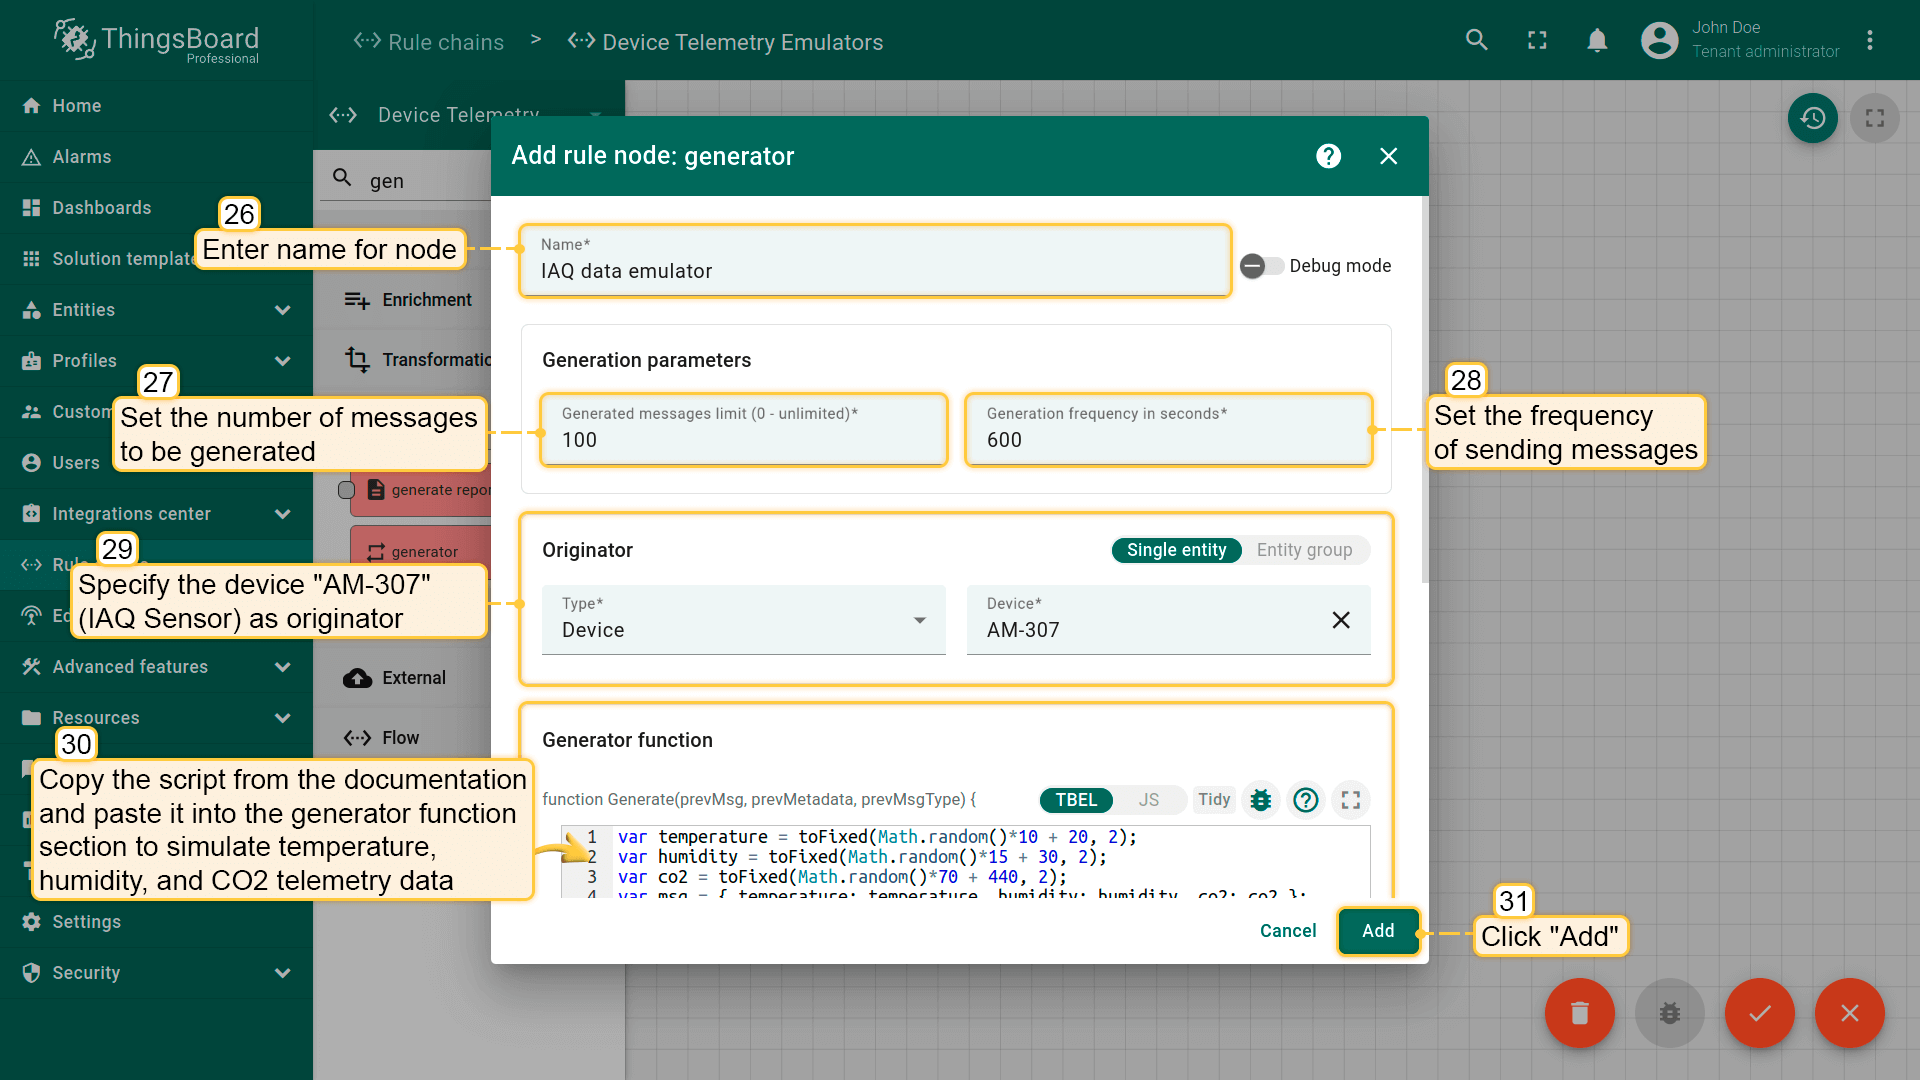
Finally, add data emulator for “IAQ Sensor” device. Name it “IAQ data emulator”. Set the number of messages to send to 100 and the sending period to 600.
- Name it “Water consumption data emulator”;
- Set the number of messages to send to 100 and the sending period to 600;
- Specify the device “AM-307” (IAQ Sensor) as originator;
- Use the following script to simulate water consumption, and battery voltage telemetry data:
1
2
3
4
5
6
7
var temperature = toFixed(Math.random()*10 + 18, 2);
var humidity = toFixed(Math.random()*15 + 40, 2);
var co2 = toFixed(Math.random()*70 + 440, 2);
var msg = { temperature: temperature, humidity: humidity, co2: co2 };
var metadata = { data: 40 };
var msgType = "POST_TELEMETRY_REQUEST";
return { msg: msg, metadata: metadata, msgType: msgType };
- Click “Add.
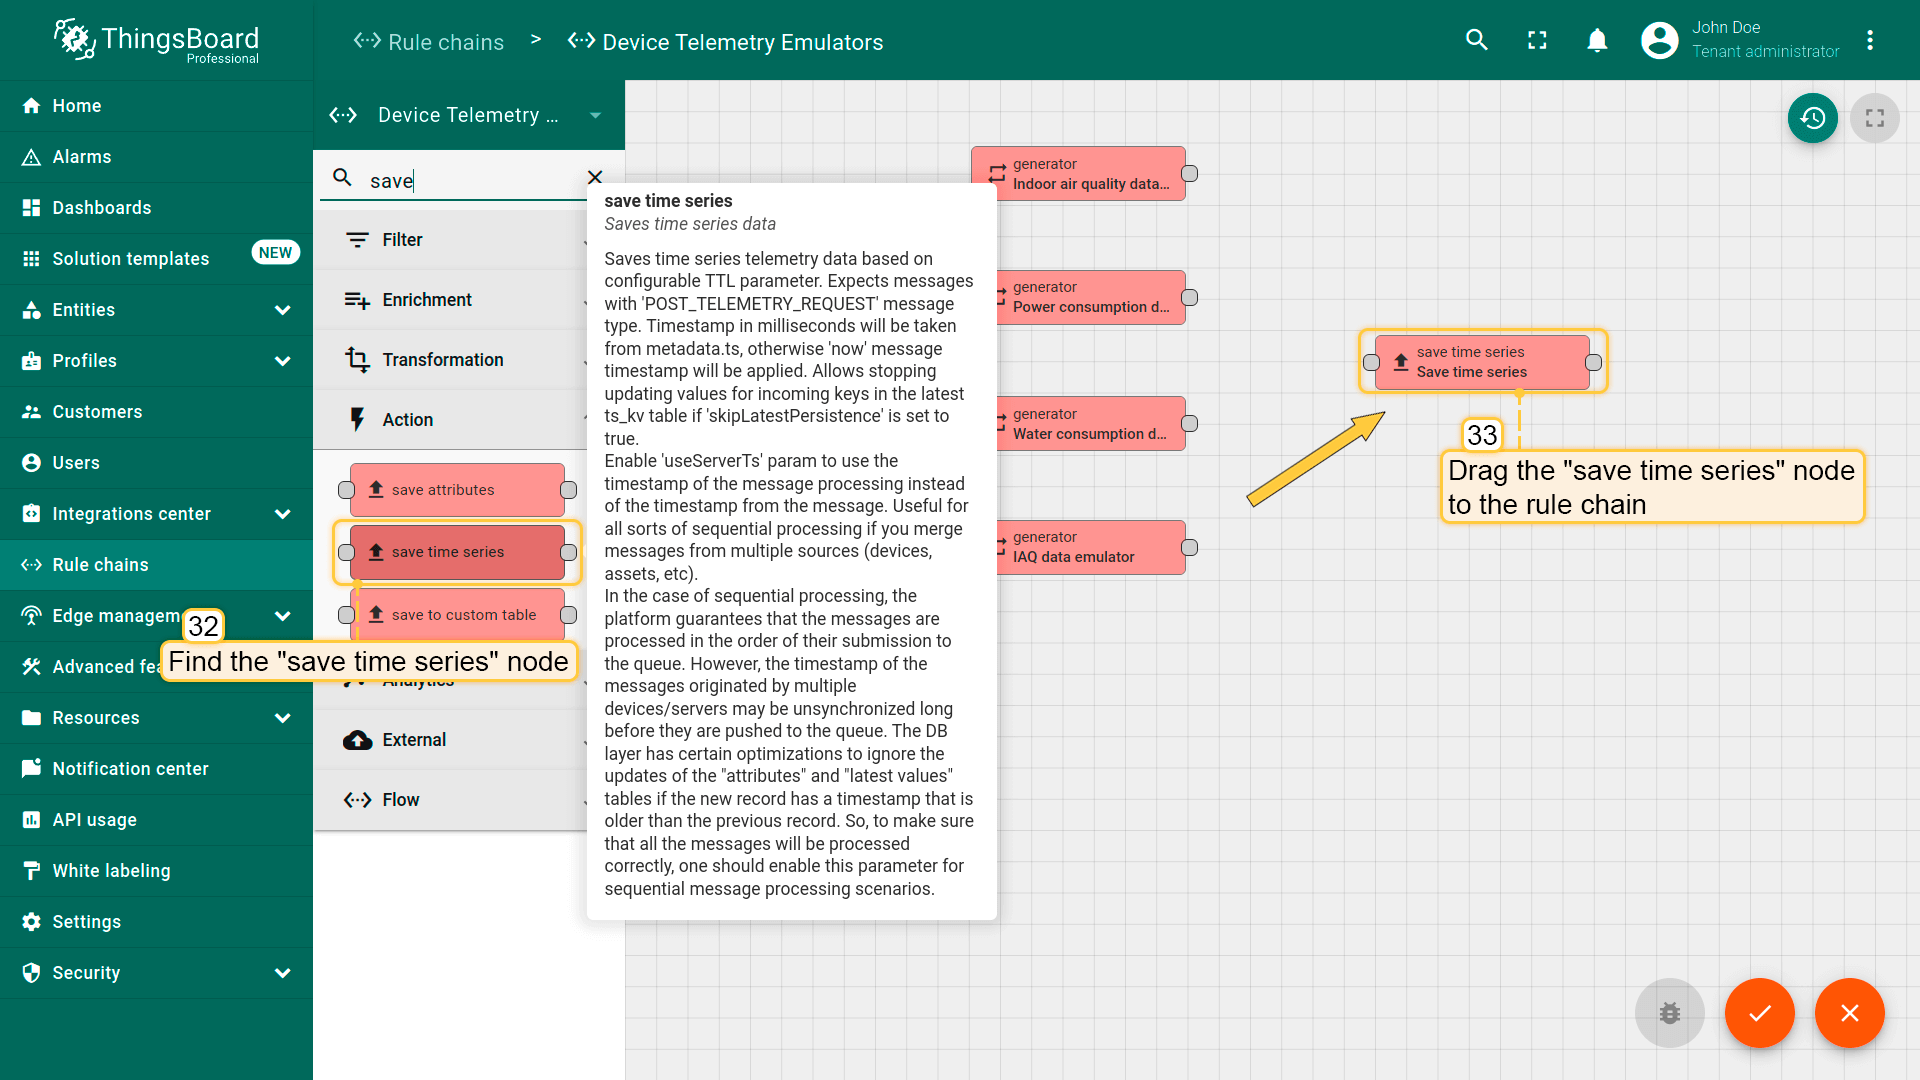
Four generator nodes have been added. Now, we need to route incoming messages from these nodes to the “save time series” node to save time-series data in the database.
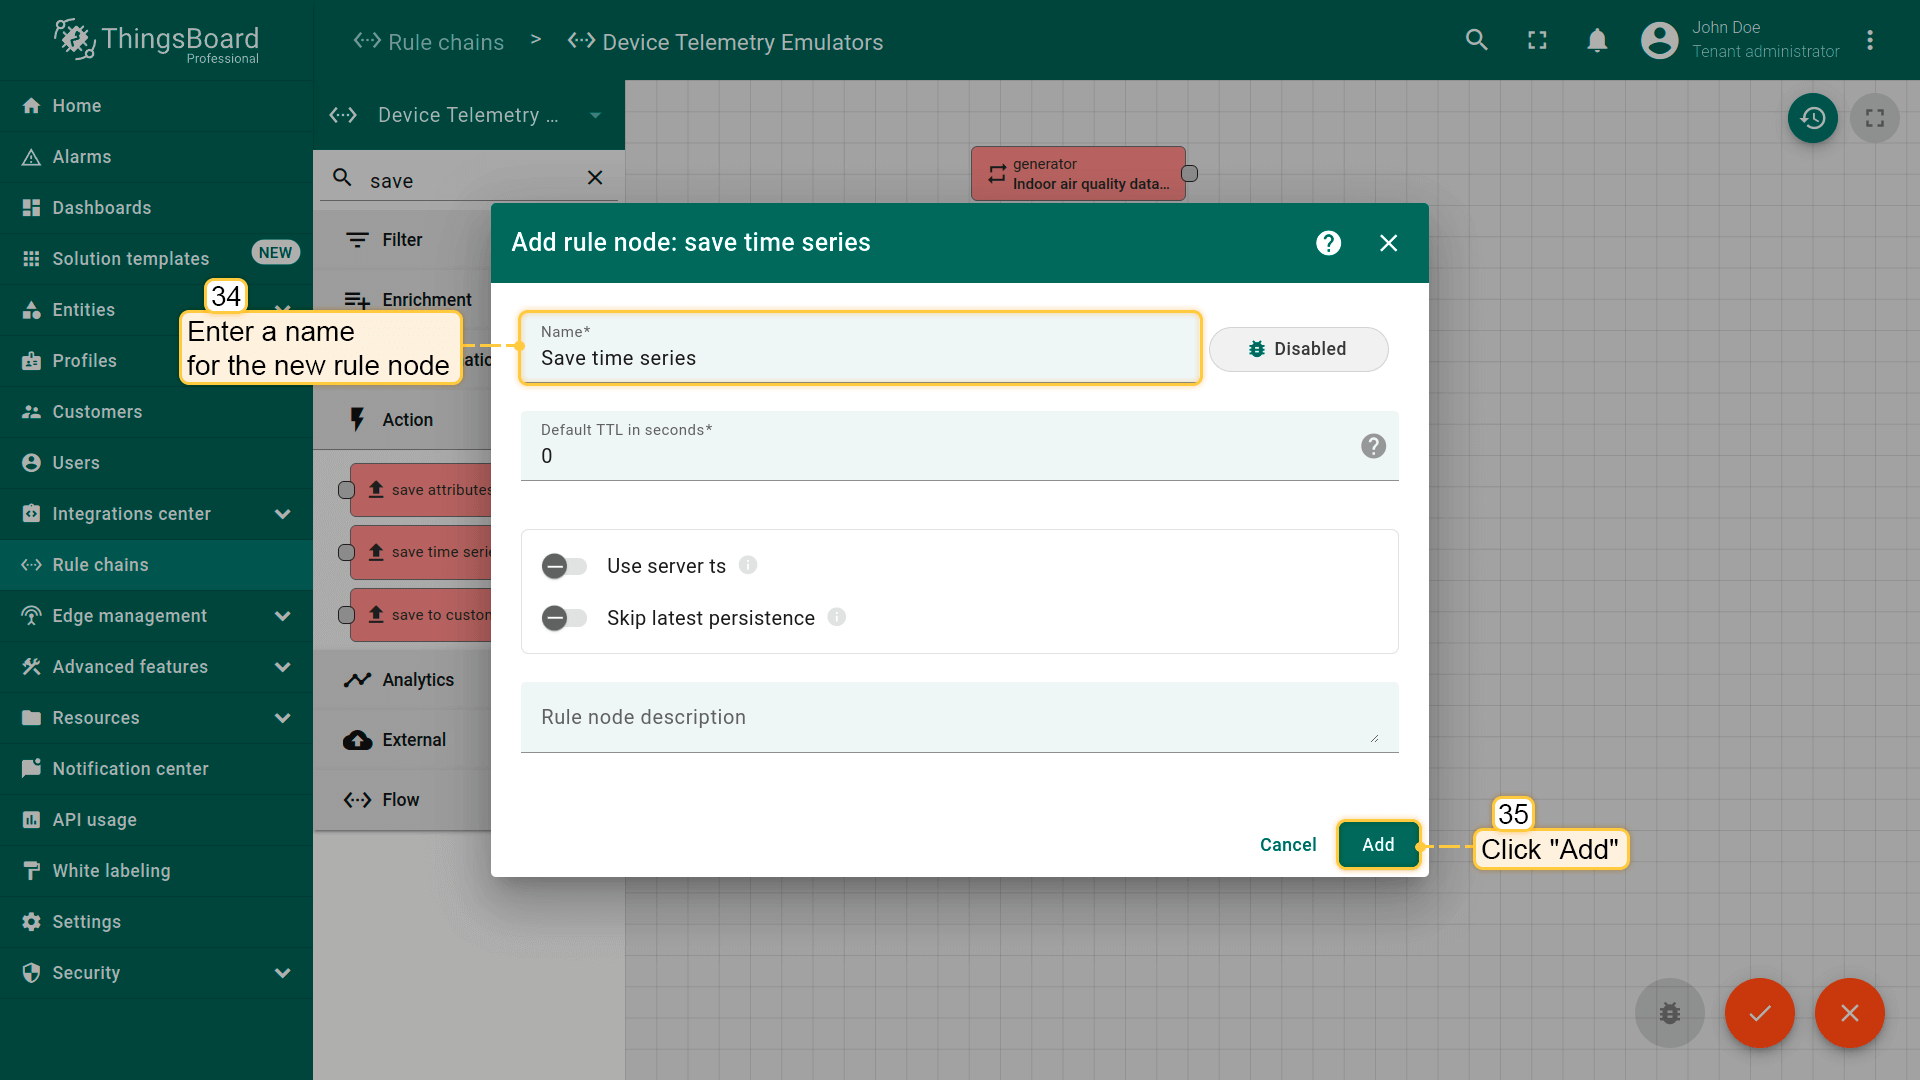
- Find the “save time series” node and drag it to the rule chain;
- Name it “save time series”, and click “Add”.
We have added all the necessary nodes.
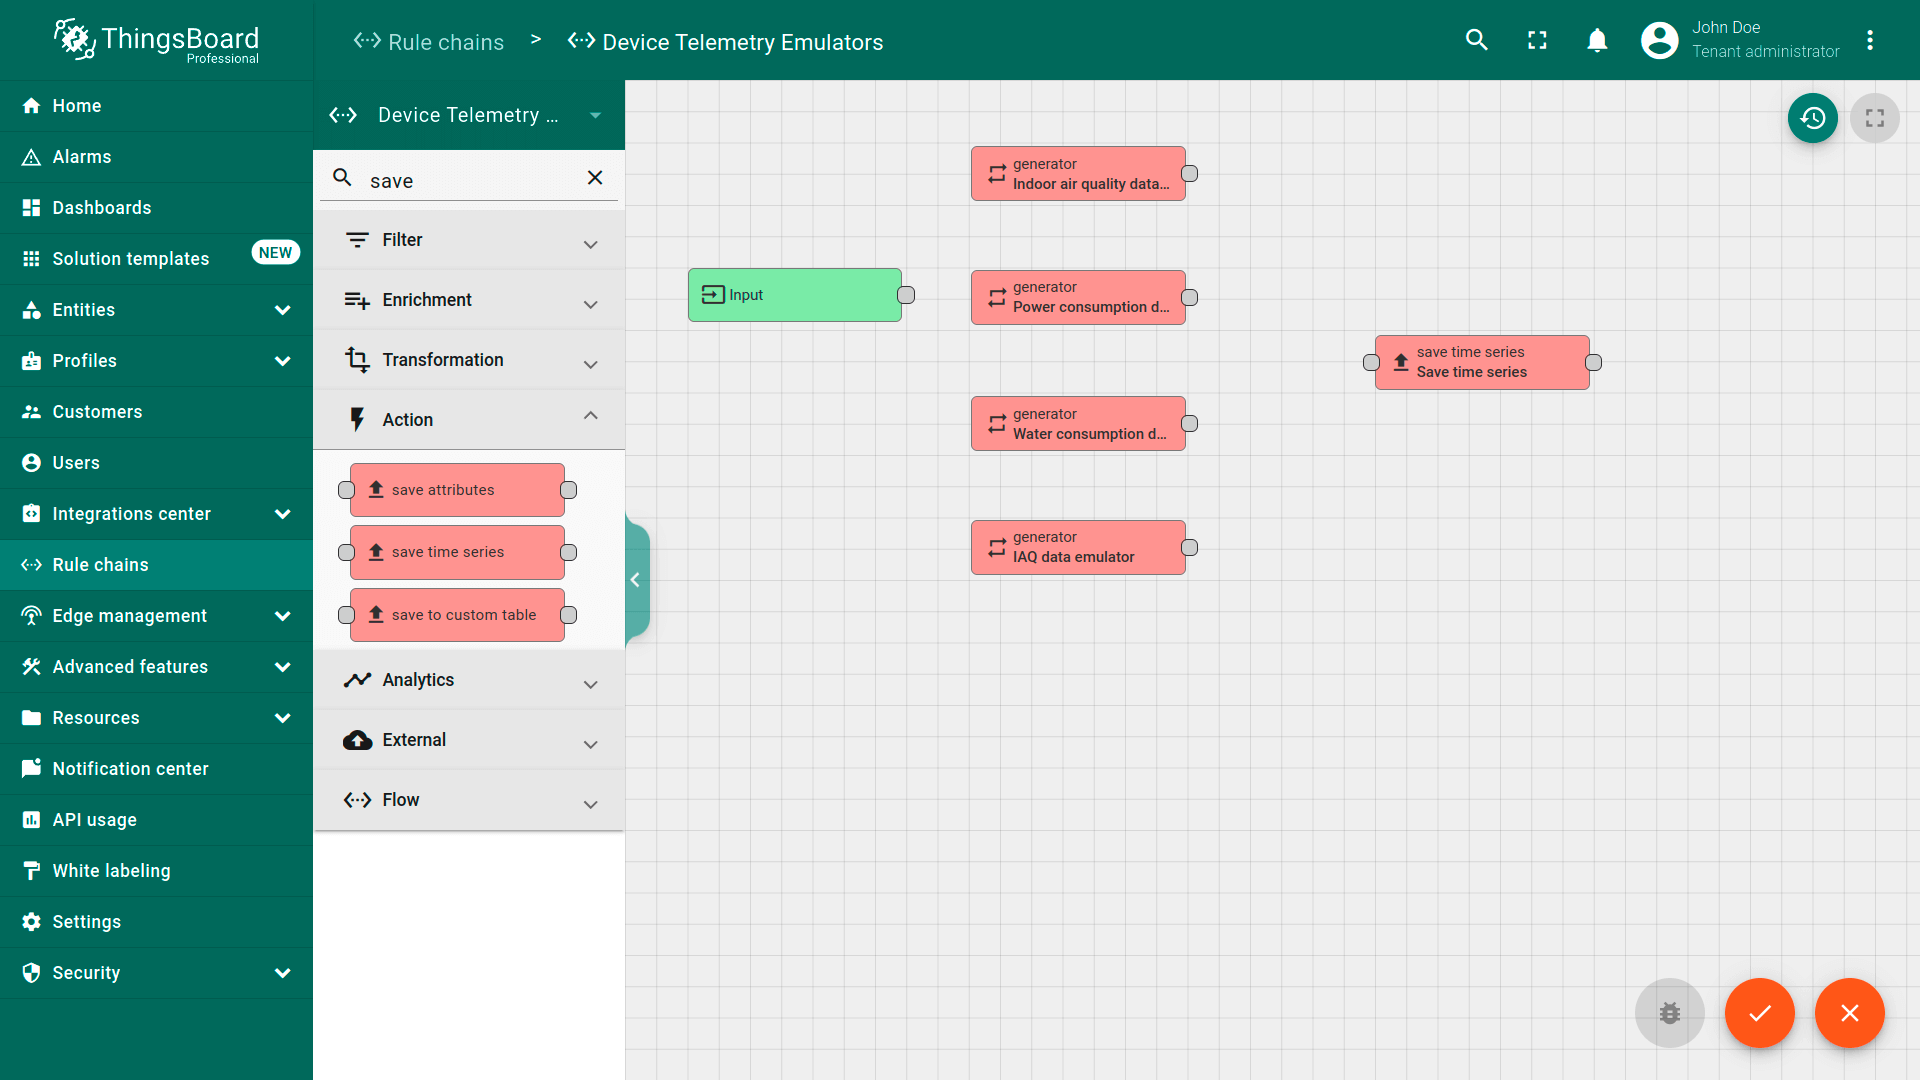
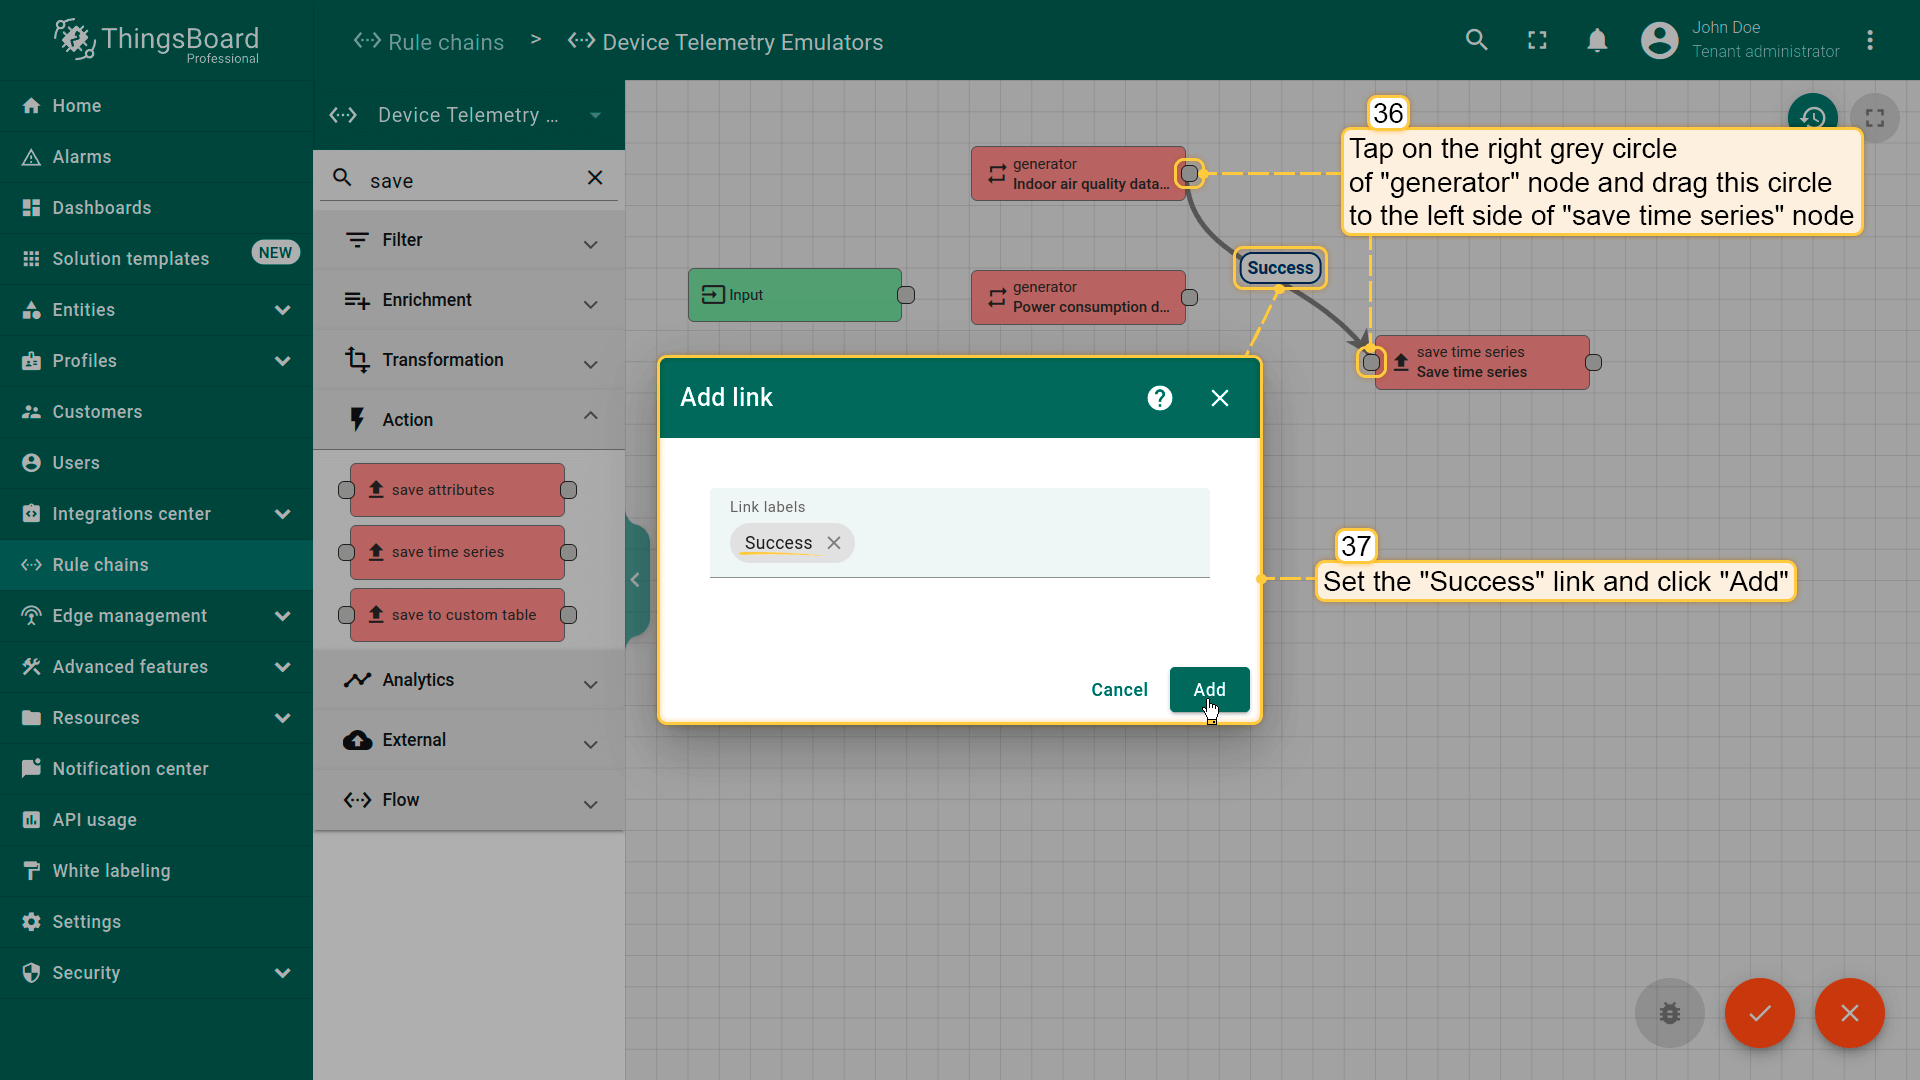
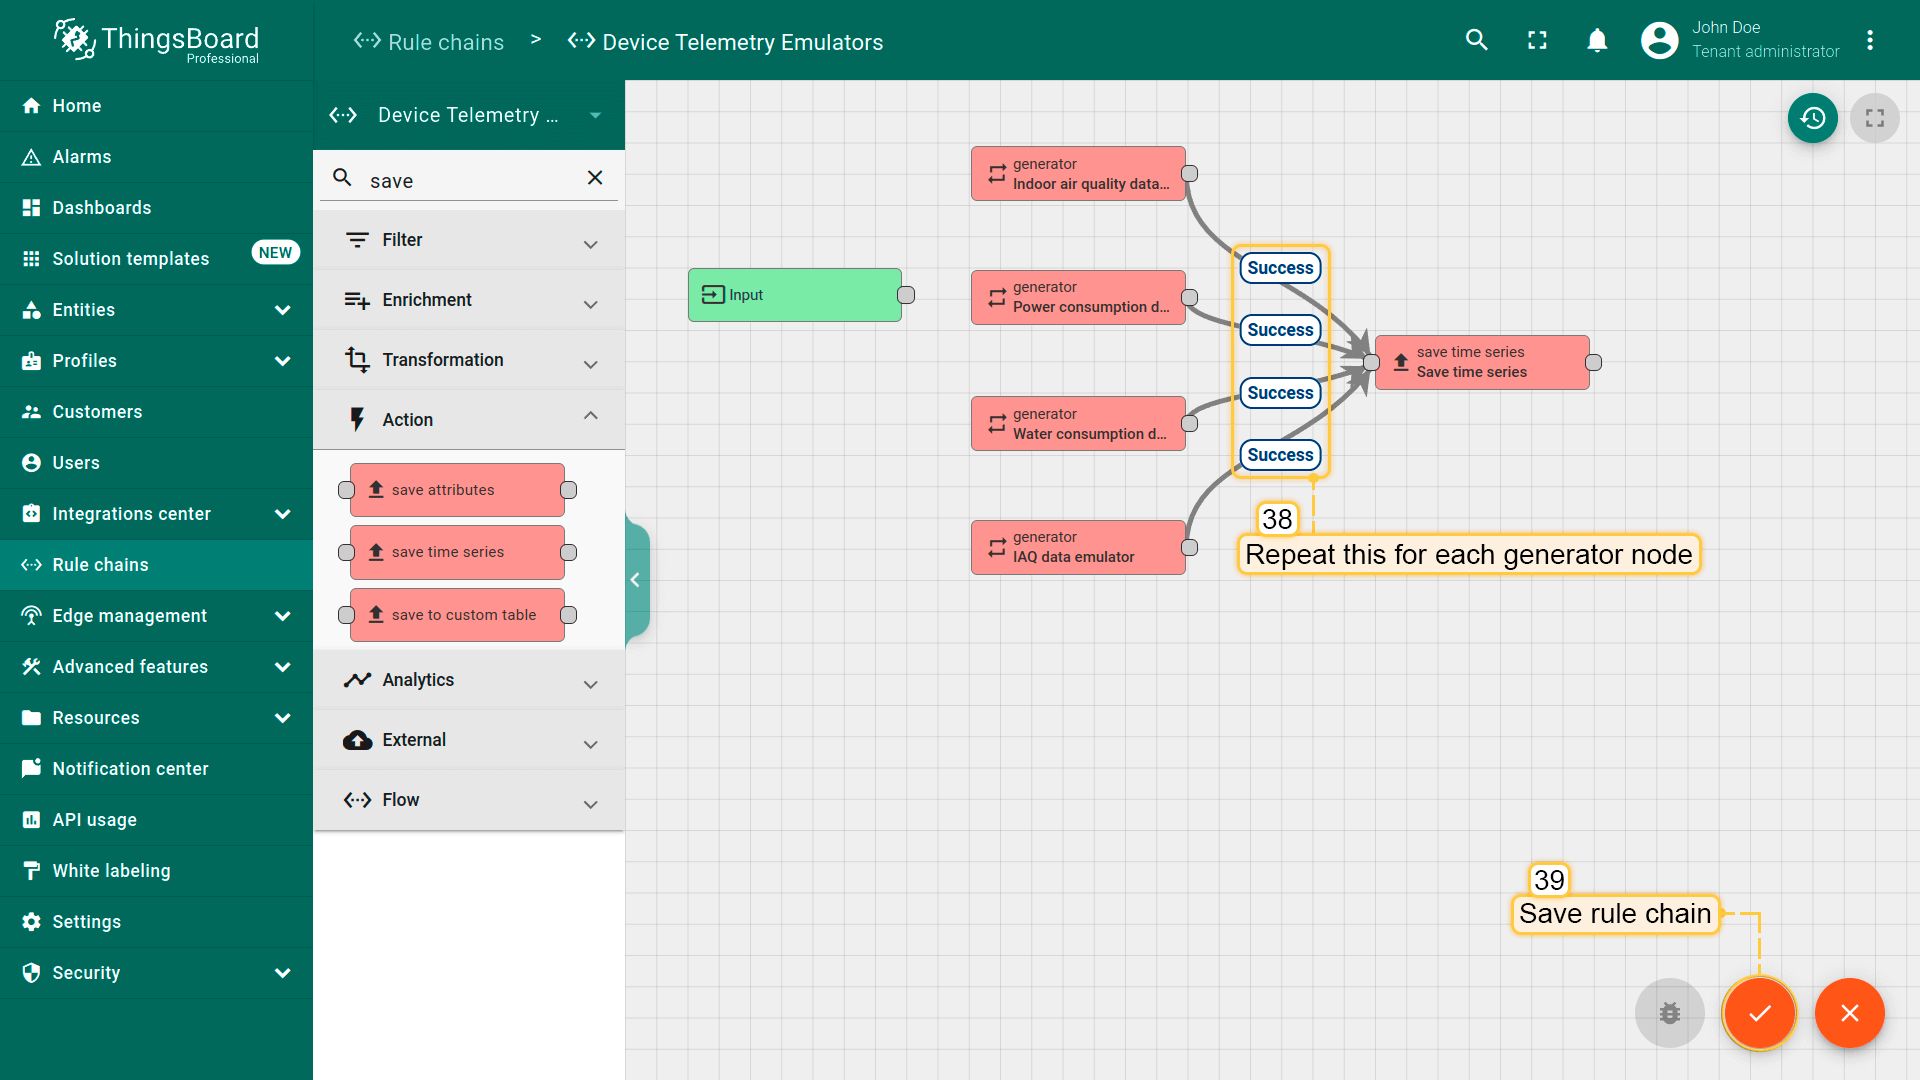
Now, we need to connect the generator nodes to the “save time series” node for message routing:
- 点击「generator」节点右侧的灰色圆圈,将其拖至「save timeseries」节点的左侧。选择「Success」链接并点击「Add」;
- 对每个 generator 节点重复此操作。之后保存规则链。
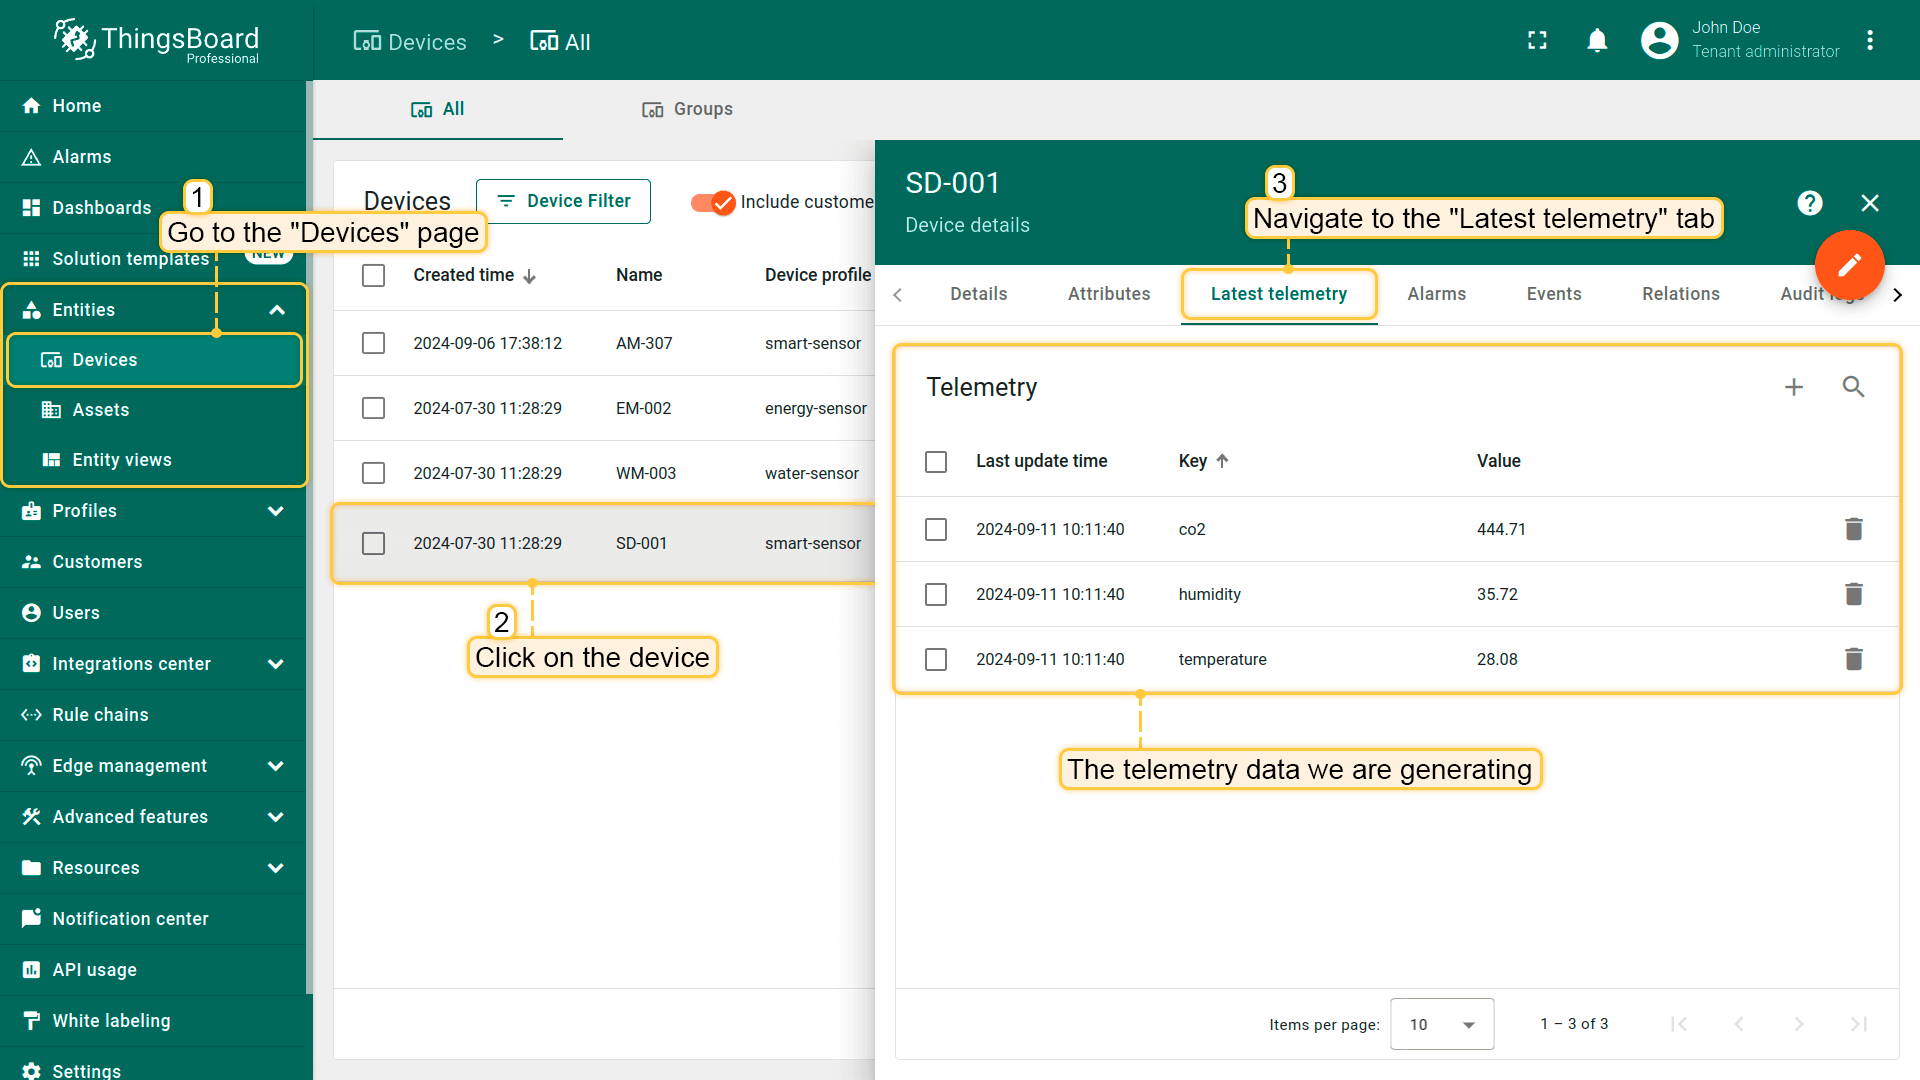
After waiting for the period specified in the generator nodes, you will be able to see the telemetry on the “Latest telemetry” tab of your devices.
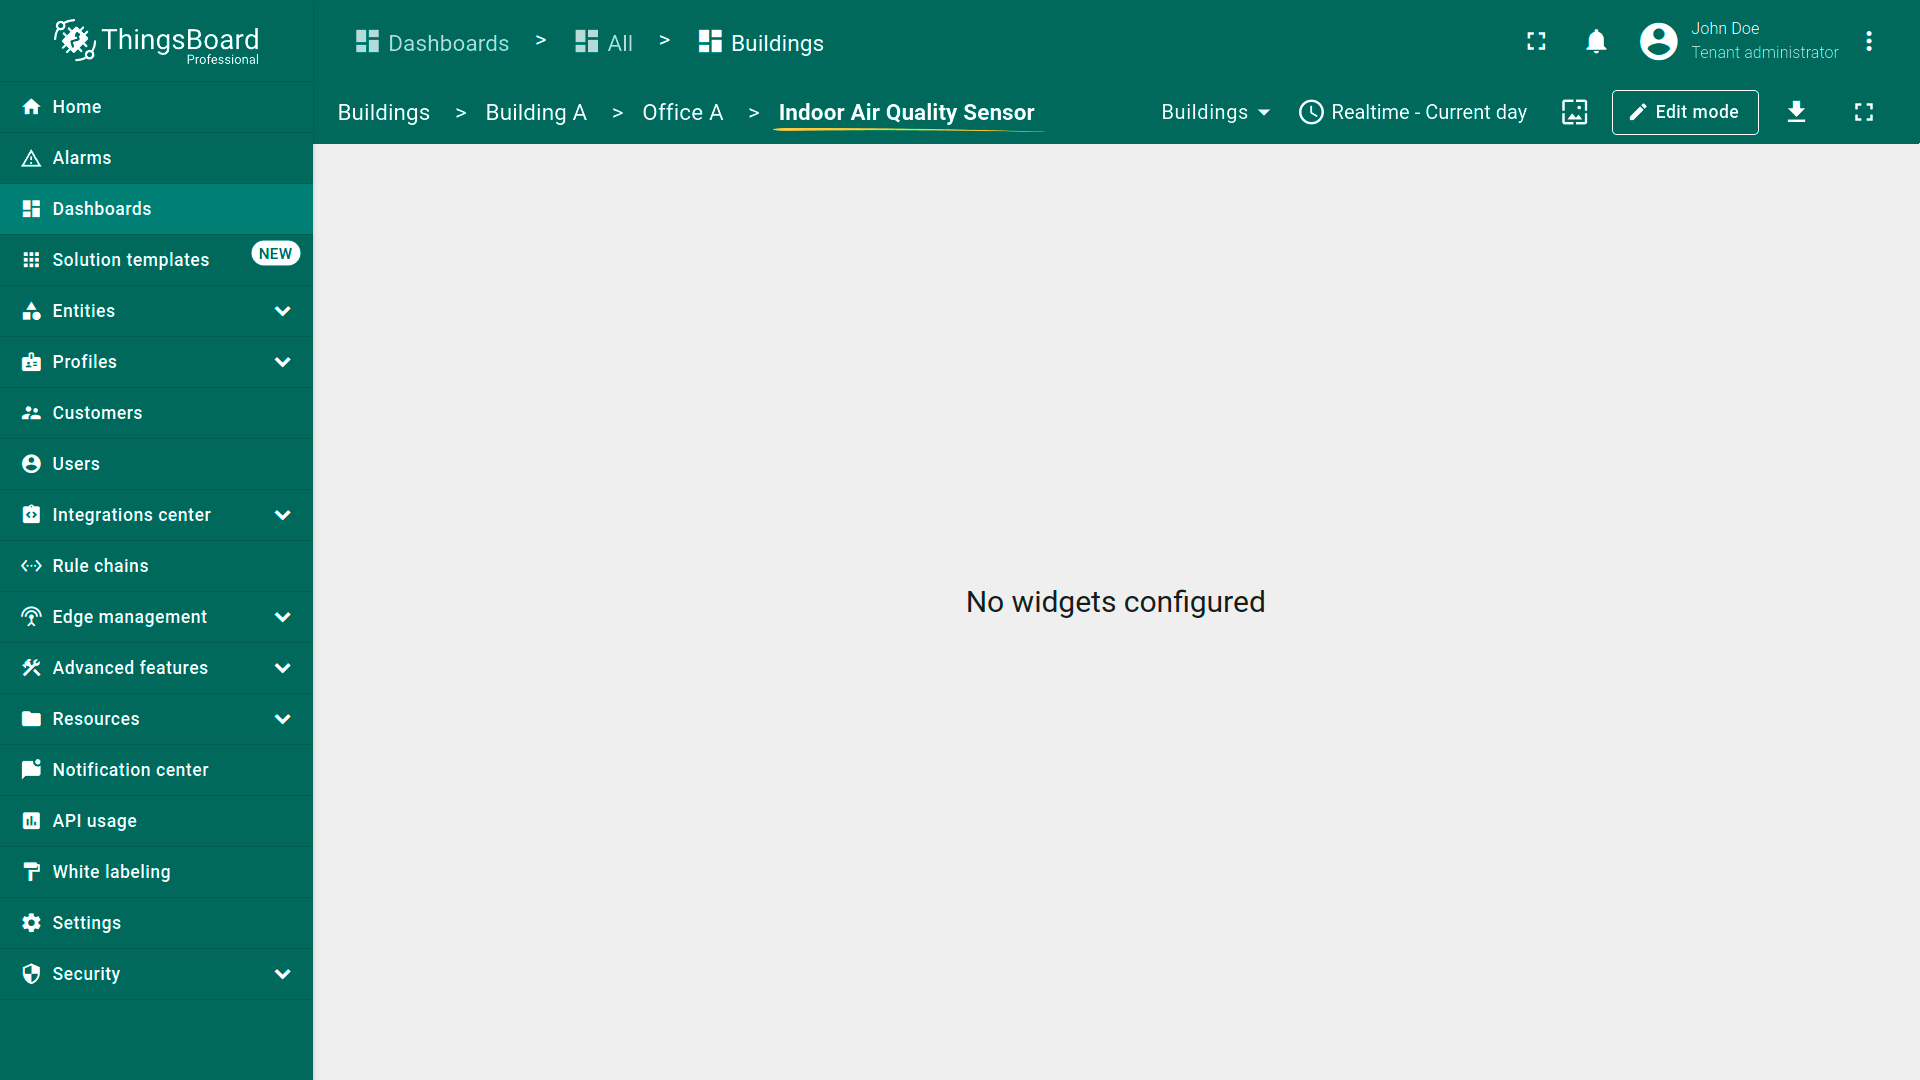
Displaying devices telemetry in Office sensors list widget
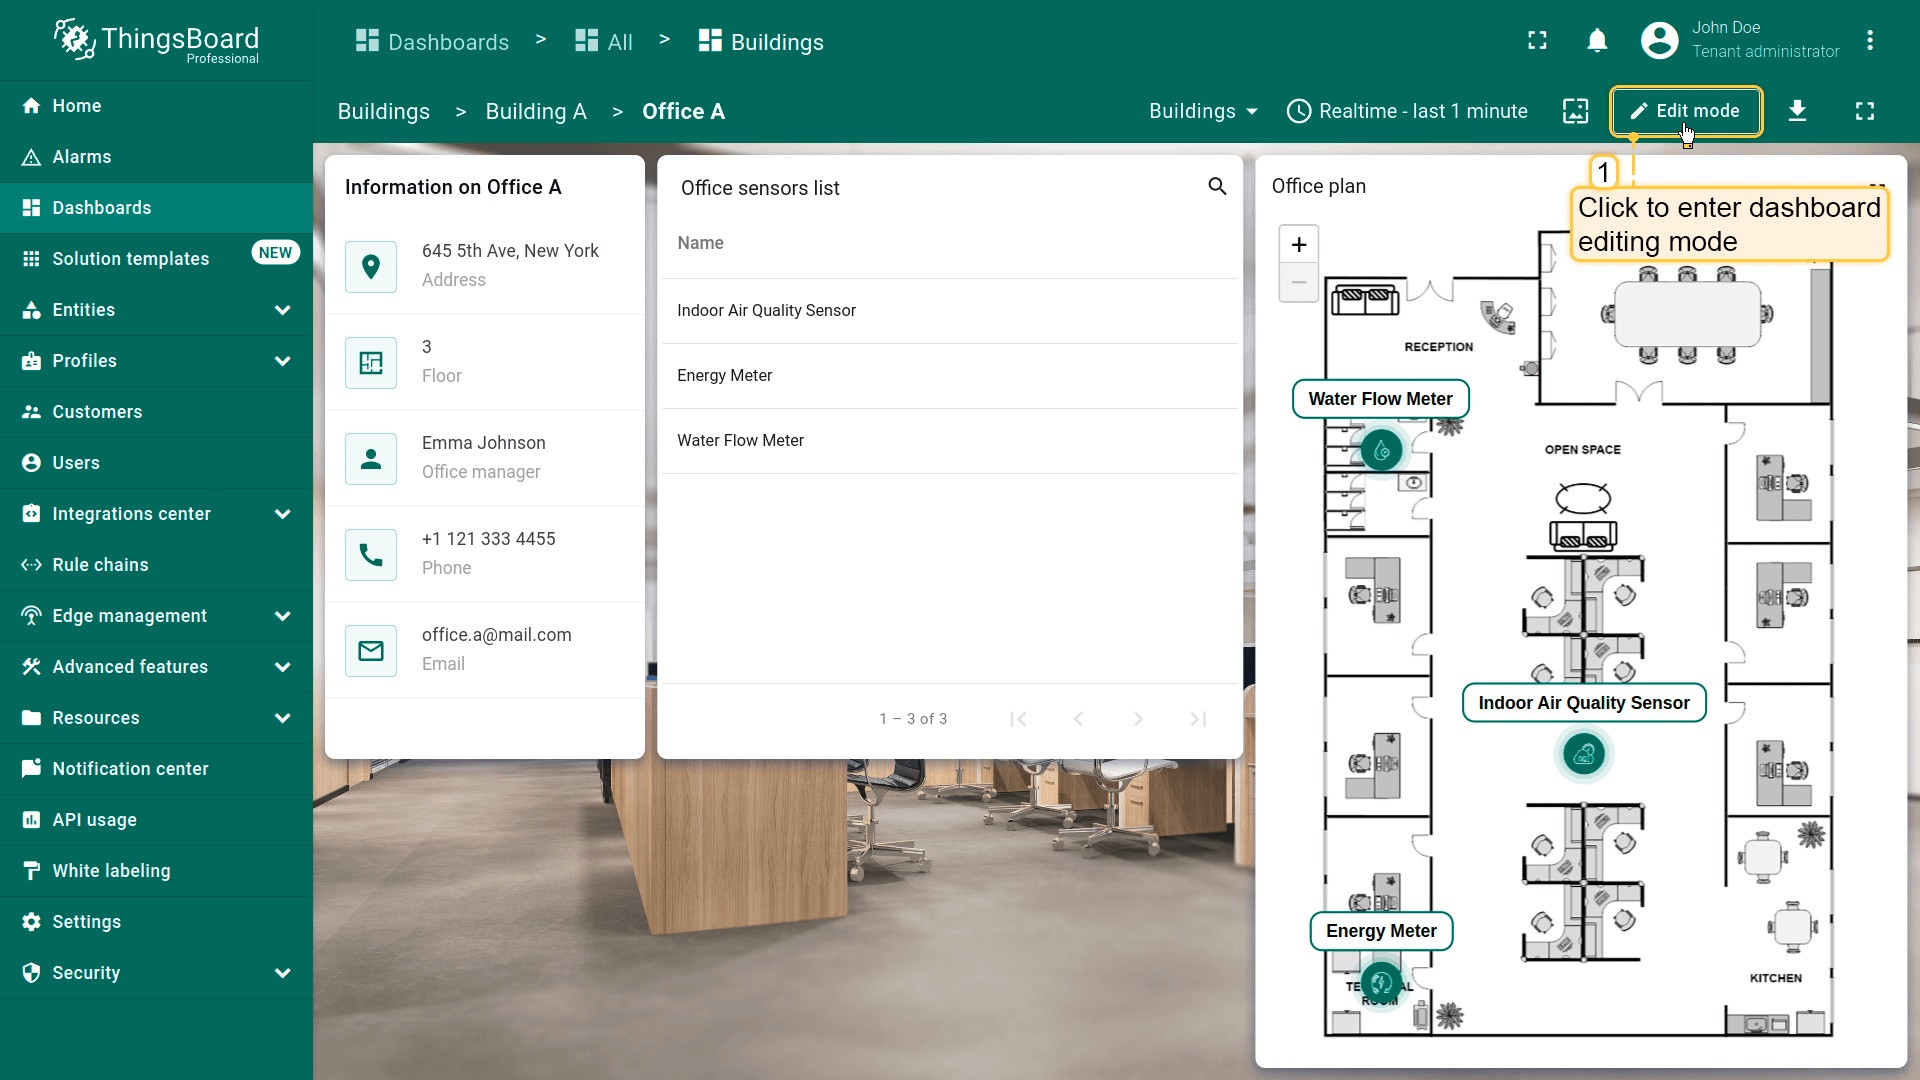
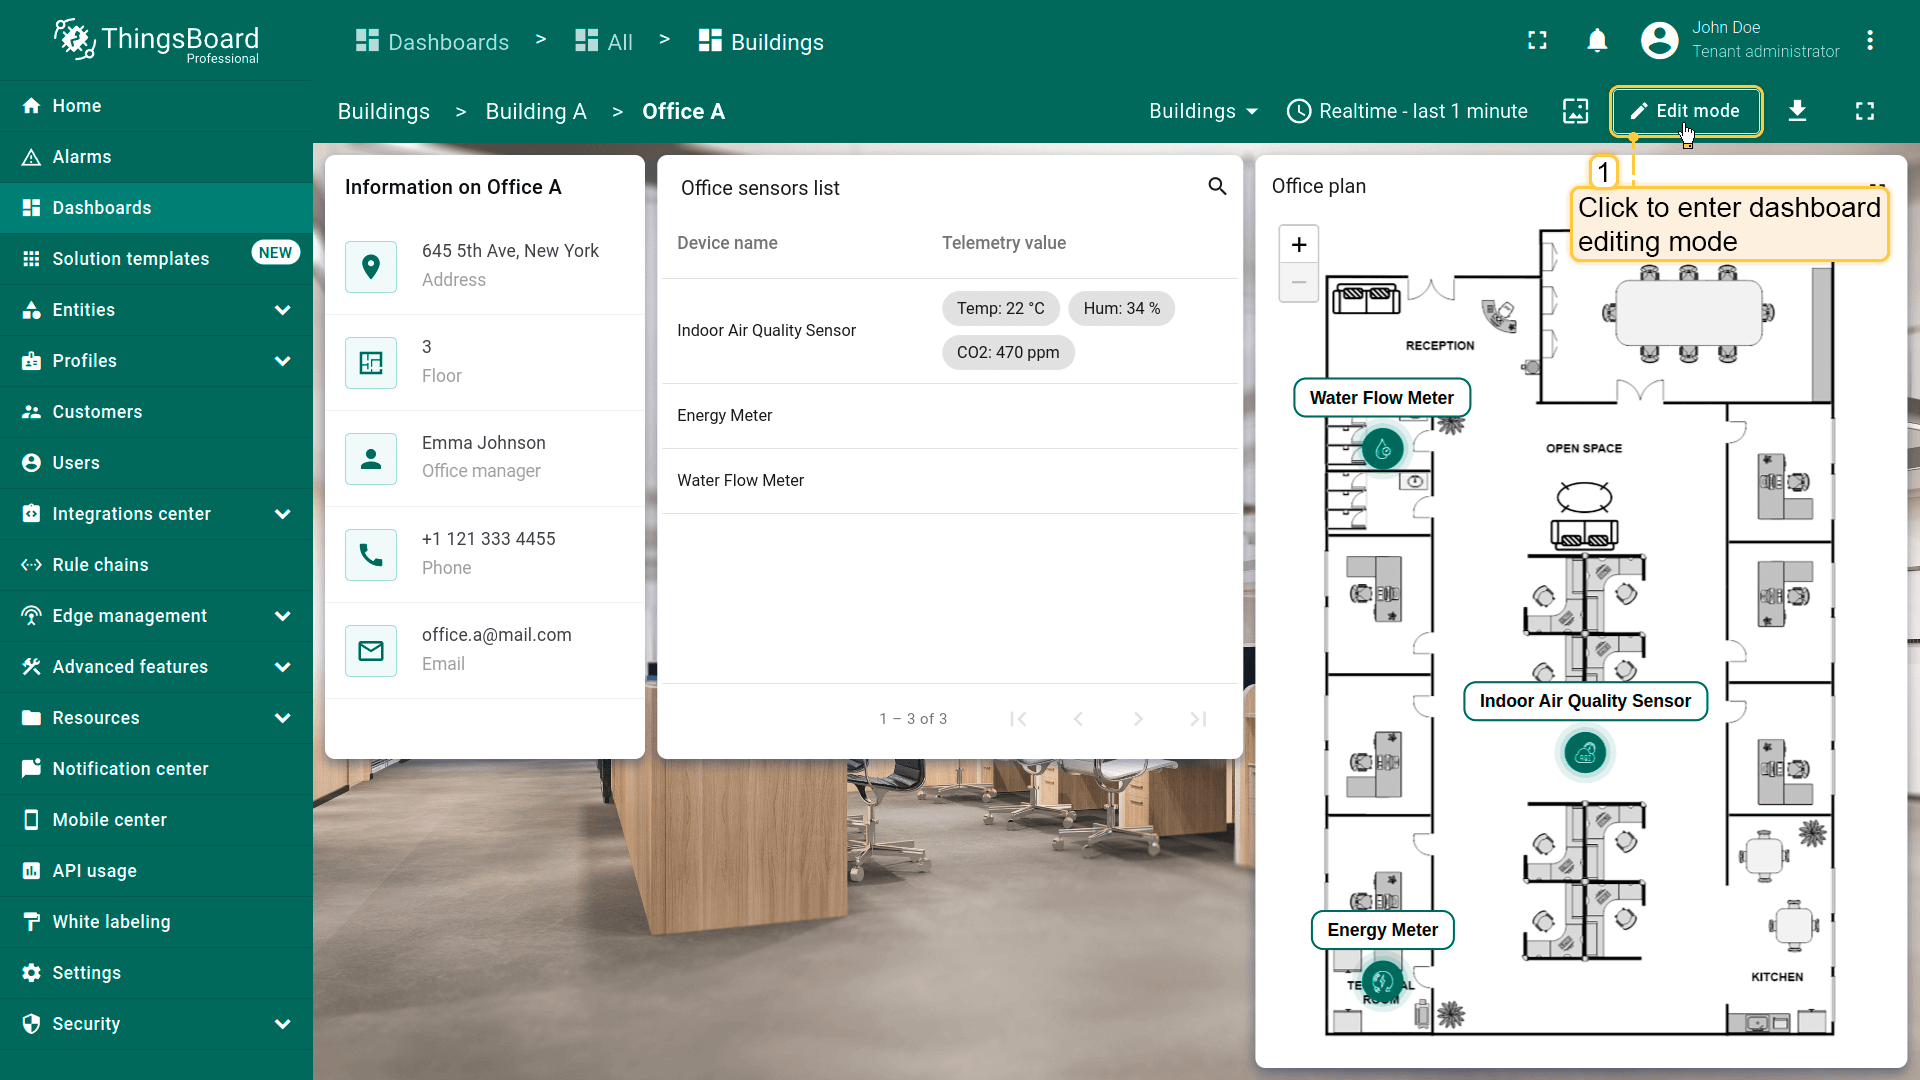
Now that we are receiving telemetry data from the devices, we can display it on the “Office sensors list” widget.
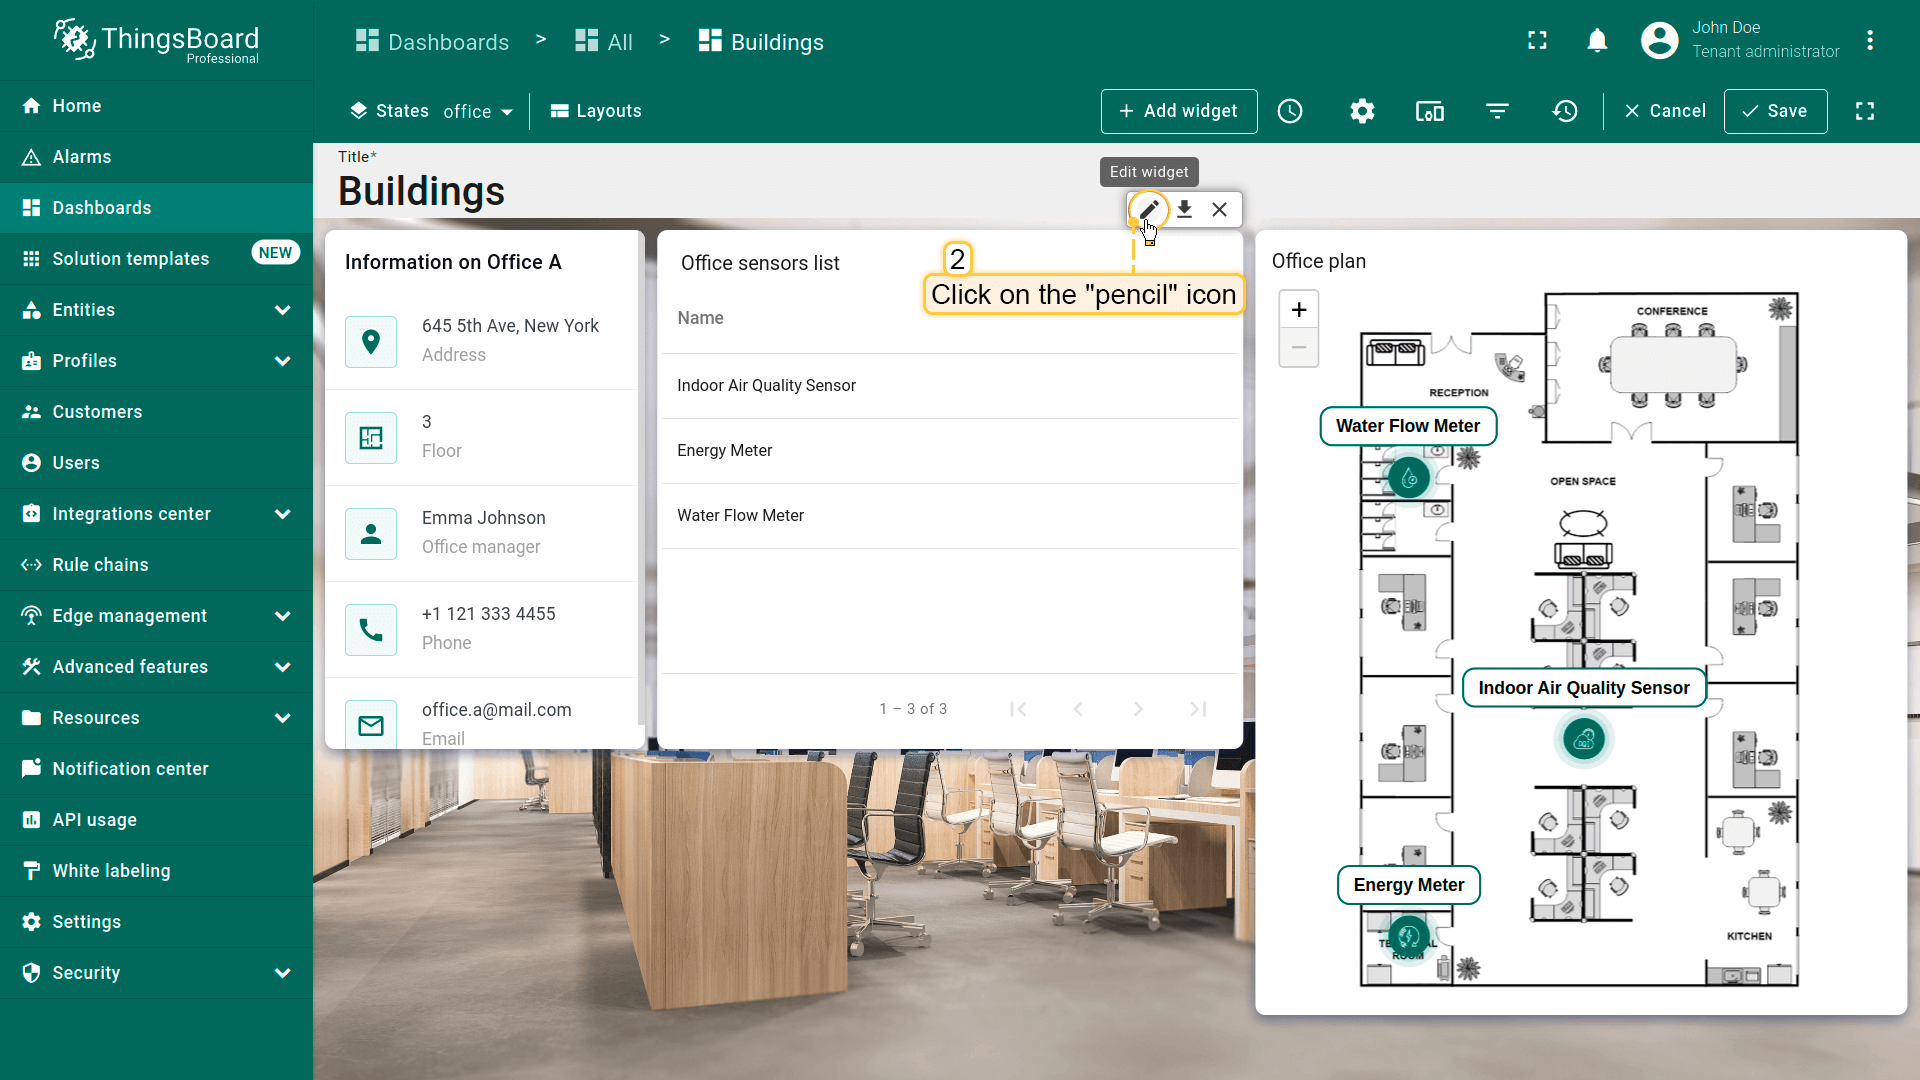
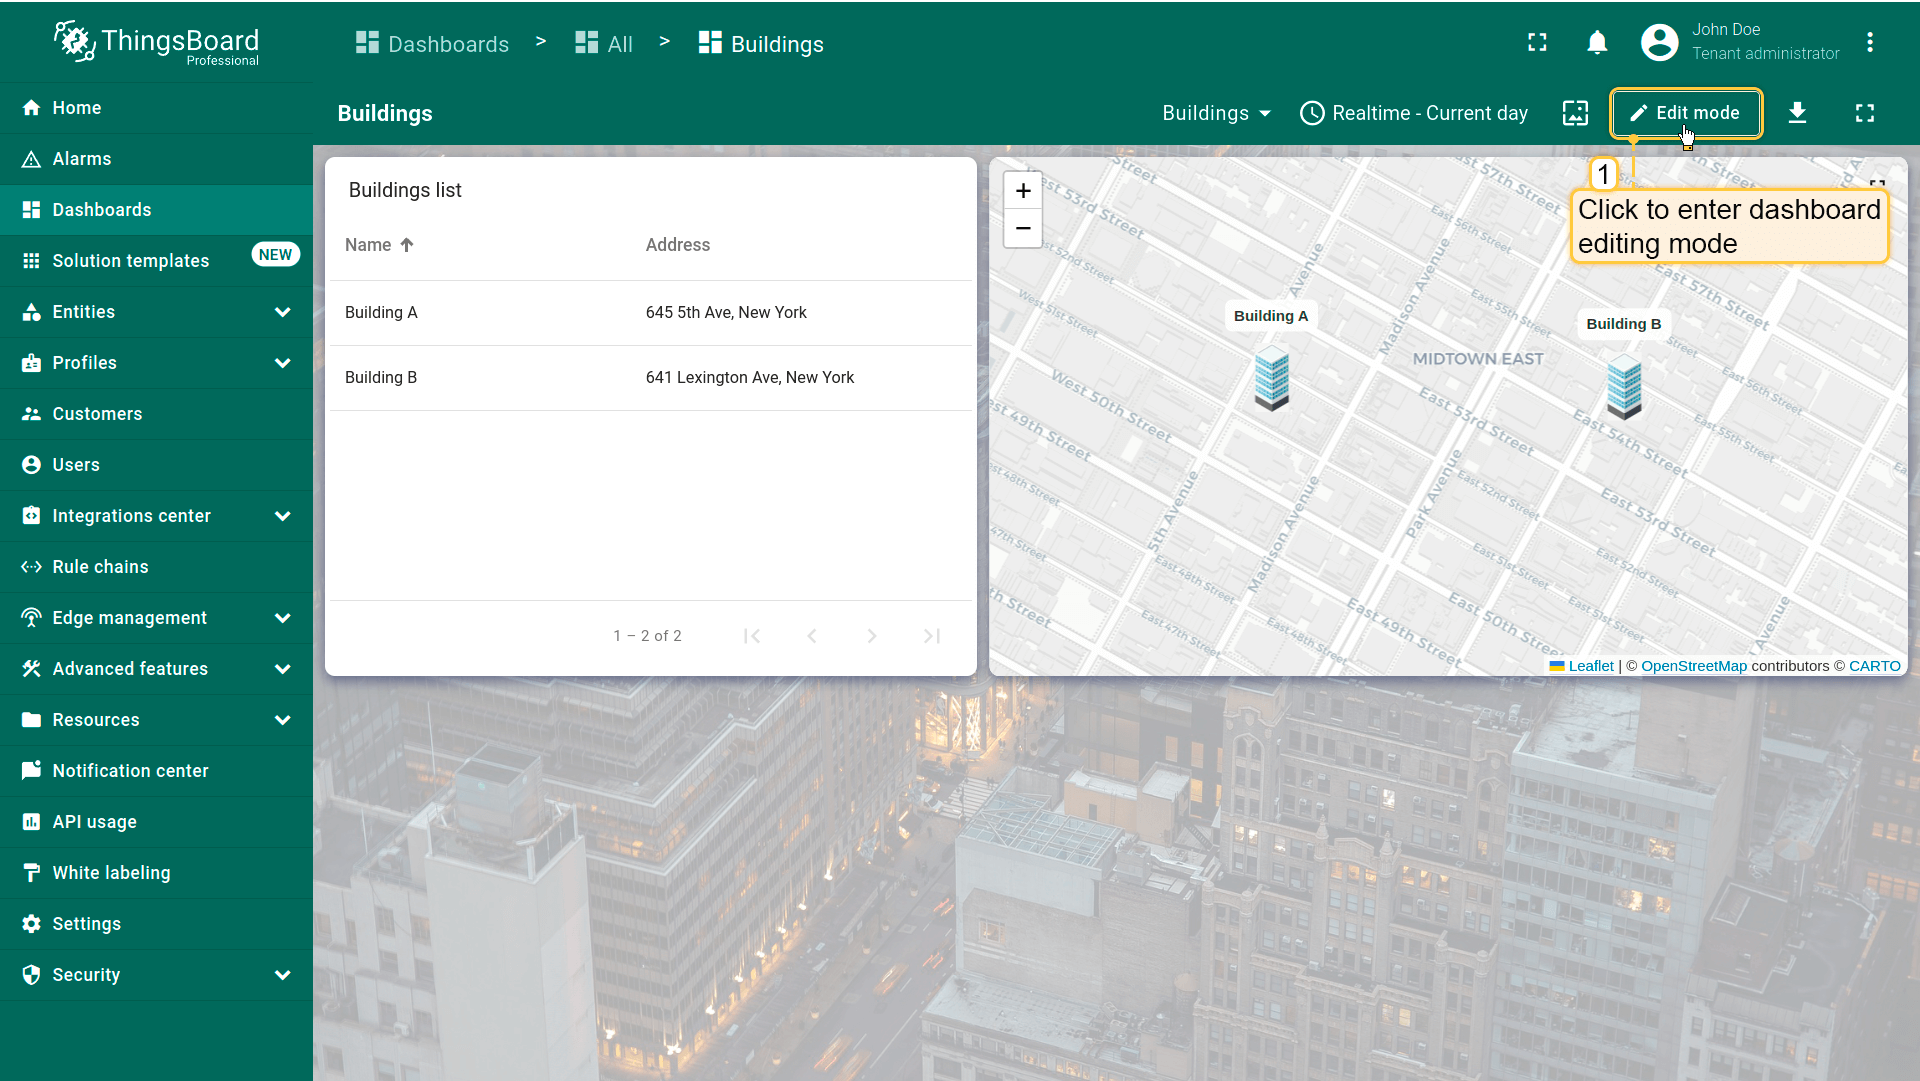
- 进入仪表板,点击工具栏上的「Edit mode」按钮进入编辑模式;
- 点击「办公室传感器列表」部件的「铅笔」图标进入其编辑模式;
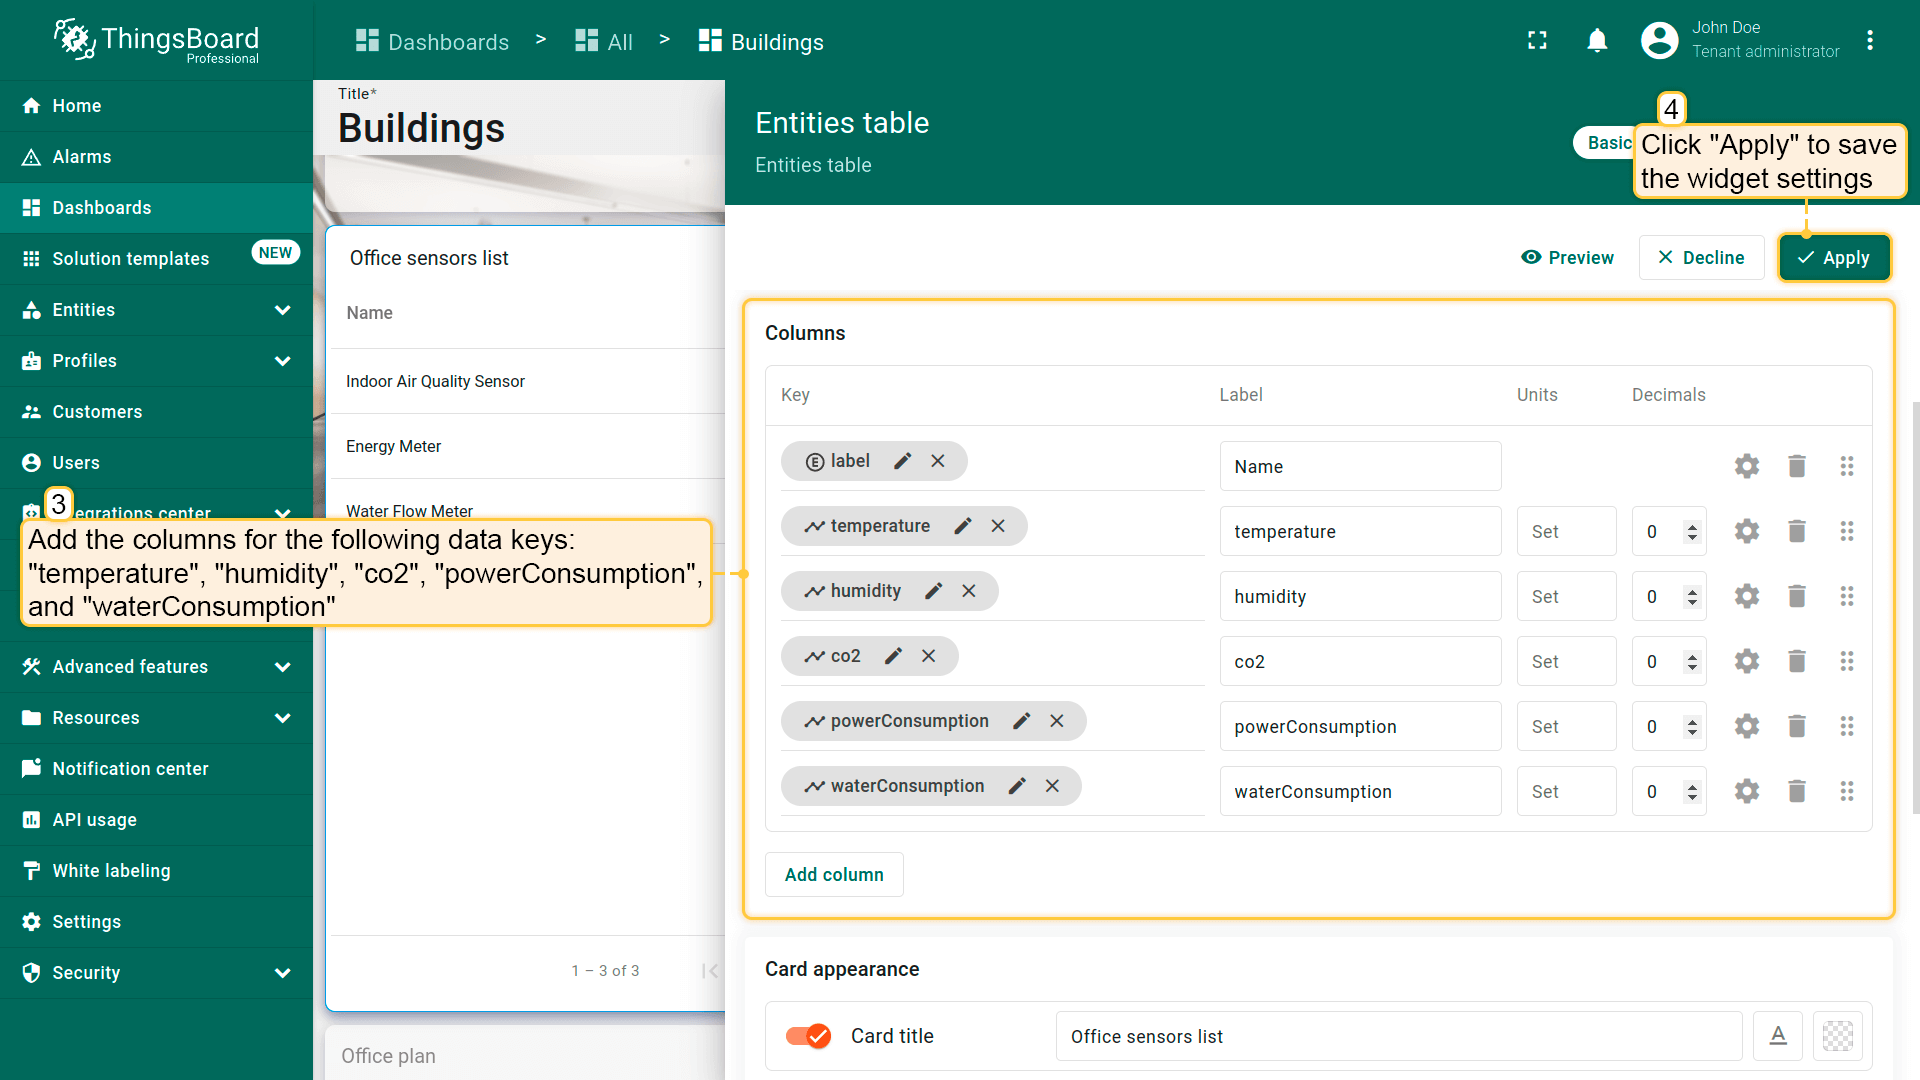
- 添加以下数据键对应的列:「temperature」「humidity」「co2」「powerConsumption」「waterConsumption」。然后对部件应用更改;
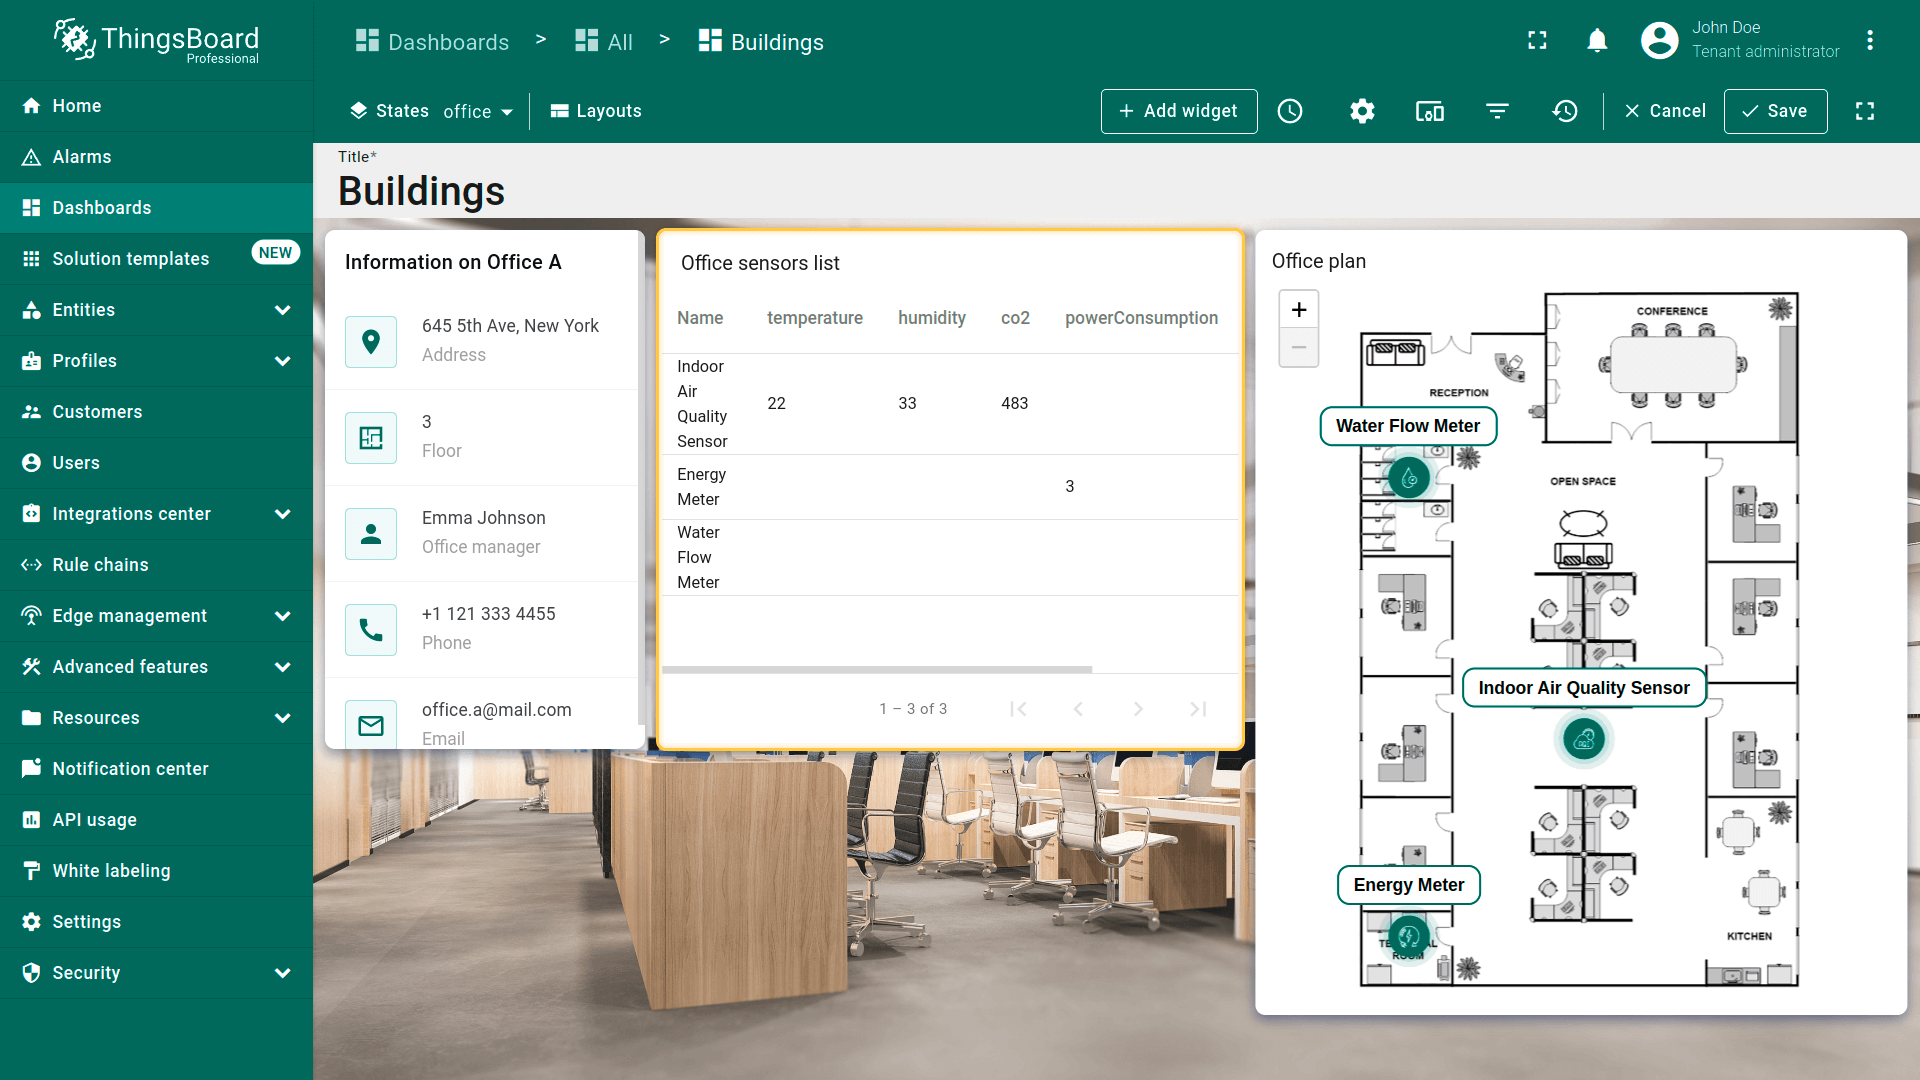
- 现在表格显示设备的遥测数据。
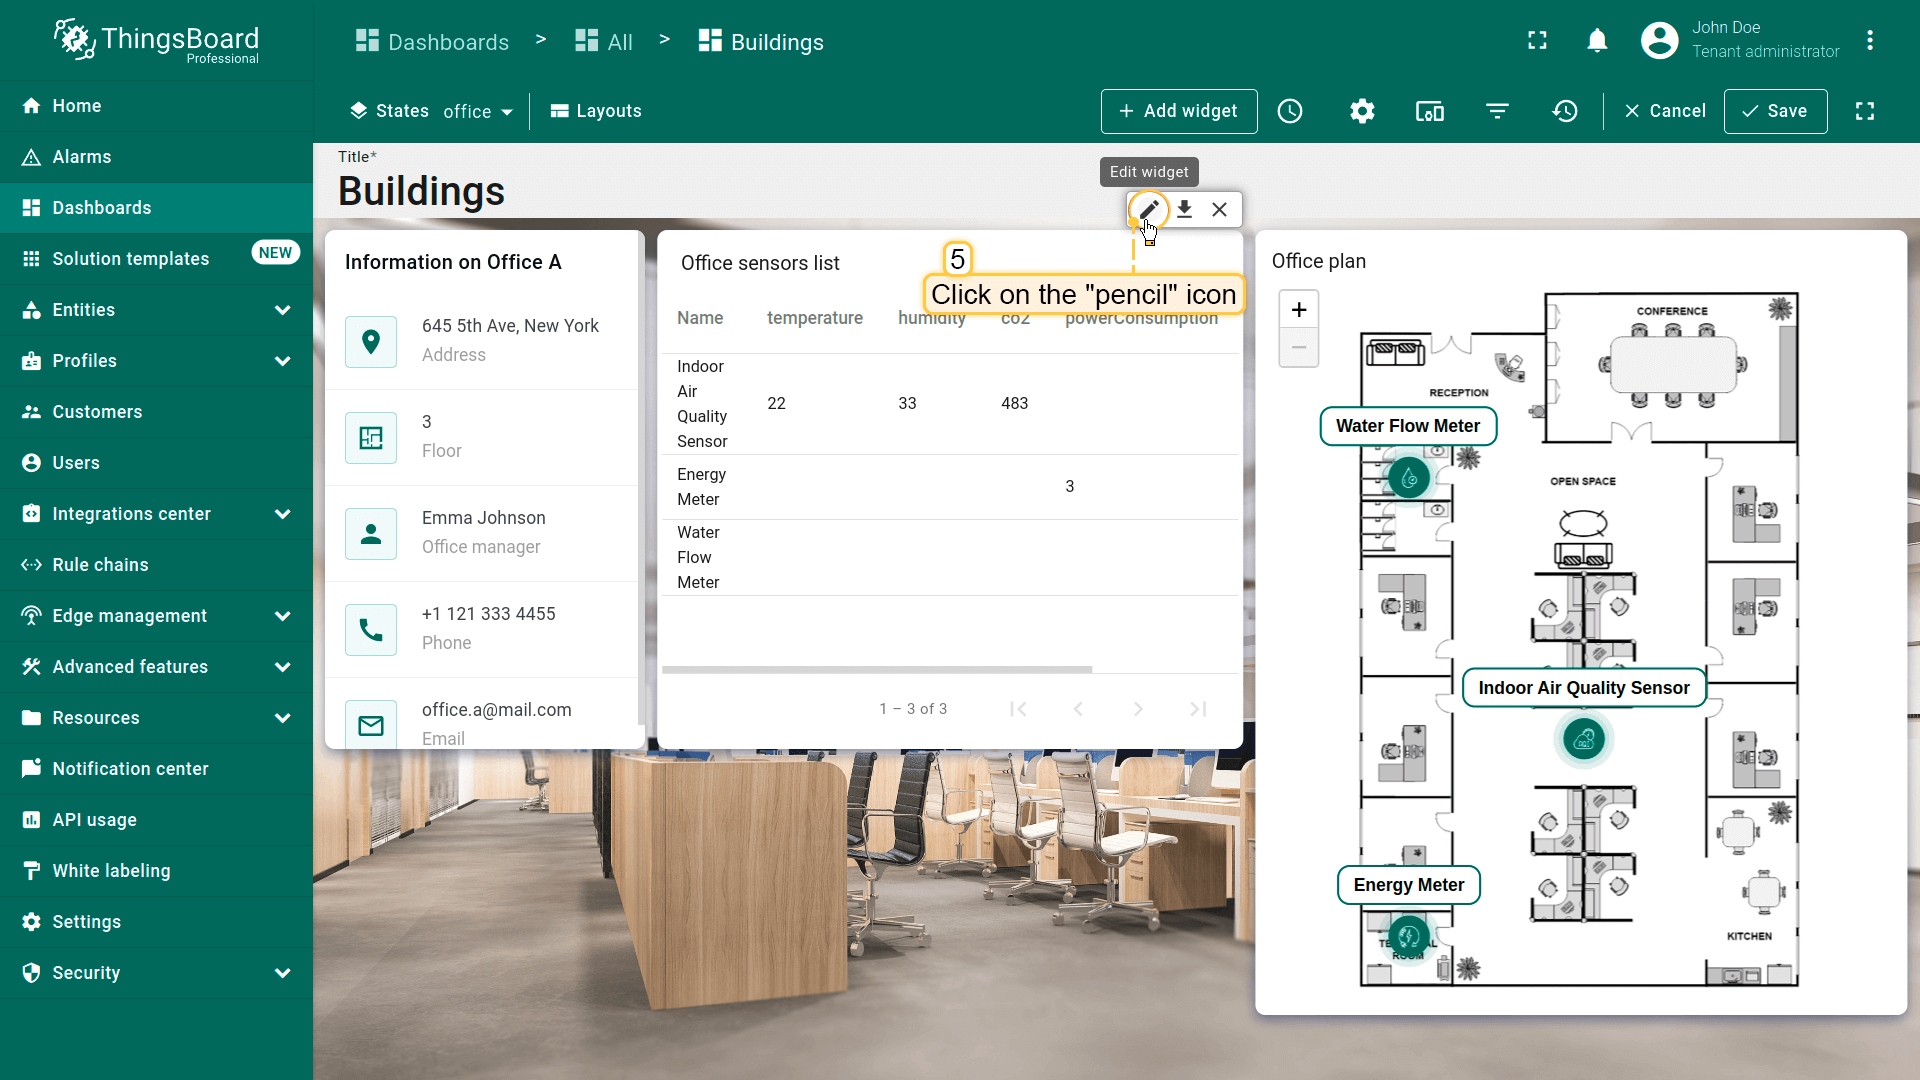
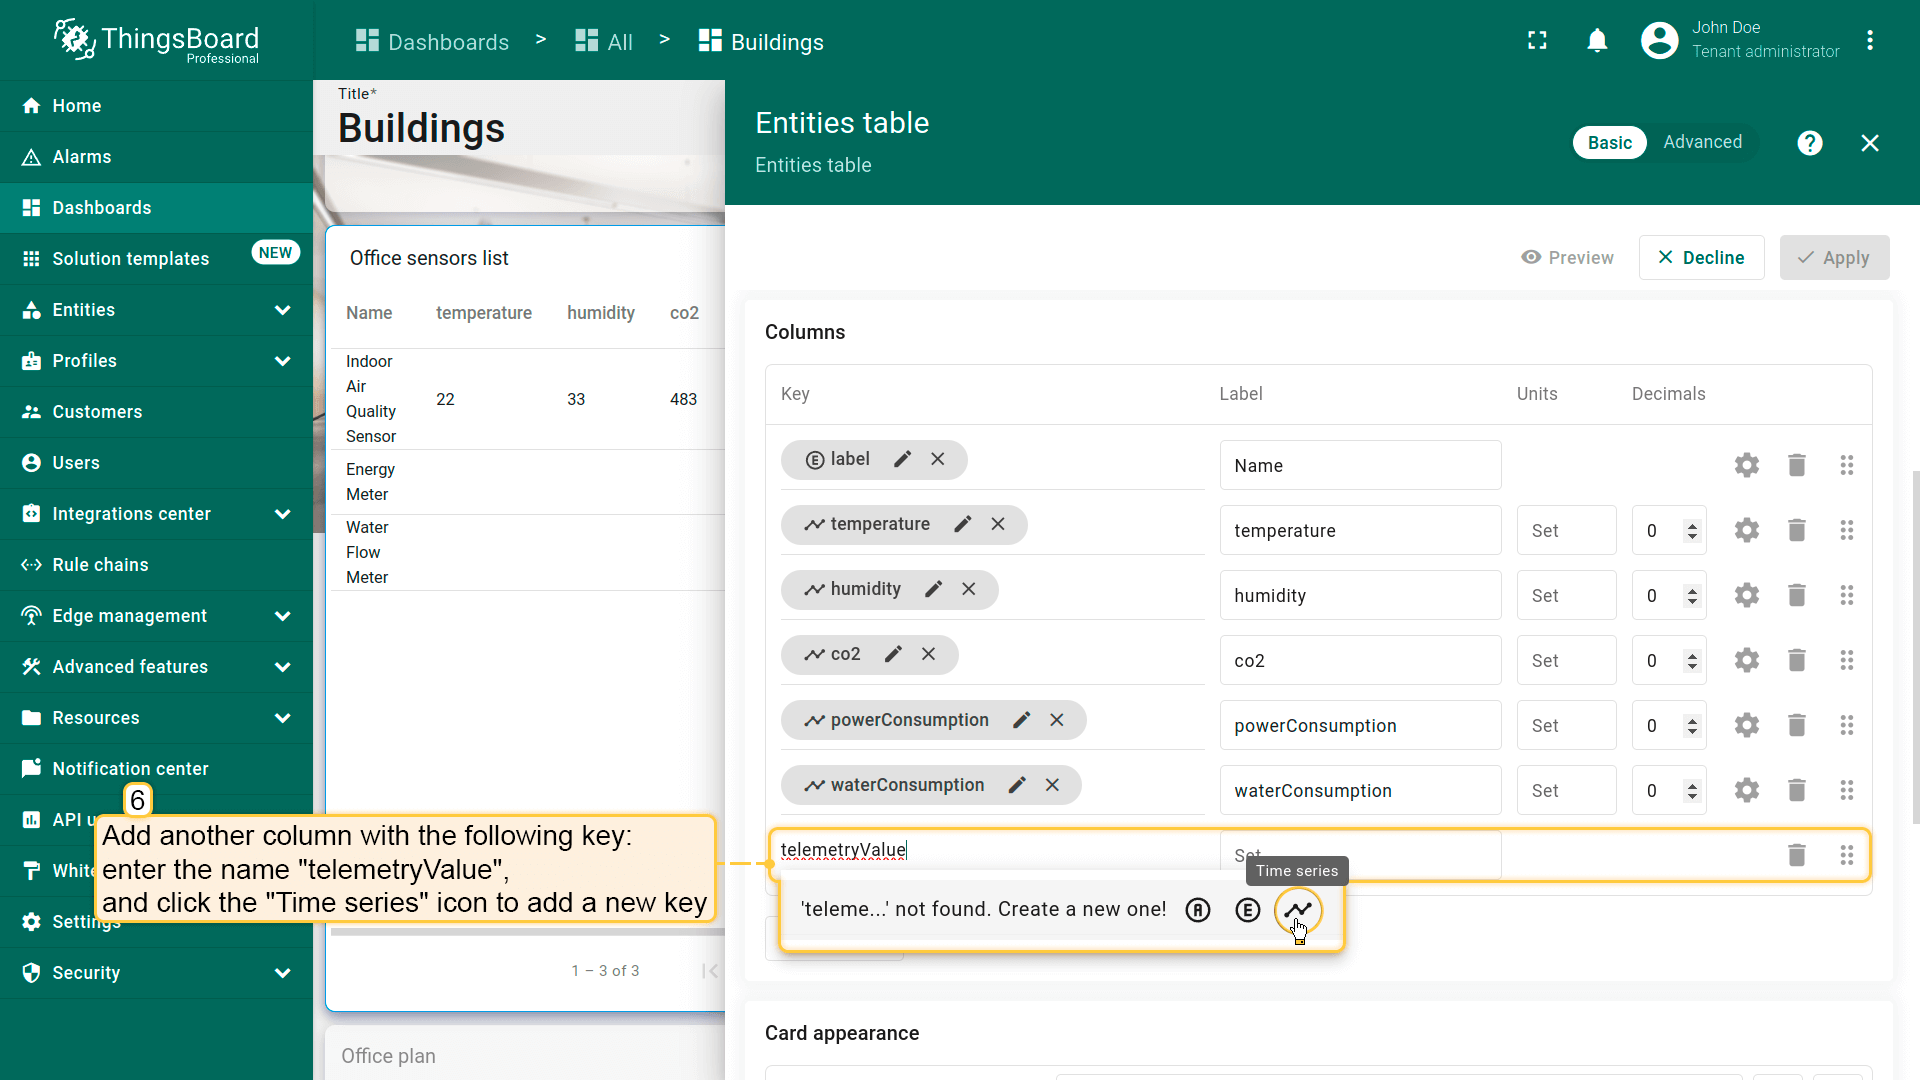
Devices can send multiple telemetry values. For example, an Indoor Air Quality Sensor sends values of temperature, humidity, and CO2 level. By default, each telemetry value (key) is represented as a separate column in the table widget. However, this layout might not be the most convenient for viewing. Let's combine the telemetry values for a device that transmits multiple readings into a single column for a cleaner appearance and hide unnecessary columns.
- 点击铅笔图标再次进入「办公室传感器列表」部件的编辑模式;
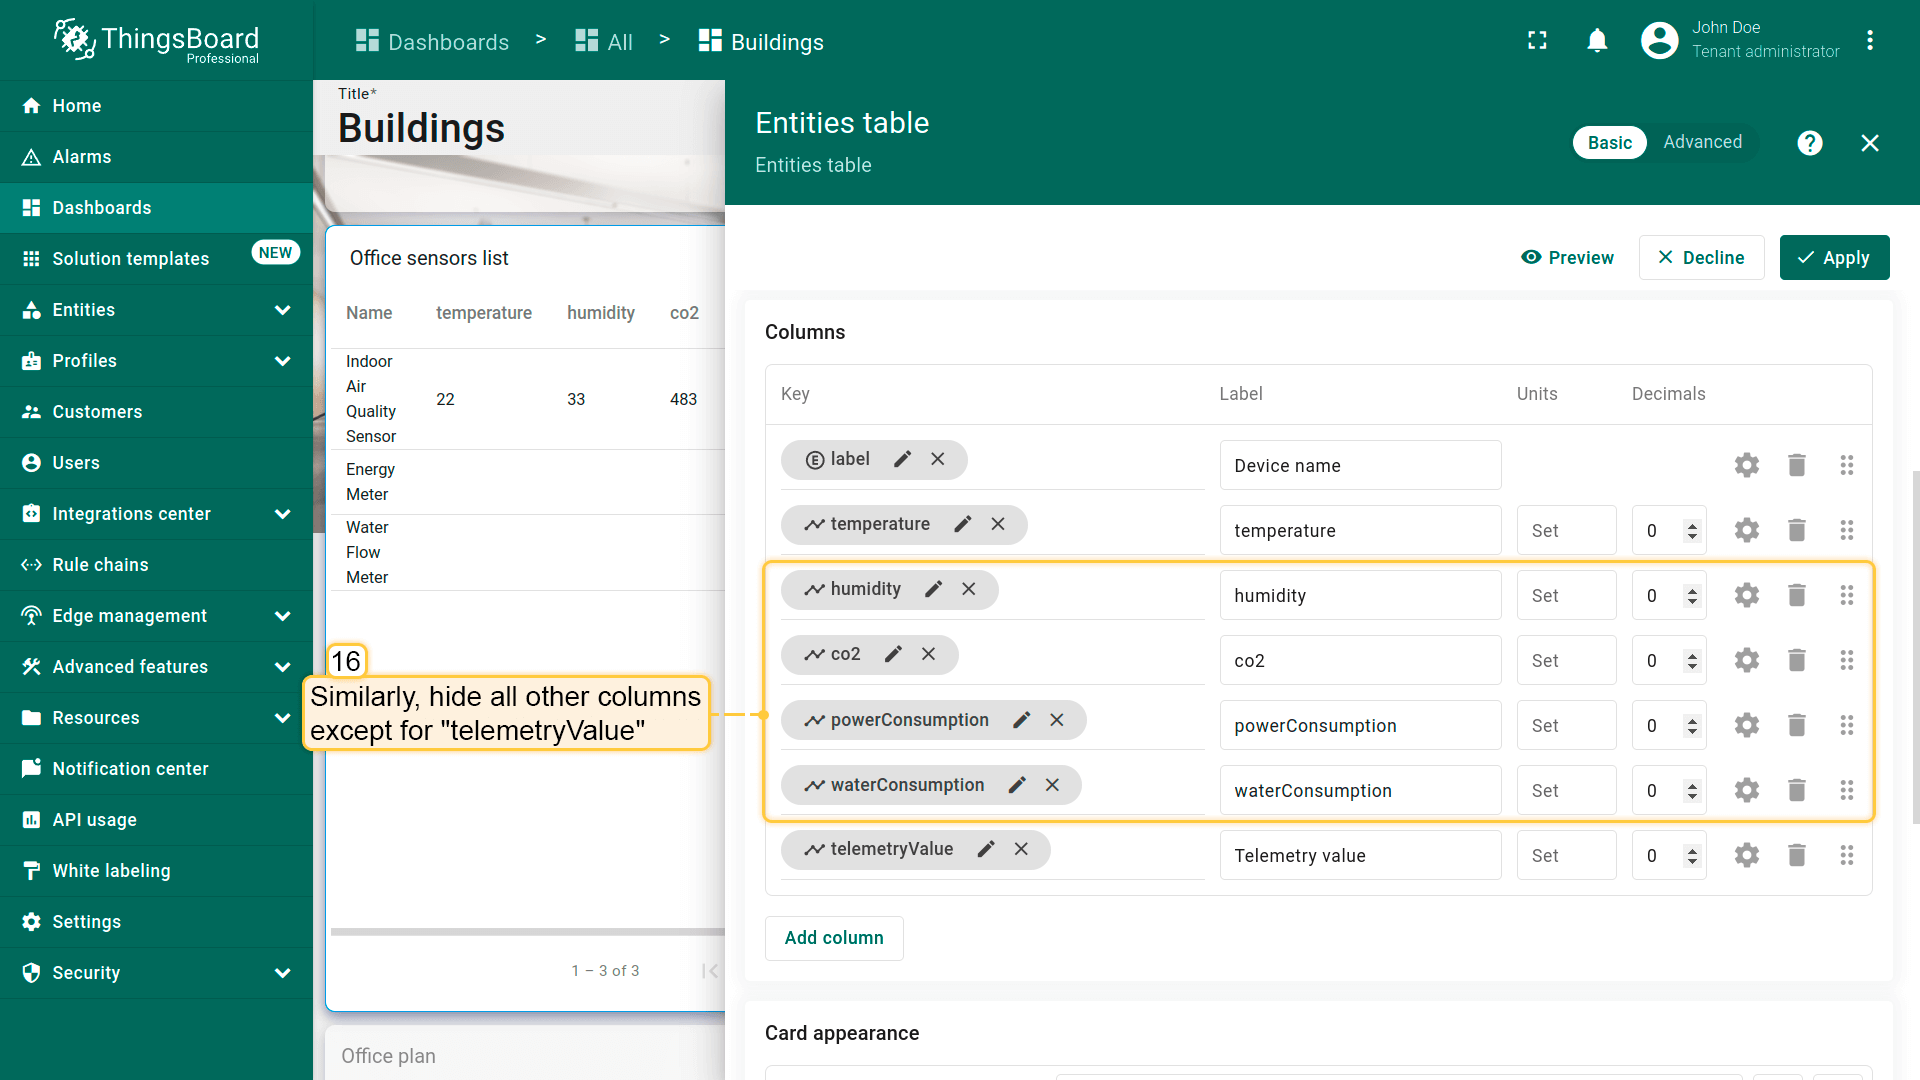
- 添加另一列:命名为「telemetryValue」,点击「Time series」图标添加新键;
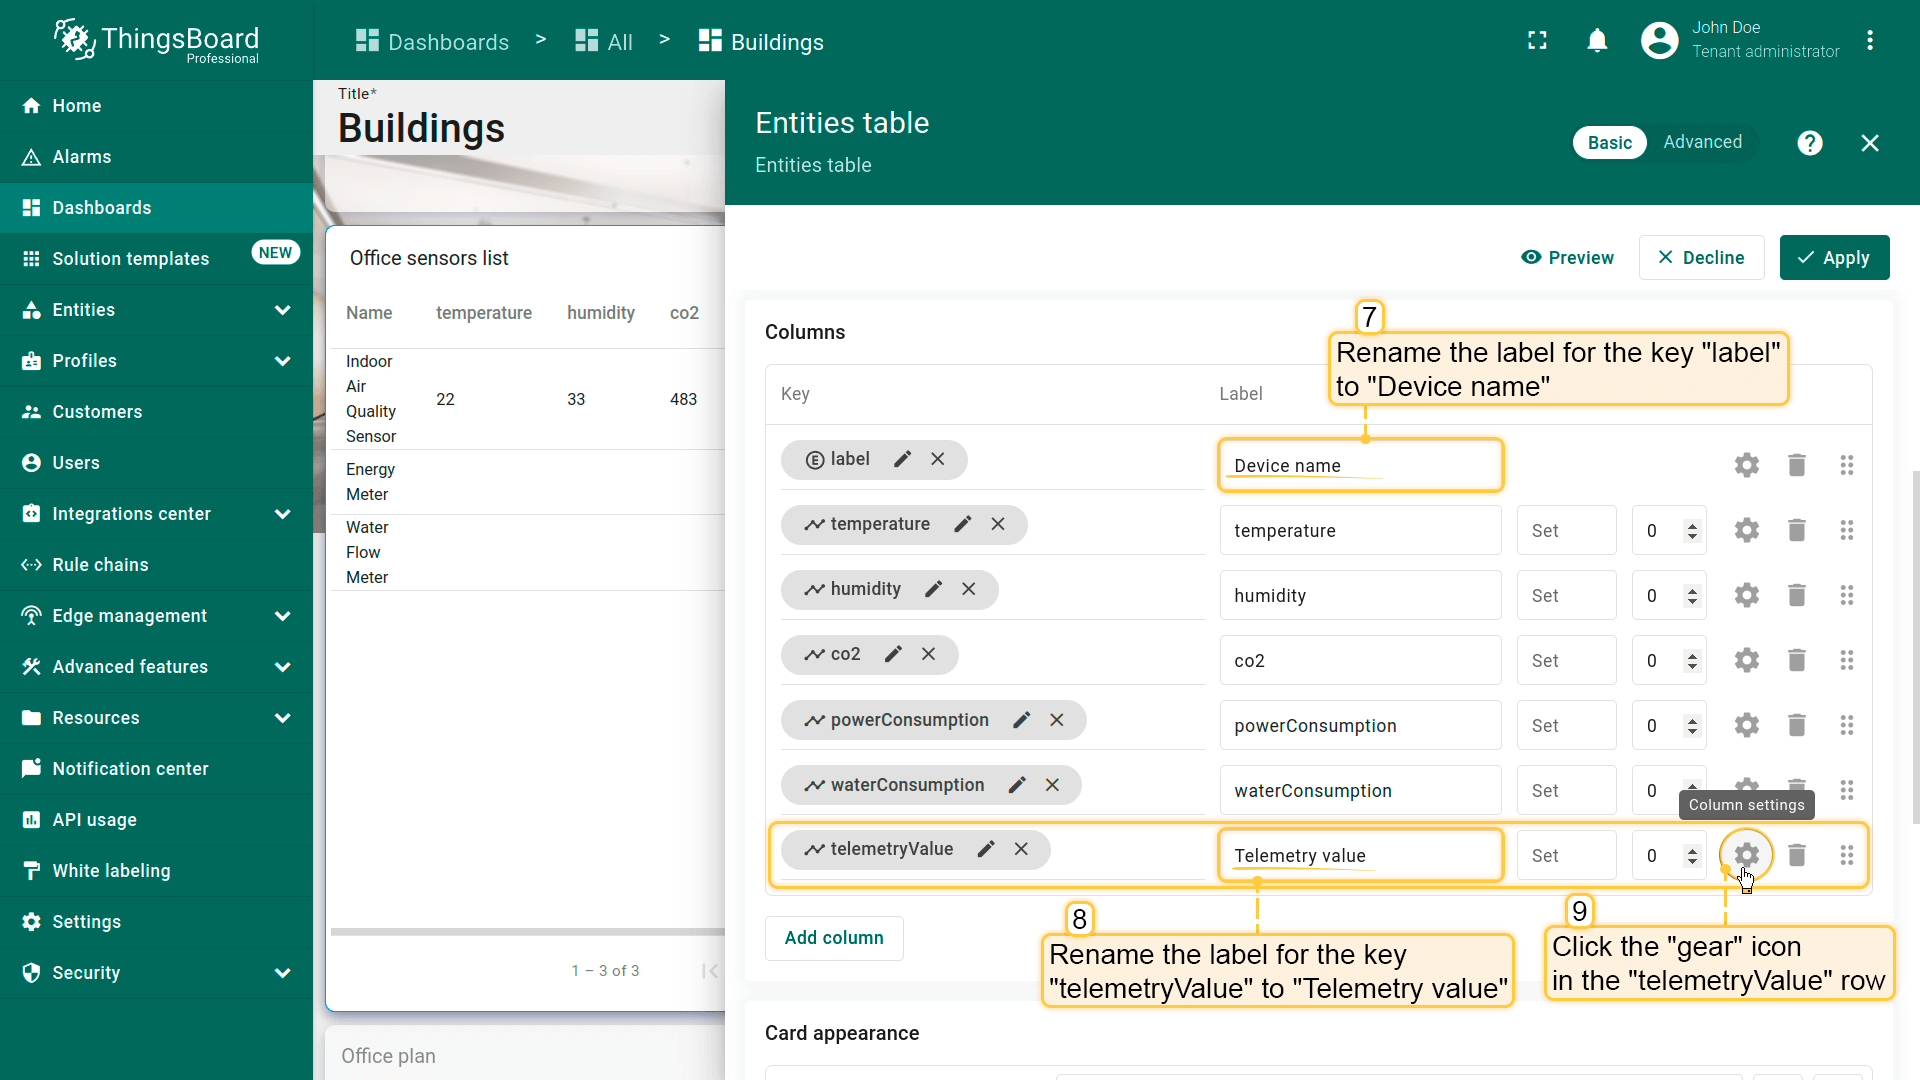
- 将「Name」和「telemetryValue」键的标签分别重命名为「Device name」和「Telemetry value」。接着点击「telemetryValue」行旁的「齿轮」图标打开其设置;
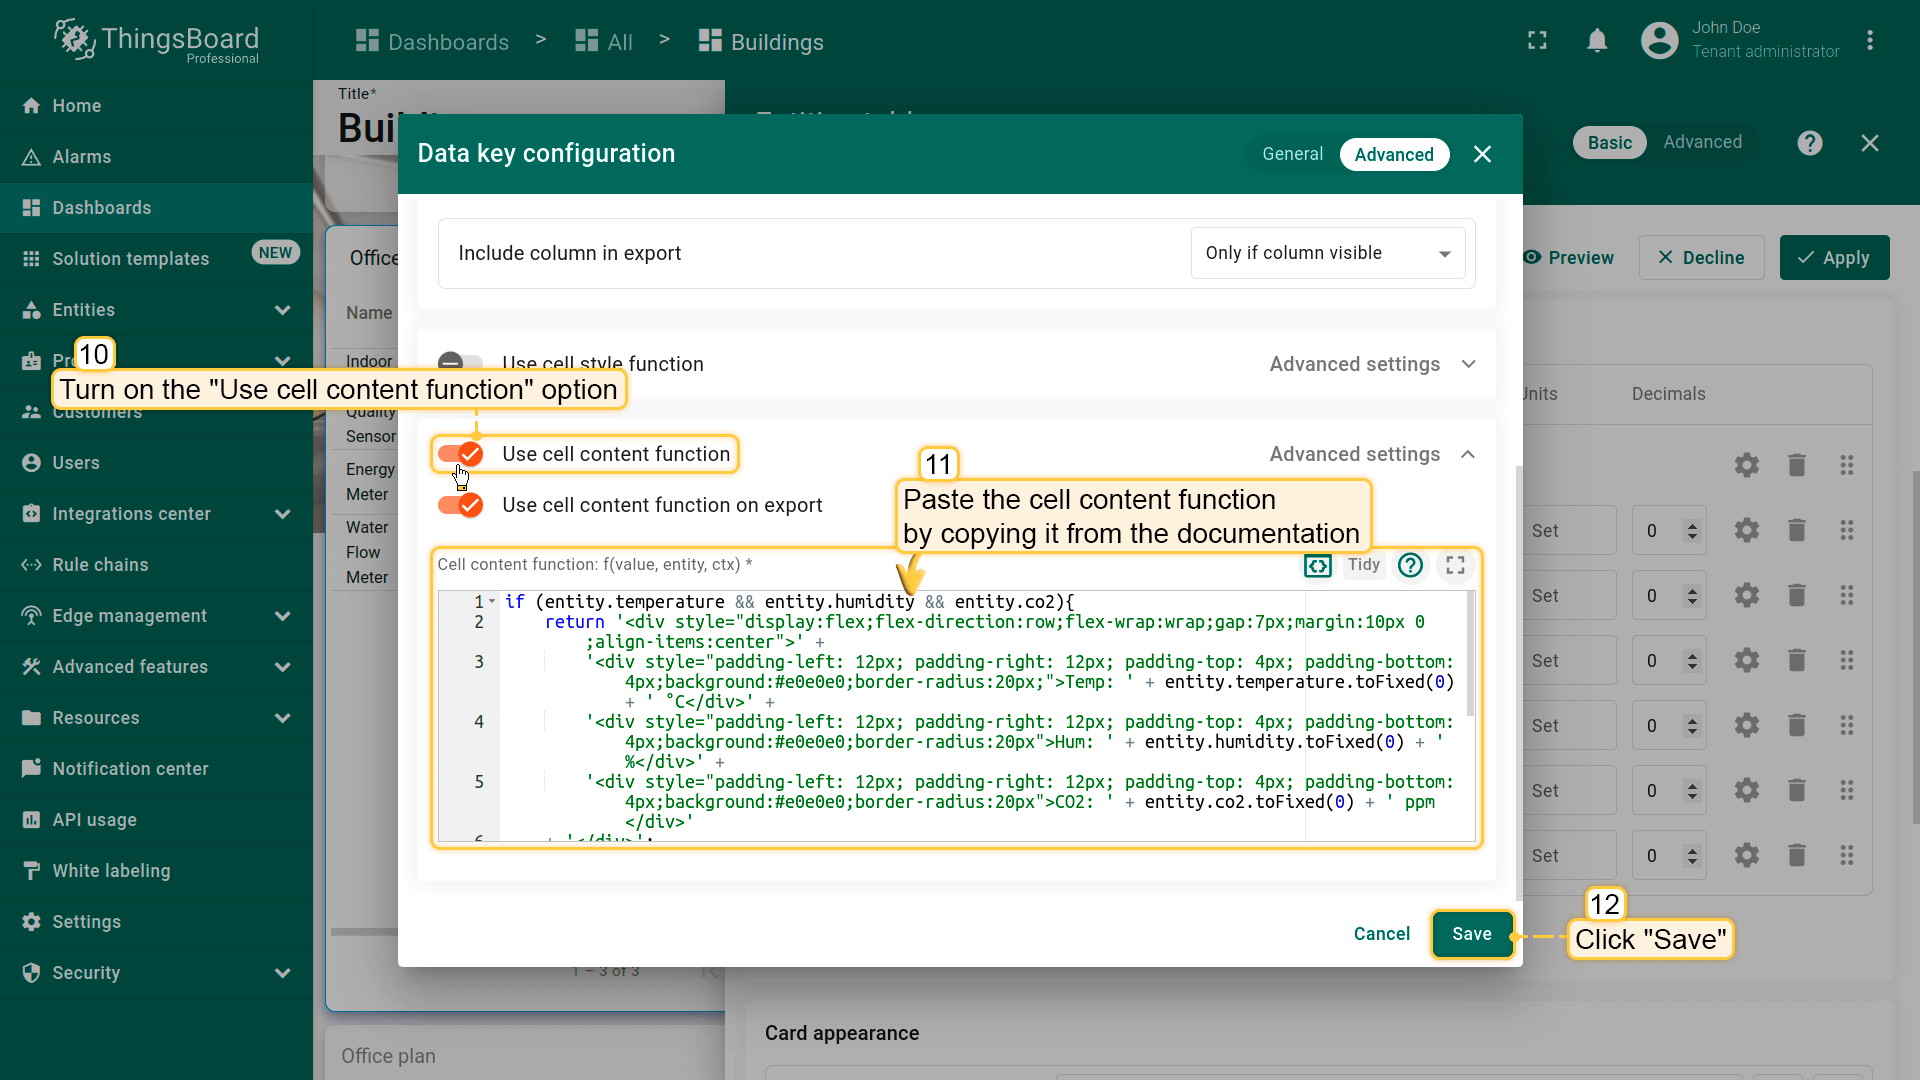
- 开启「Use cell content function」选项。将文档中的函数插入对应字段。该函数会将多个遥测列合并为单个设备的单一列。然后点击「Save」;
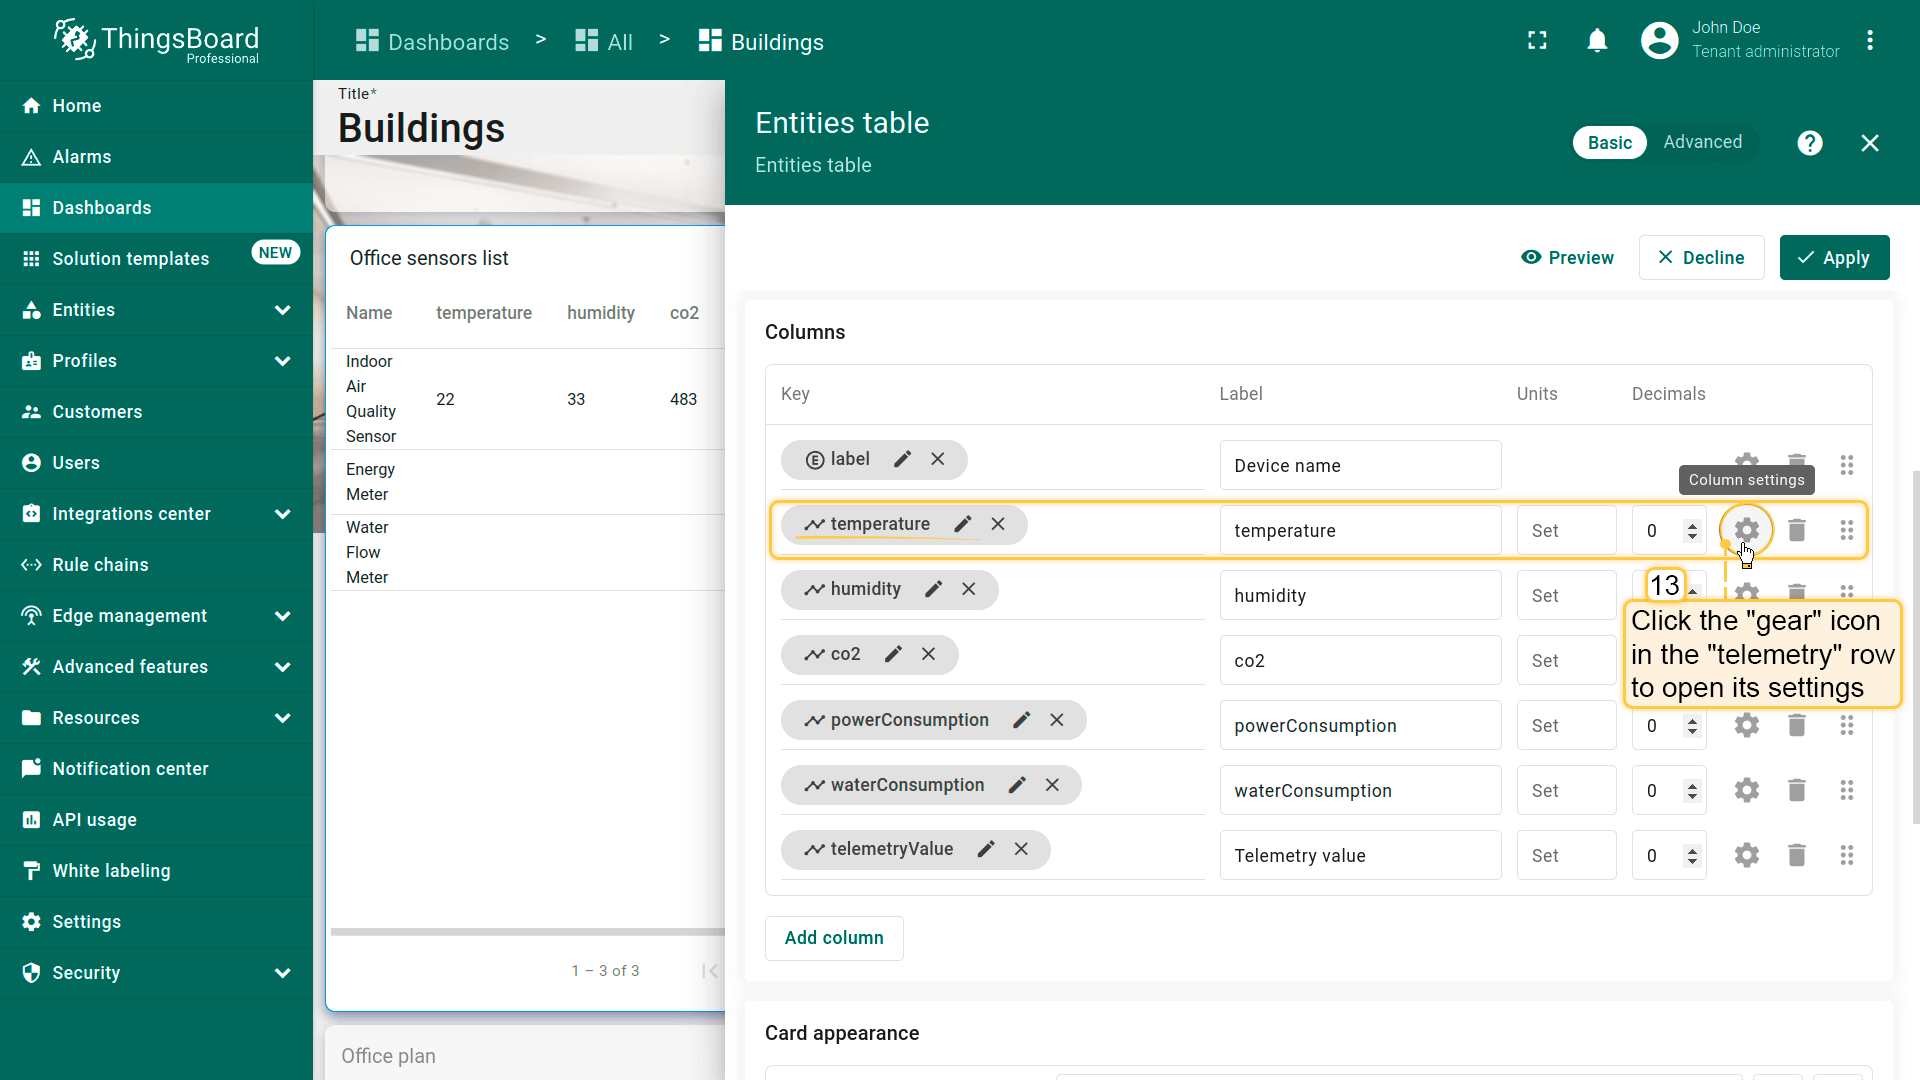
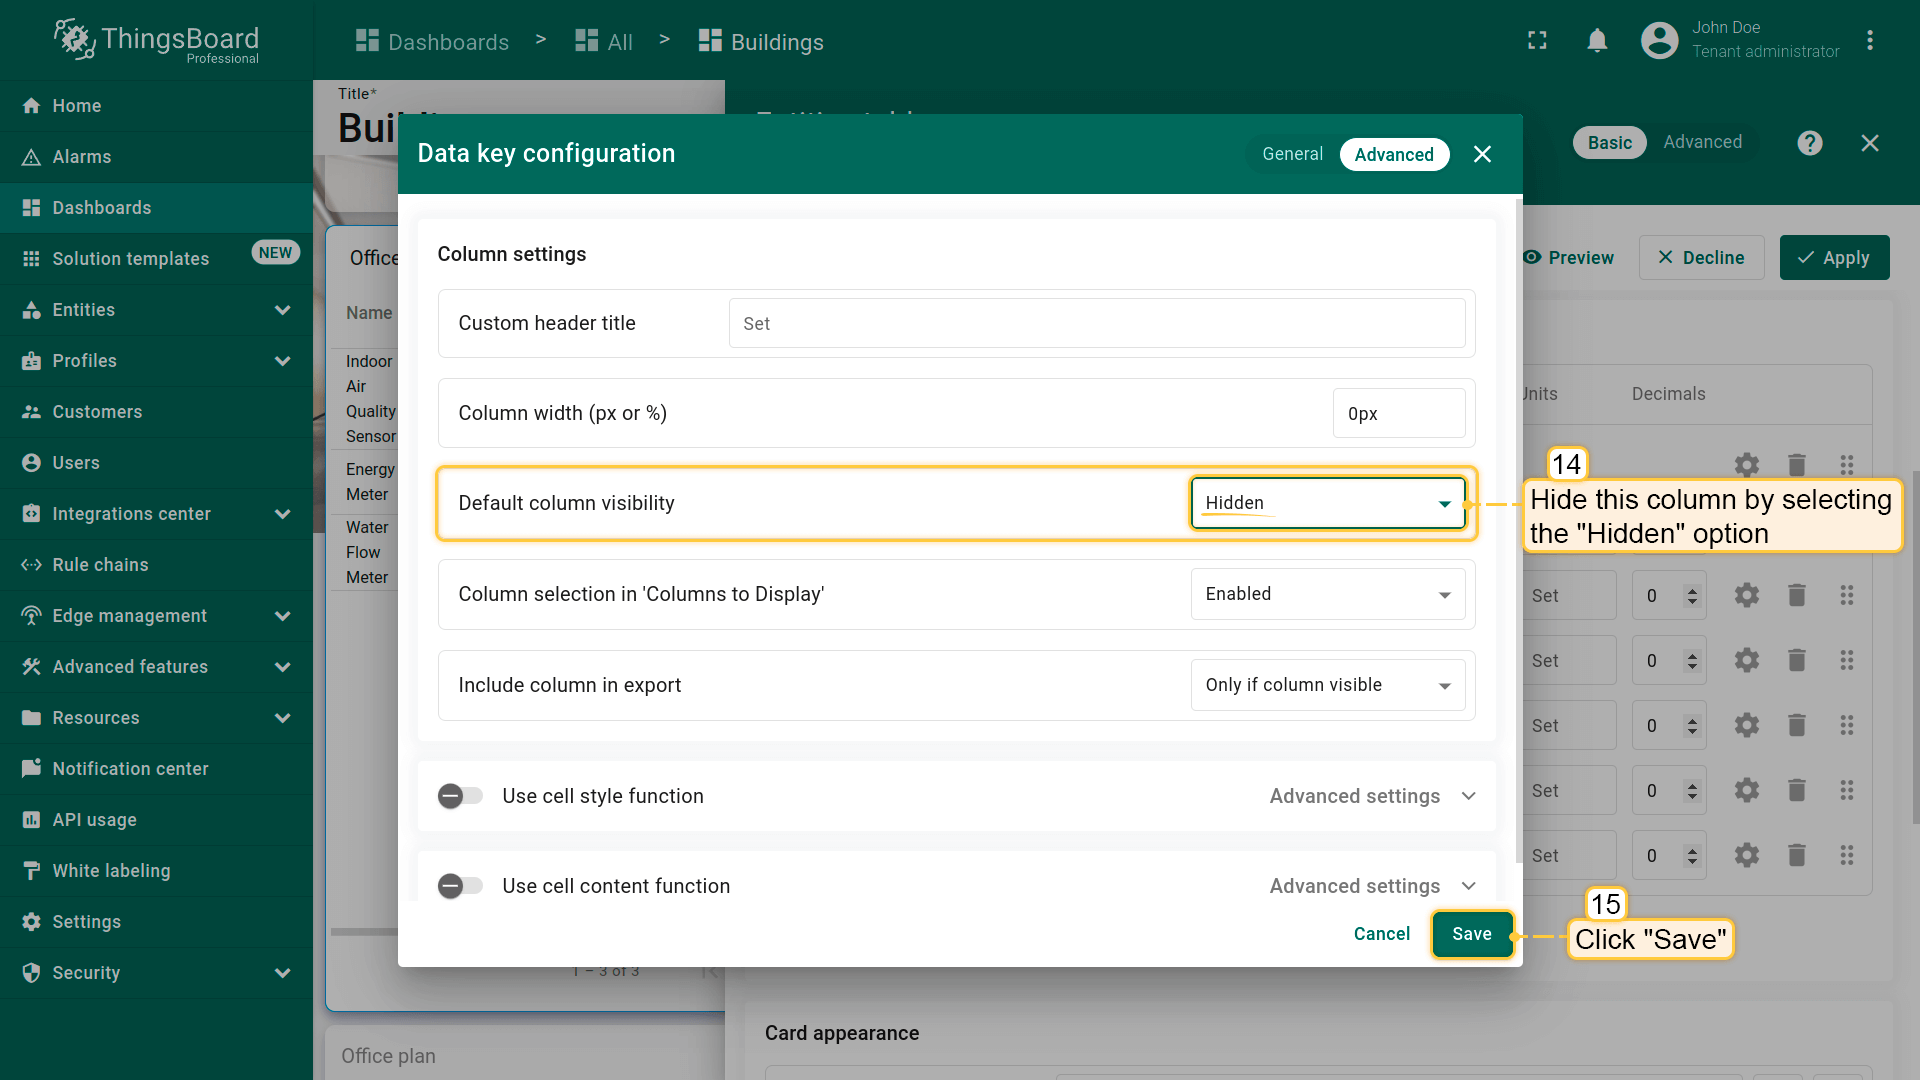
- 现在需要隐藏不必要的列,如「temperature」「humidity」「co2」「powerConsumption」「waterConsumption」。点击「temperature」旁的「齿轮」图标打开其设置;
- 在「Default column visibility」菜单中选择「Hidden」。点击「Save」应用该列的更改;
- 对「humidity」「co2」「powerConsumption」「waterConsumption」列重复上述步骤。确保仅保留「Device name」和「Telemetry value」列可见;
Cell content function used in this example:
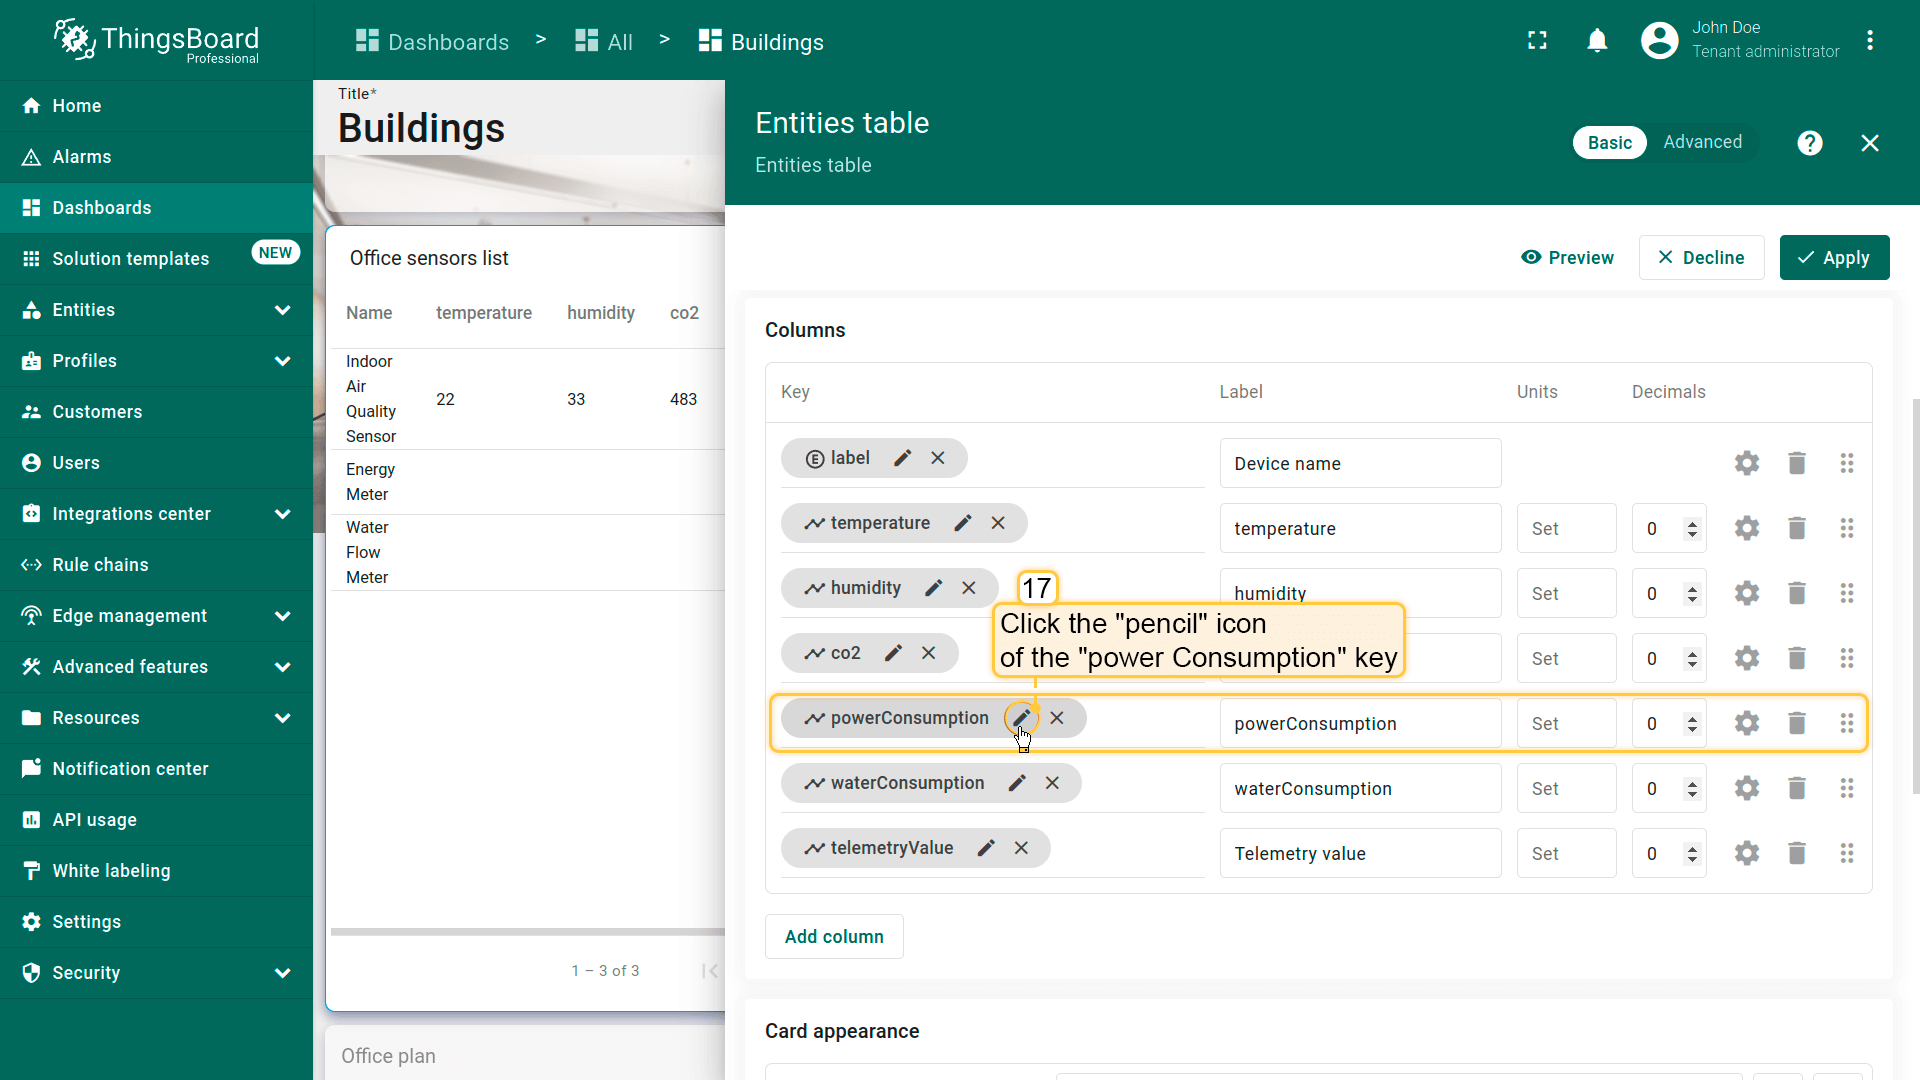
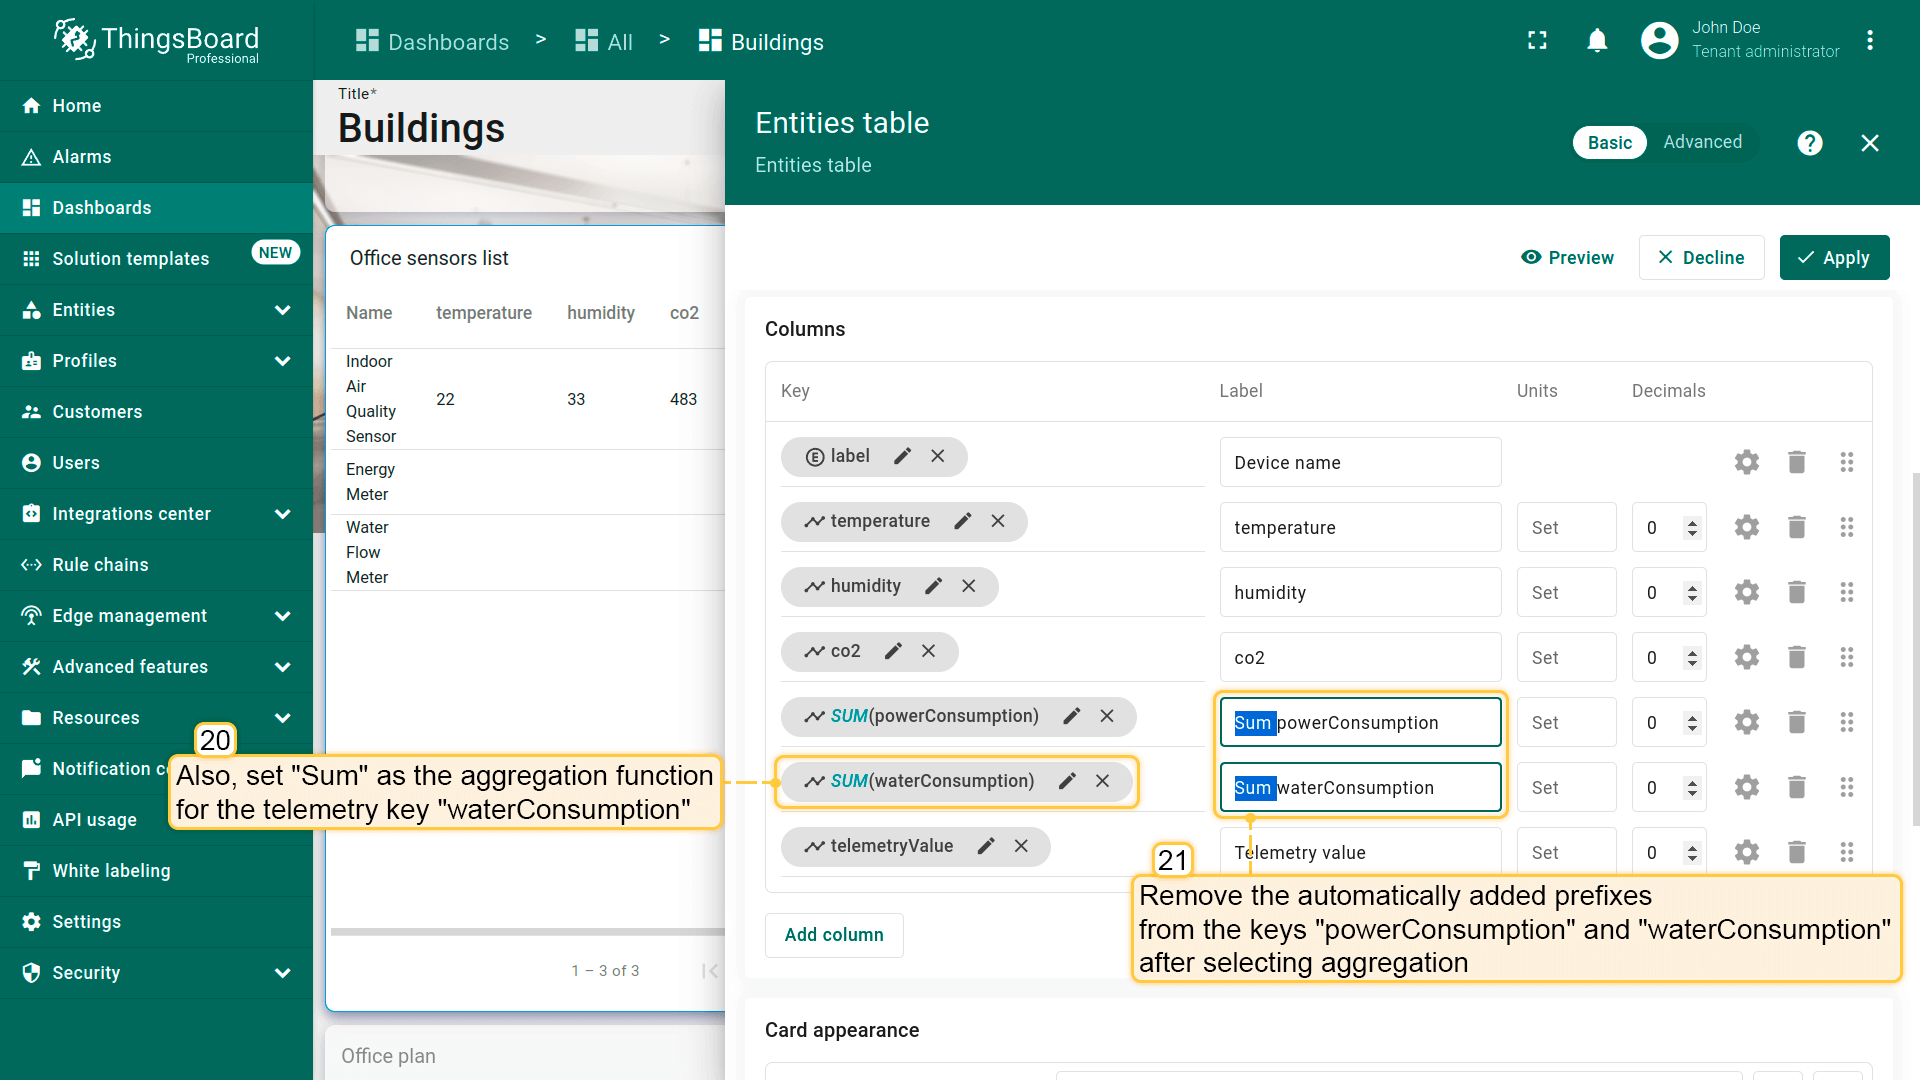
For the “power Consumption” and “water Consumption” keys, we will sum all data point values over the selected time interval. We will specify the time interval later in the dashboard time window settings.
- Click the “pencil” icon of the “powerConsumption” key;
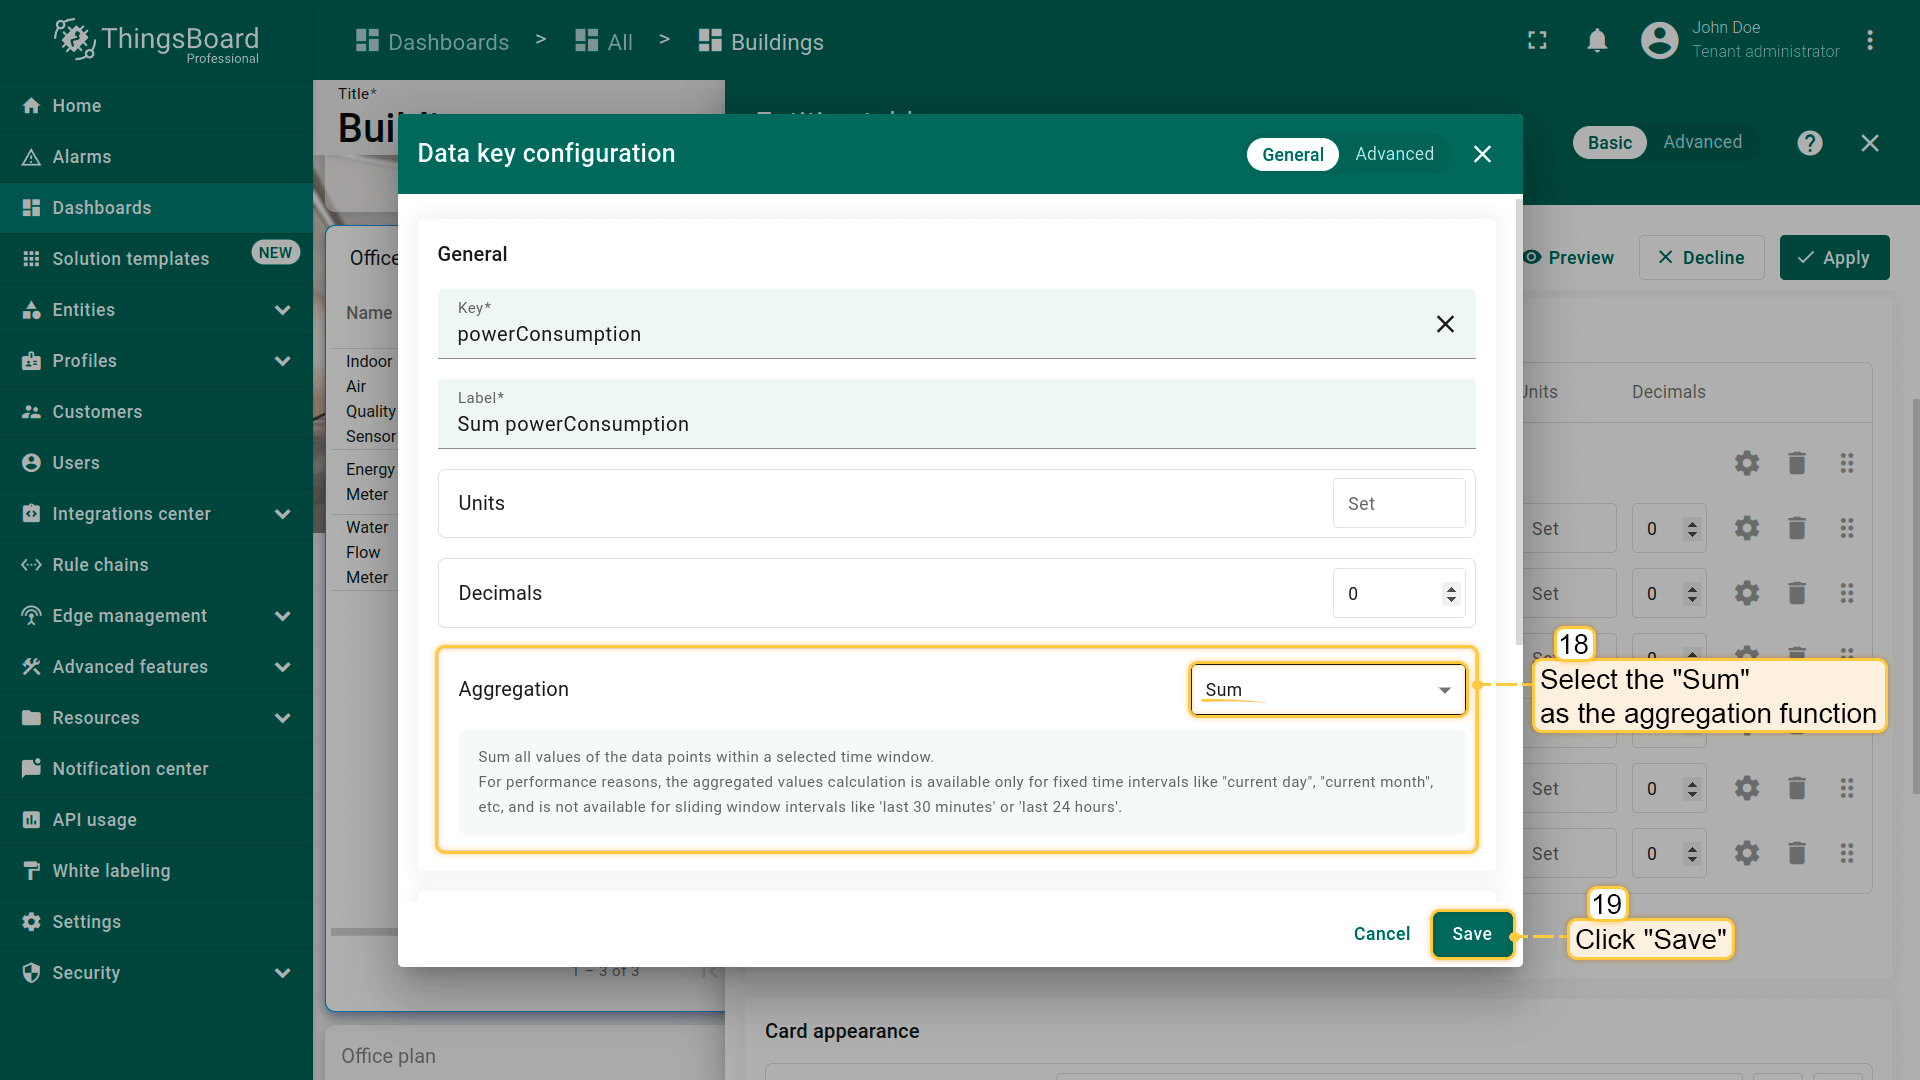
- Select the “Sum” as the aggregation function, and click “Save”;
- Also, set “Sum” as the aggregation function for the telemetry key “waterConsumption”. Remove the automatically added prefixes from the keys label “powerConsumption” and “waterConsumption” after selecting aggregation;
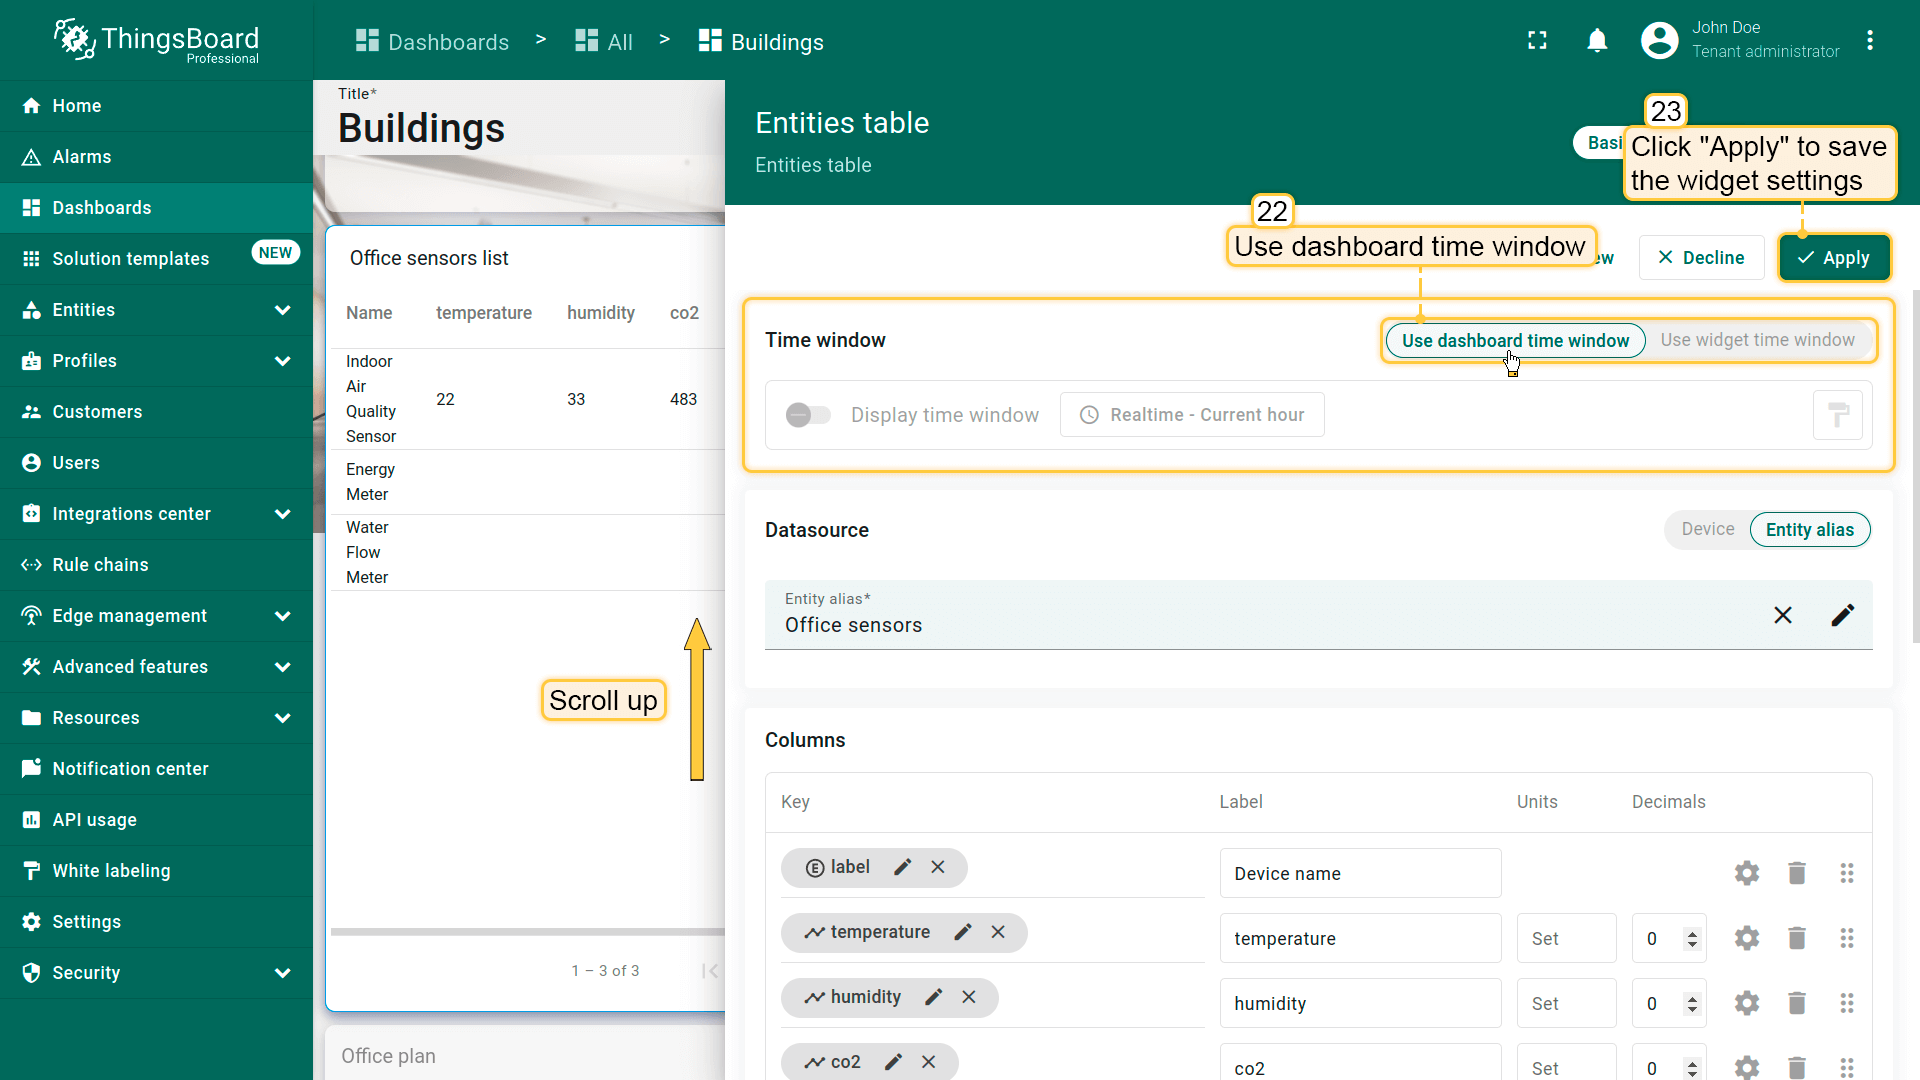
- Scroll up to locate the time window settings. Use the dashboard's time window and apply the changes to the widget;
- Save changes to the dashboard.
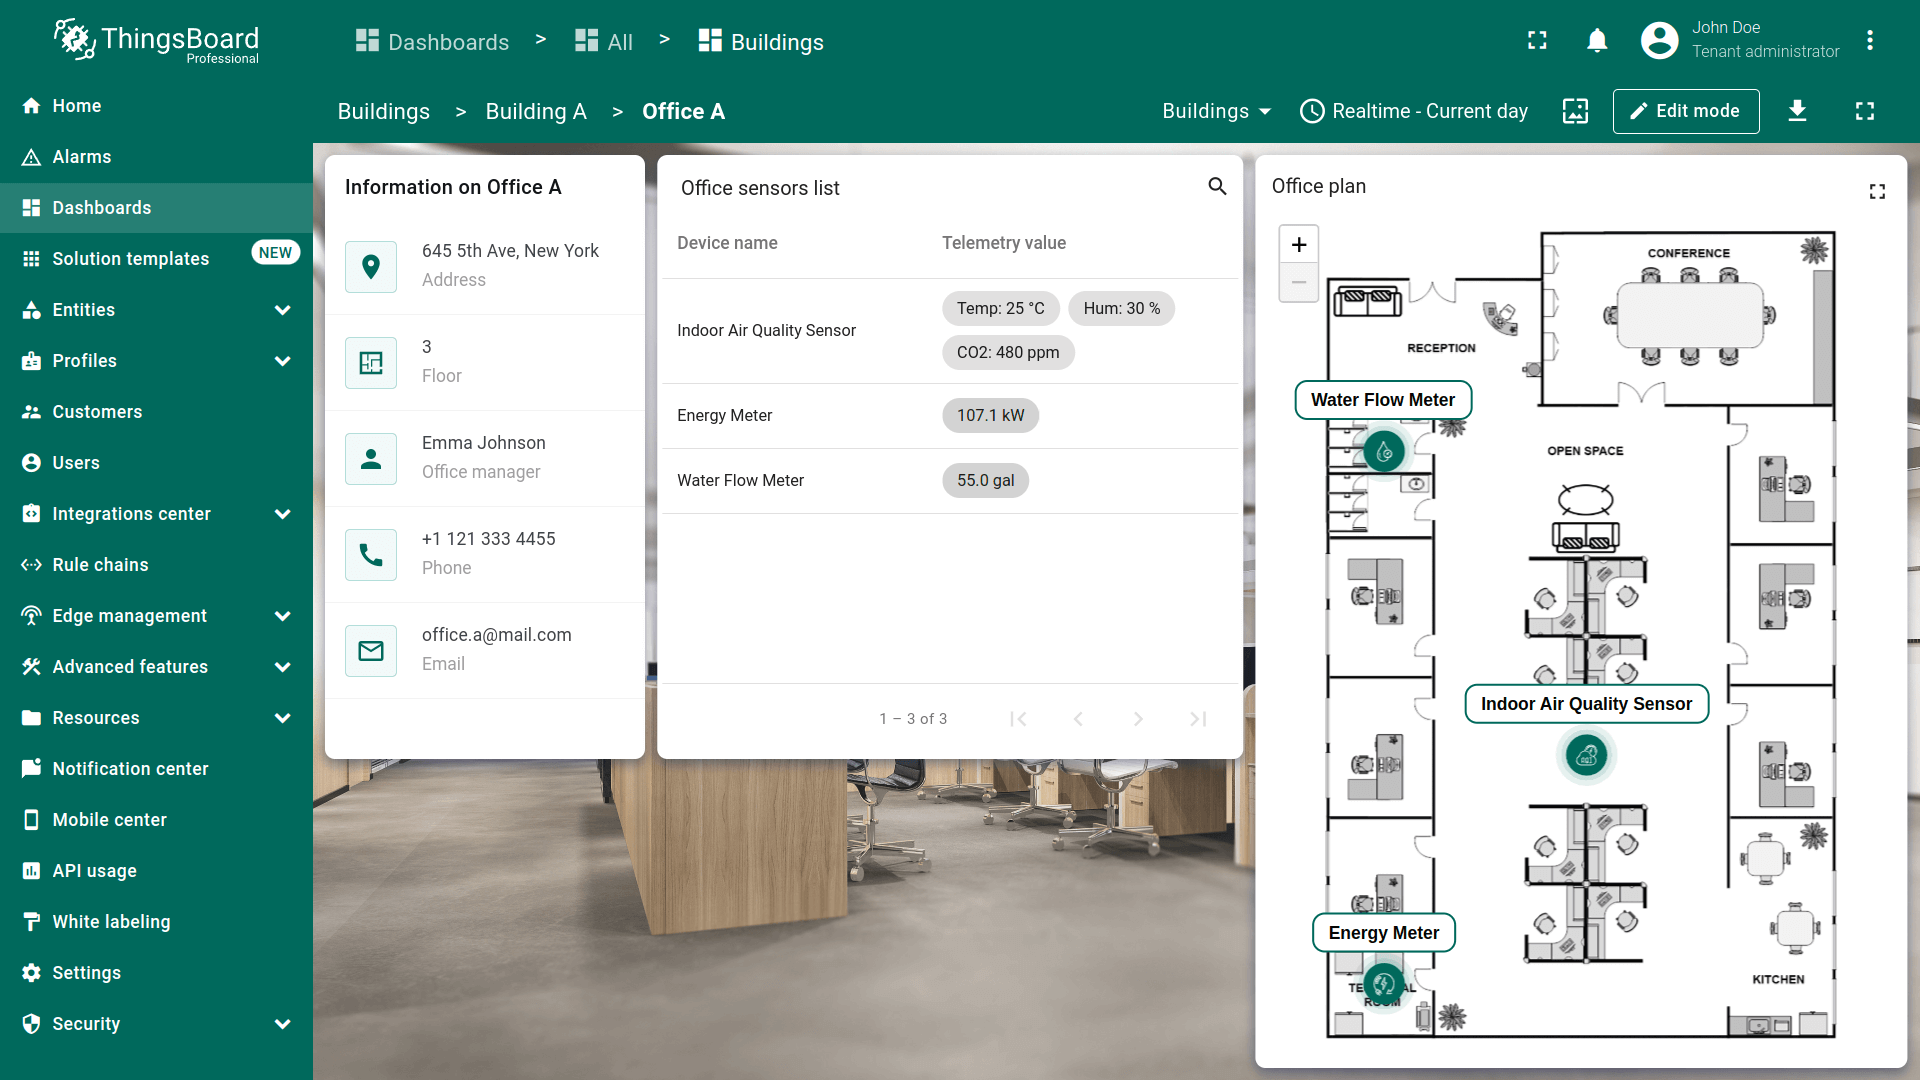
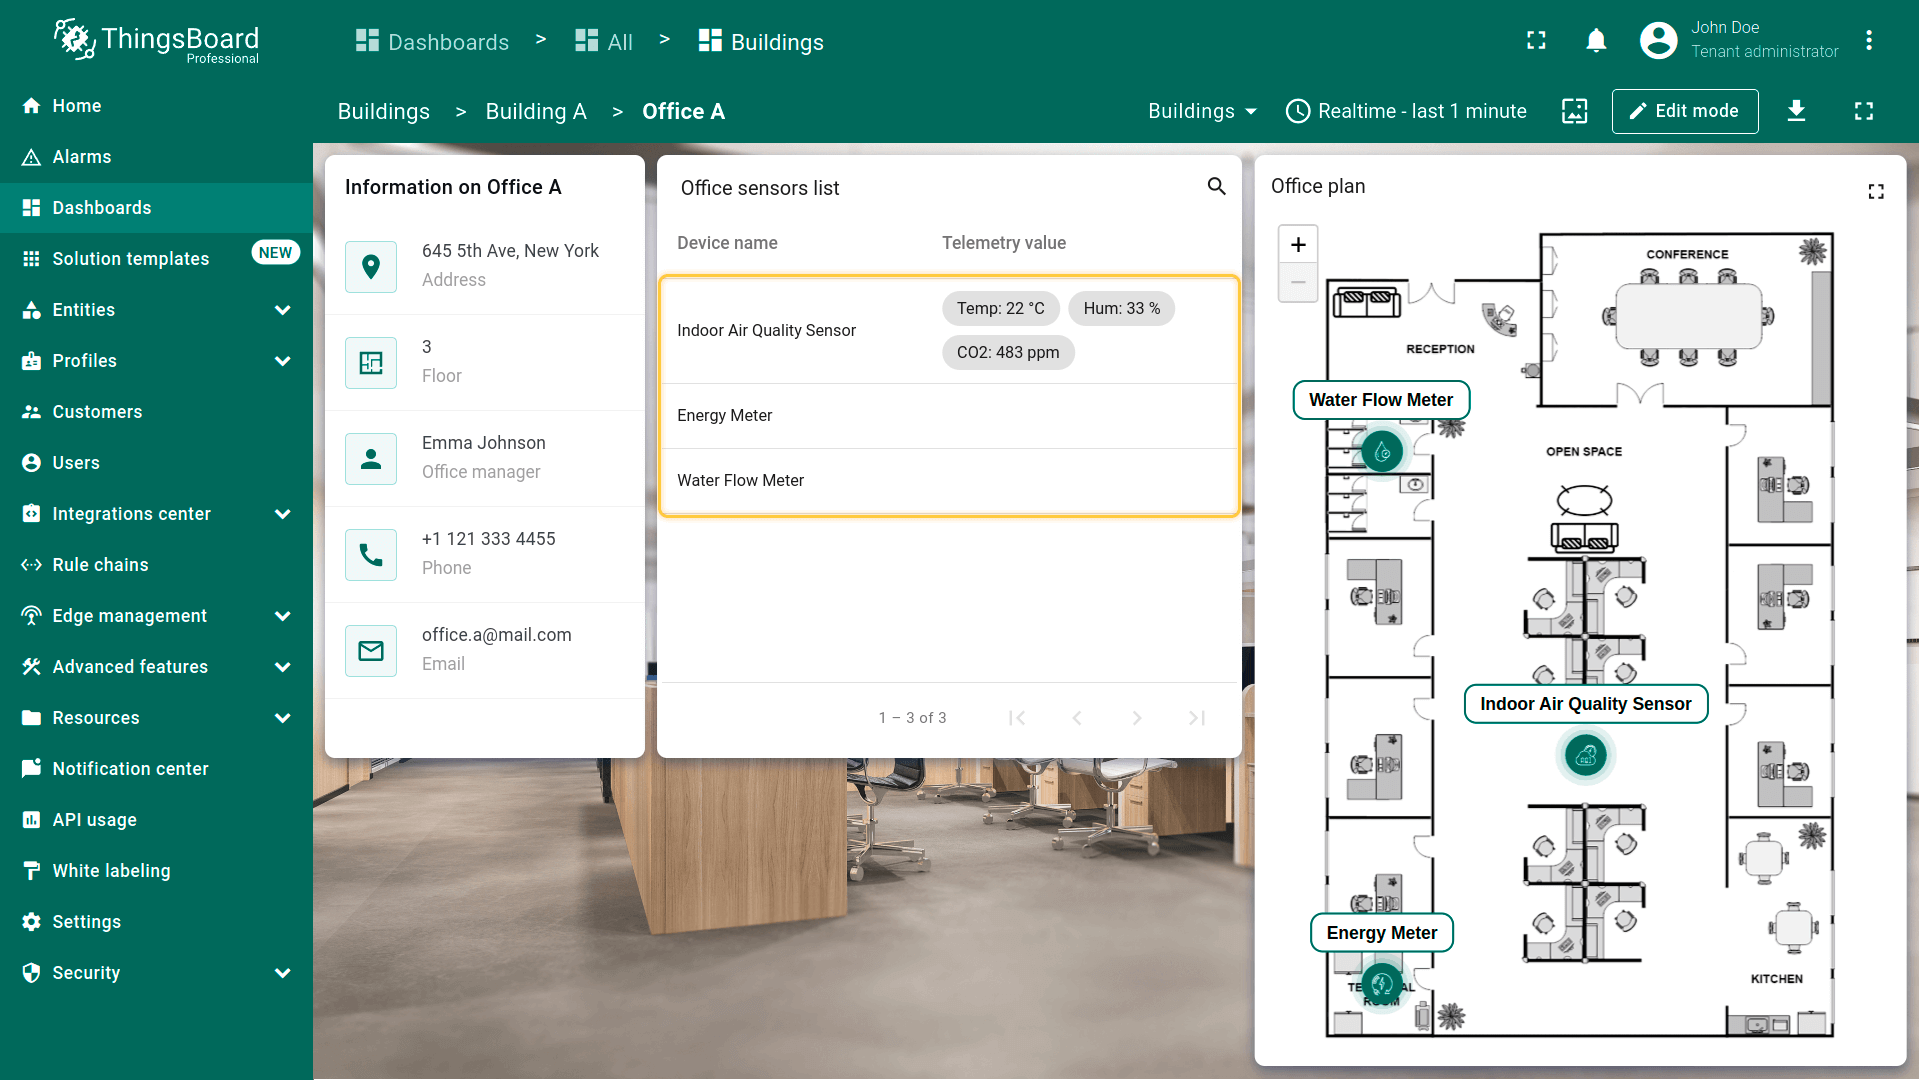
Now, in the “Office sensors list” widget, the telemetry for the Indoor Air Quality Sensor is displayed in a single column.
However, telemetry for the other two devices is not displayed because the aggregation applied to the keys “powerConsumption” and “waterConsumption” is available only for fixed time intervals, like “current day” or “current month”, etc., and is not available for sliding window intervals like “last 30 minutes,” “last 24 hours,” or “last 1 minute,” which our dashboard currently uses. Therefore, let's proceed to configure the time window.
Time window
To correctly display data on widgets that use the dashboard time window, you need to adjust the time interval and aggregation parameters. Data sent by devices will be grouped by hour and displayed for the current day, week, or month, depending on your choice.
Let’s proceed with the setup:
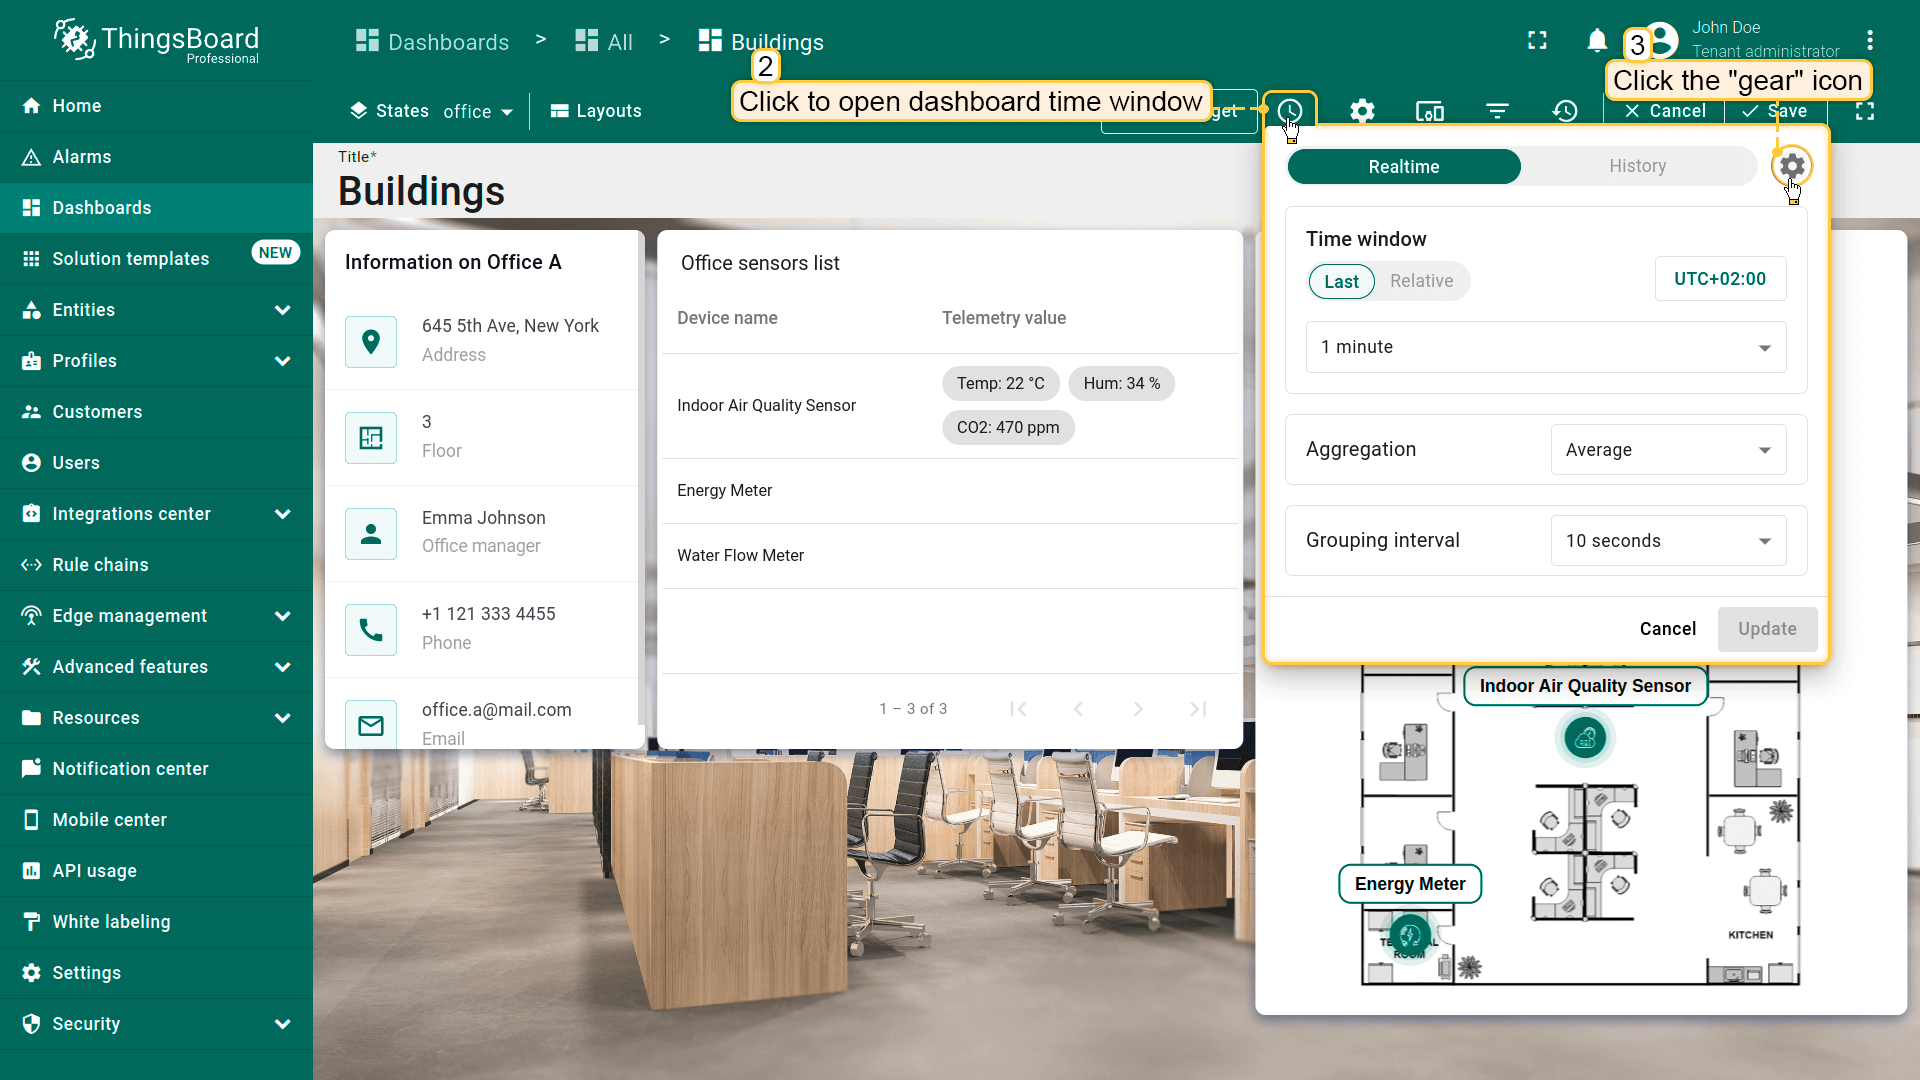
- 进入仪表板编辑模式;
- 点击工具栏上的「Edit time window」图标,然后点击「齿轮」图标打开时间窗口设置;
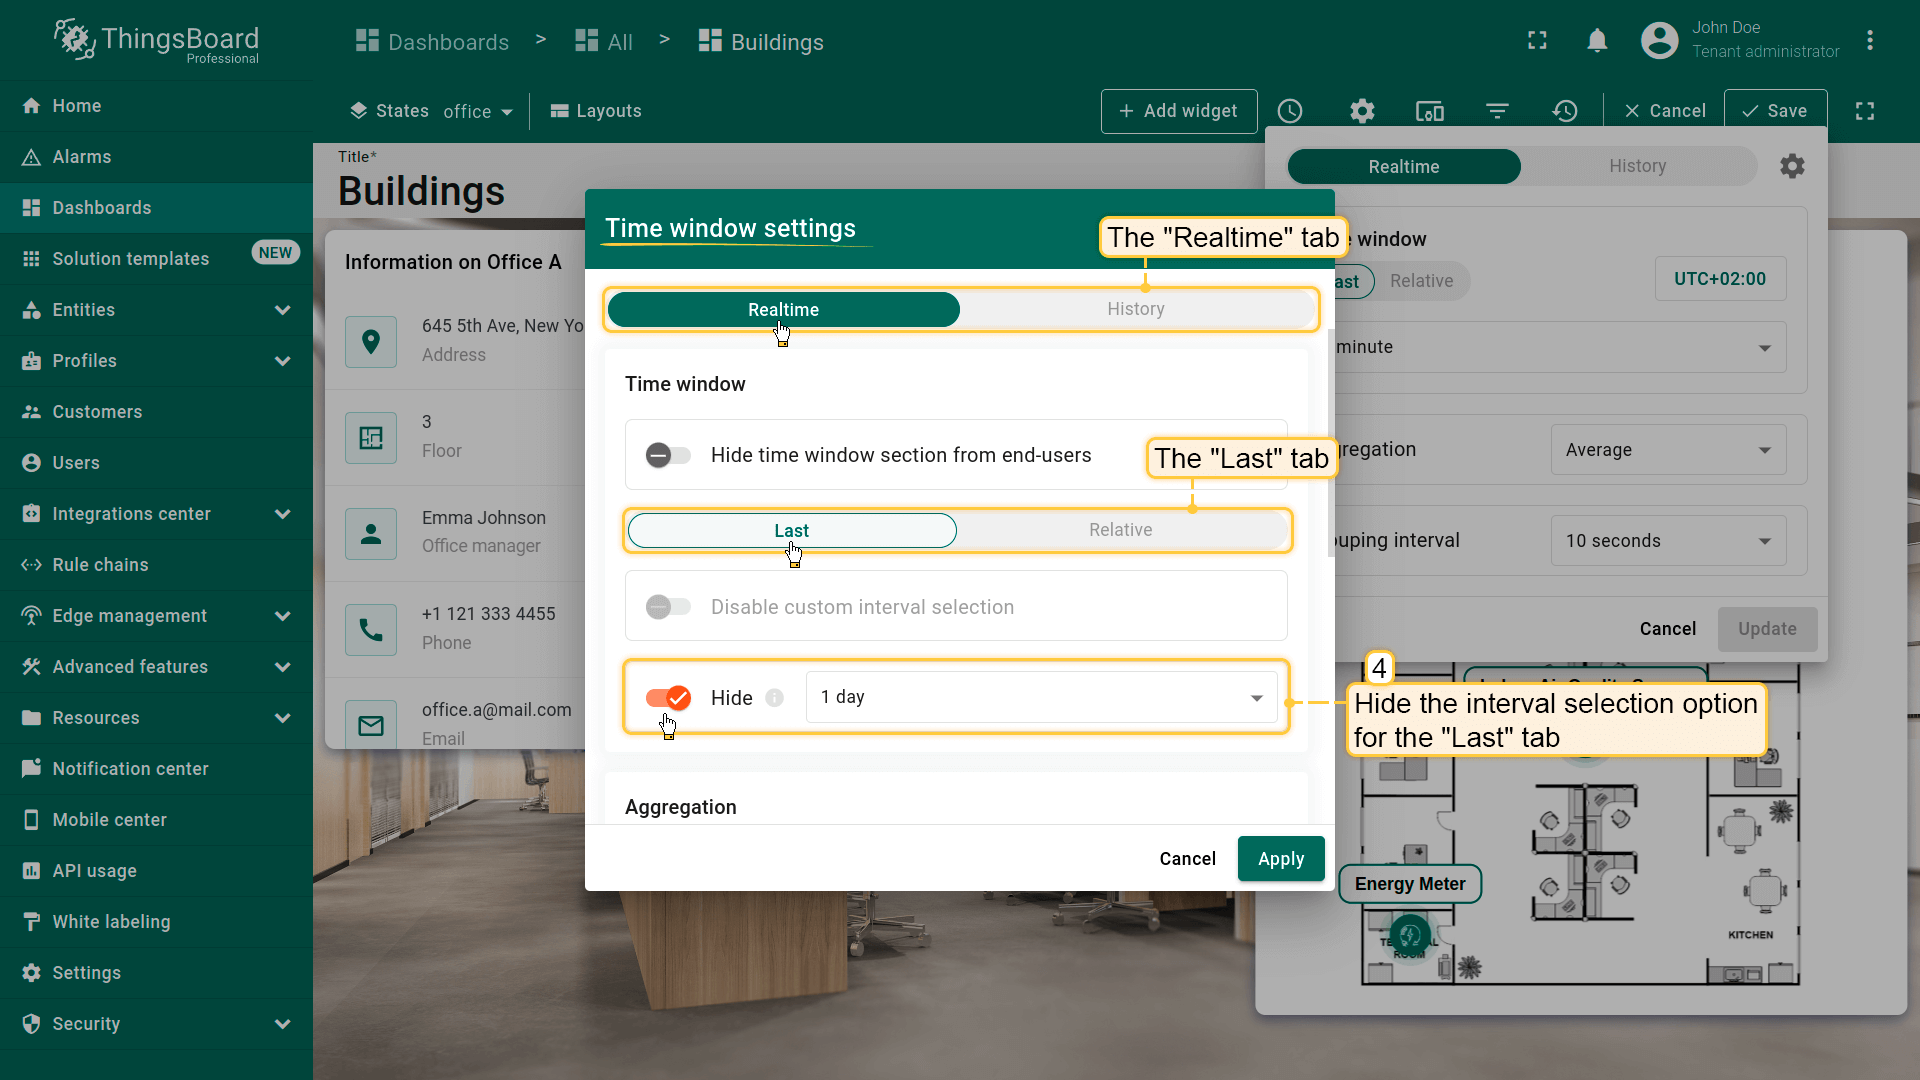
- 将打开新的设置窗口。从「Realtime」标签页开始。隐藏「Last」标签页的间隔选择参数;
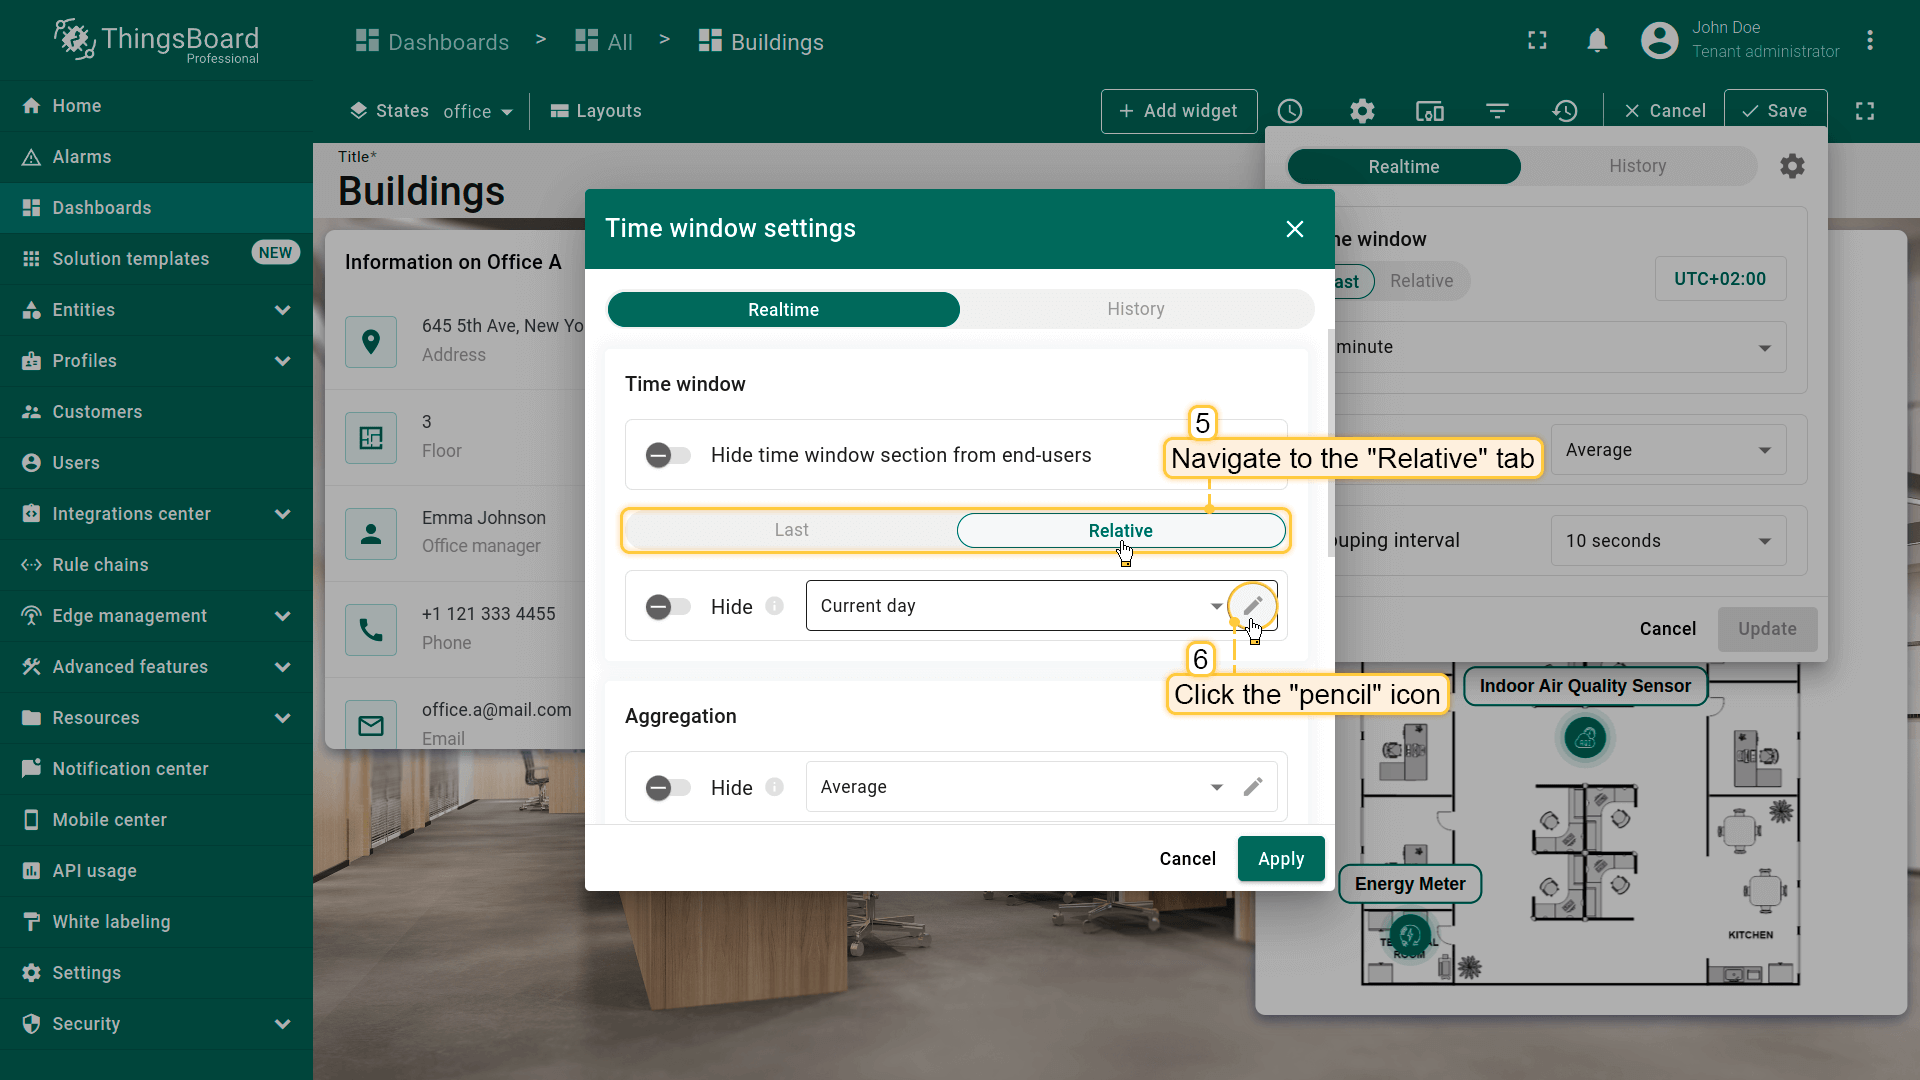
- 在「Relative」标签页中,点击间隔设置行的「铅笔」图标;
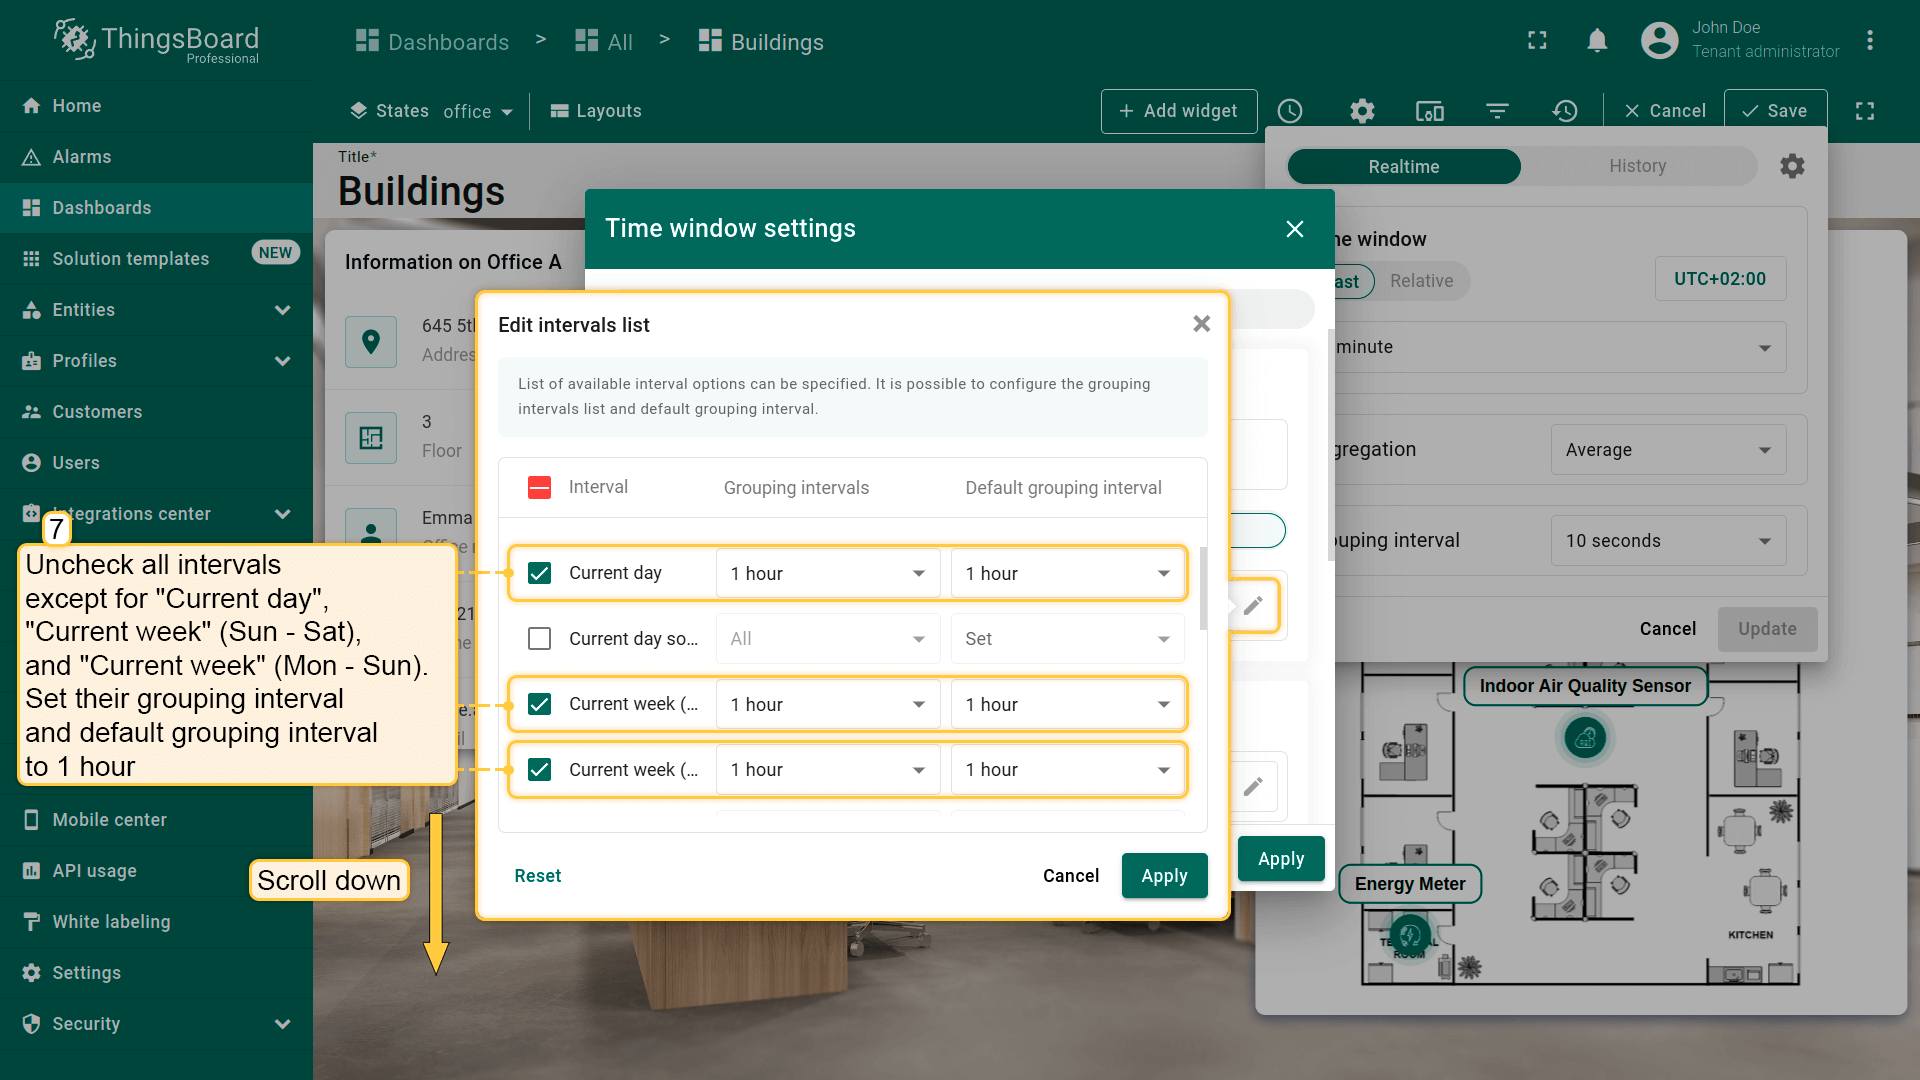
- 取消勾选除「Current day」「Current week」(周日-周六)和「Current week」(周一-周日)外的所有间隔。将其分组间隔和默认分组间隔设为 1 小时;
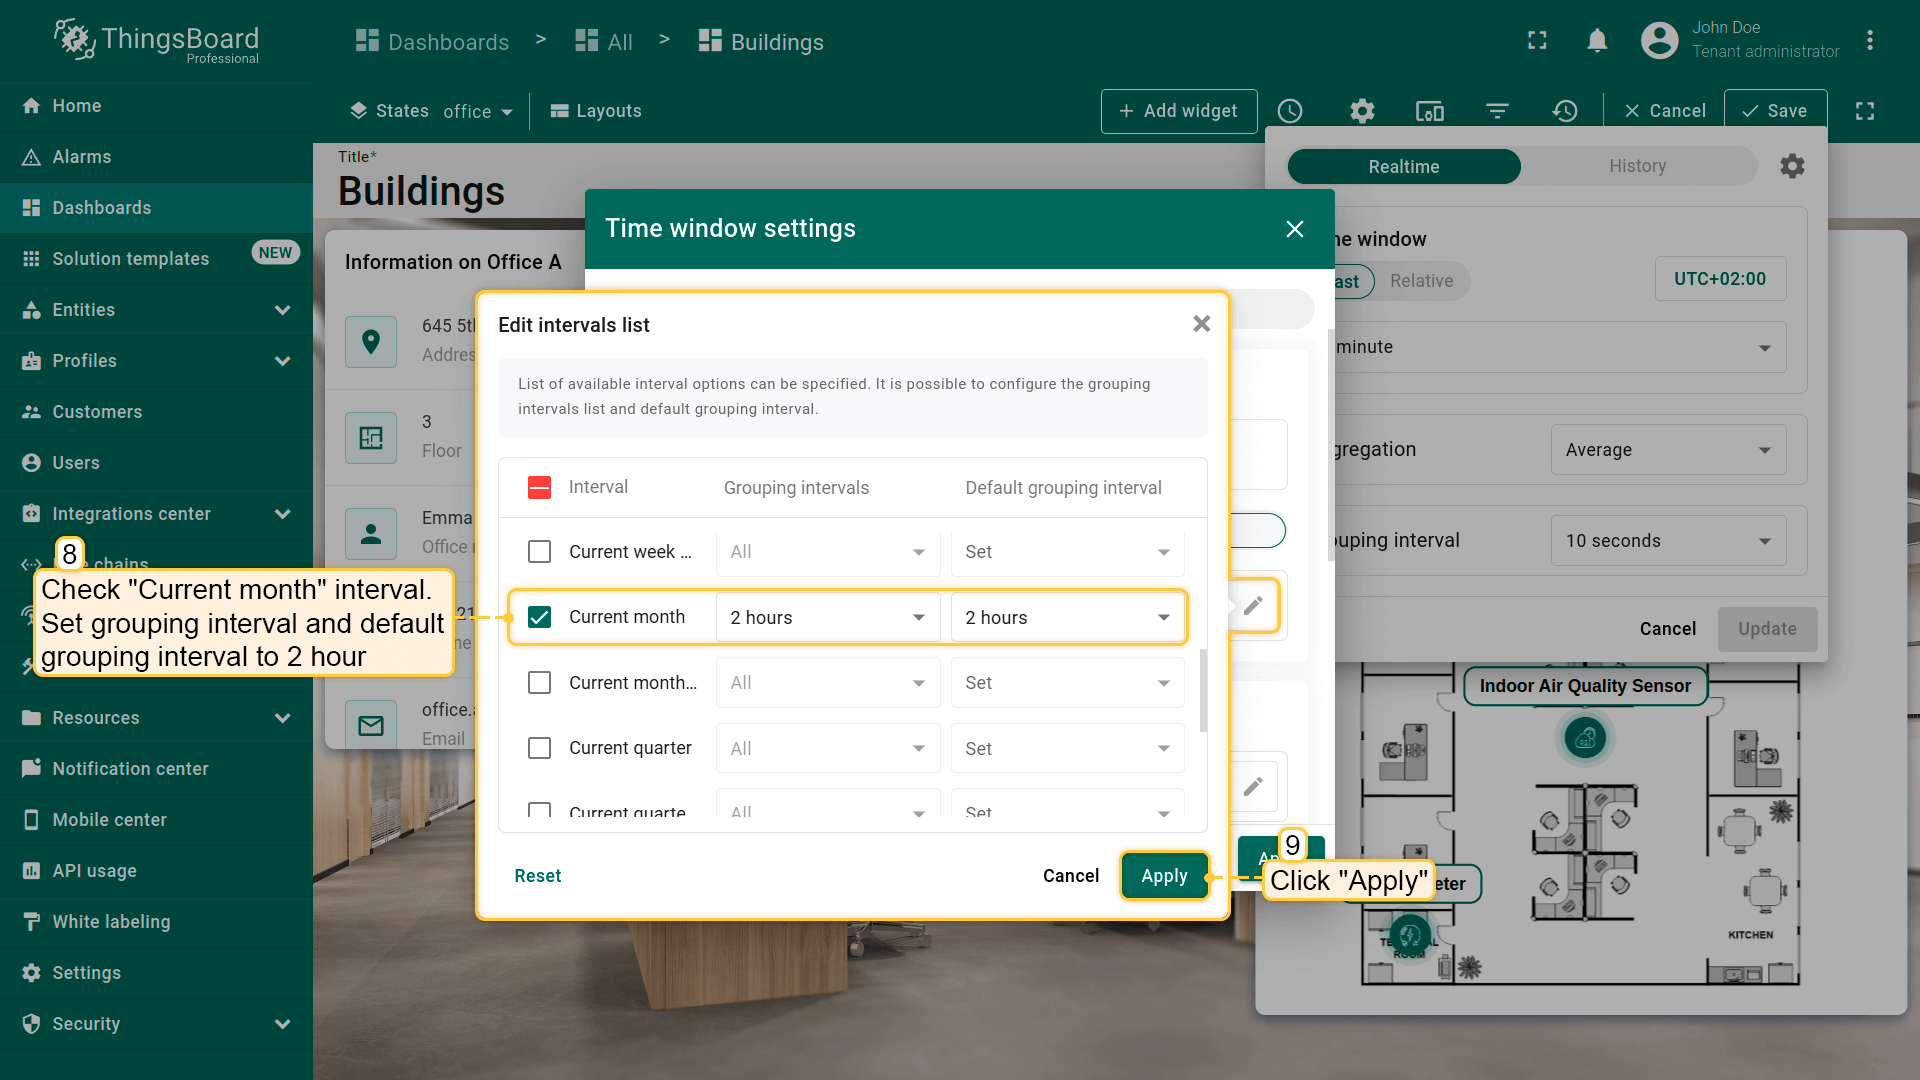
- 同时勾选「Current month」间隔。将分组间隔和默认分组间隔设为 2 小时。点击「Apply」;
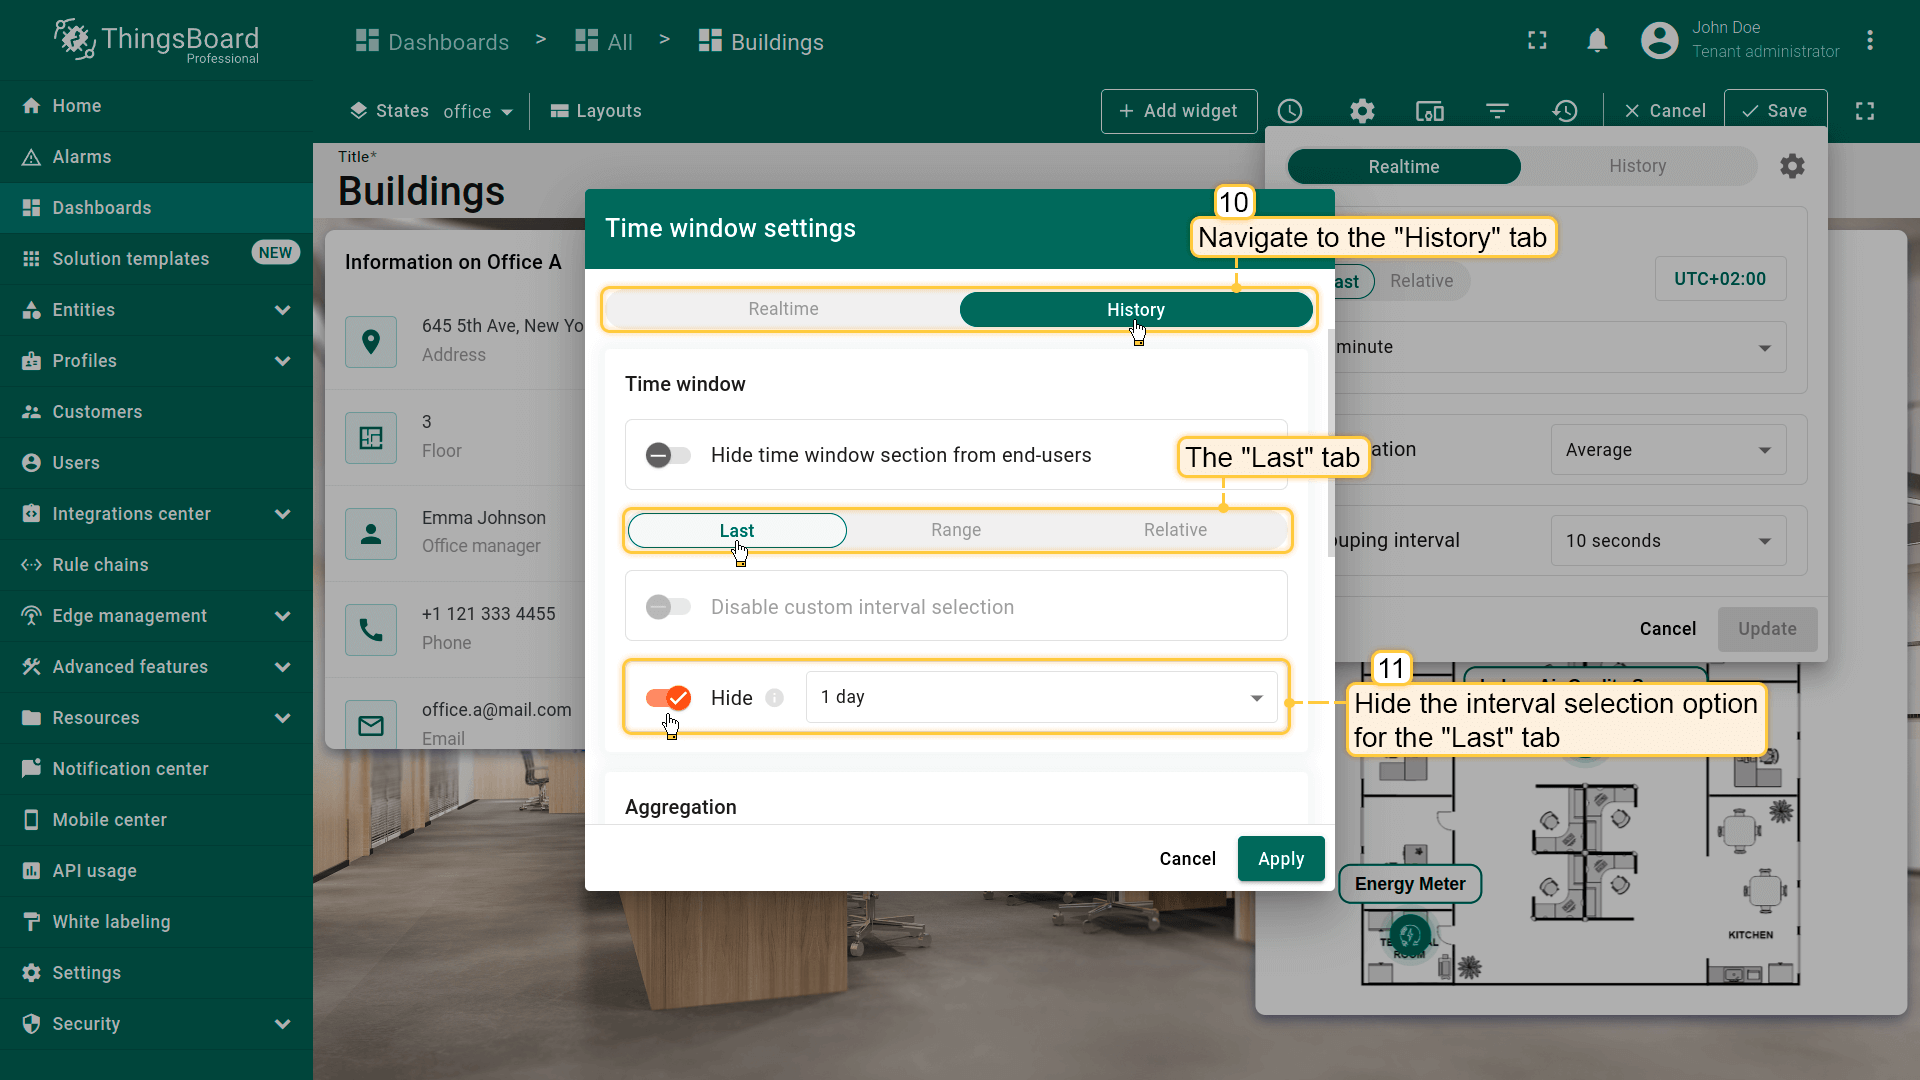
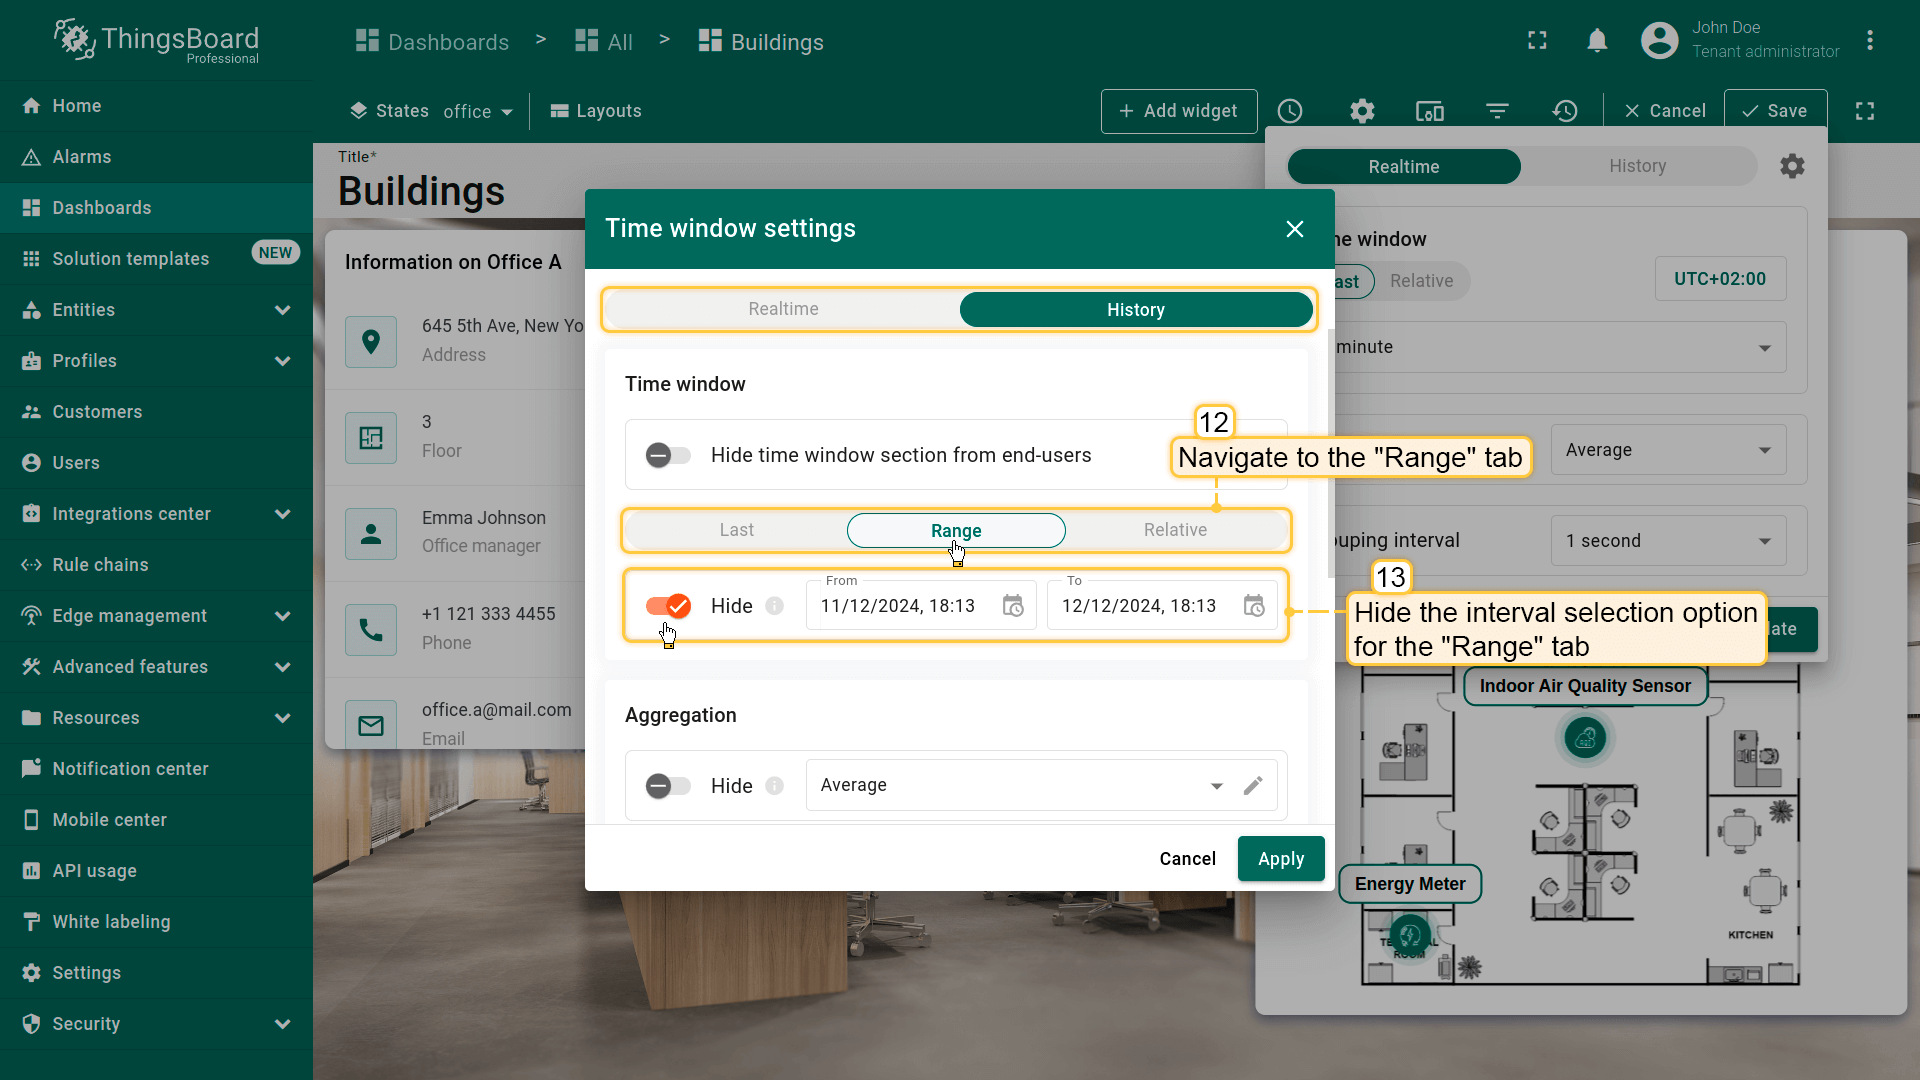
Now, configure the “History” tab:
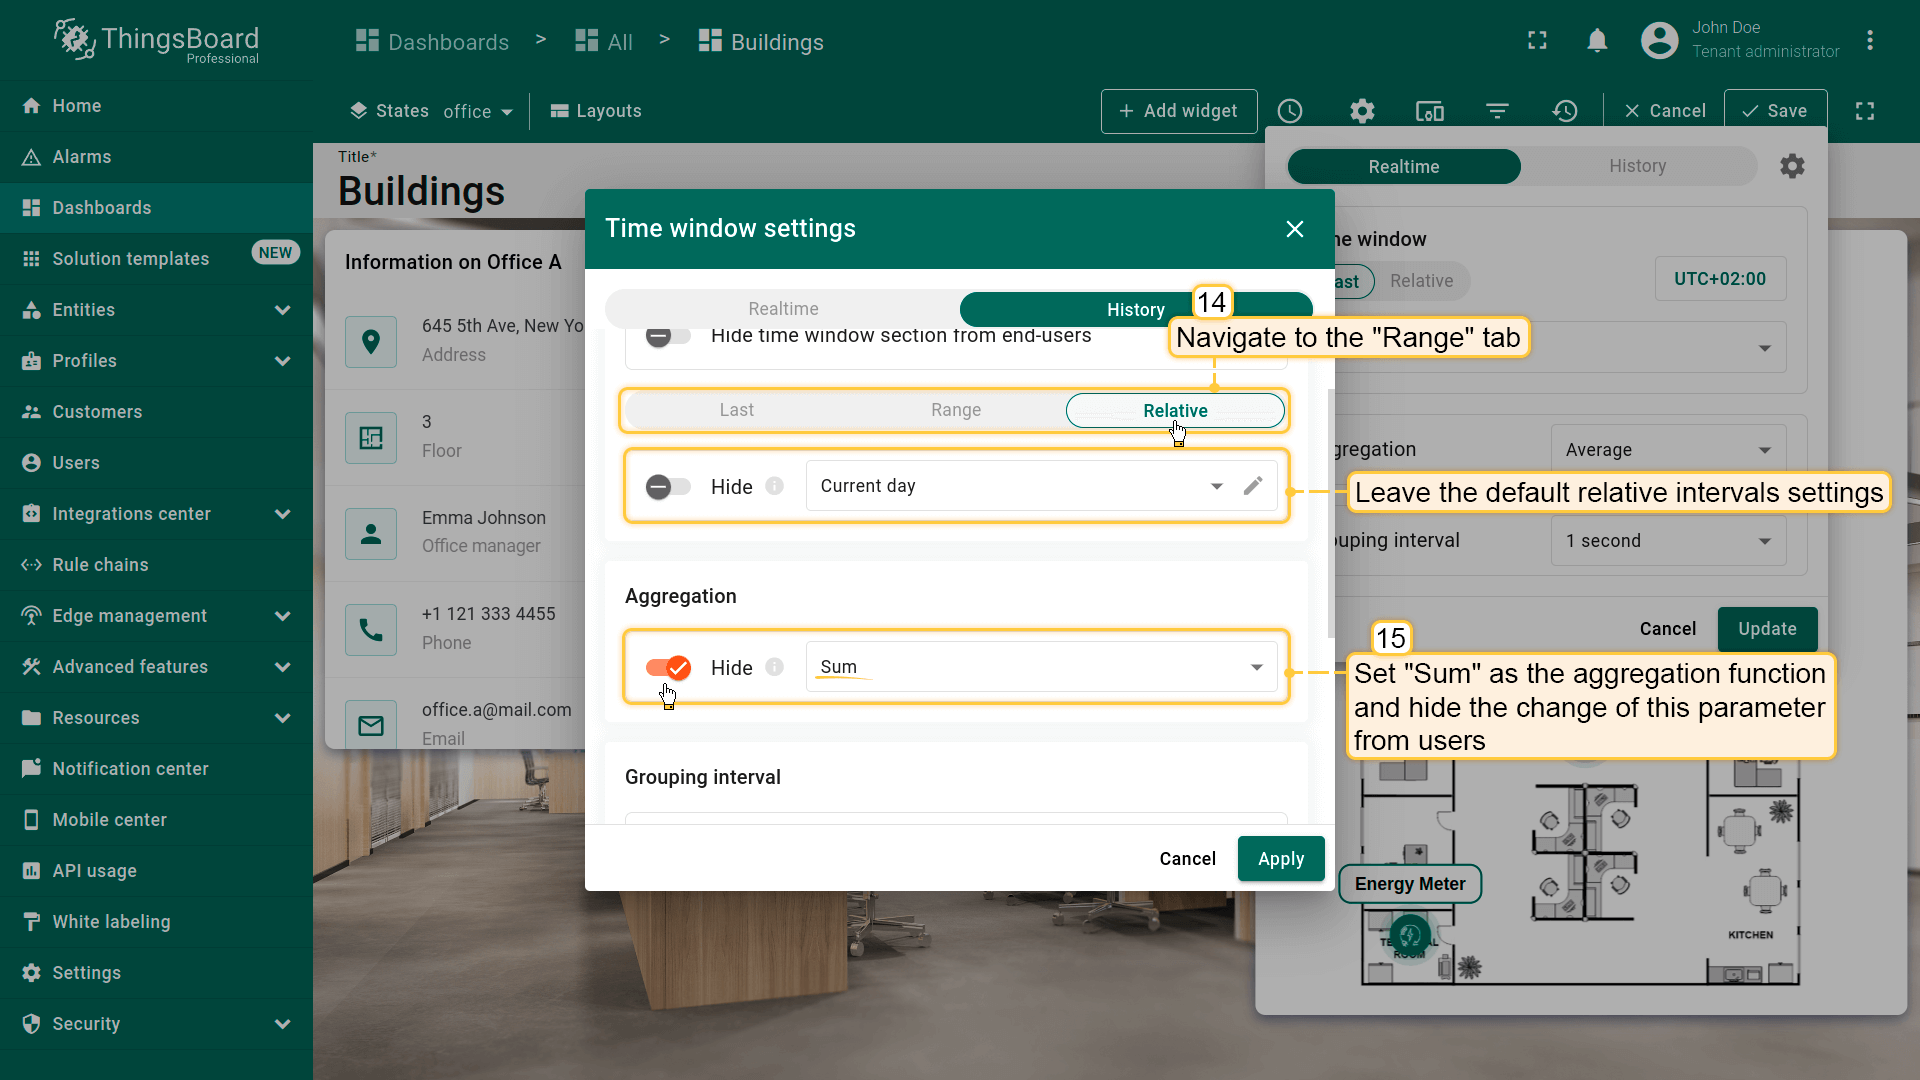
- Navigate to the “History” tab, and hide the “Last” and “Range” interval options from users;
- For the “Relative” tab, leave the default settings;
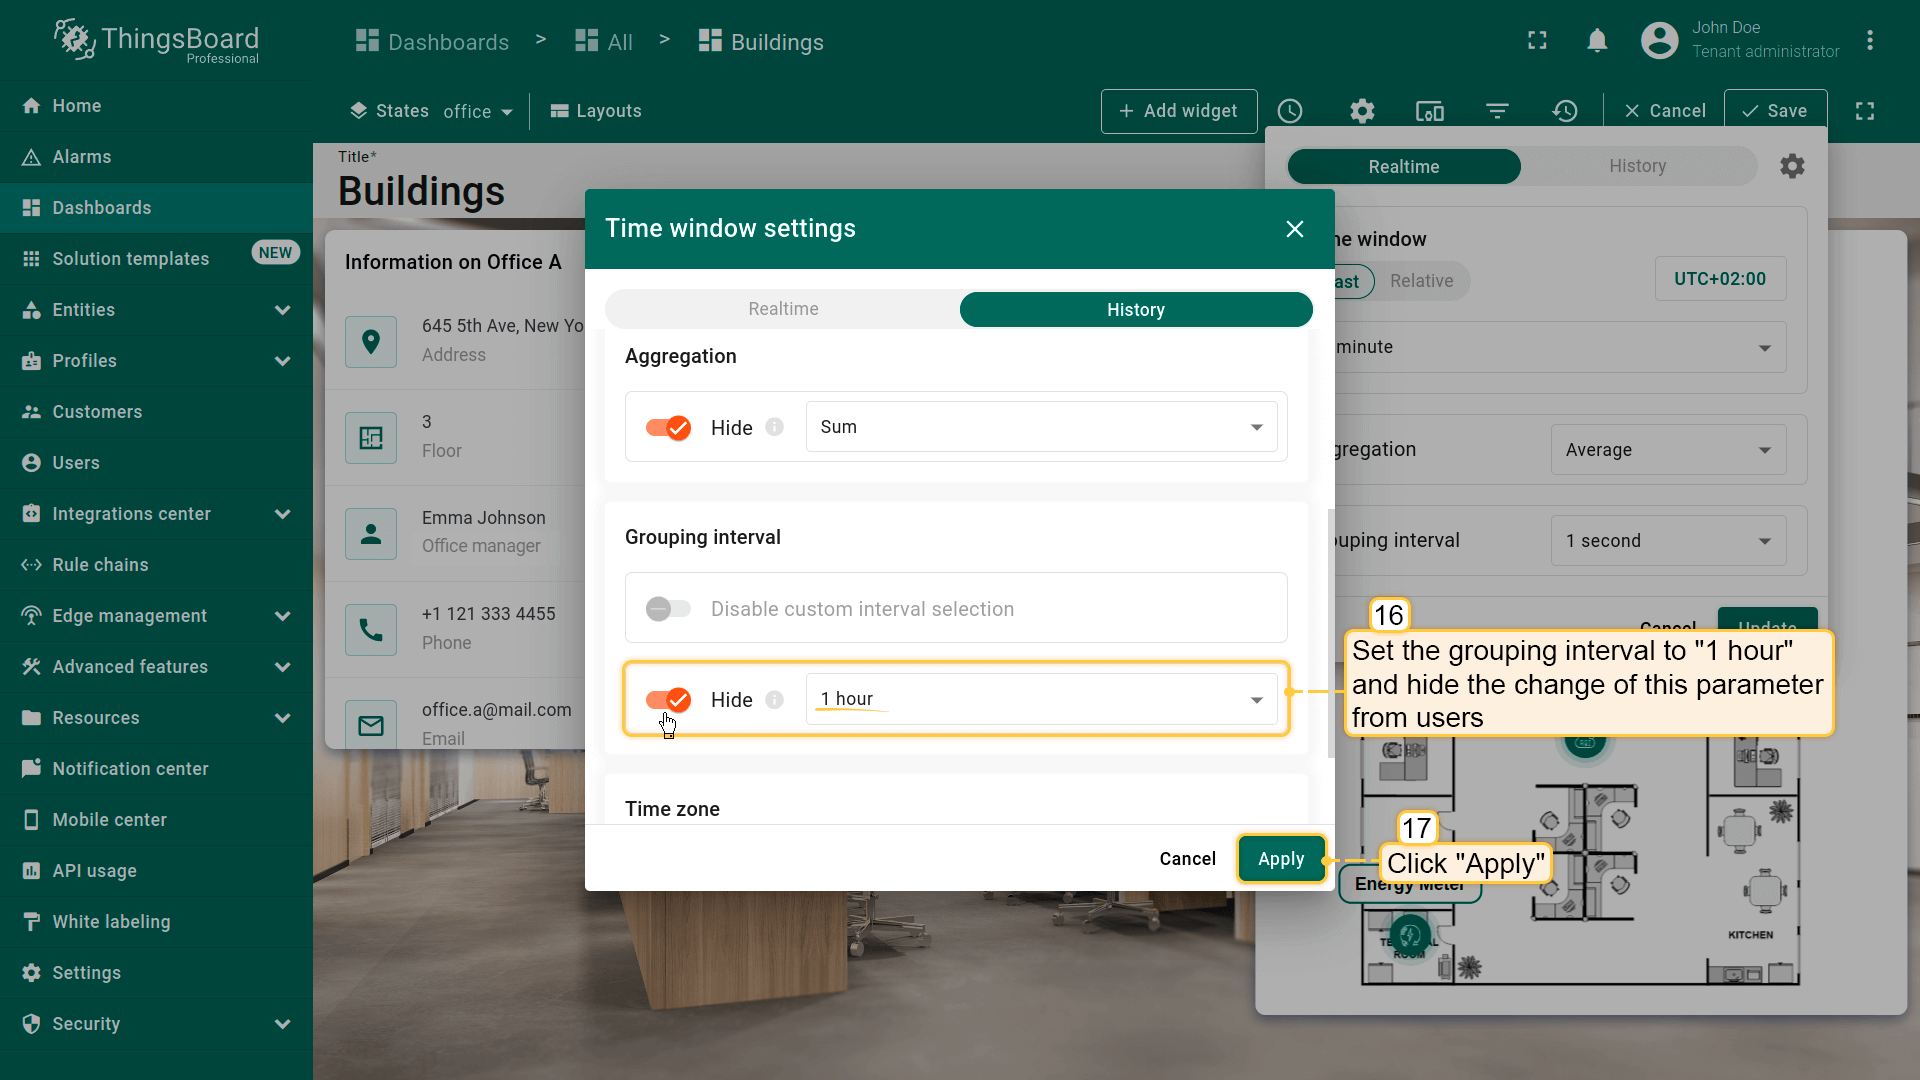
- Set “Sum” as the aggregation function and ensure users cannot modify this parameter by hiding it;
- Configure the grouping interval to “1 hour” and restrict users from changing it.
- Click “Apply” to save the time window adjustments;
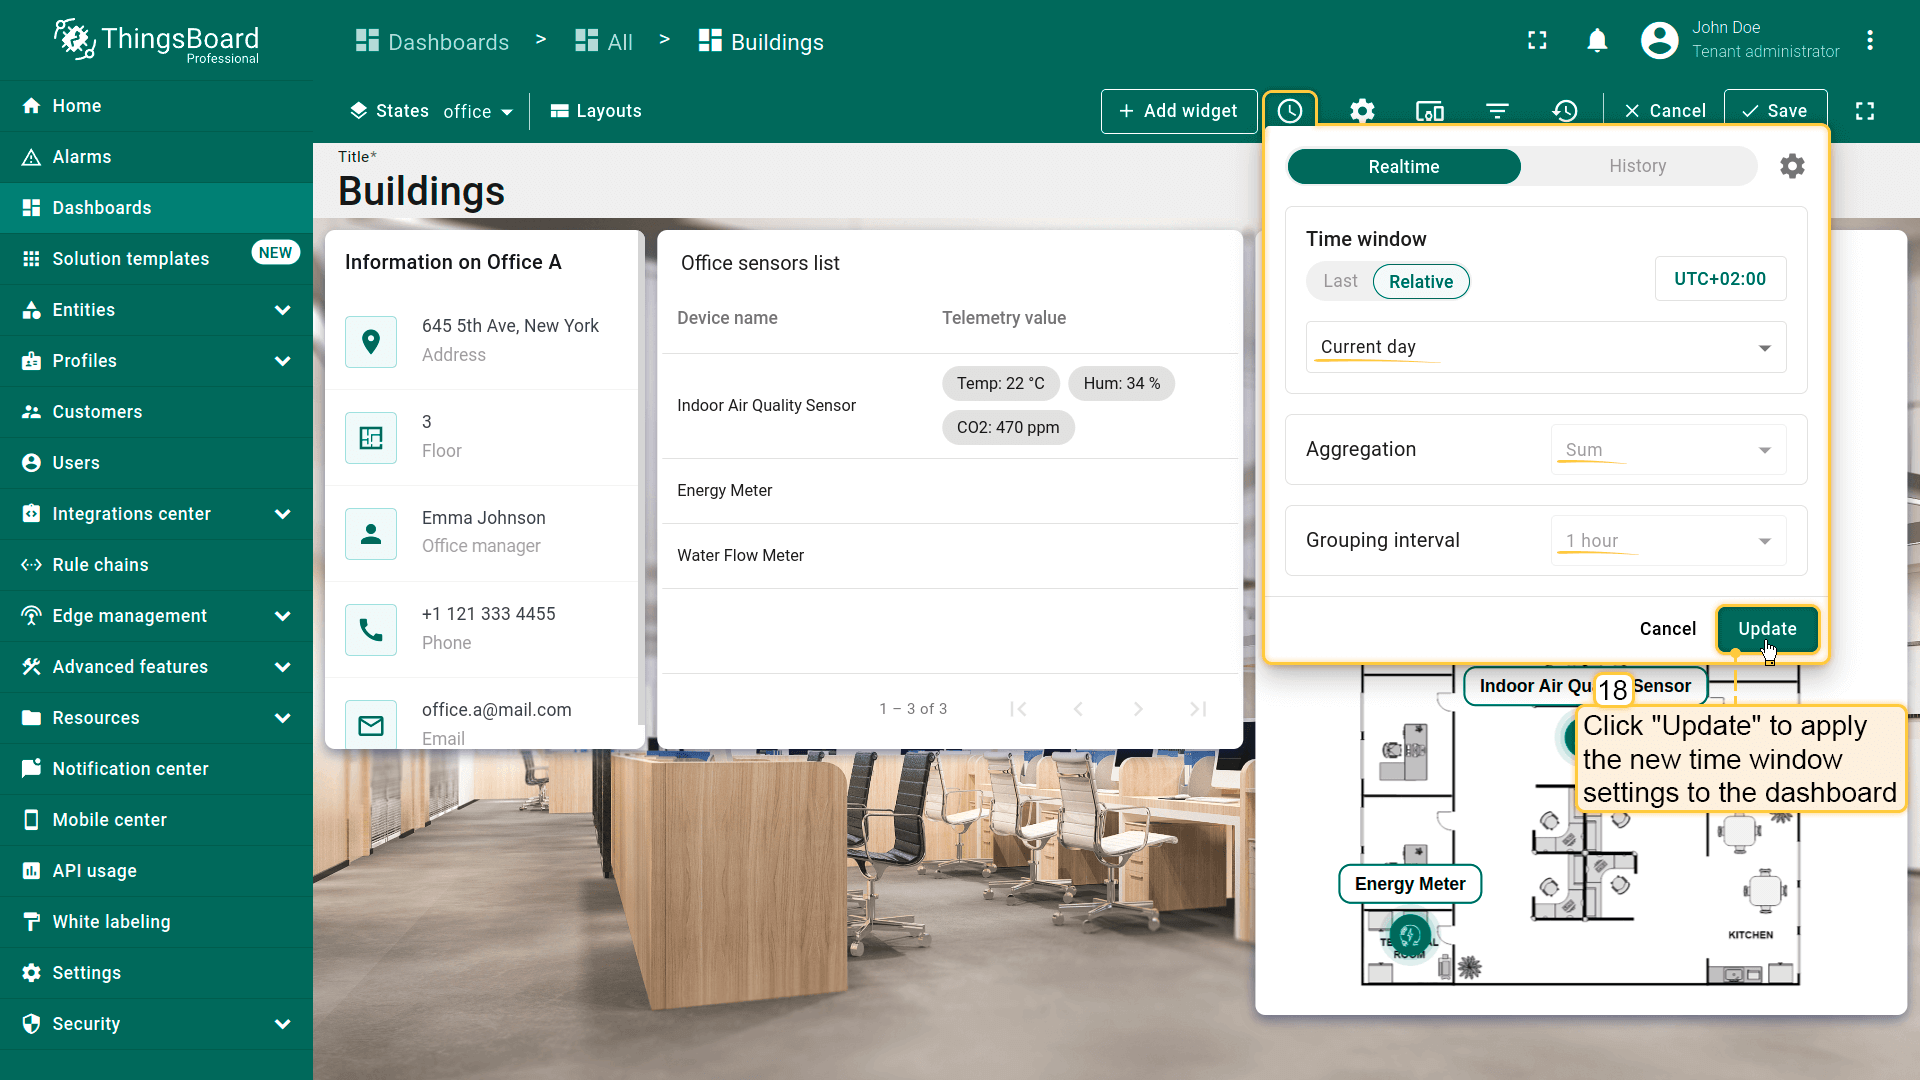
- Select “Update” to apply the updated time window settings to the dashboard;
- Save the dashboard to confirm the changes.
As you can see, the “Office sensors list” widget now displays data on the office's energy and water consumption for the selected time period, which in our case is the current day.
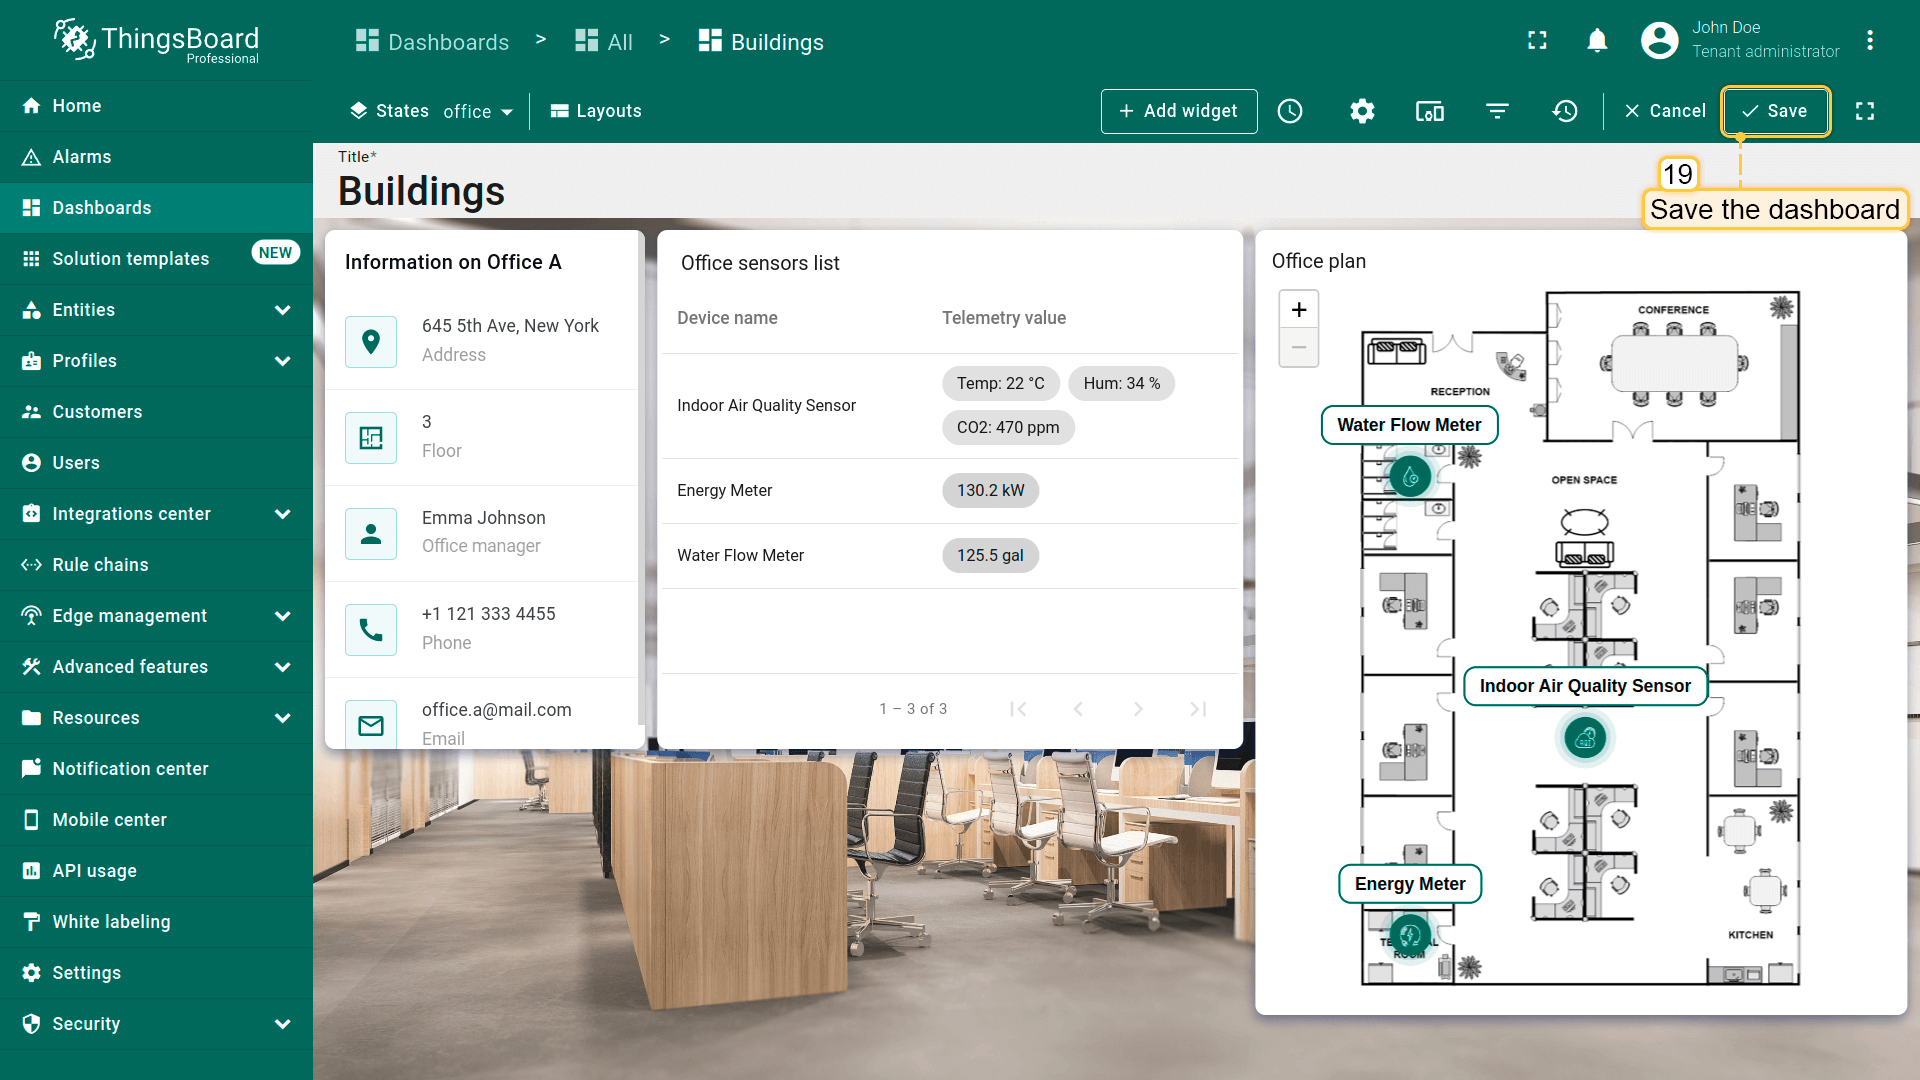
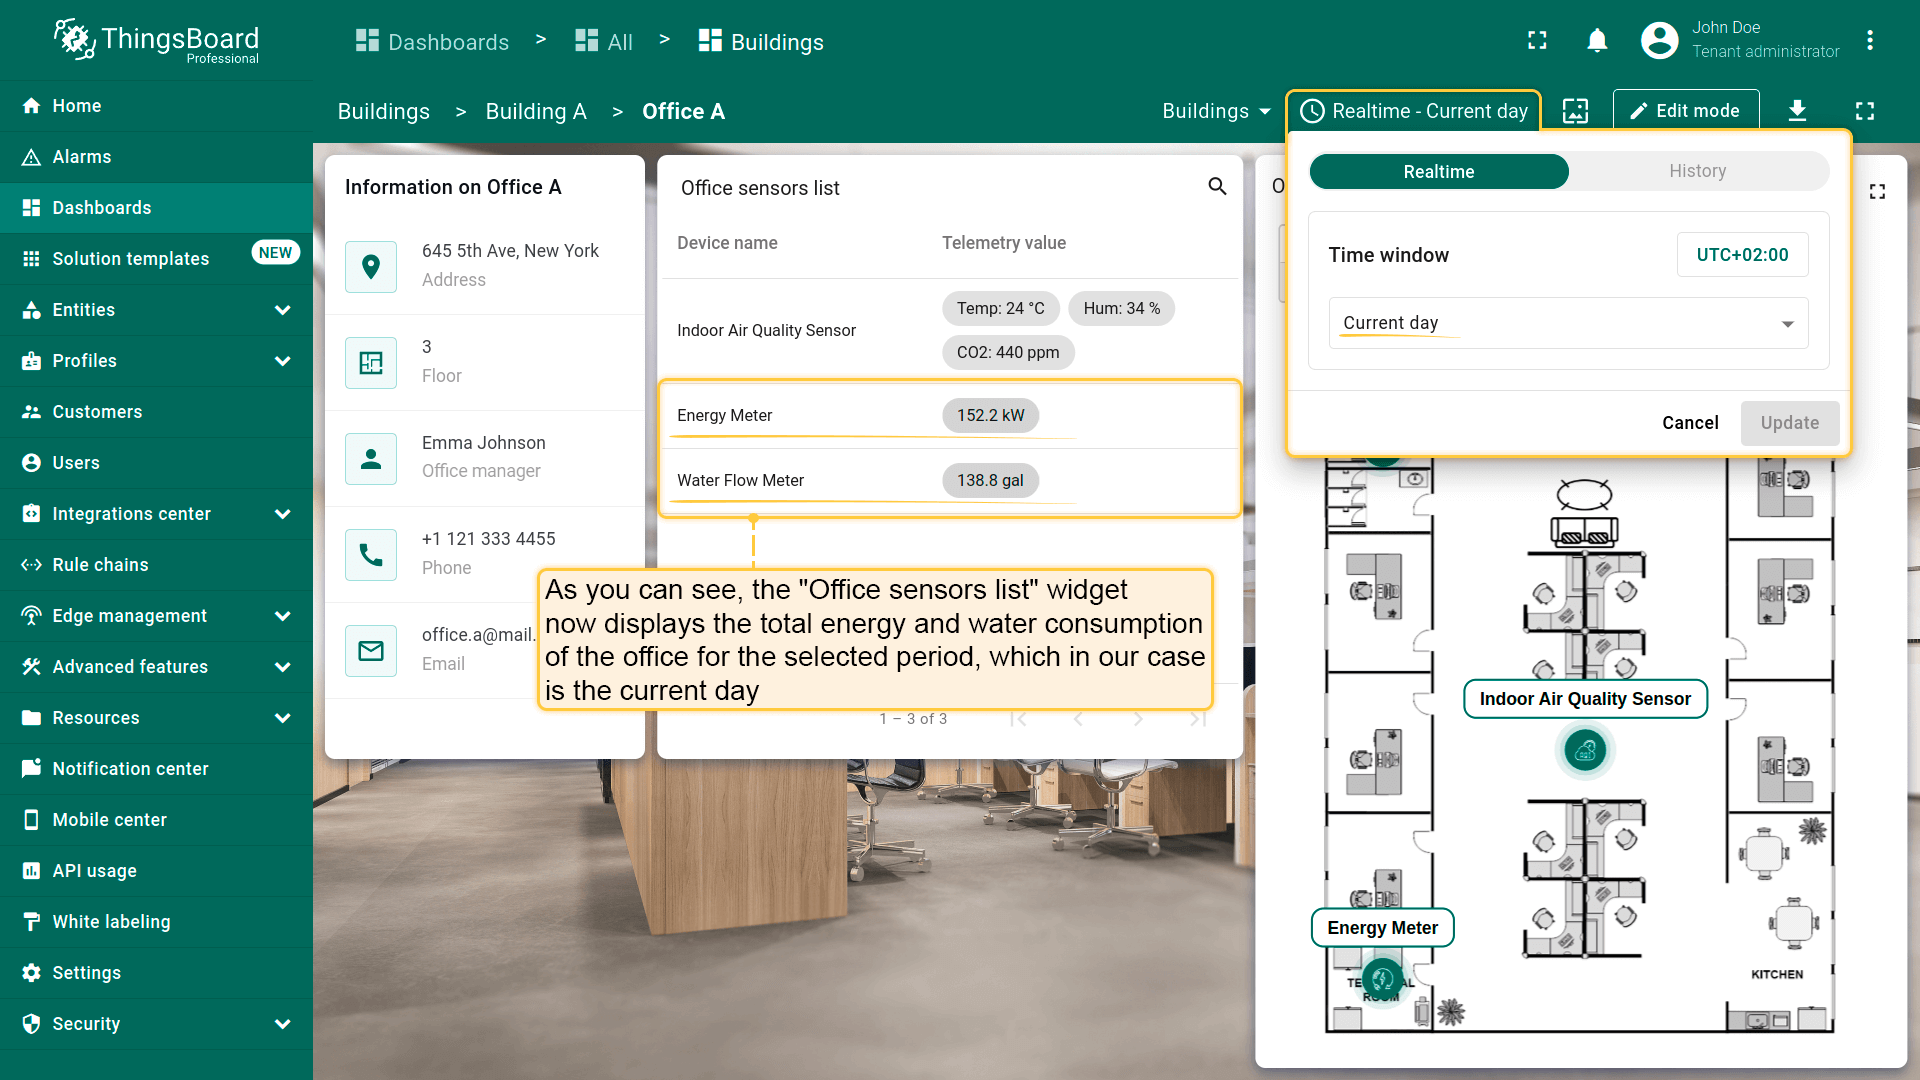
This configuration ensures that all widgets using the dashboard's time window will display the aggregated telemetry values for the current day (or another selected interval) grouped by the hour.
Adding state for each device & navigation between states
Now we need to add separate states for each of our devices and set up transitions from the “Office sensors list” and “Office plan” widgets to these states.
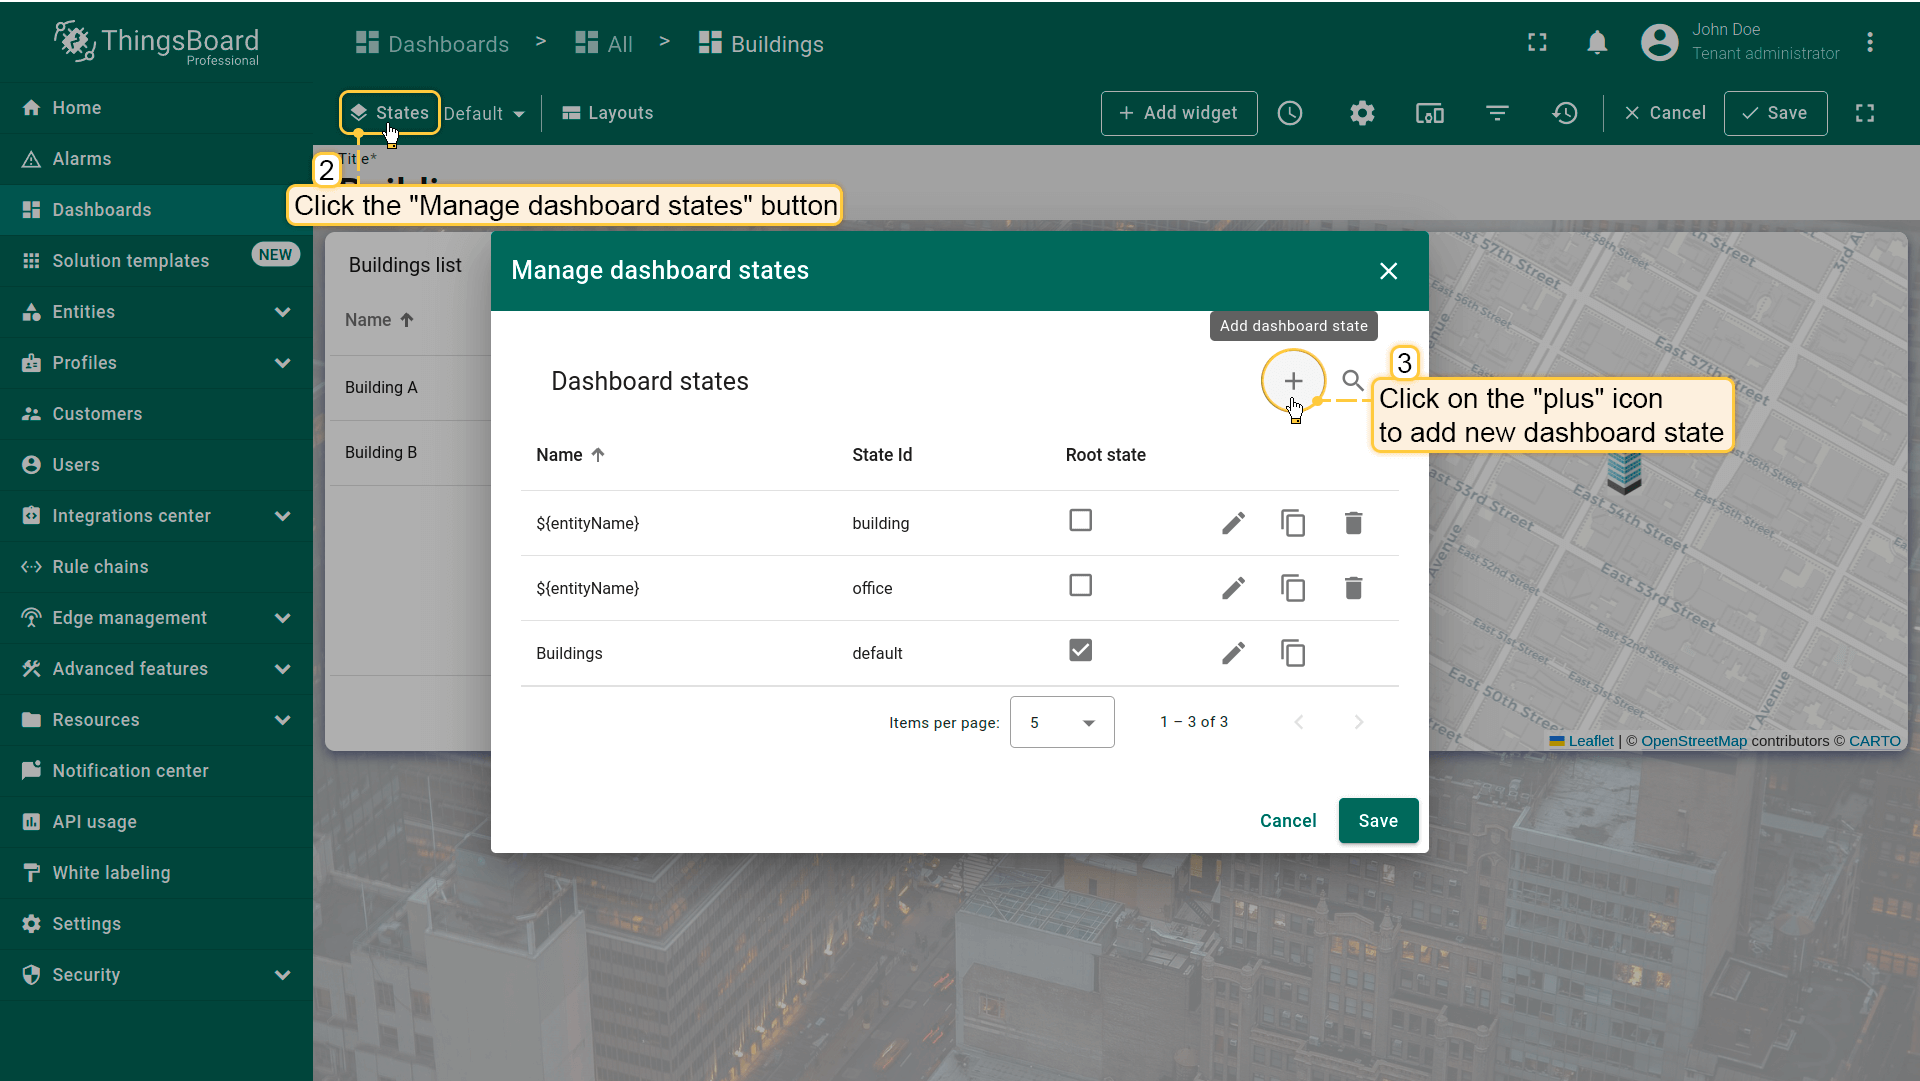
- 进入仪表板编辑模式;
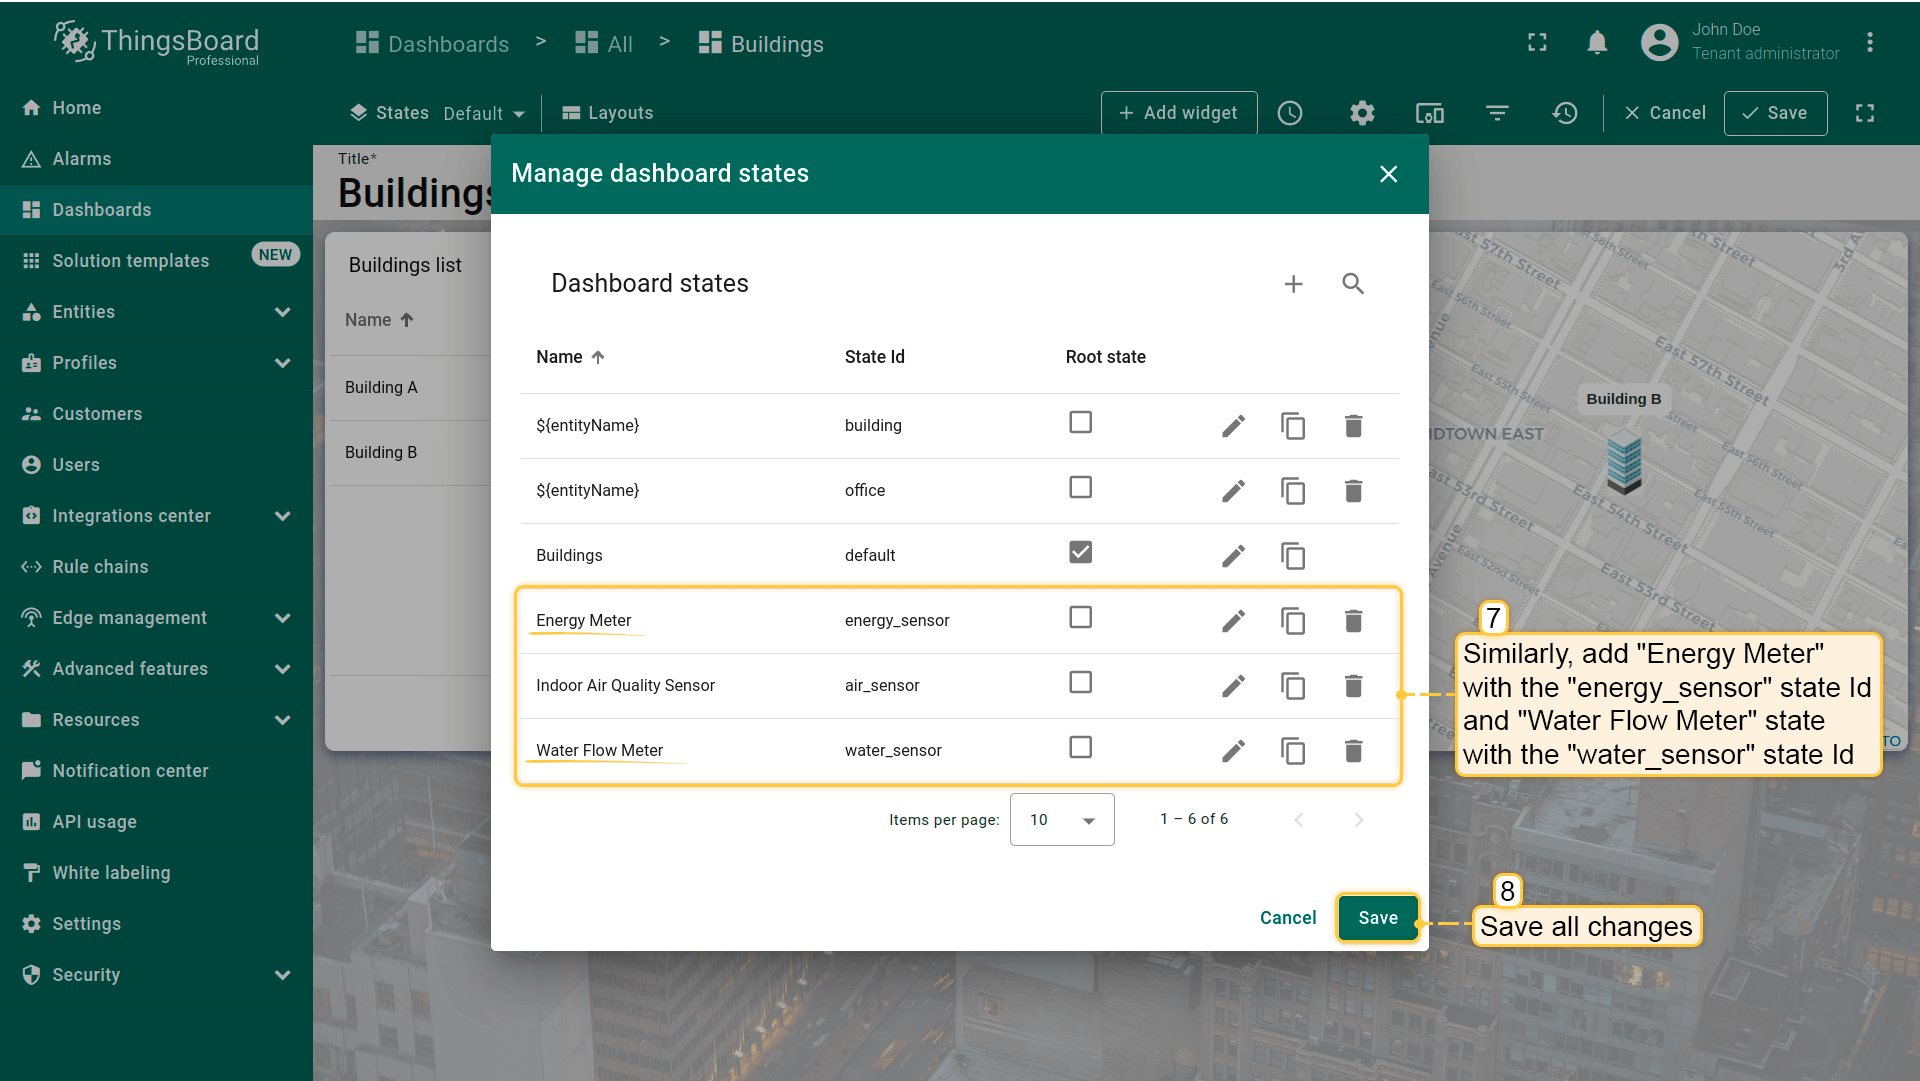
- 点击「Manage dashboard states」菜单项,然后点击「加号」图标添加新仪表板状态;
- 命名为「Indoor Air Quality Sensor」,输入状态 ID:air_sensor。点击「Add」。
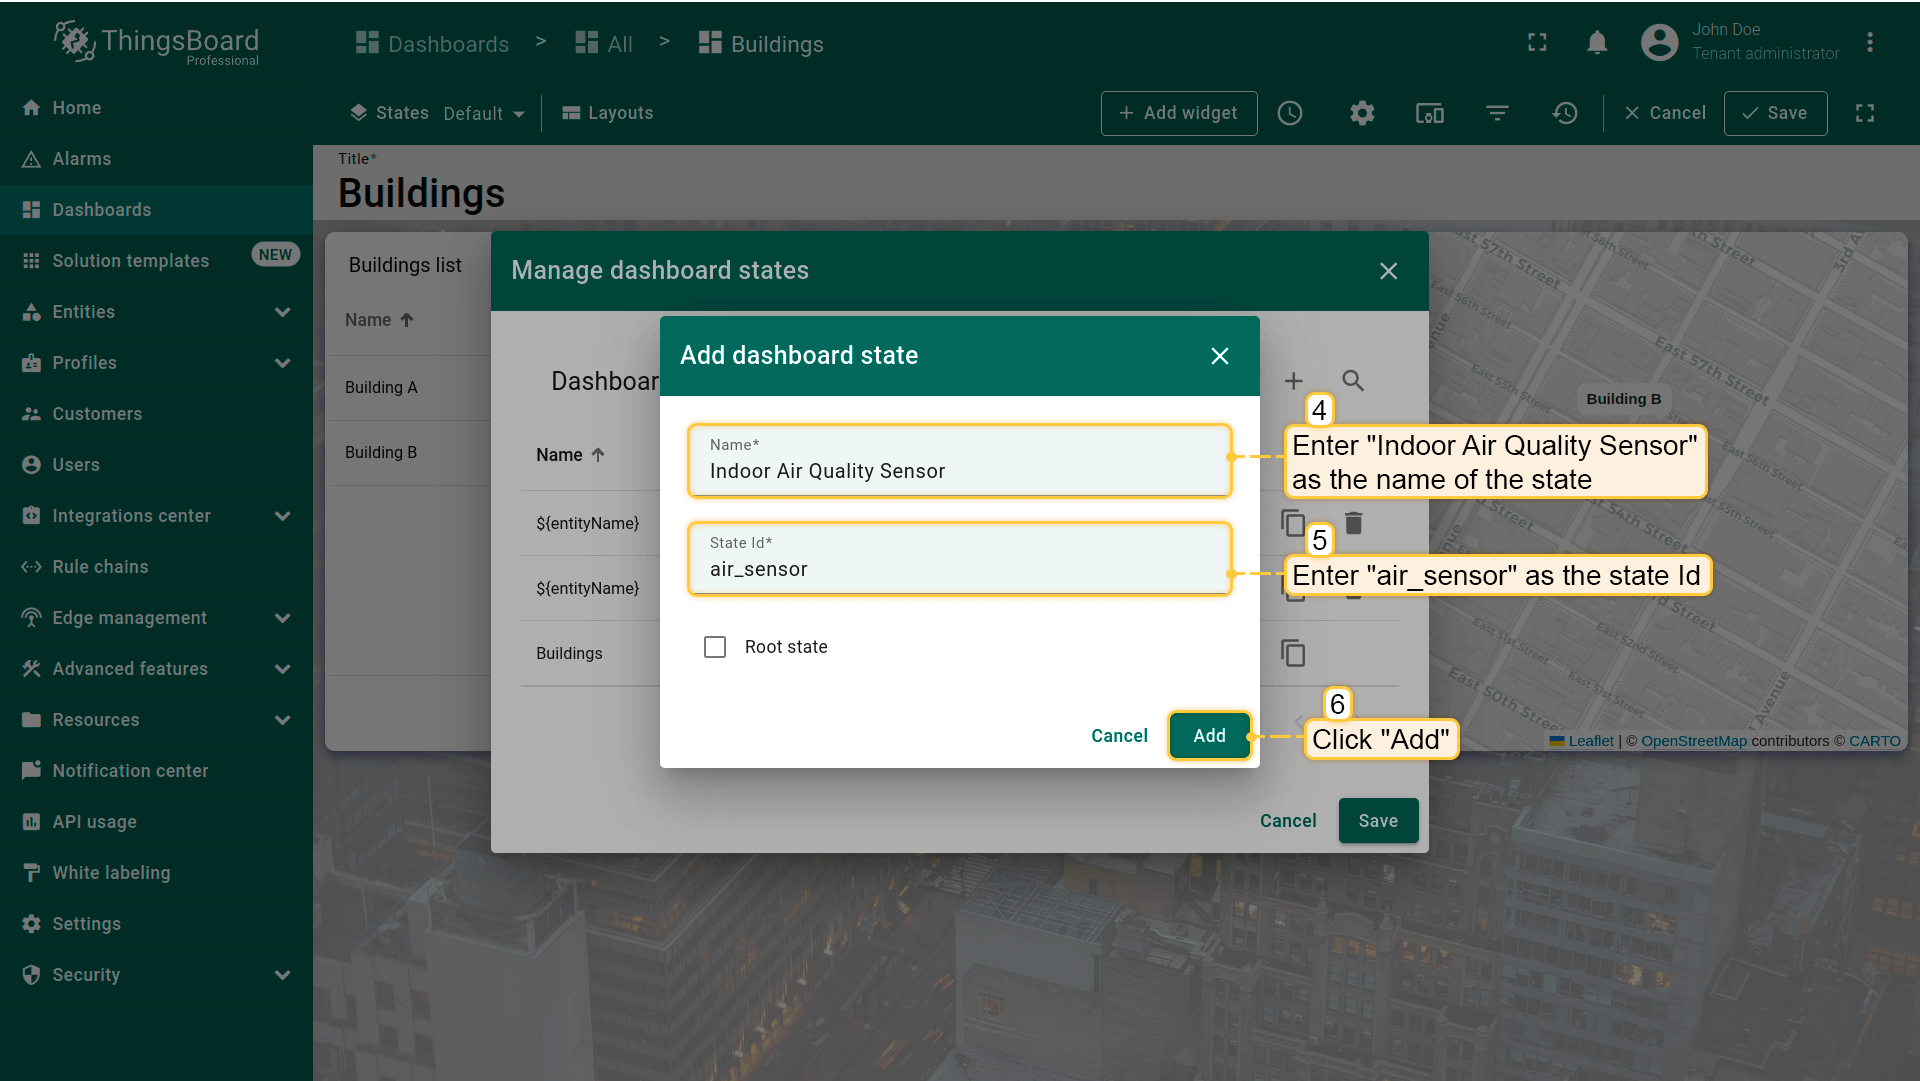
Similarly, add “Energy Meter” state with the energy_sensor state Id and “Water Flow Meter” state with the water_sensor state Id.
Customize Office sensors list widget
Now let's customize the “Office sensors list” widget by adding an action so that when you click on a device row, we transition to its state.
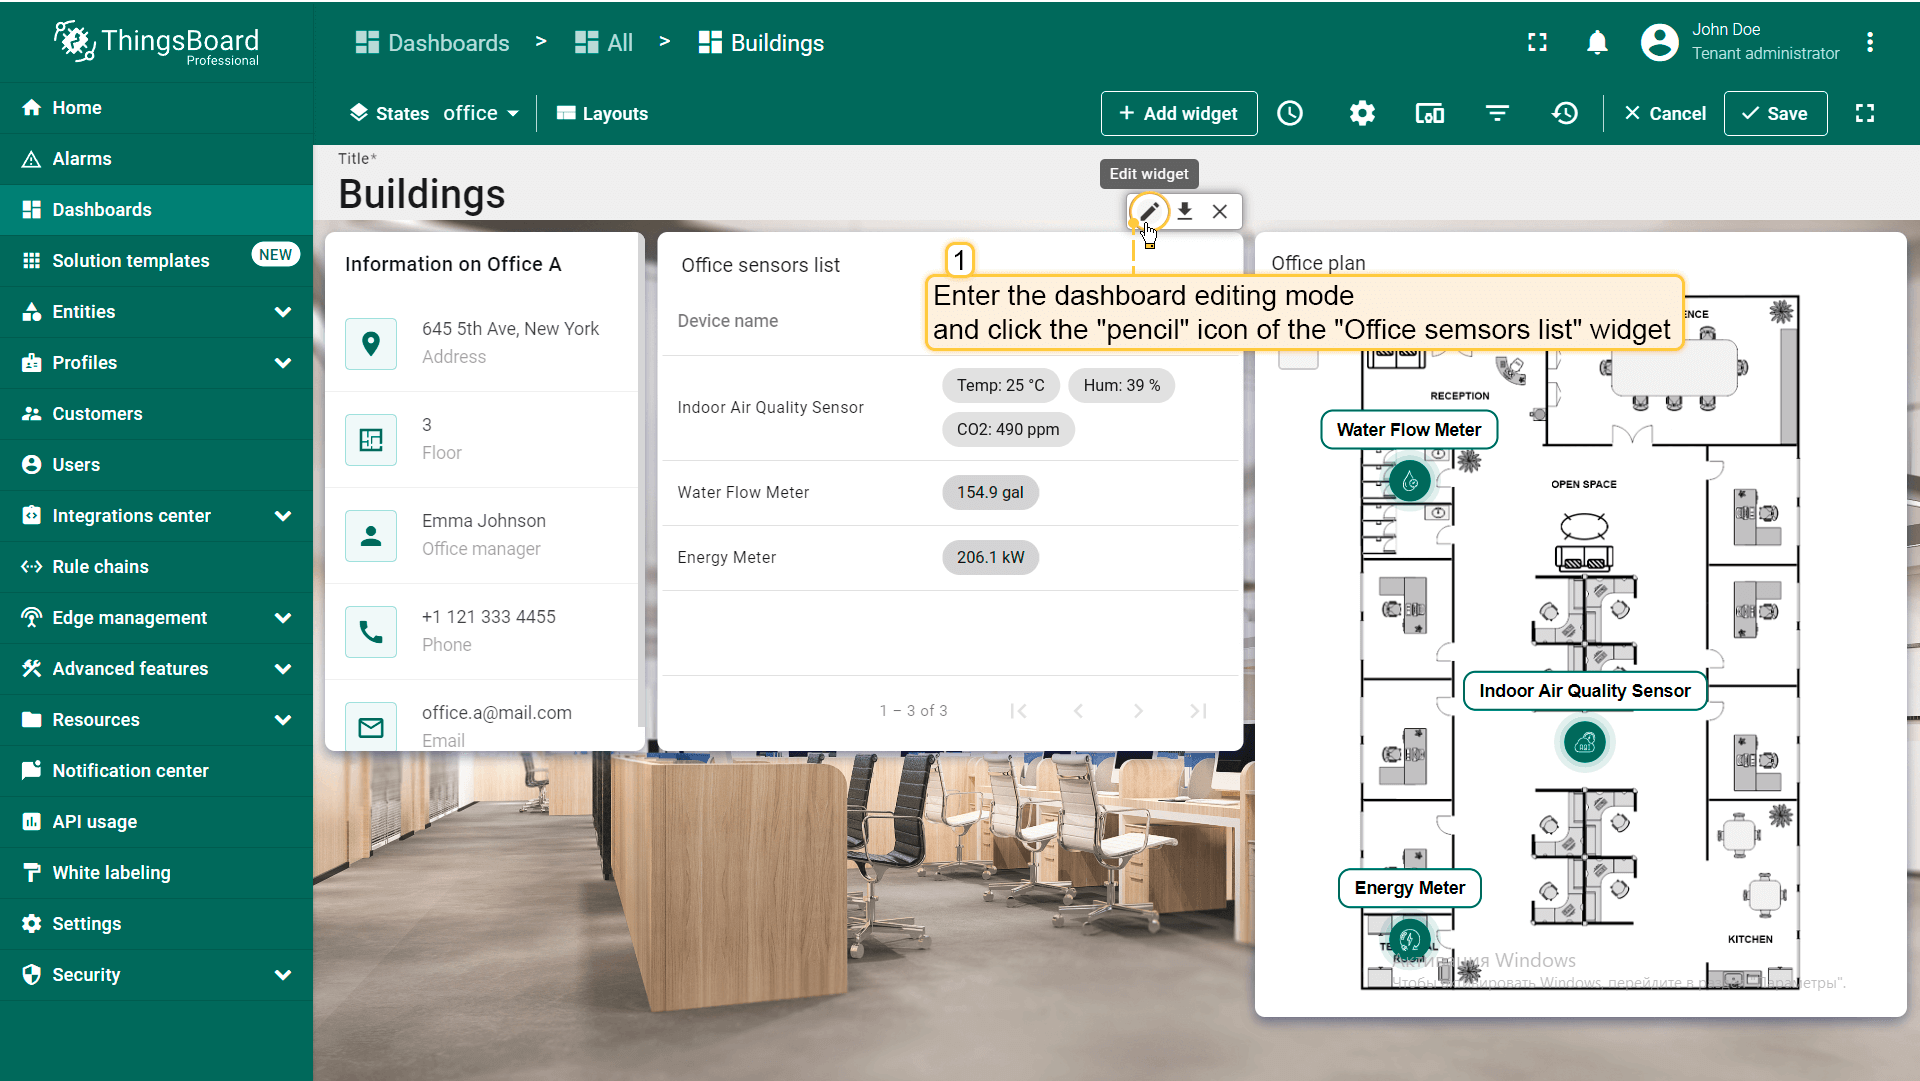
- Go to the “office” state and enter editing mode of the “Office sensors list” widget;
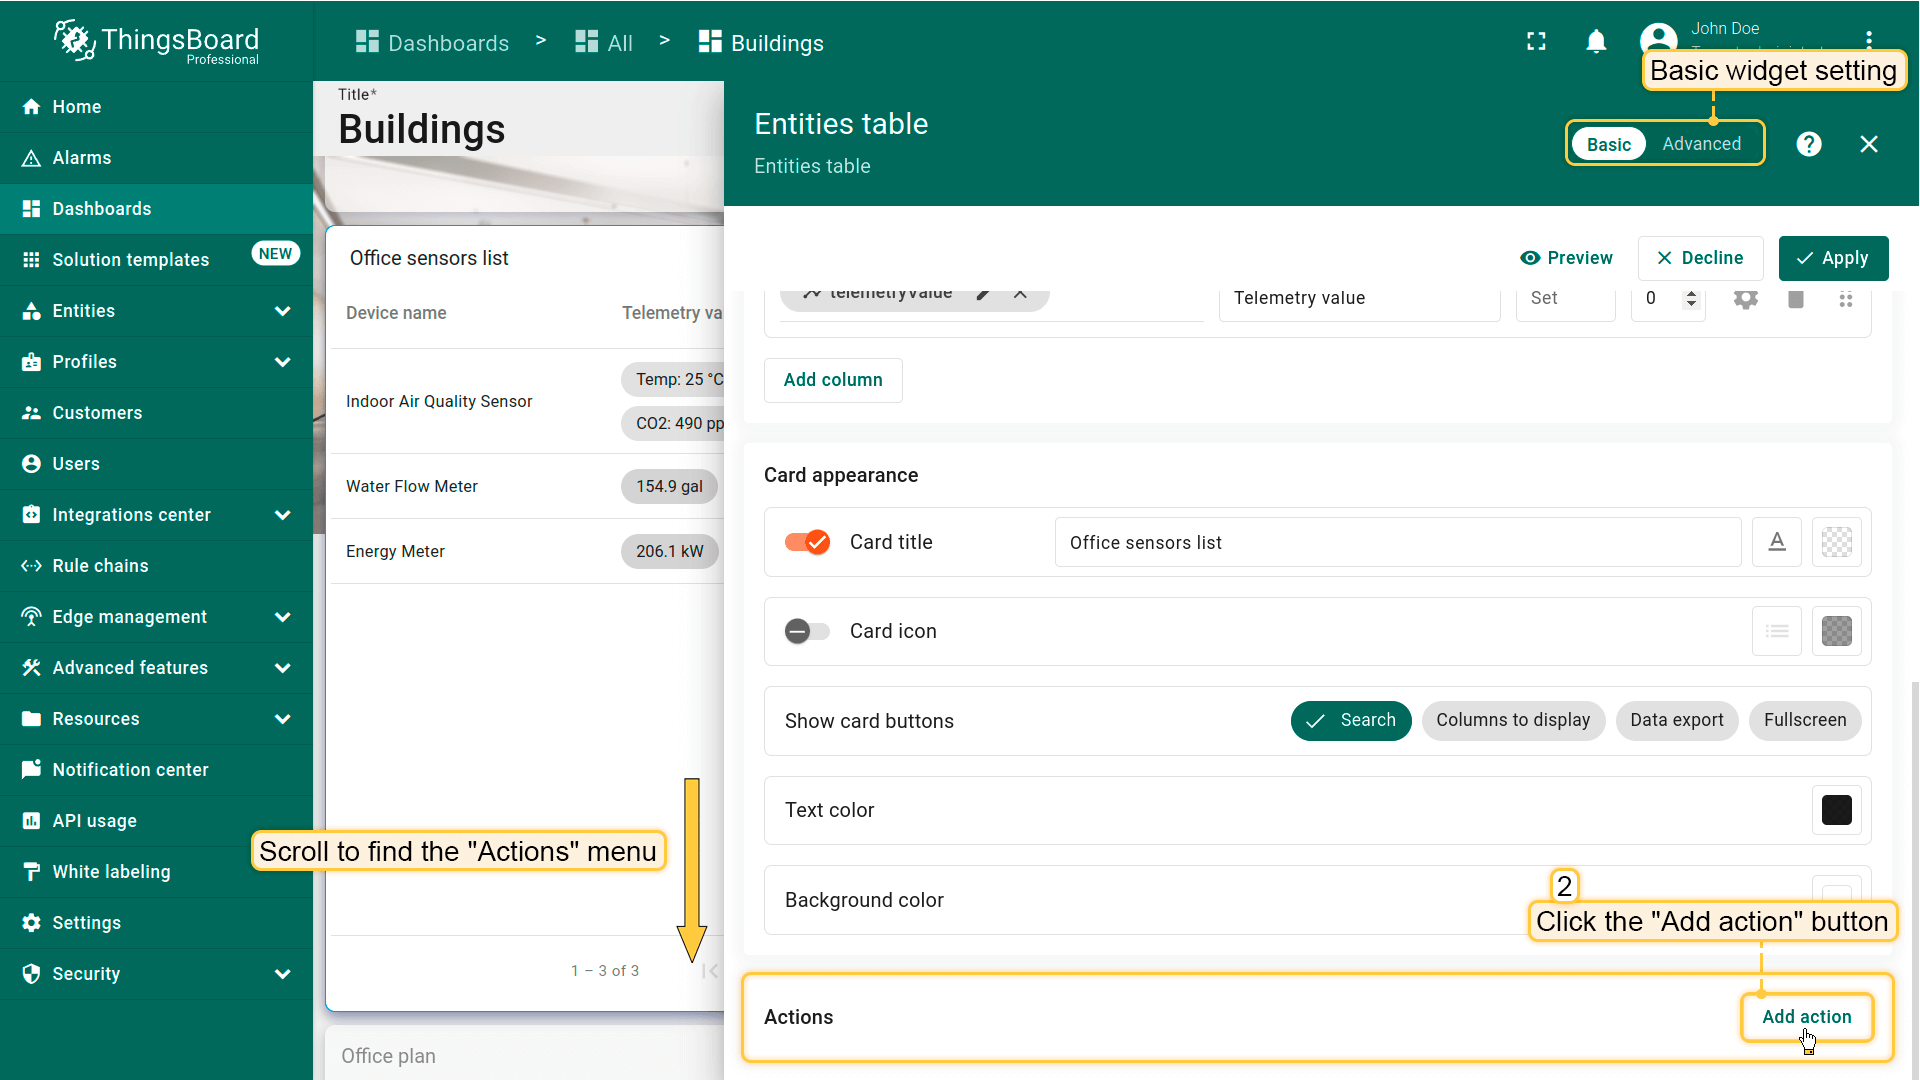
- Scroll to the “Actions” menu section and click the “Add action” button;
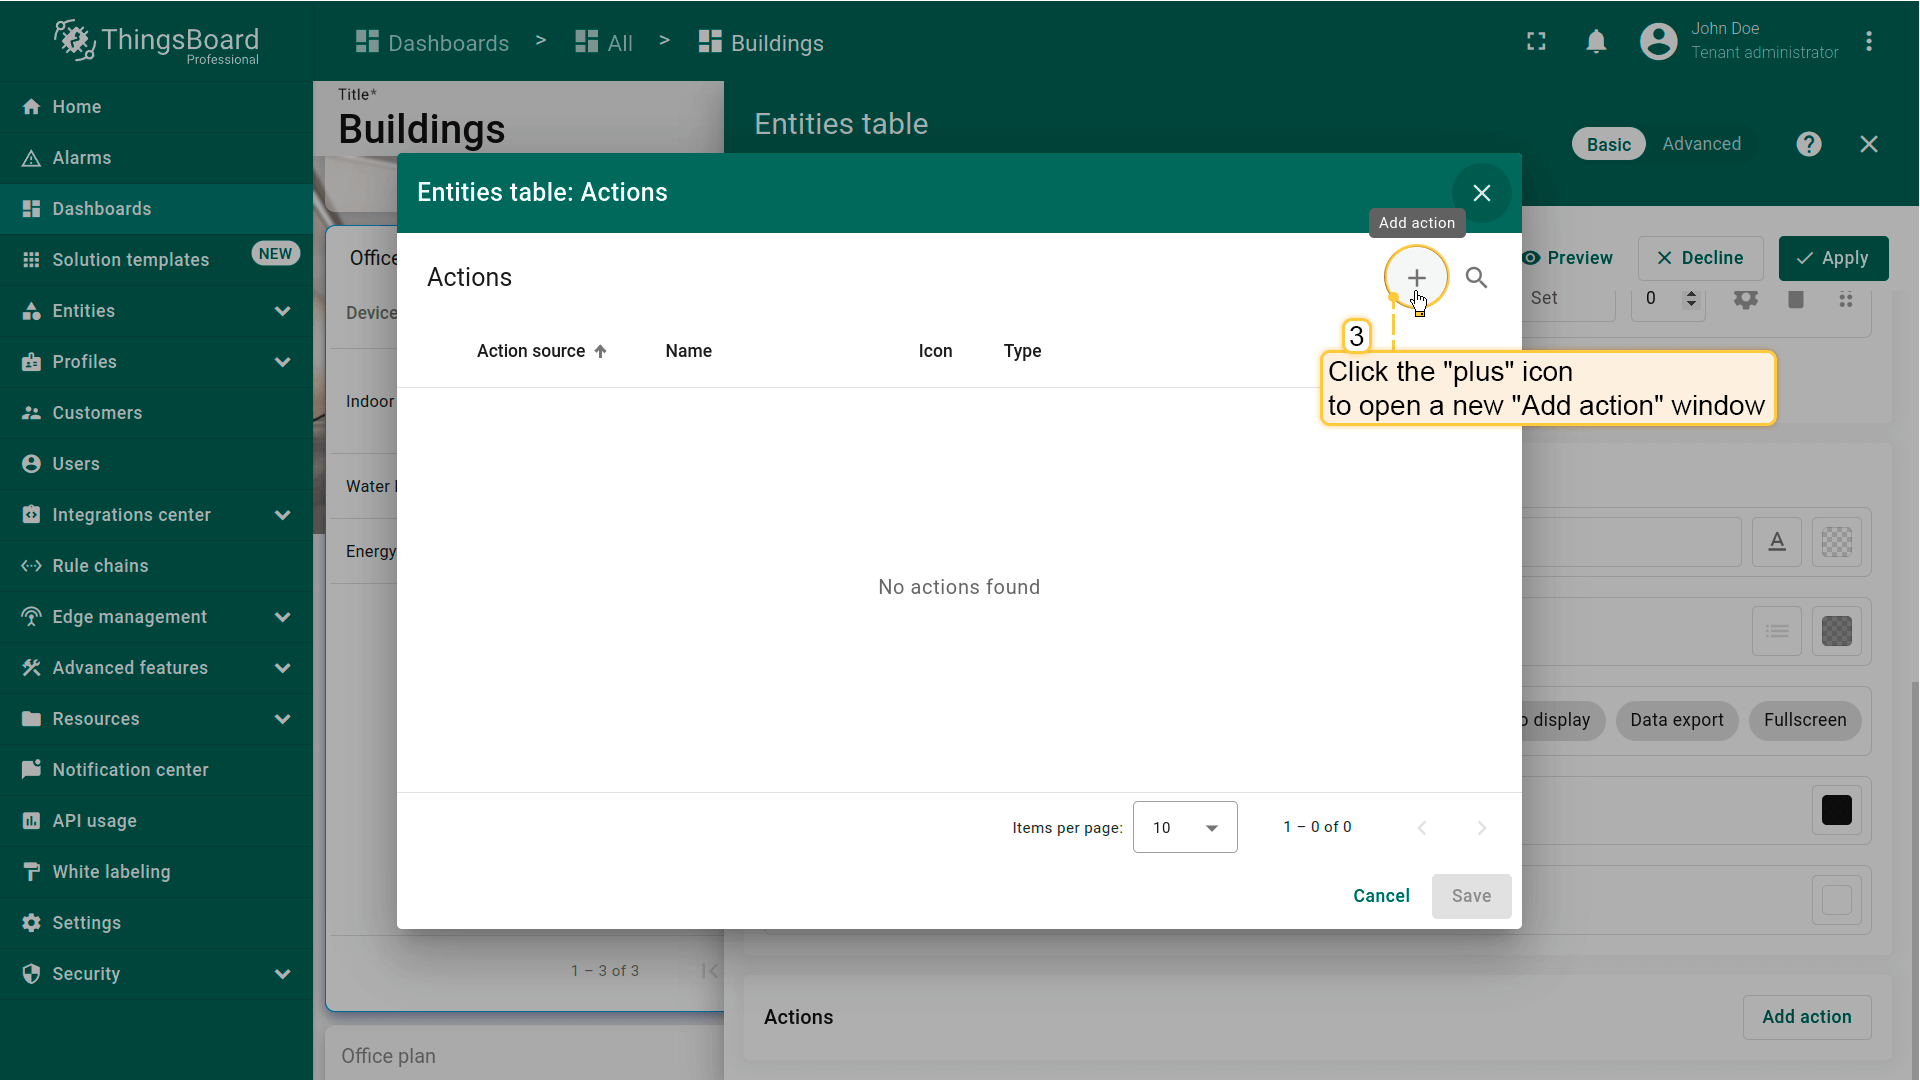
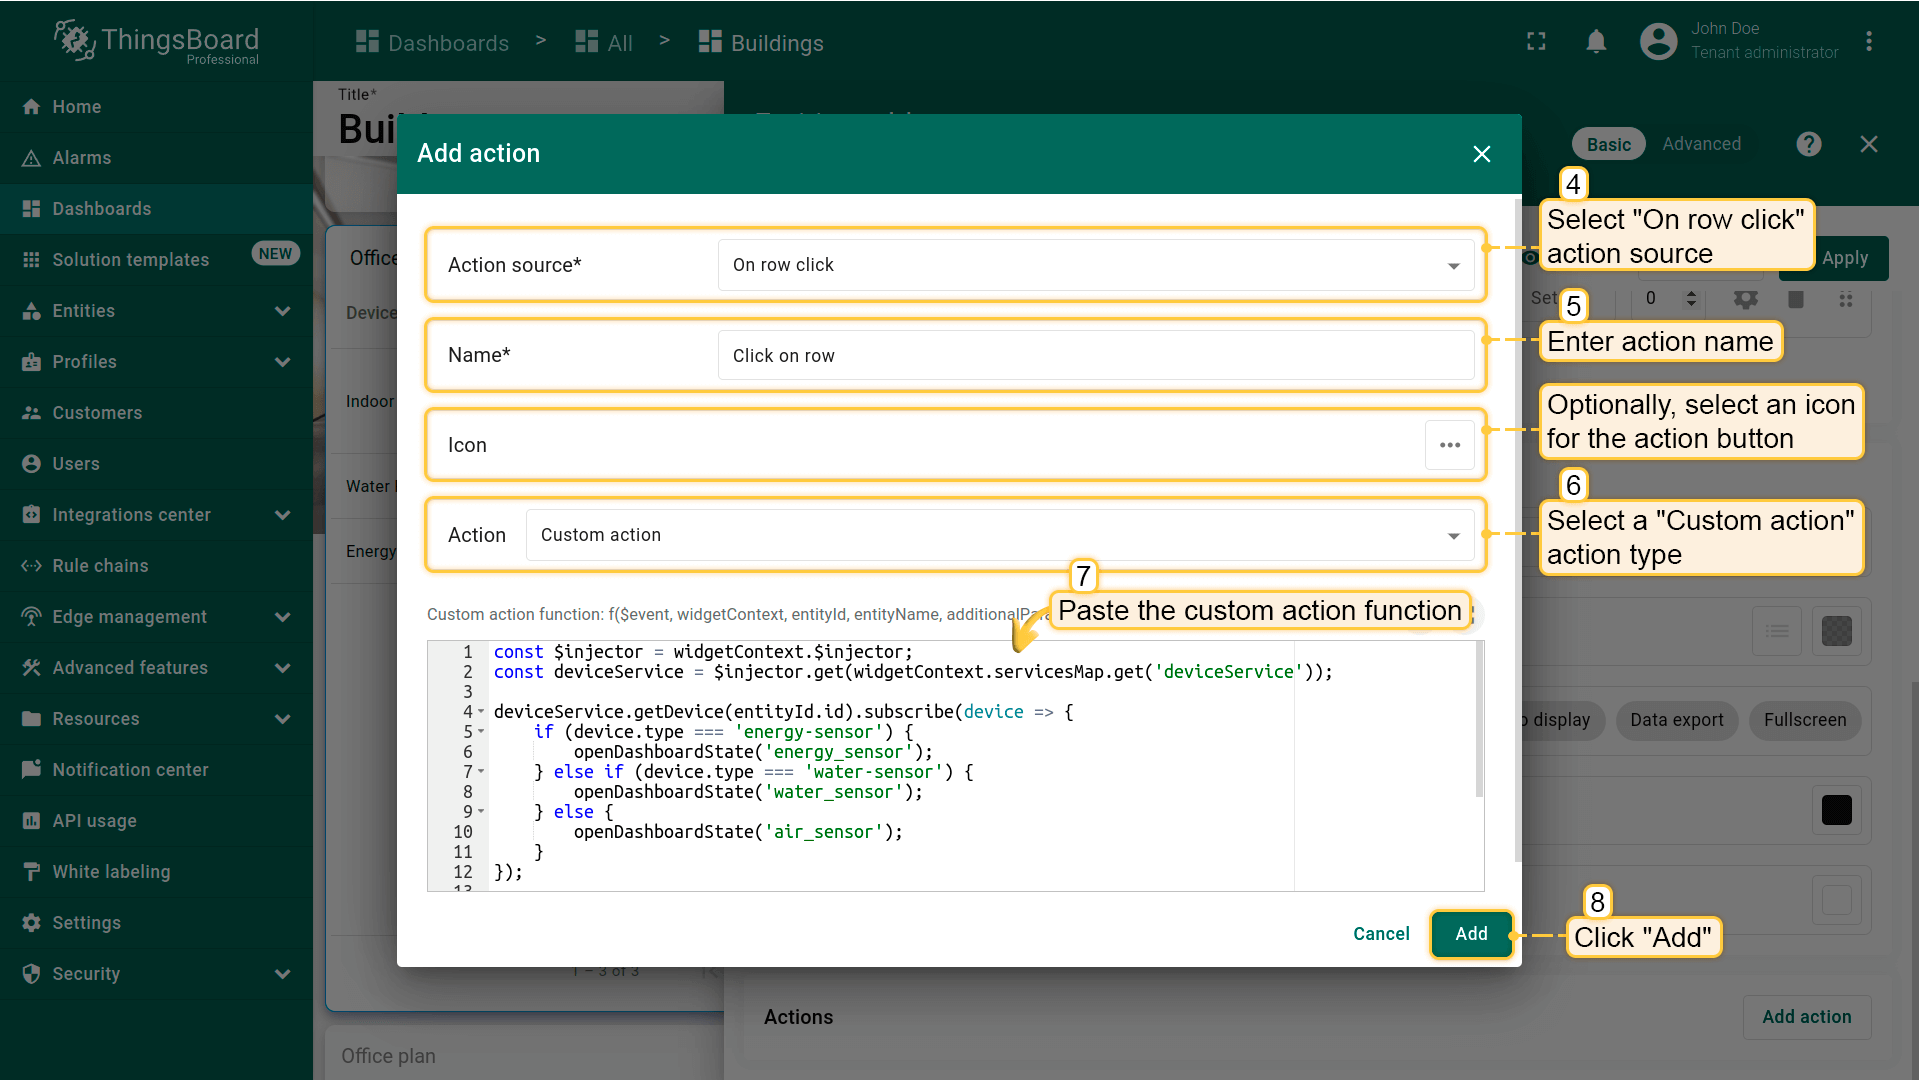
- The “Actions” window will open. Click the “plus” icon in the top-right corner of the screen. Complete the following steps in the “Add action” dialog:
- Select “On row click” action source;
- Enter action name;
- Choose the “Custom action” action type;
- After choosing an action type, the “Custom action function” section appears. Paste the function by copying it from the documentation. This function performs a transition to the dashboard state depending on the type (device profile) of the selected device.
Custom action function used in this example:
- Afterwards, click “Add”;
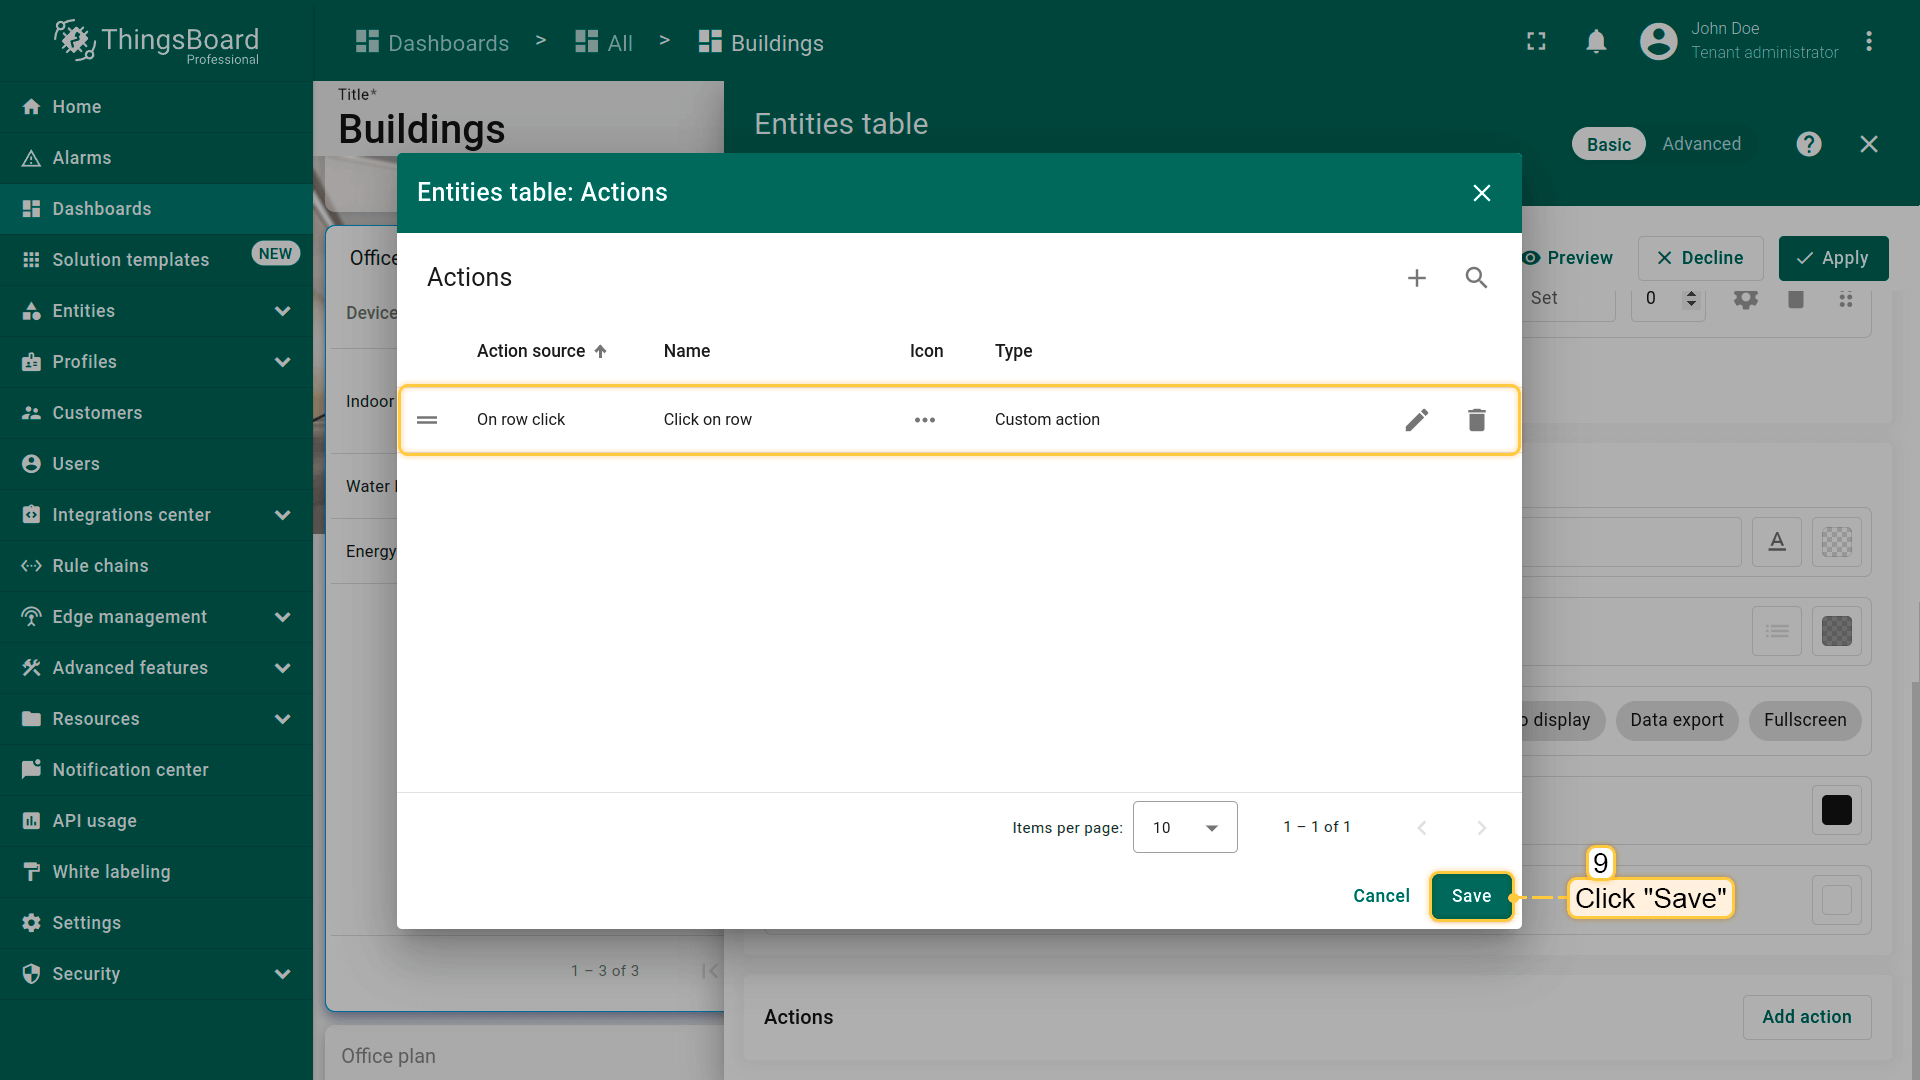
- In the “Actions” window, you can review the configured action, including its source, icon, and type. Click “Save”;
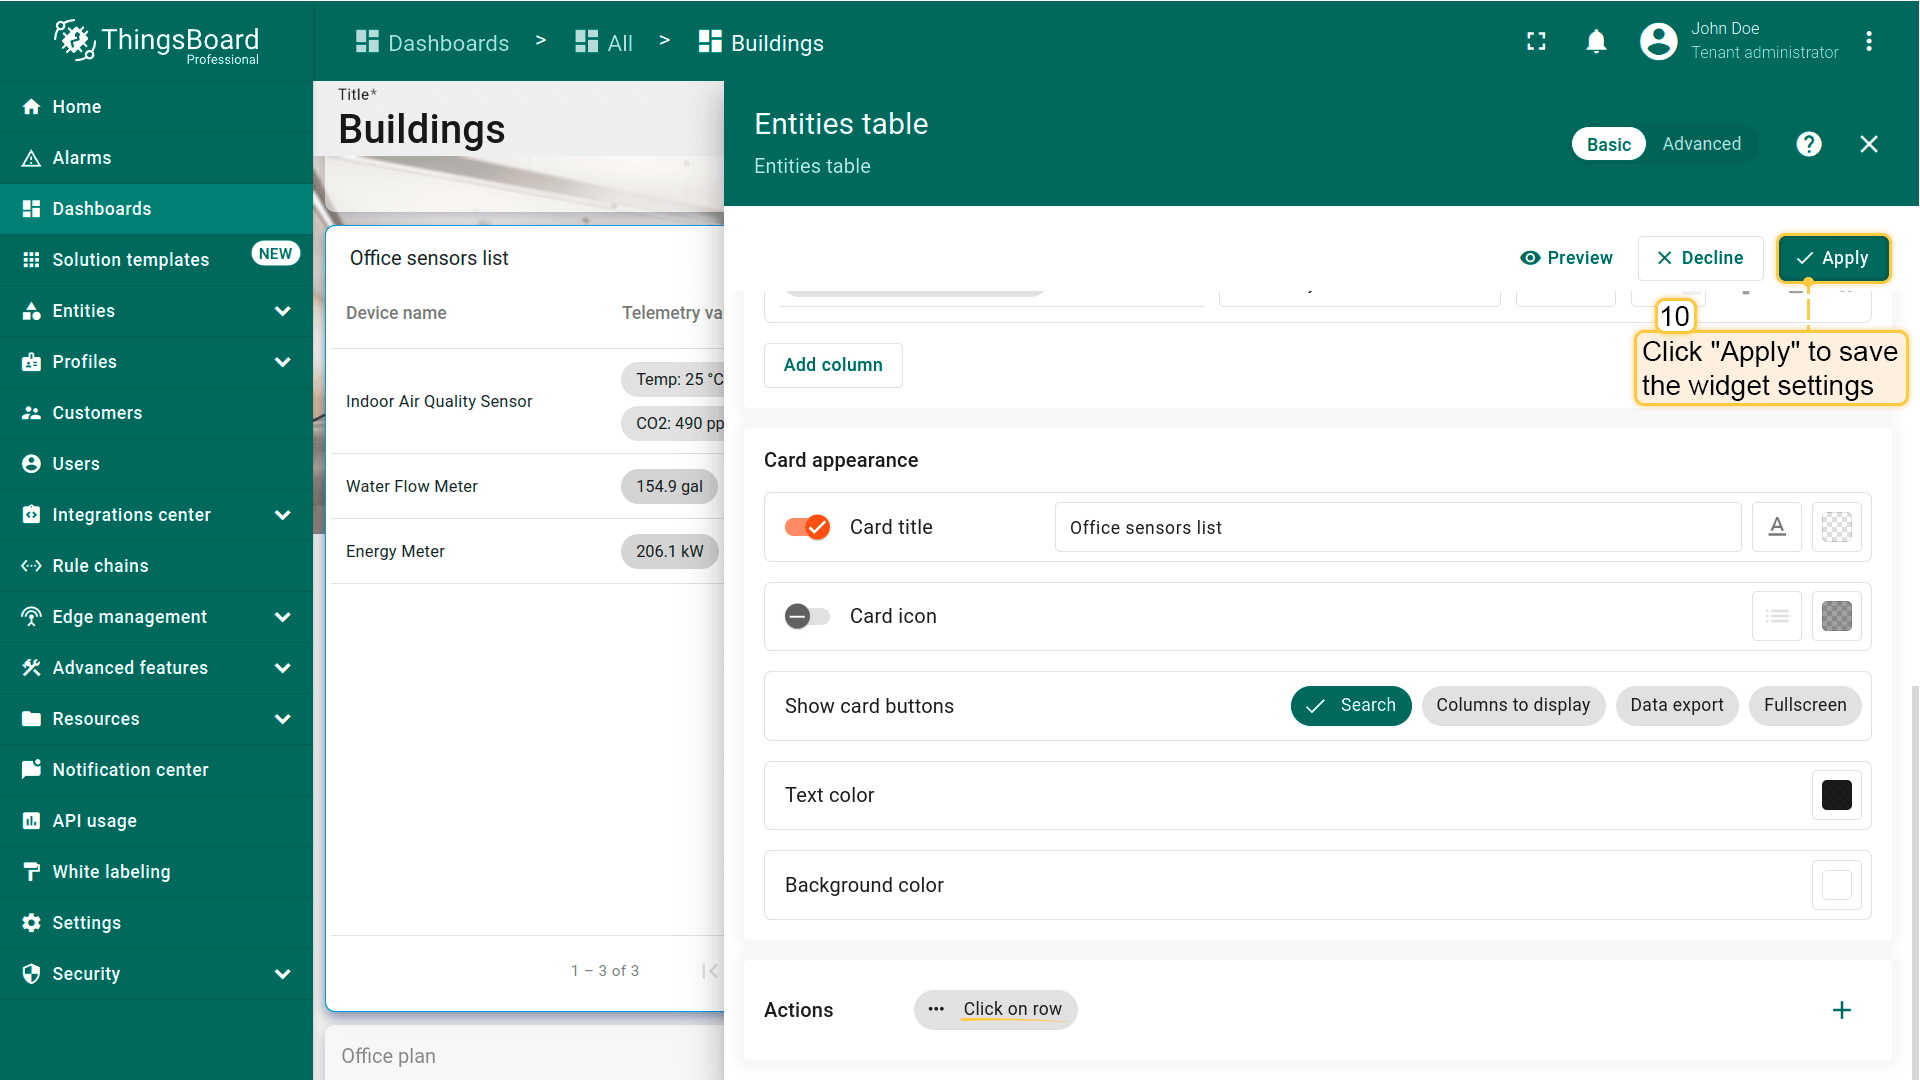
- Click “Apply” to save the widget settings;
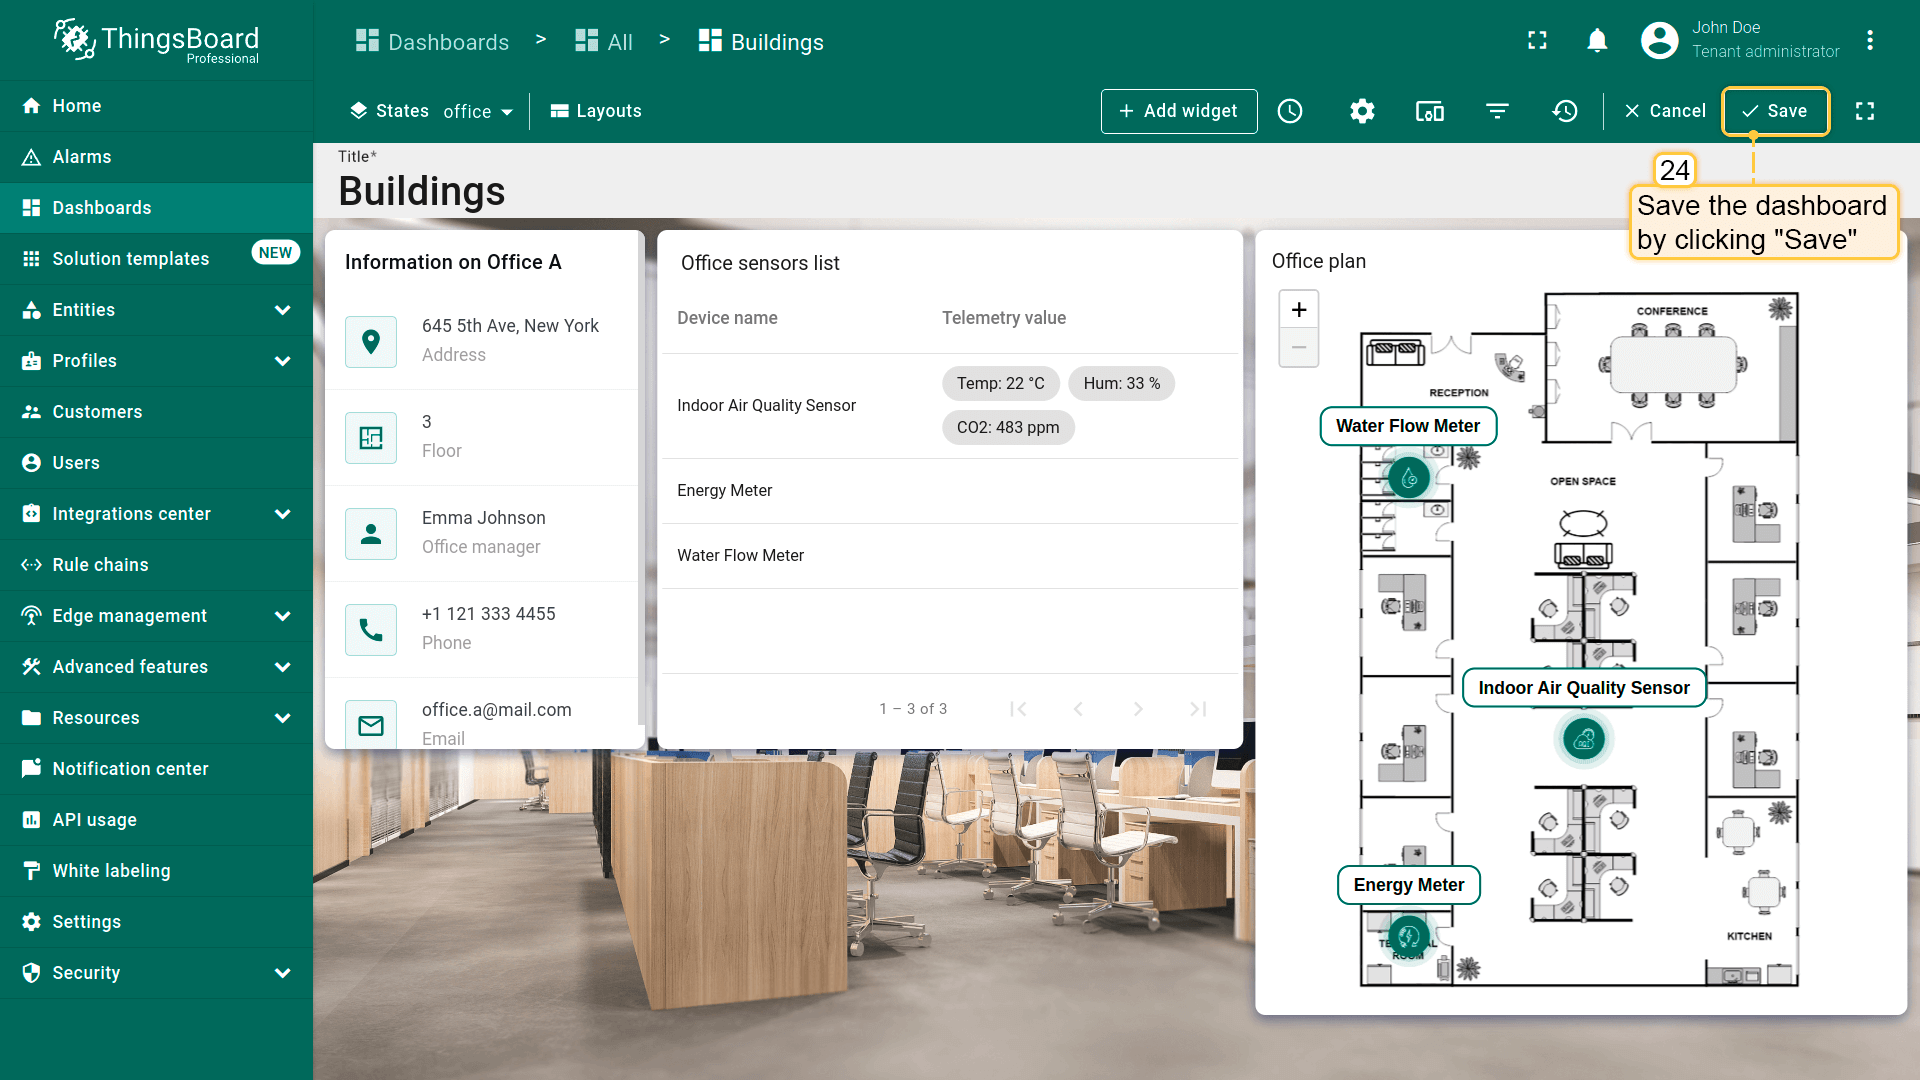
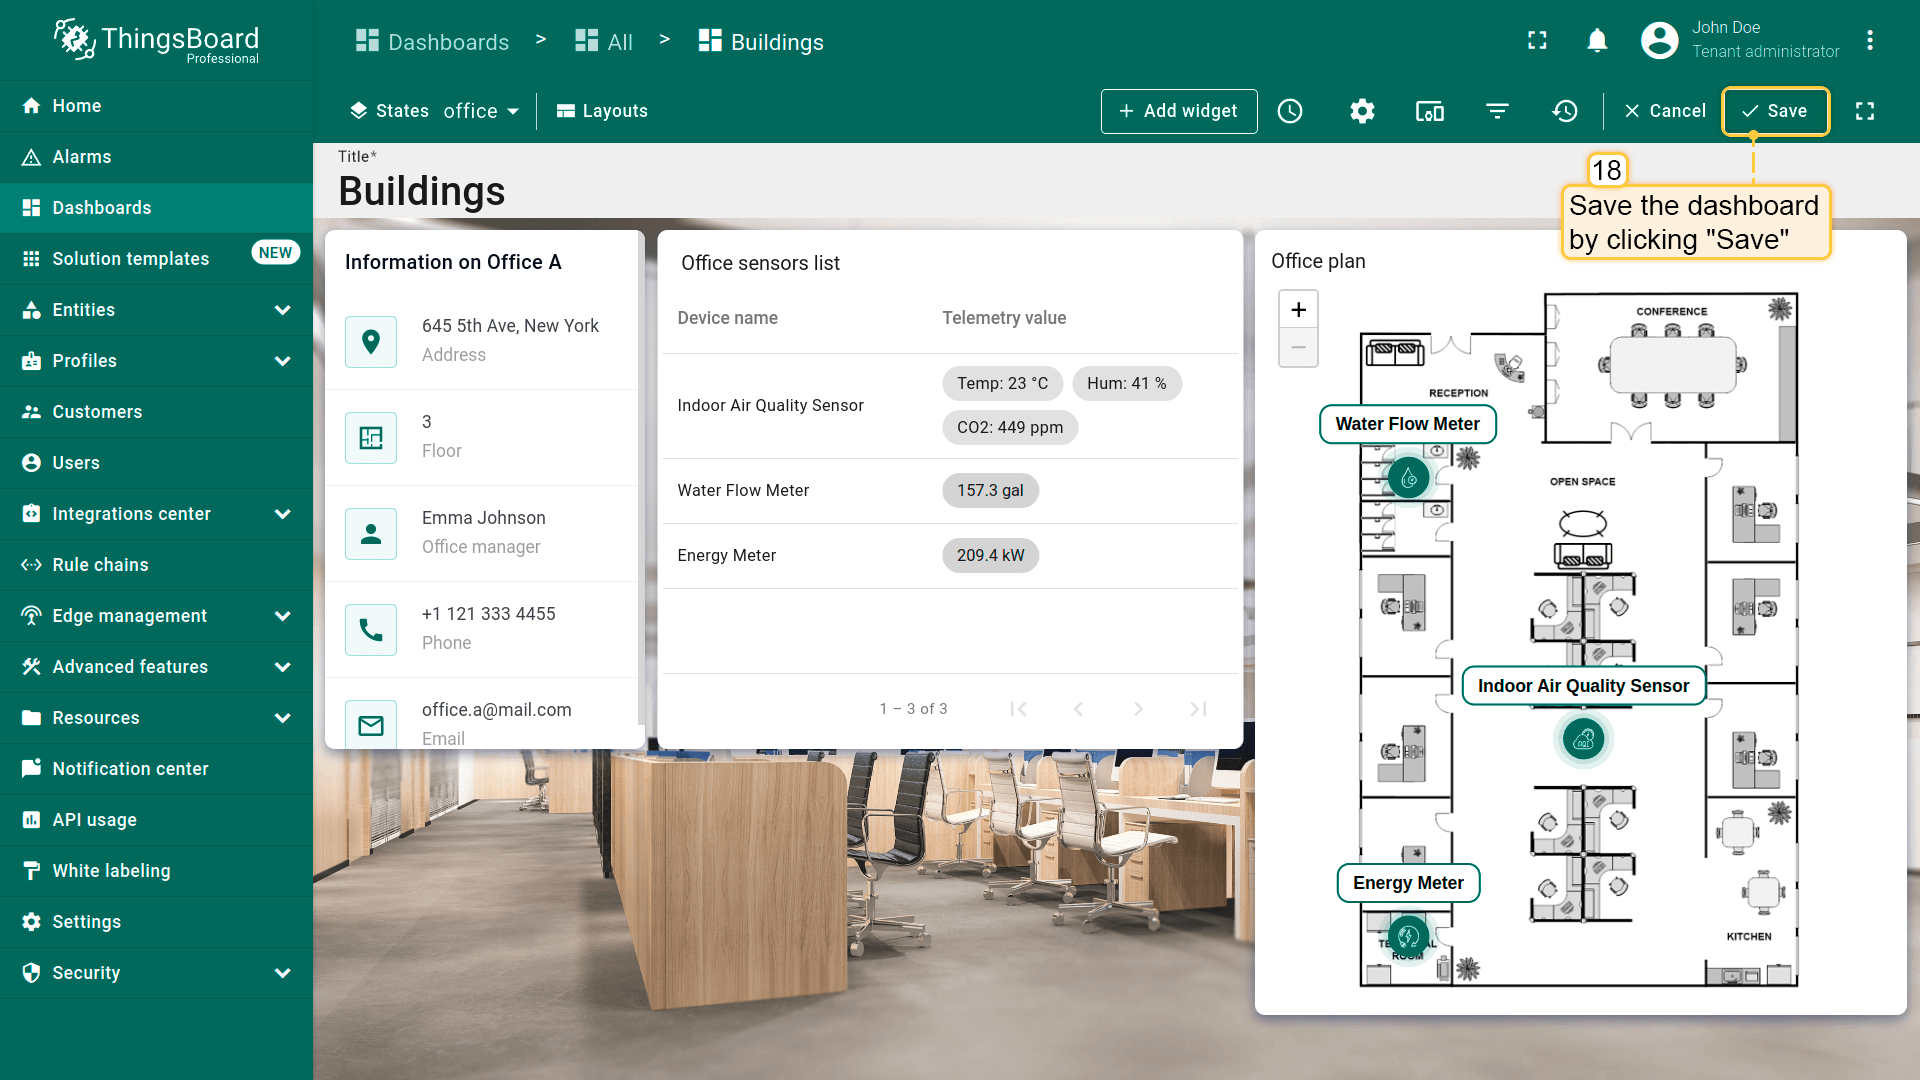
- Save the dashboard by clicking “Save” in the upper-right corner of the dashboard page.

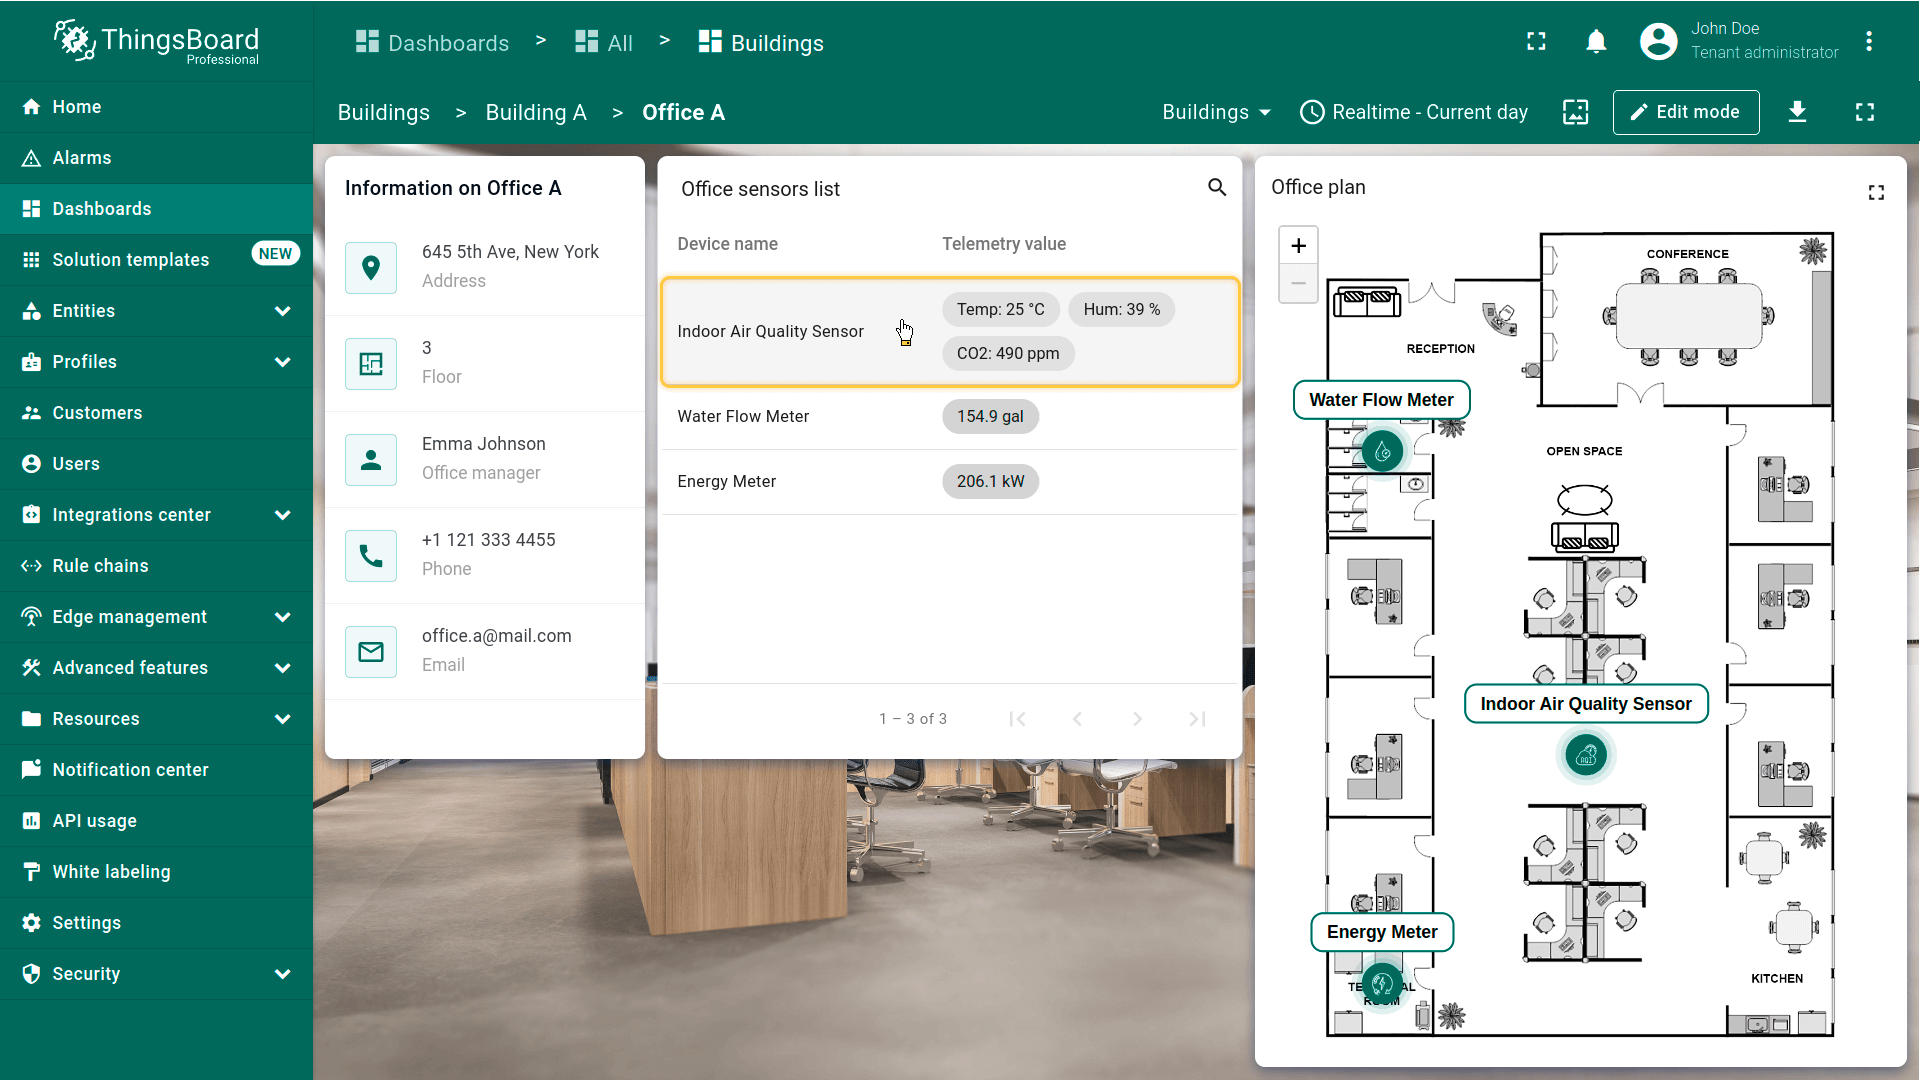
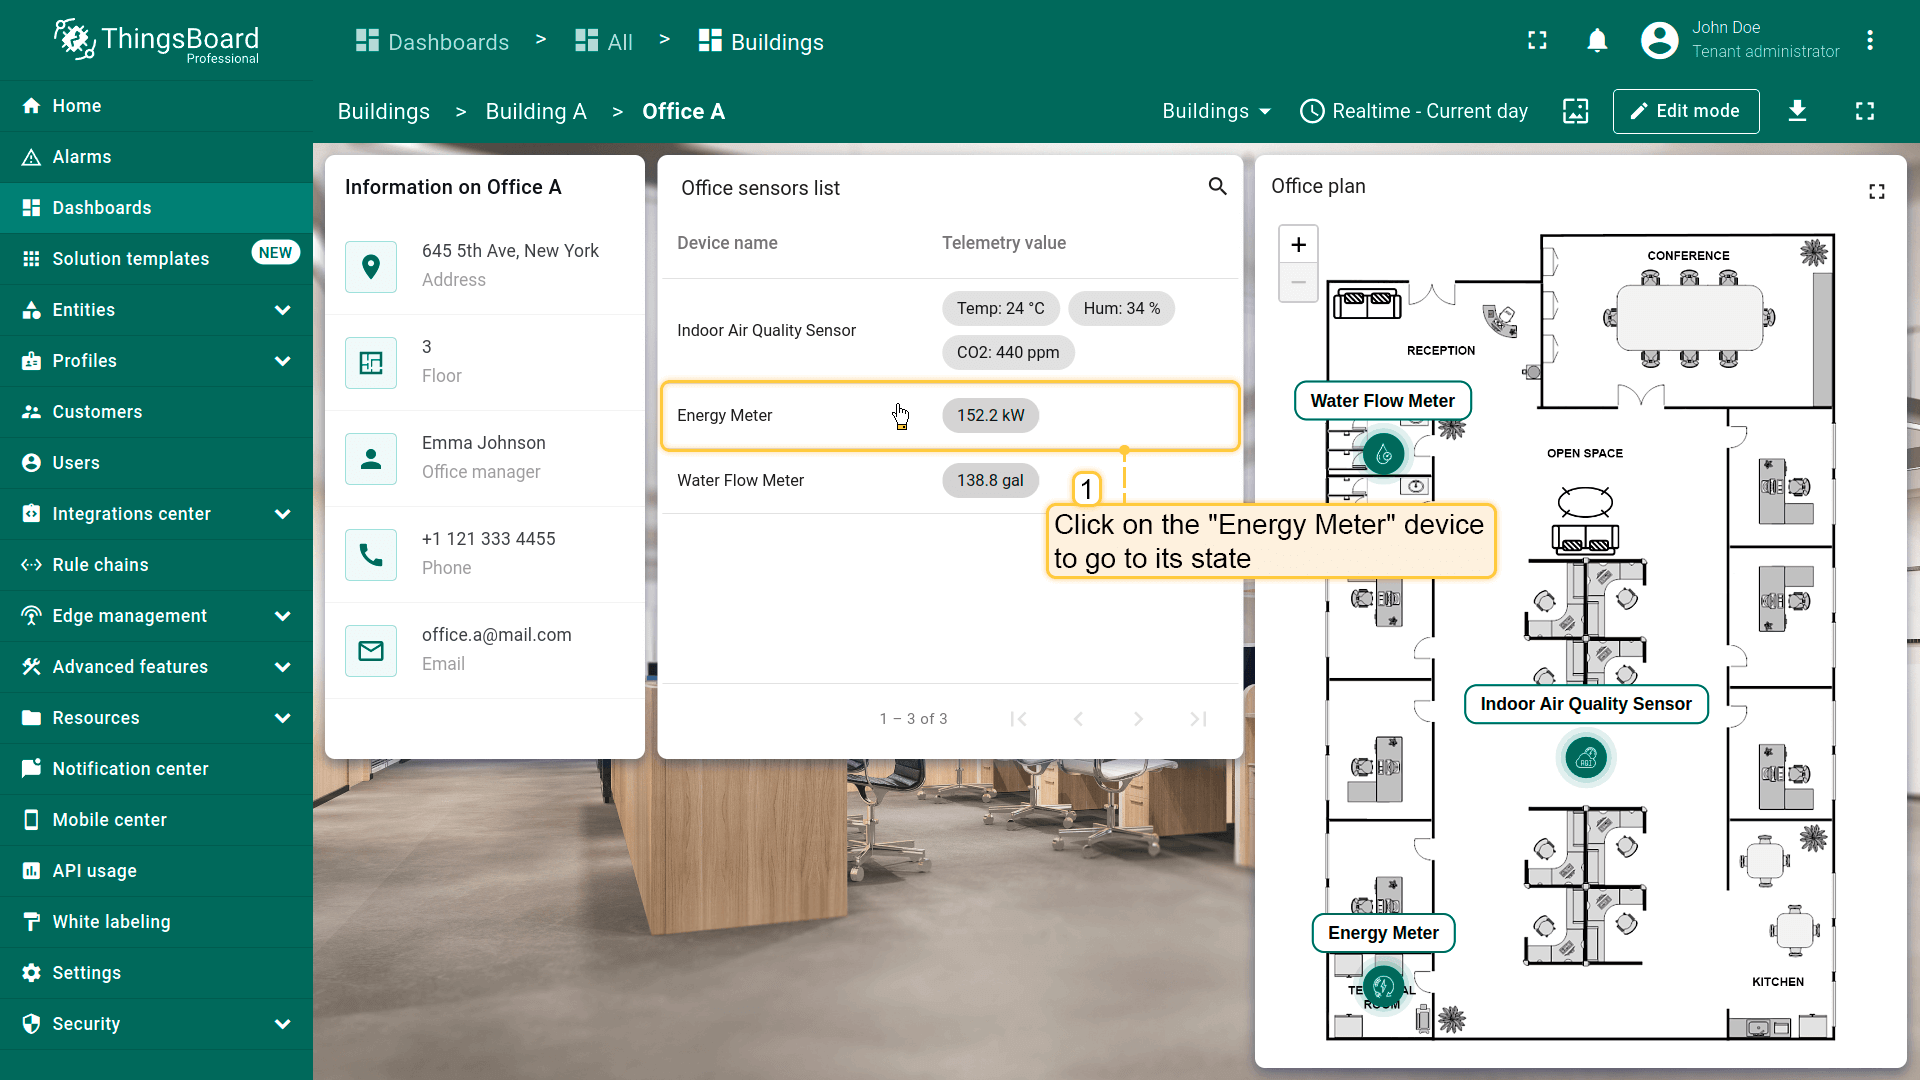
Check how it works. Click on the row of any device to transition to its state.
Customize Office plan widget
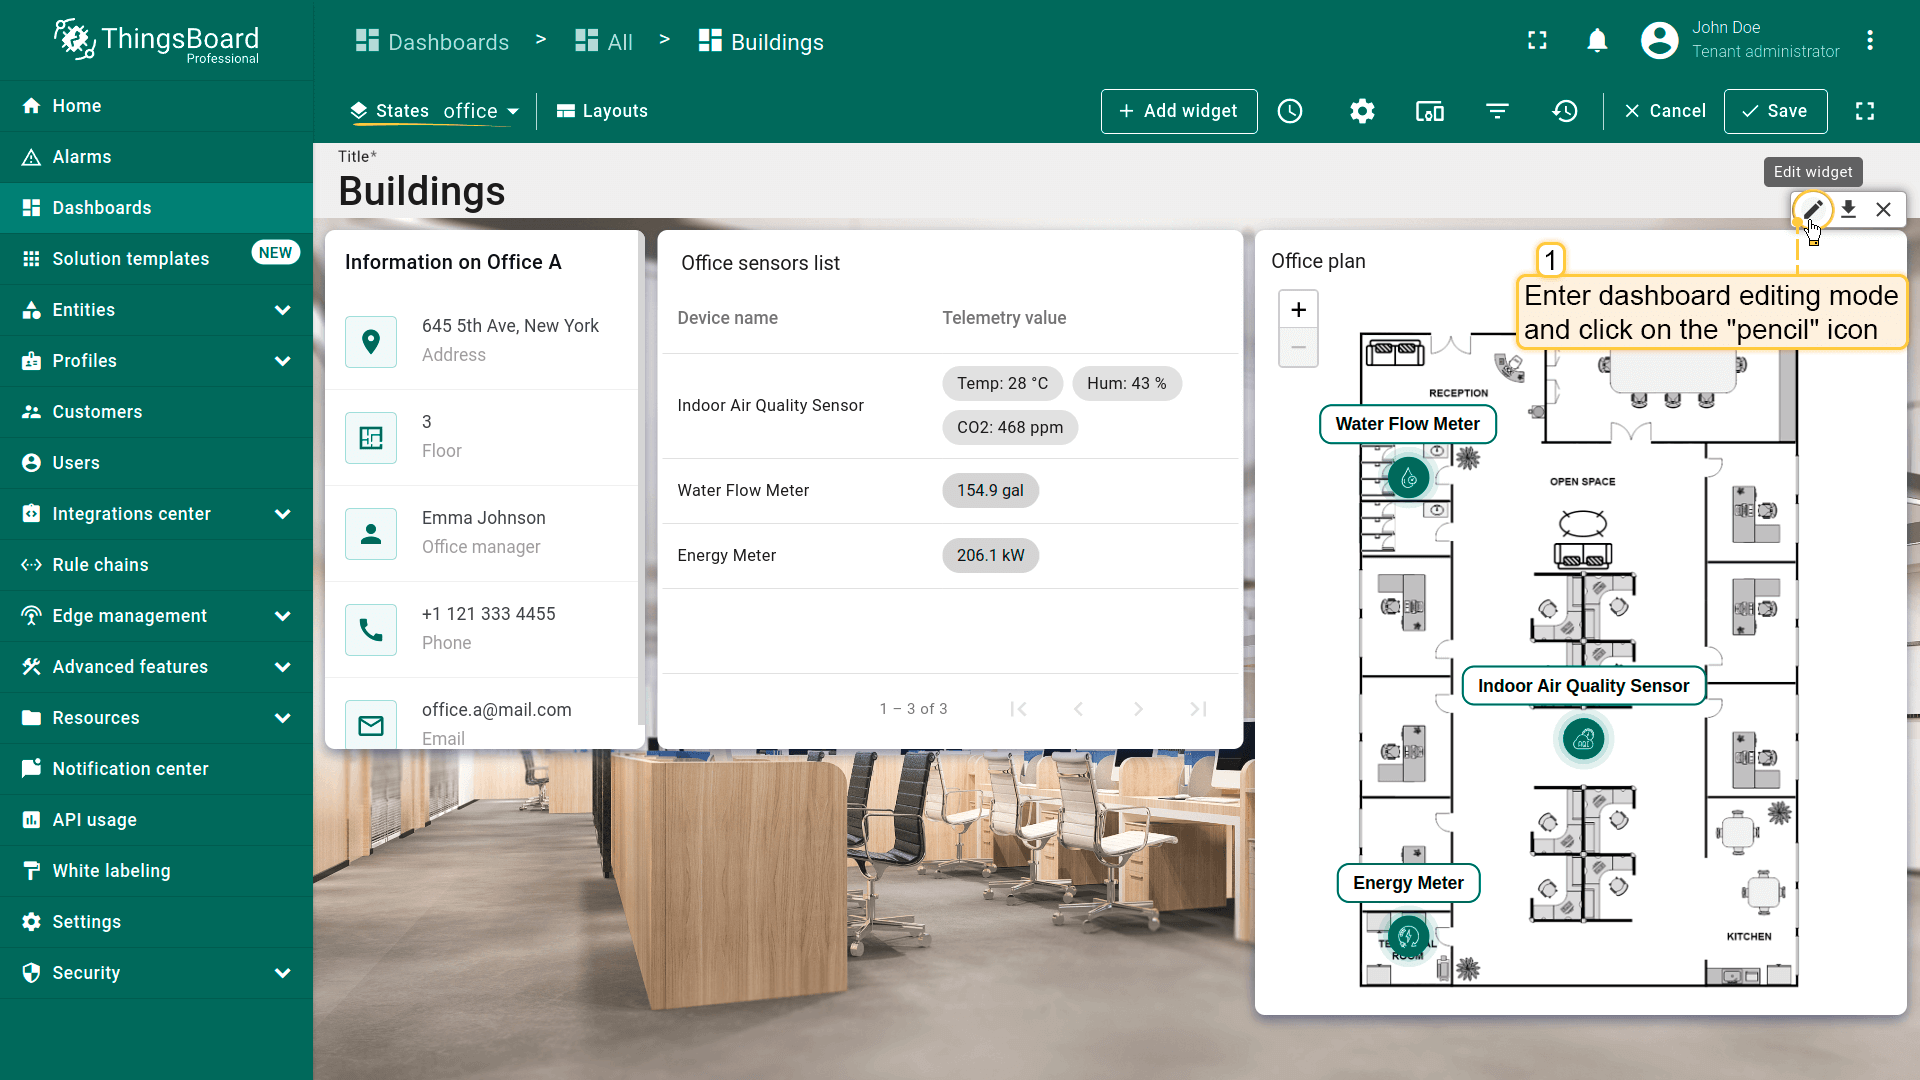
Enhance the functionality of the “Office plan” widget by adding a tooltip that display telemetry data for the sensors and adding the ability to drill down to the details of each device. Follow these steps to customize the widget:
- While in the “office” state, enter the dashboard edit mode;
- Click the “pencil” icon of the “Office sensors list” widget to modify its settings;
- Add the following data keys to the existing ones: “temperature”, “humidity”, “co2”, “powerConsumption”, “waterConsumption,” and “batteryLevel”. These keys represent the telemetry data that will be shown in the tooltip when clicking on the device;
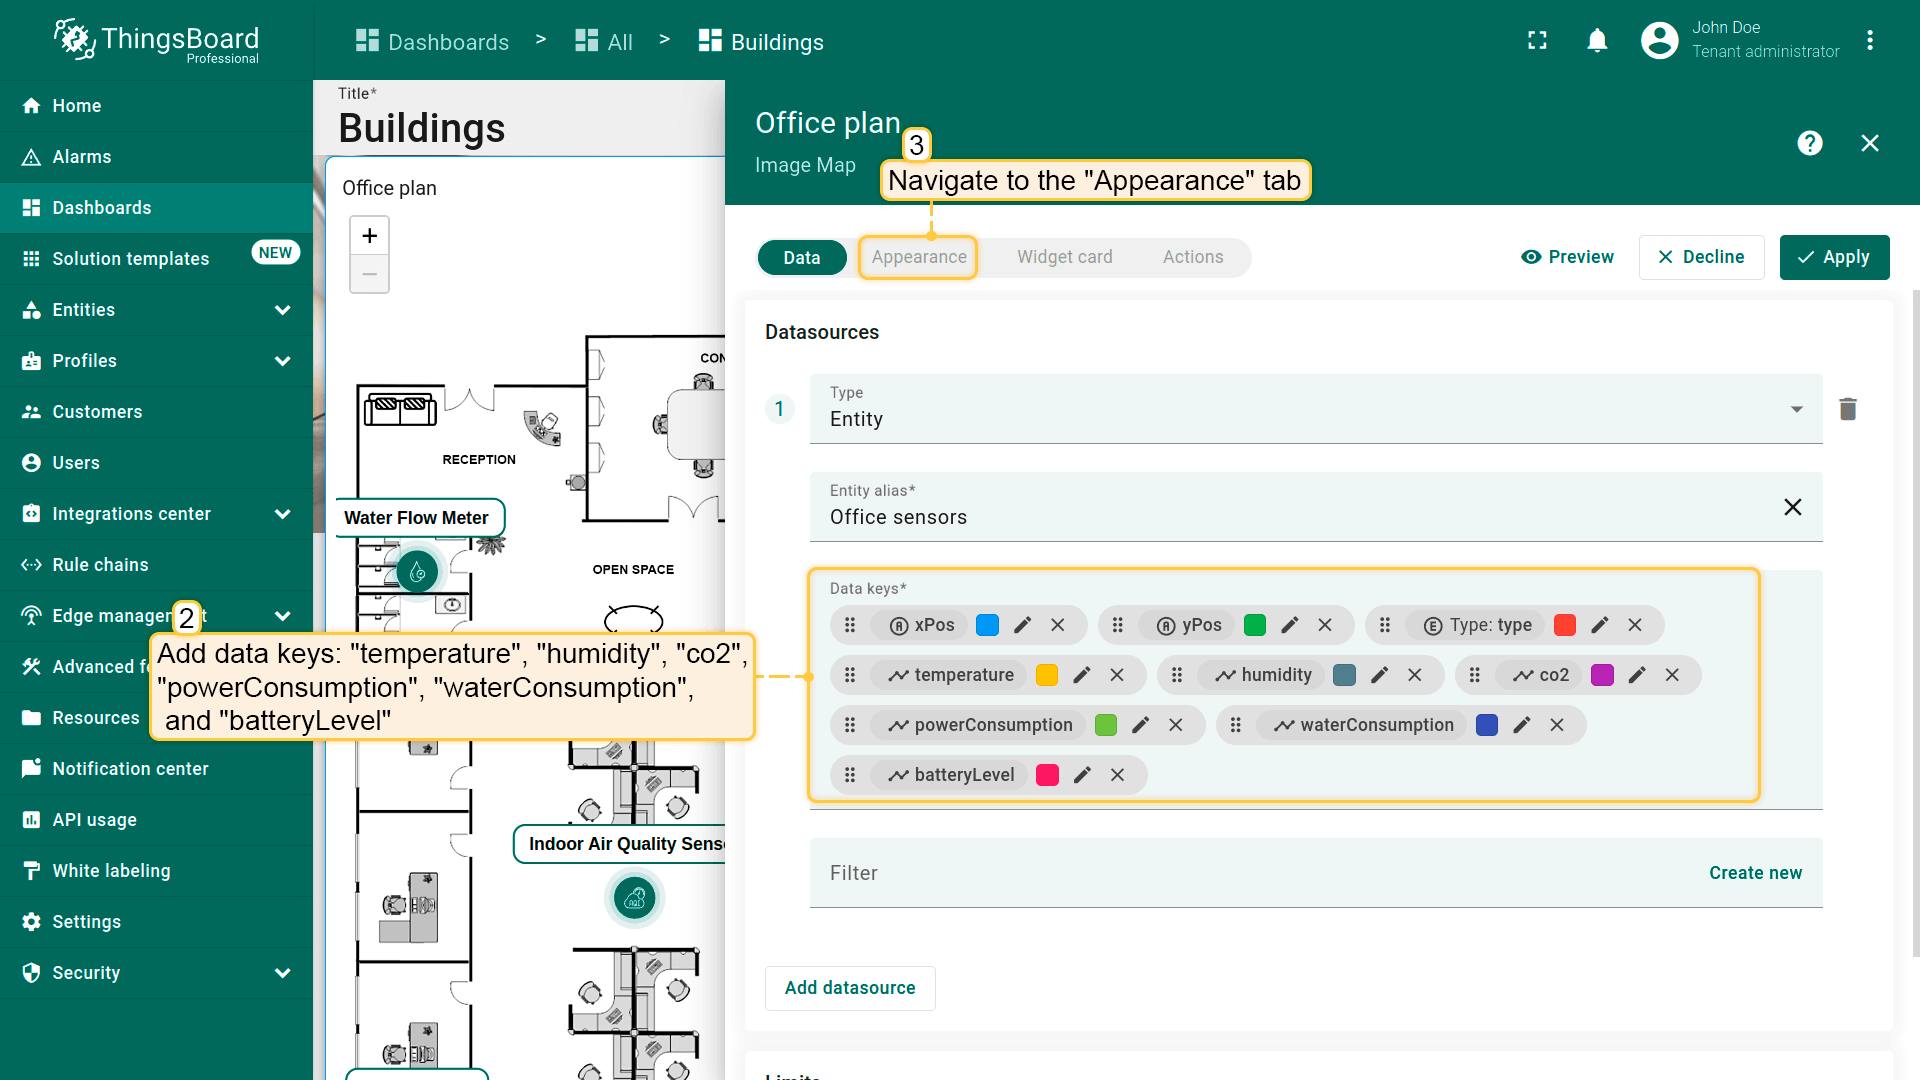
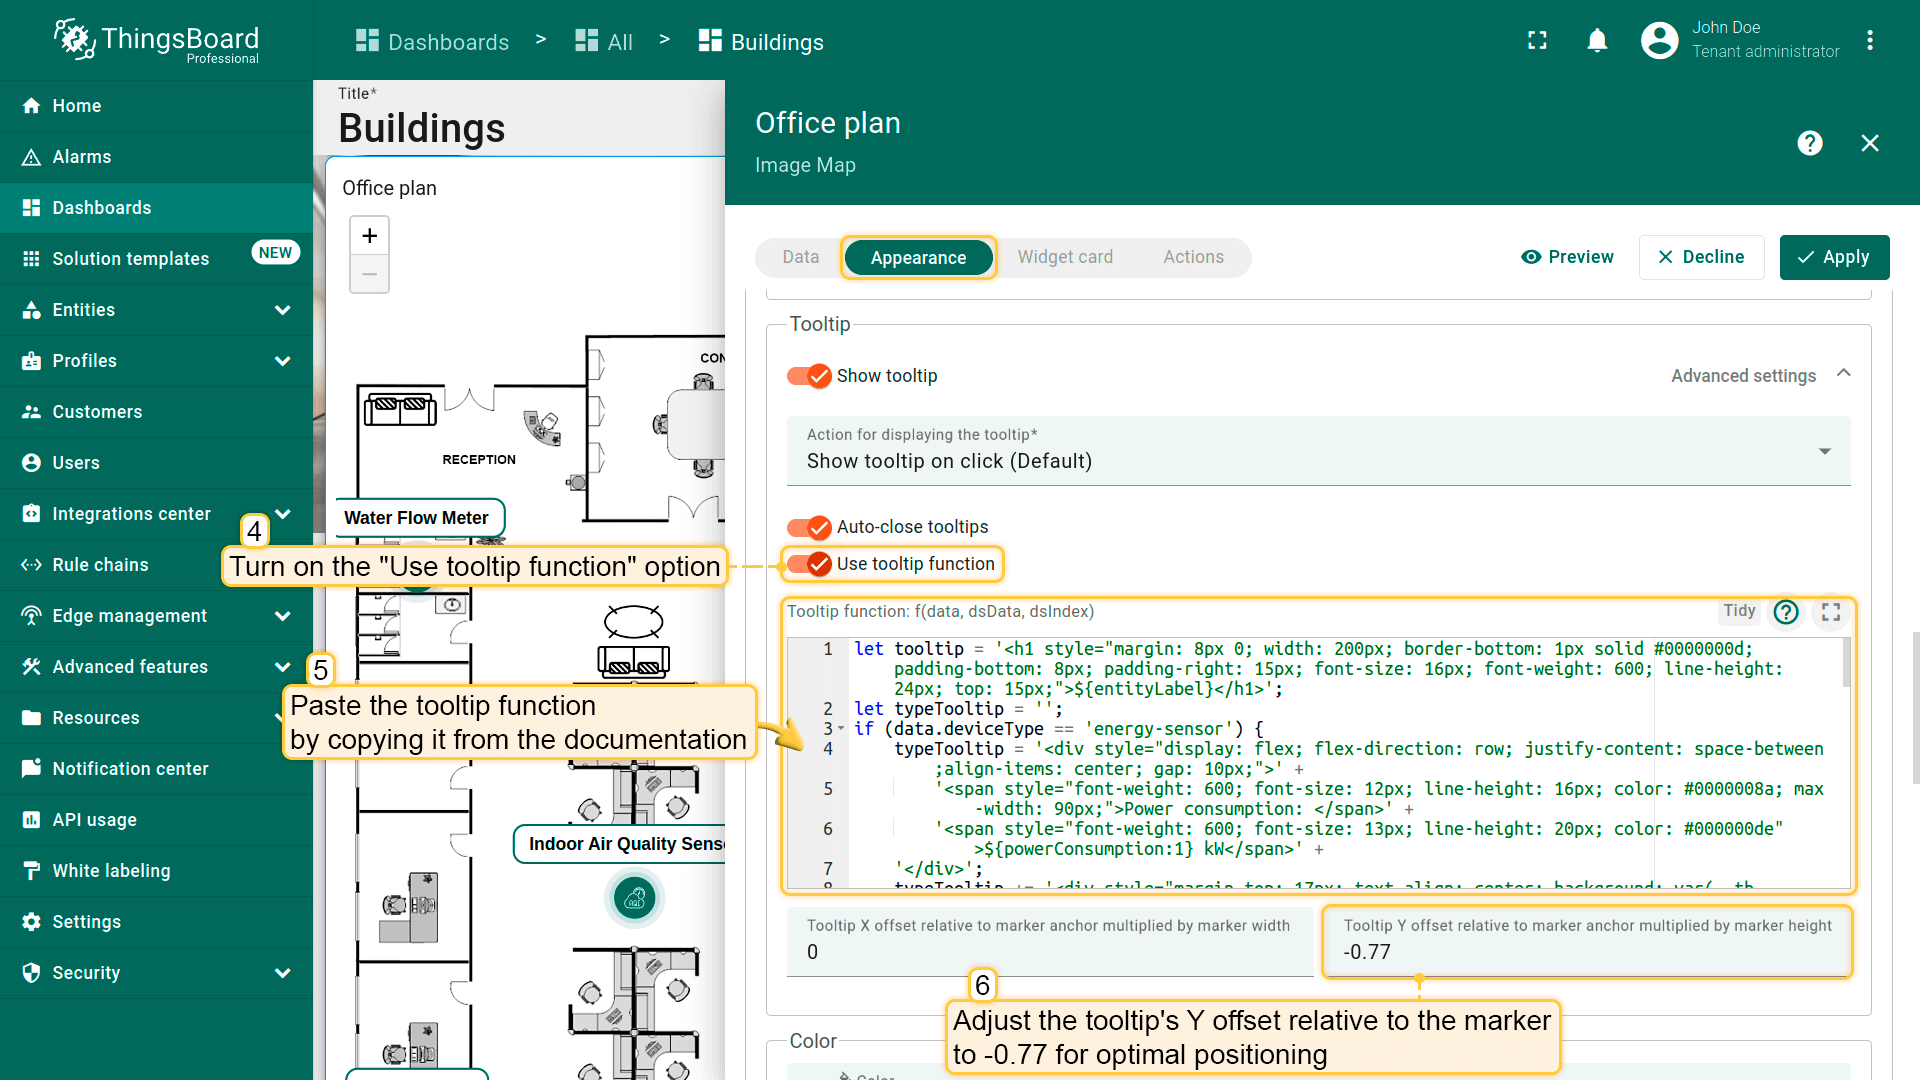
- Navigate to the “Appearance” tab. Scroll to the “Tooltip” section and turn on the “Use tooltip function” option. Now, copy the tooltip function from the documentation and paste it into the “Tooltip function” field;
The tooltip function used in the example:
- Adjust the tooltip's Y offset relative to the marker to -0.77 for optimal positioning;
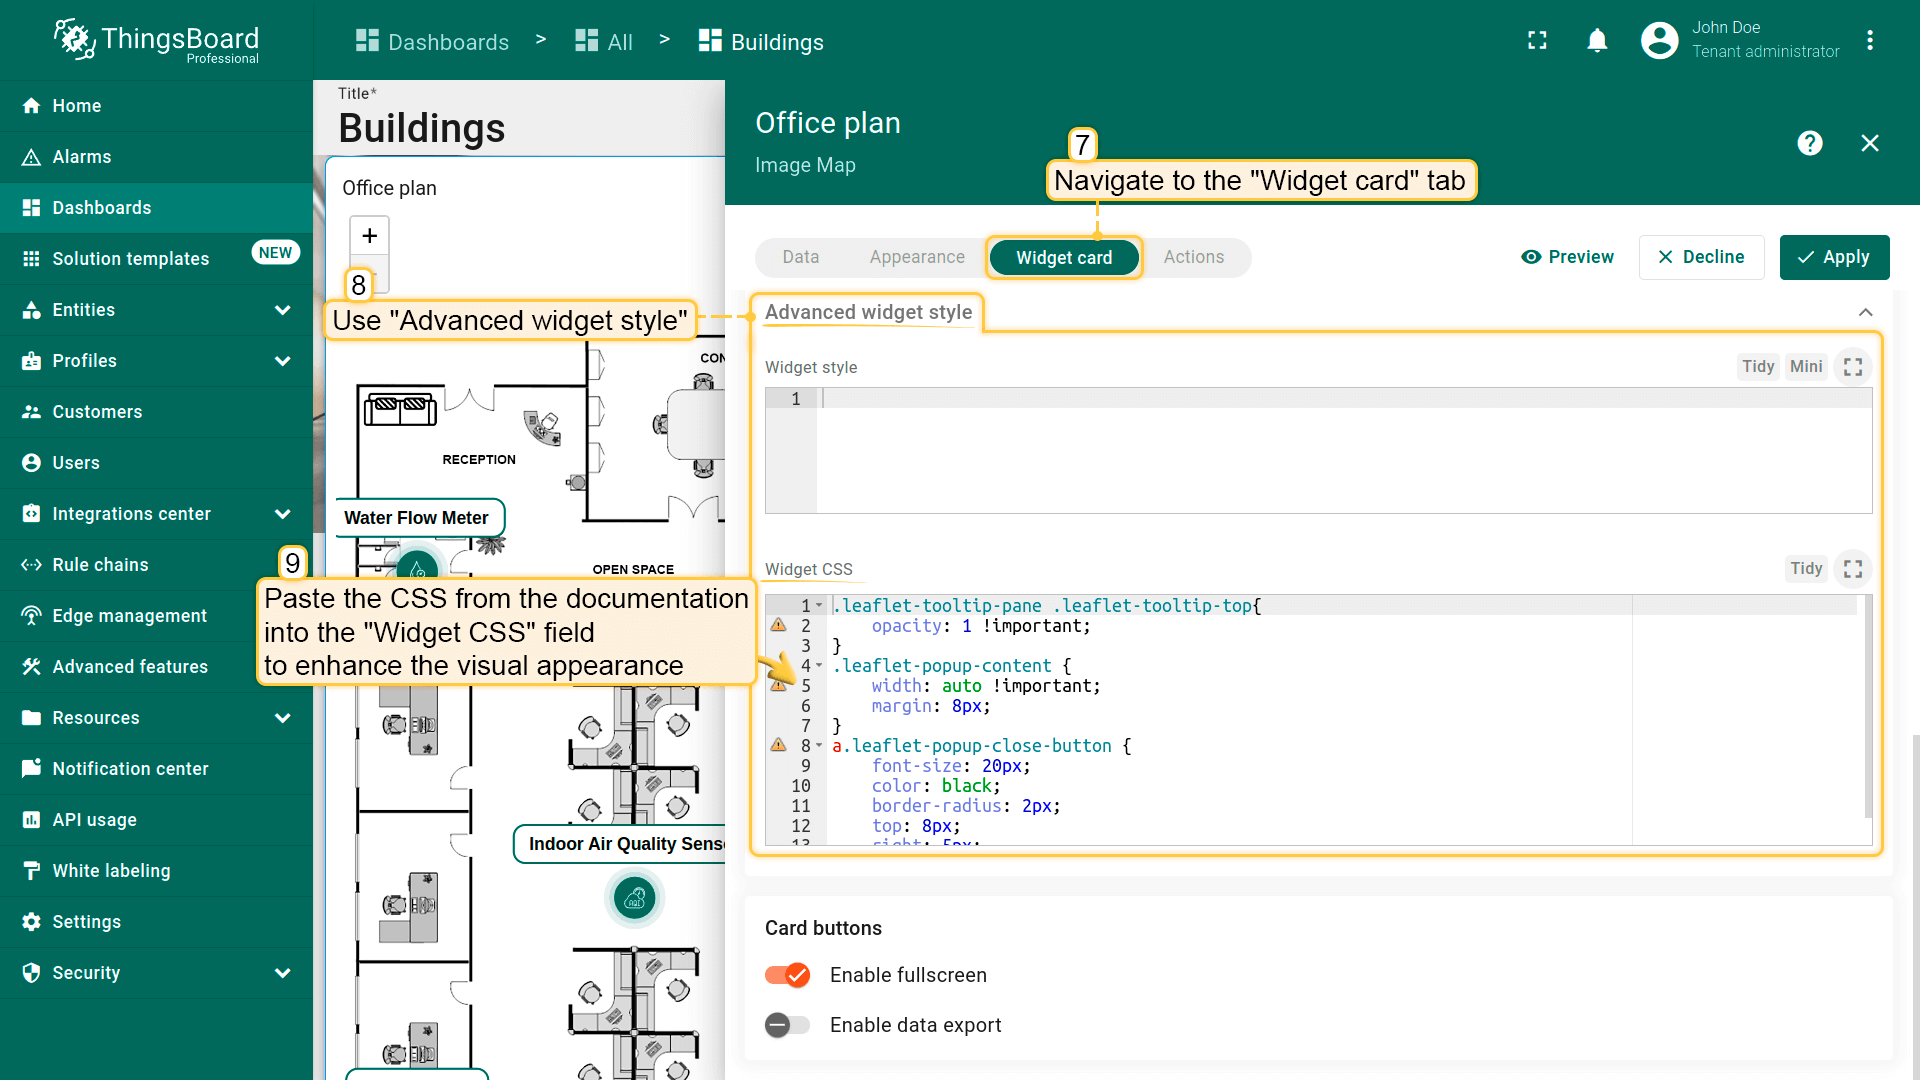
- Go to the “Widget card” tab. Access “Advanced widget style” and paste the provided CSS into the “Widget CSS” field to enhance the widget visual appearance:
The CSS used in this example:
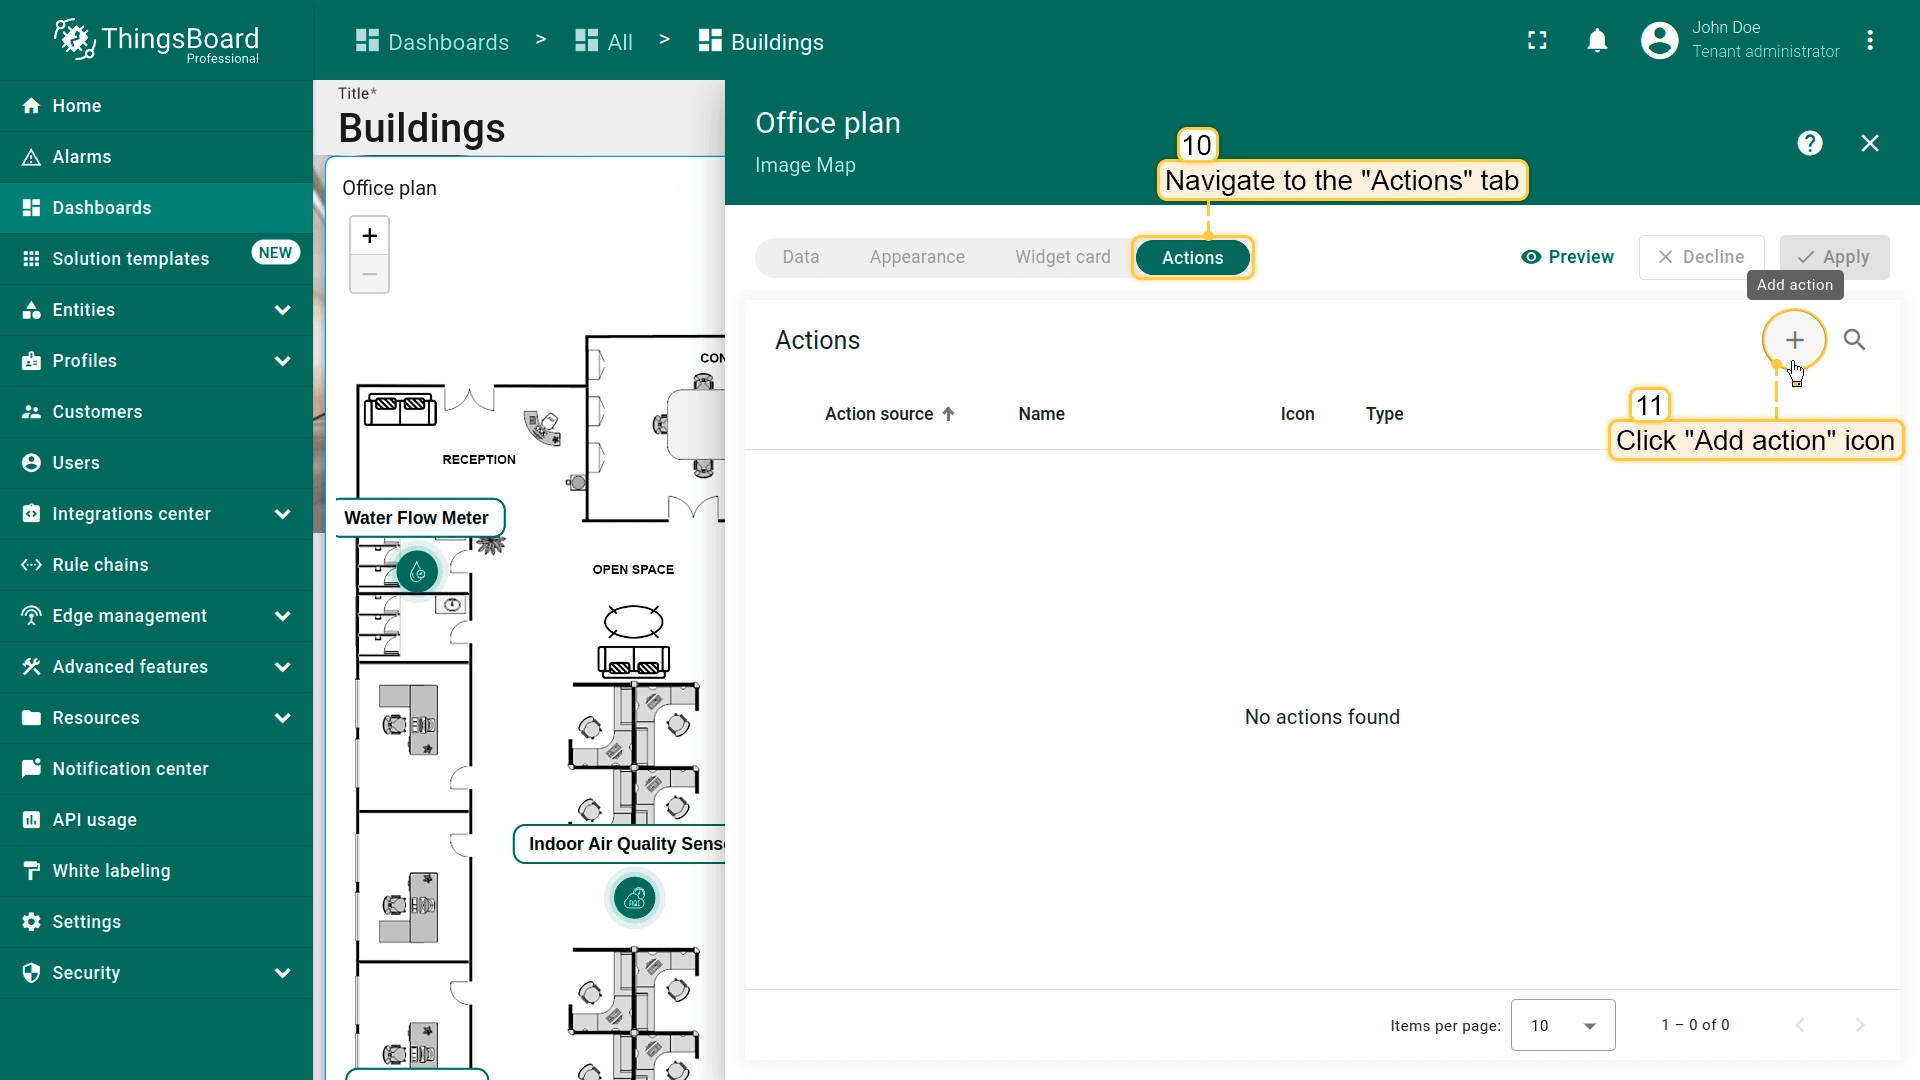
- Navigate to the “Actions” tab and click “plus” to add new action. Complete the following steps in the “Add action” dialog:
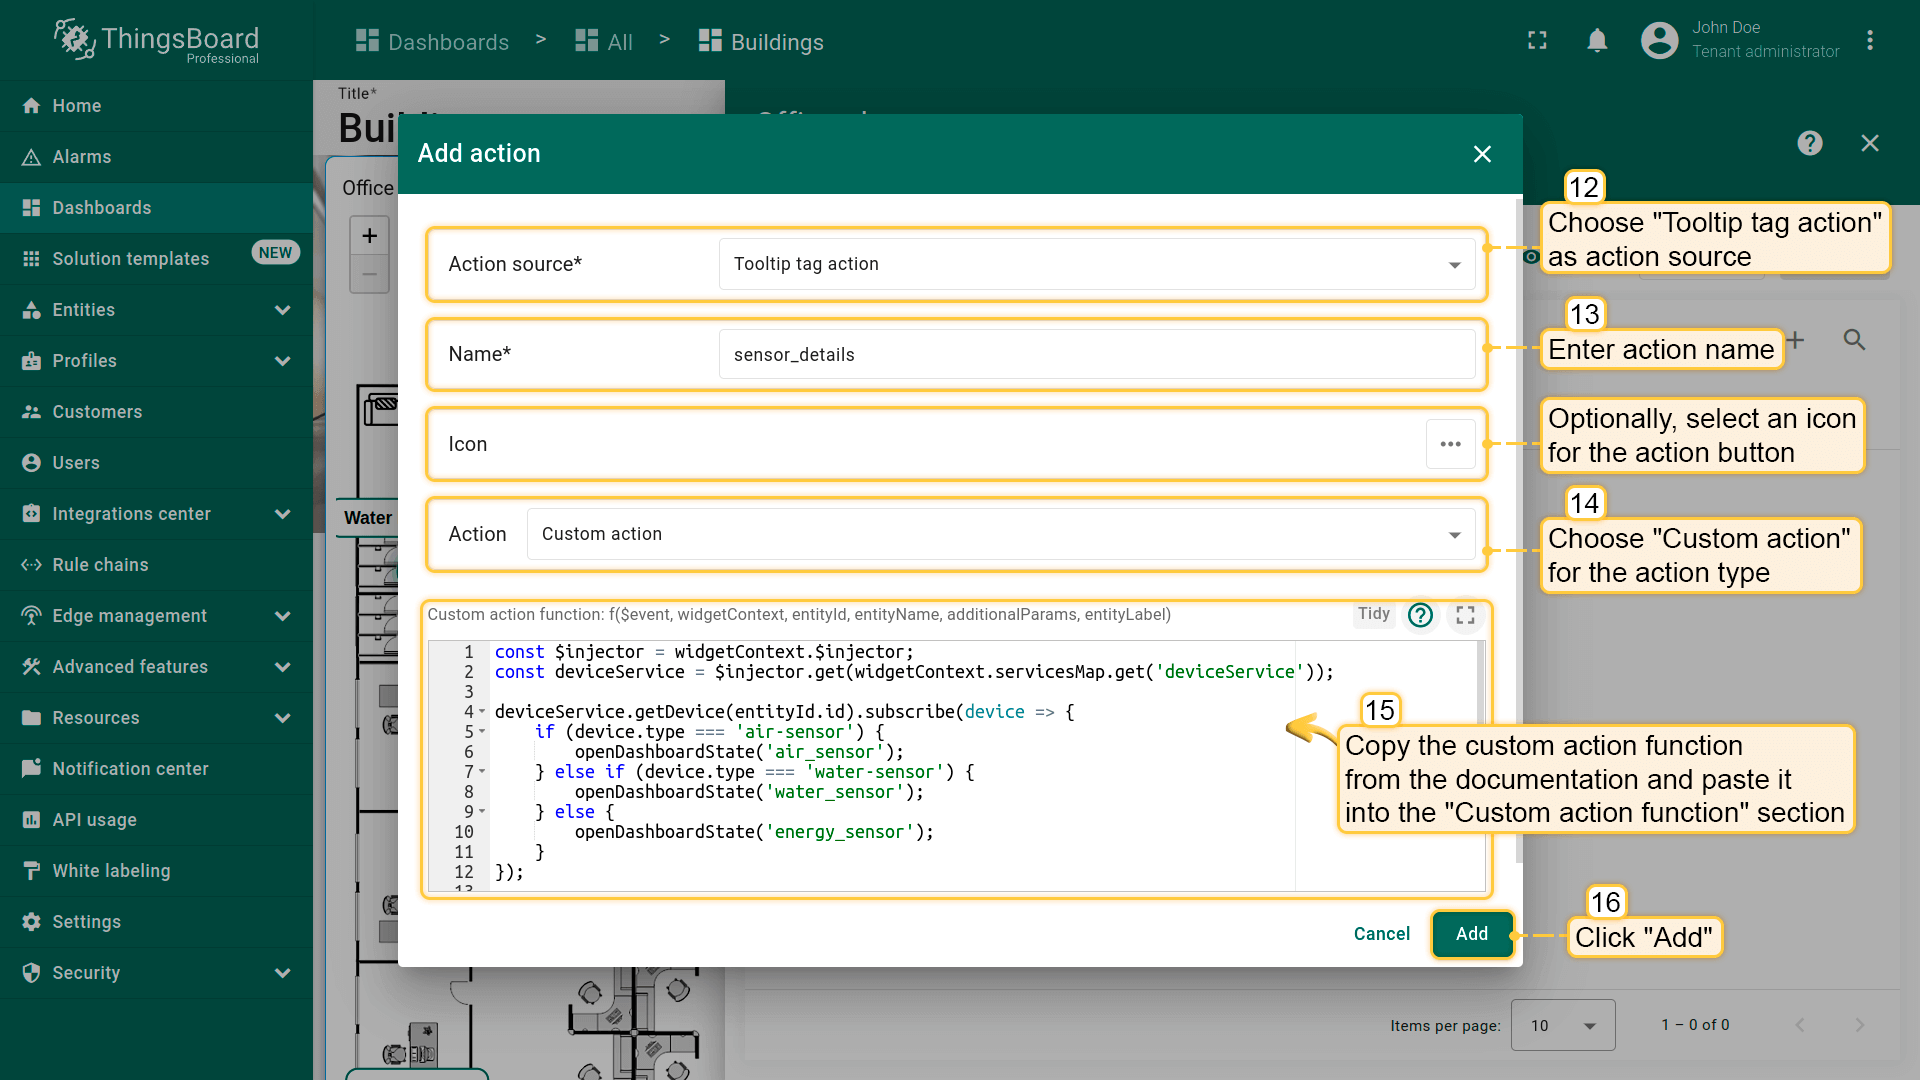
- Select “Tooltip tag action” as the action source;
- Enter “sensor_details” as action name;
- Choose “Custom action” for the action type;
- Paste the custom action function by copying it from the documentation.
The custom action function used in this example:
- Then, click “Add”;
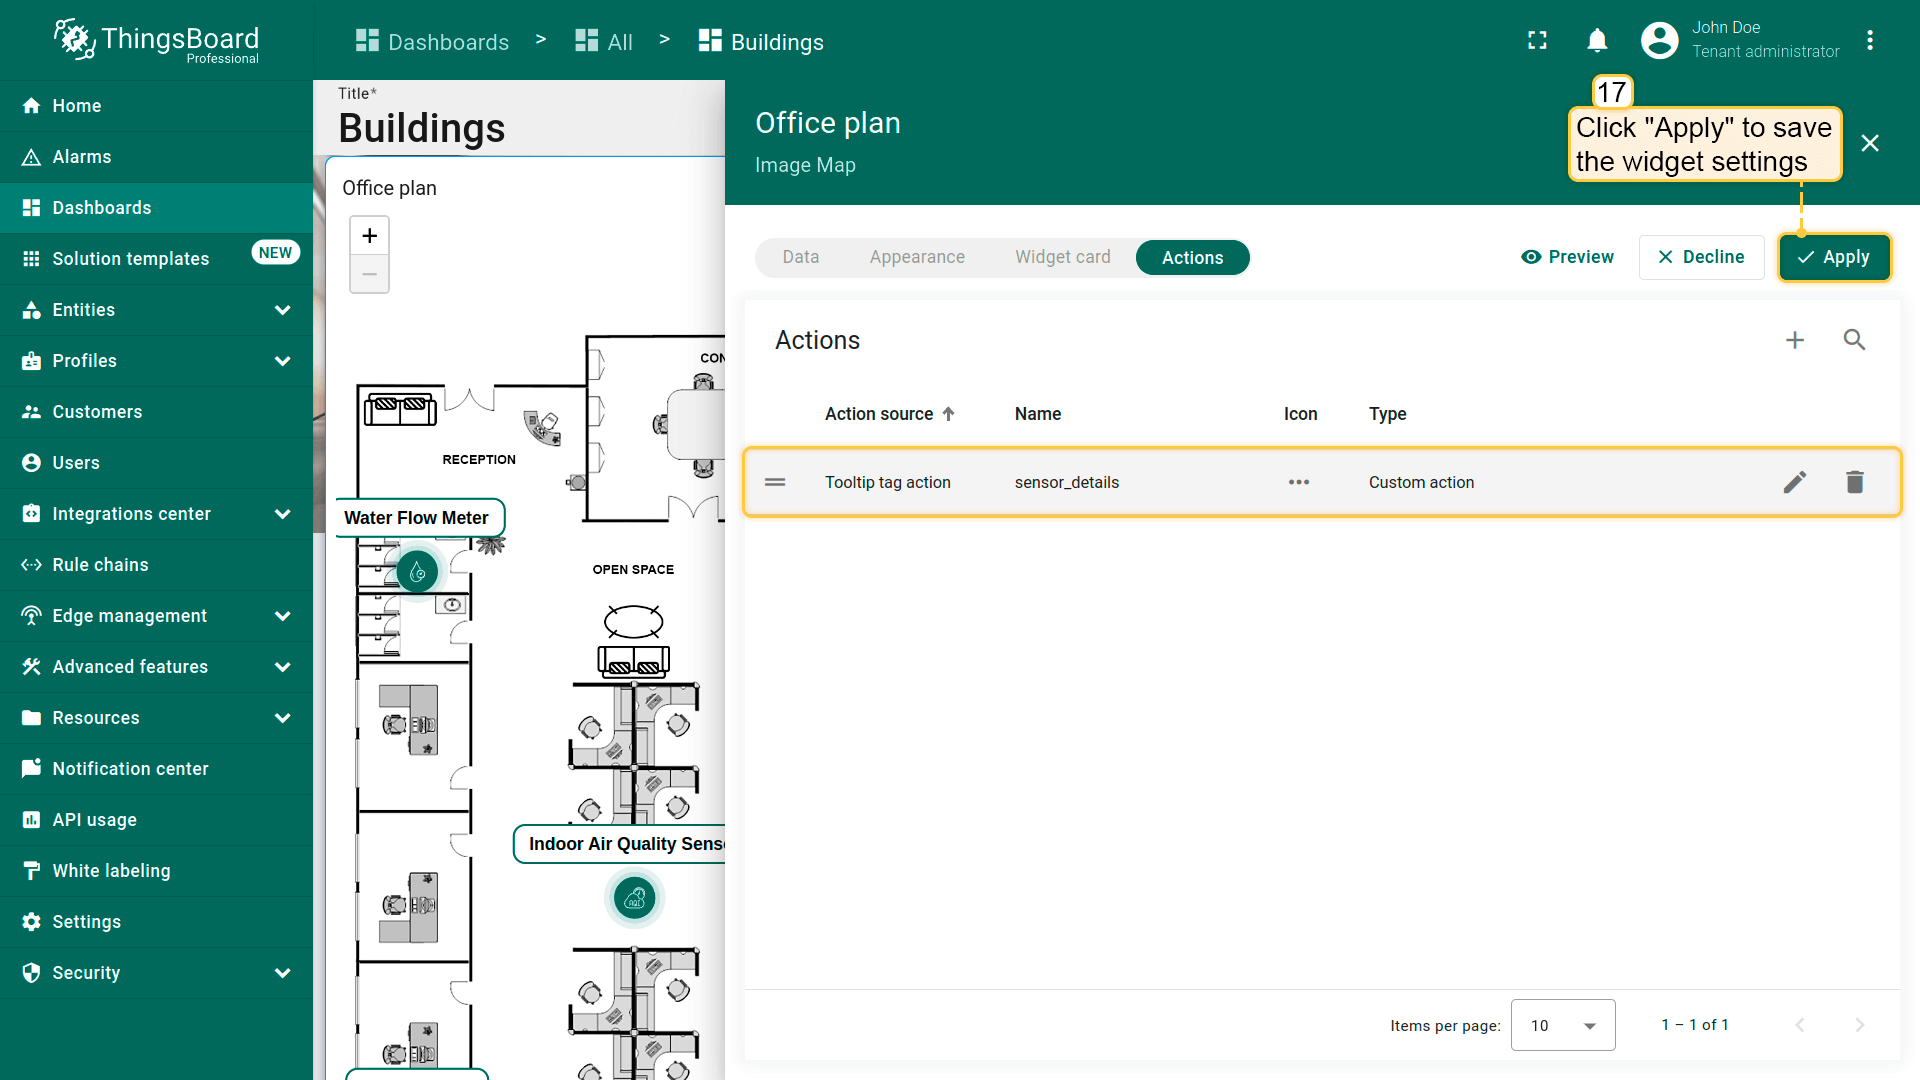
Ensure that the name of the created action matches the name specified in the tooltip function.
- Click “Apply” to save the modifications;
- Save your dashboard configuration by selecting “Save” in the upper-right corner of the dashboard.
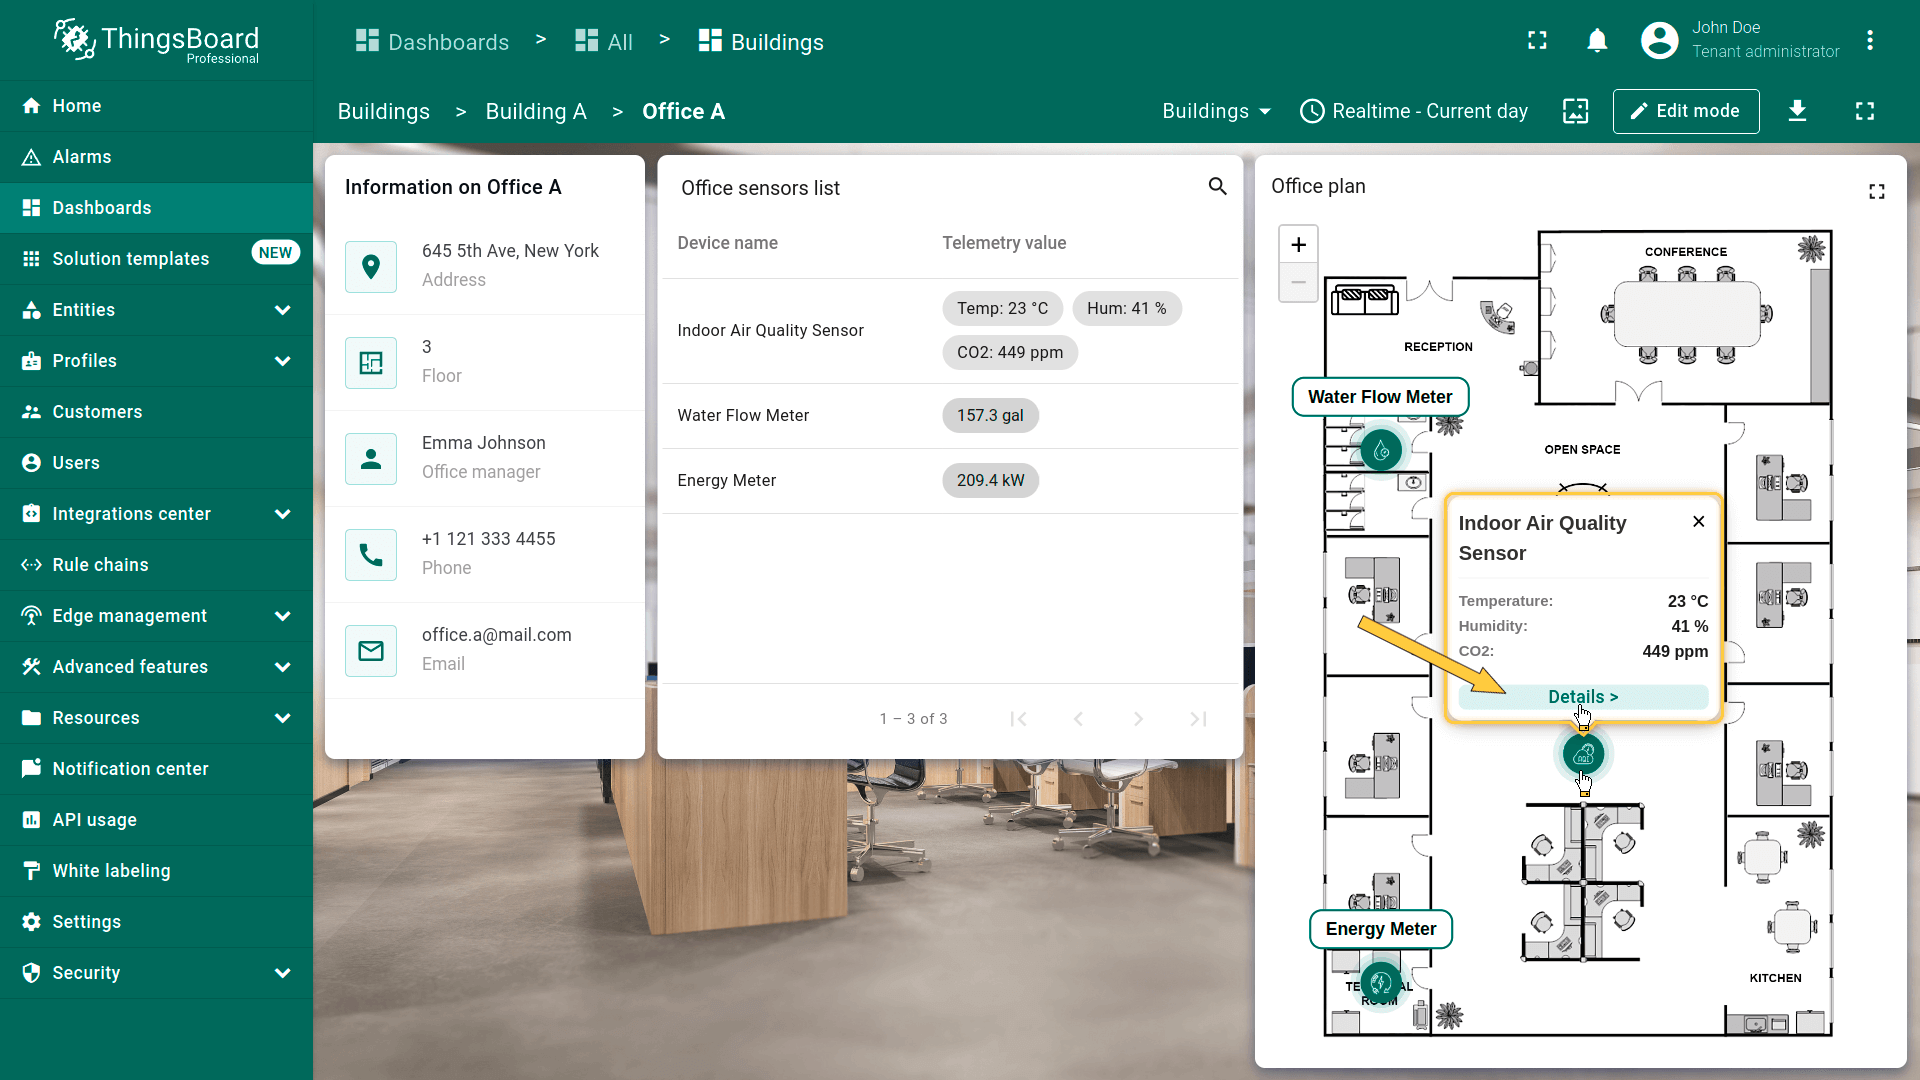
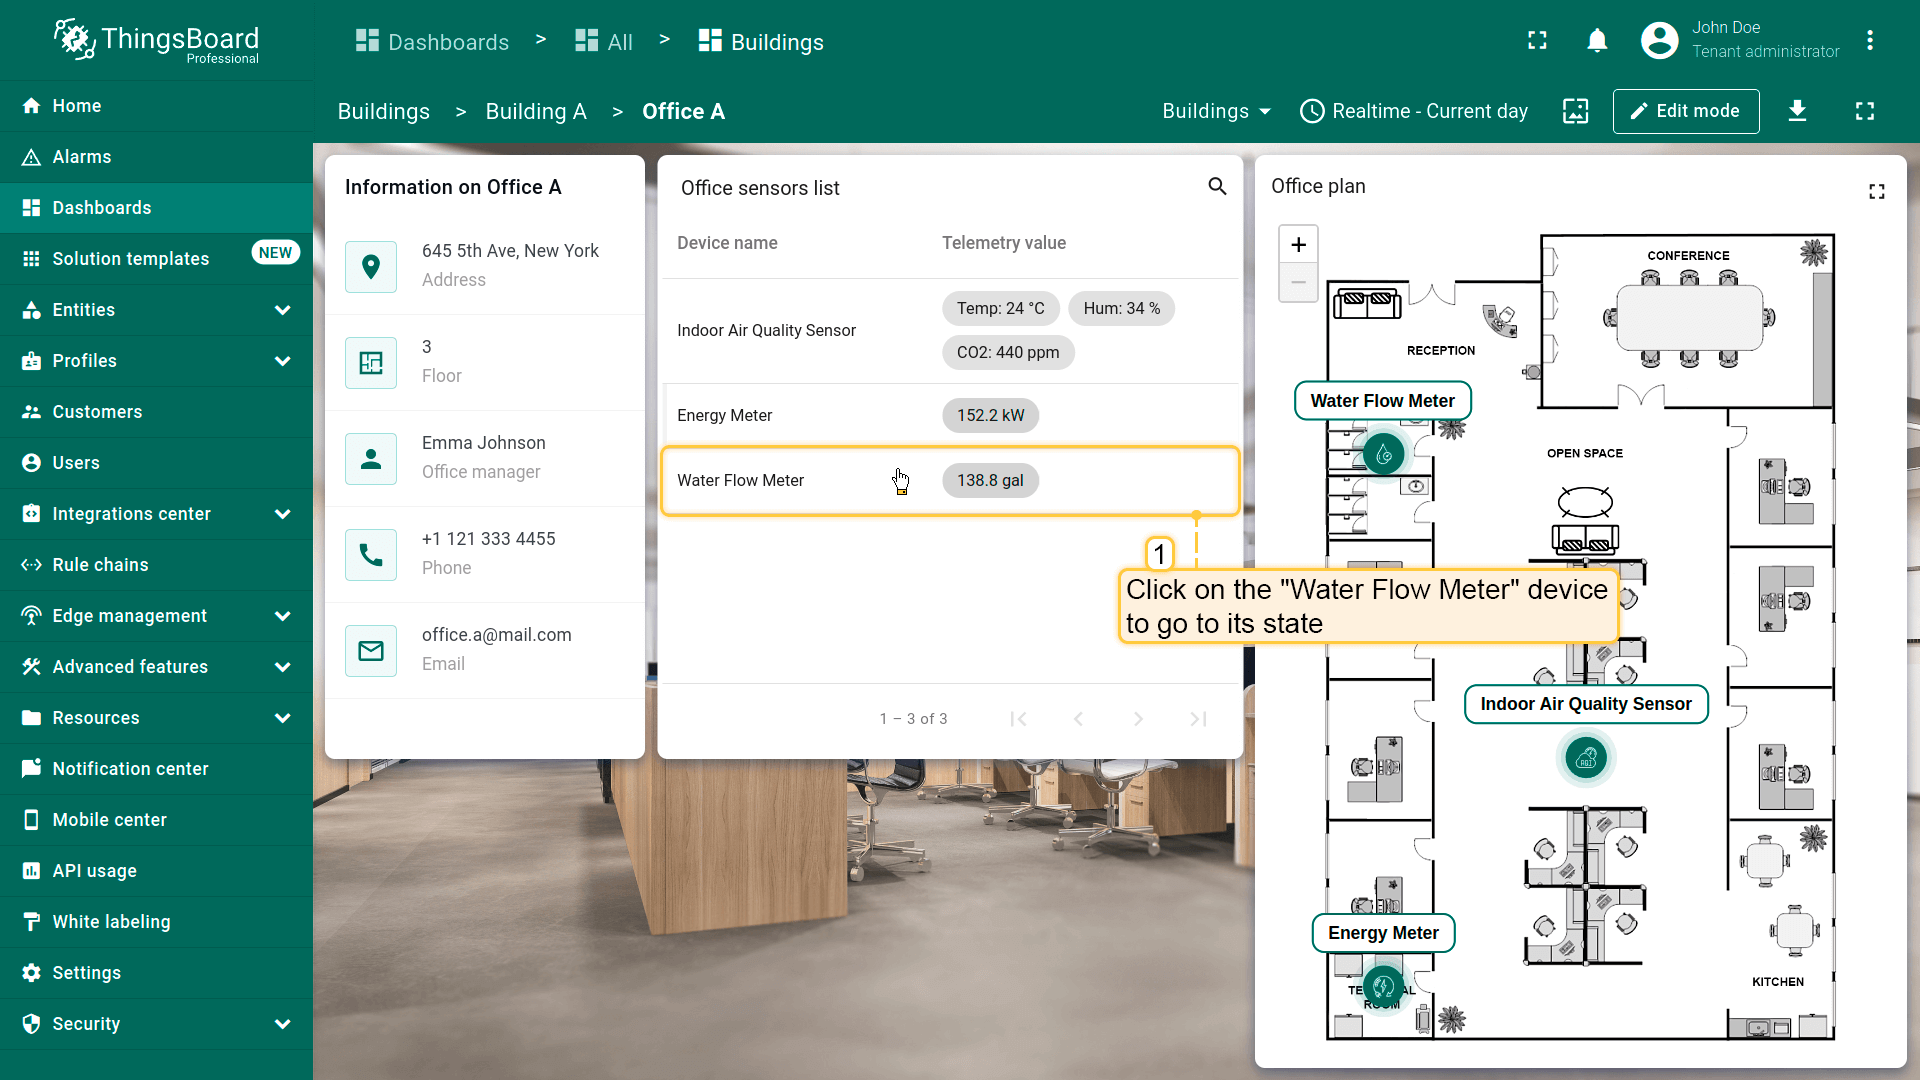
Click any marker on the “Office plan” widget to open a tooltip. Each device's tooltip includes a line button to access the details of the selected device. Click on this line.

Configuring air_sensor state
To effectively monitor and analyze indoor air quality, we'll add three widgets to display current readings of temperature, humidity, and CO2 levels, alongside two widgets for tracking historical data on air quality in the office. This will allow us to not only monitor the current state of air quality but also to analyze the trends in their changes over time.
Temperature, humidity, and CO2 level cards widgets
In ThingsBoard, there is a bundle of pre-configured widgets for displaying telemetry of the indoor environment, including temperature, humidity, and CO2 levels, etc. In this lesson, we will use this widgets bundle.
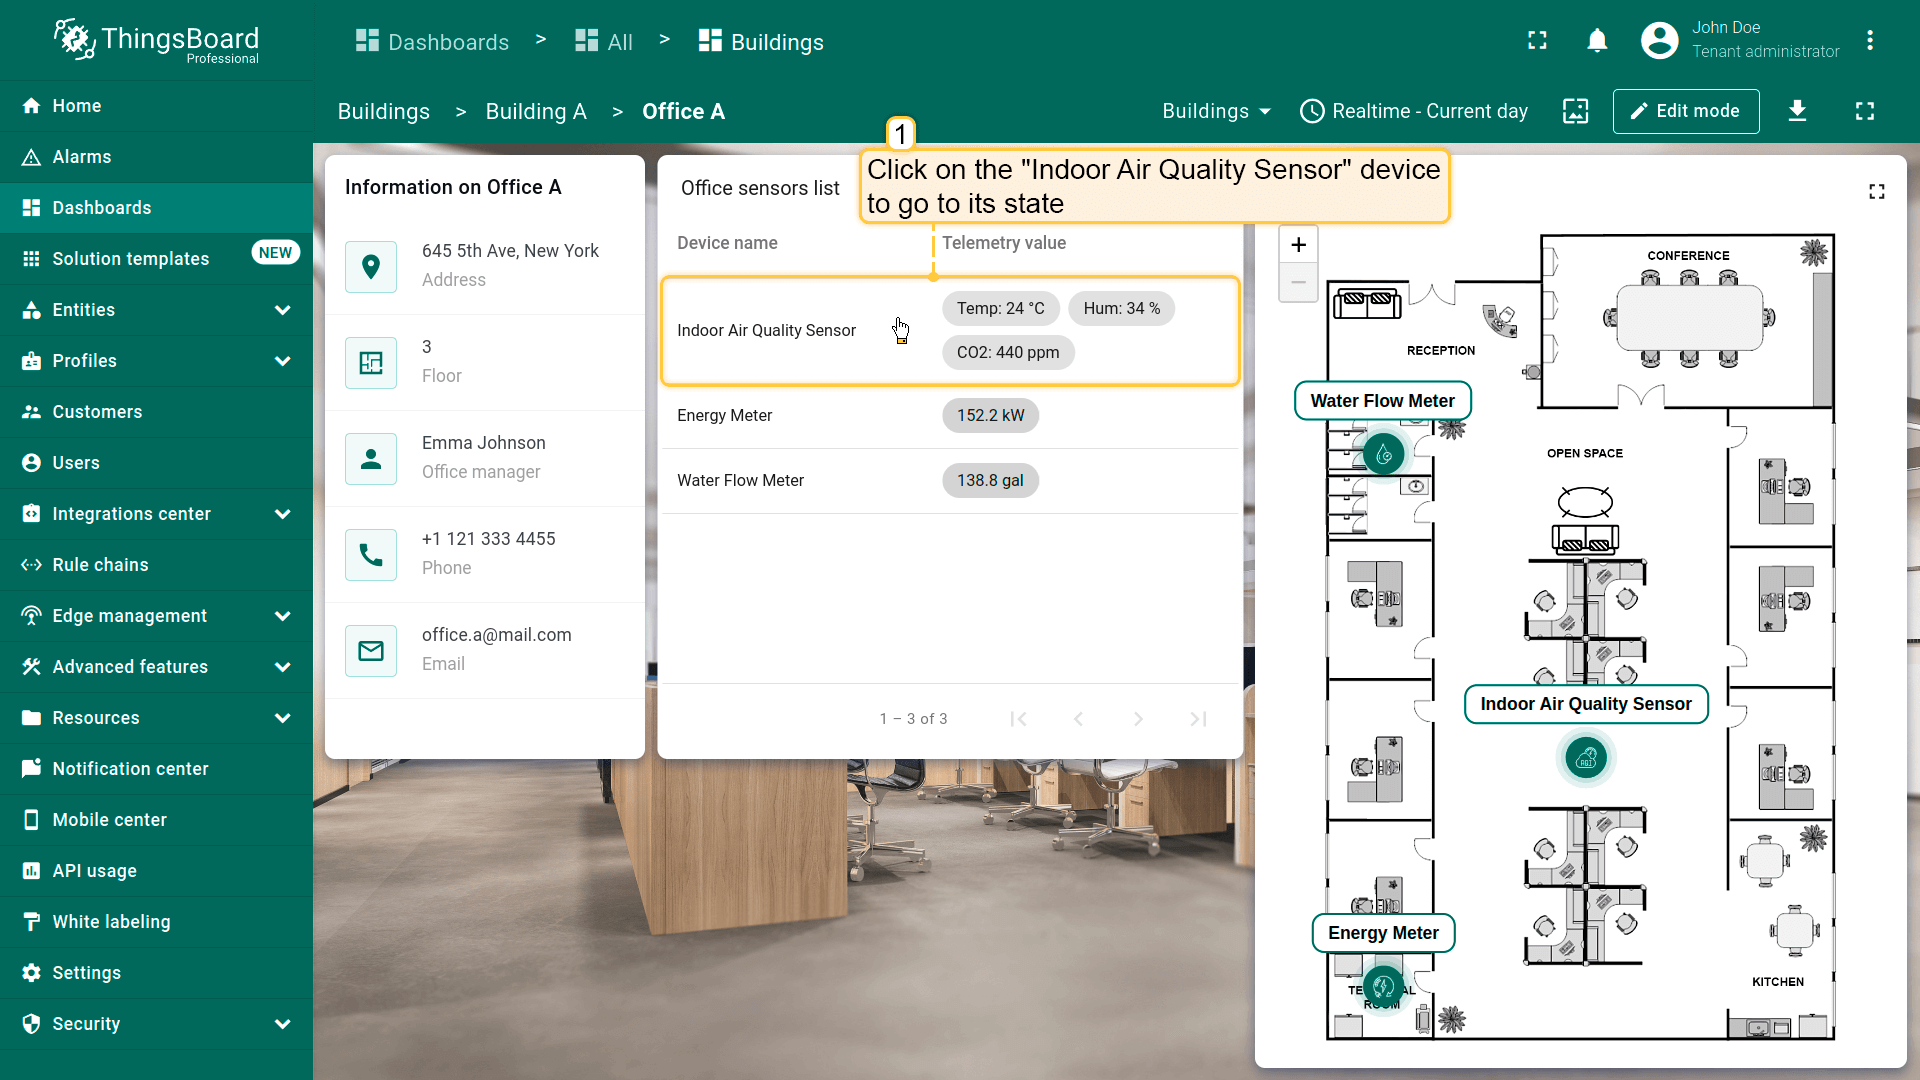
First, add a widget to display the current temperature in the office.
- 点击「办公室传感器列表」部件中的「Indoor Air Quality Sensor」设备行以切换到其状态;
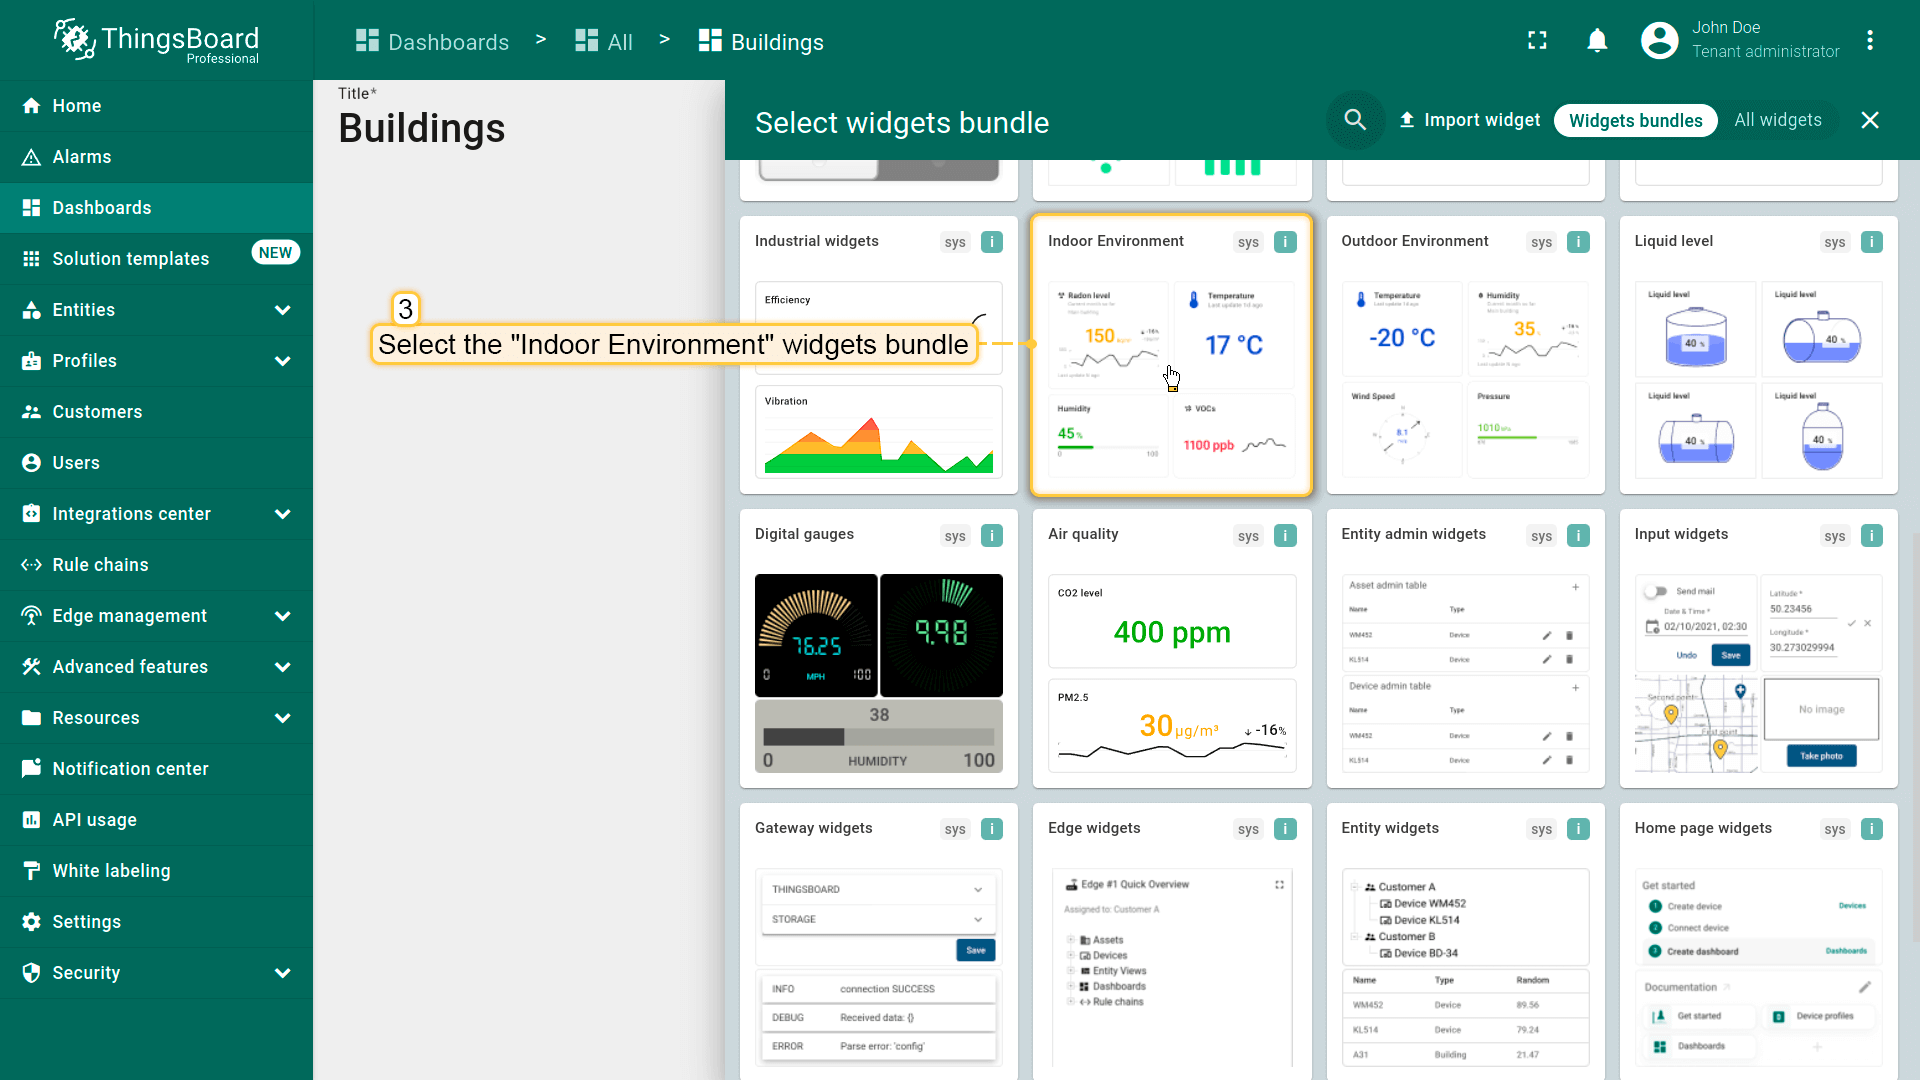
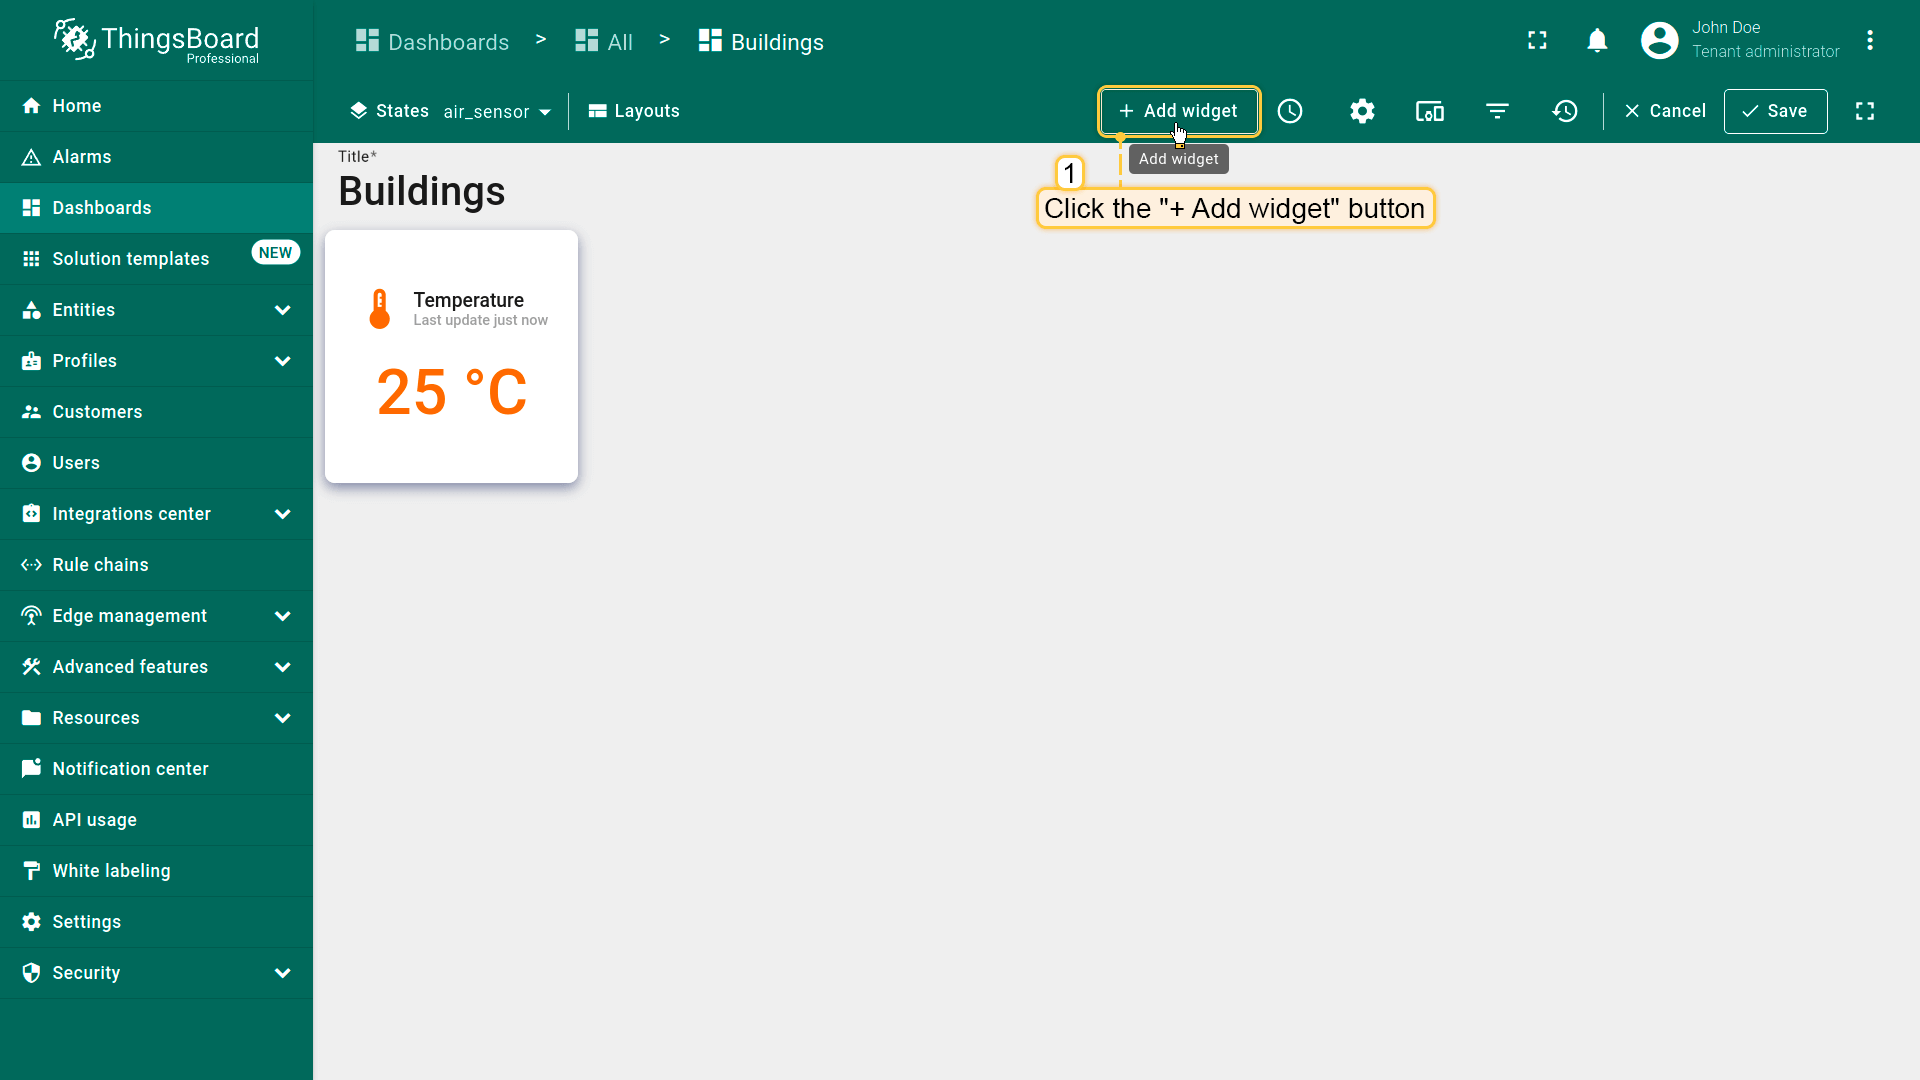
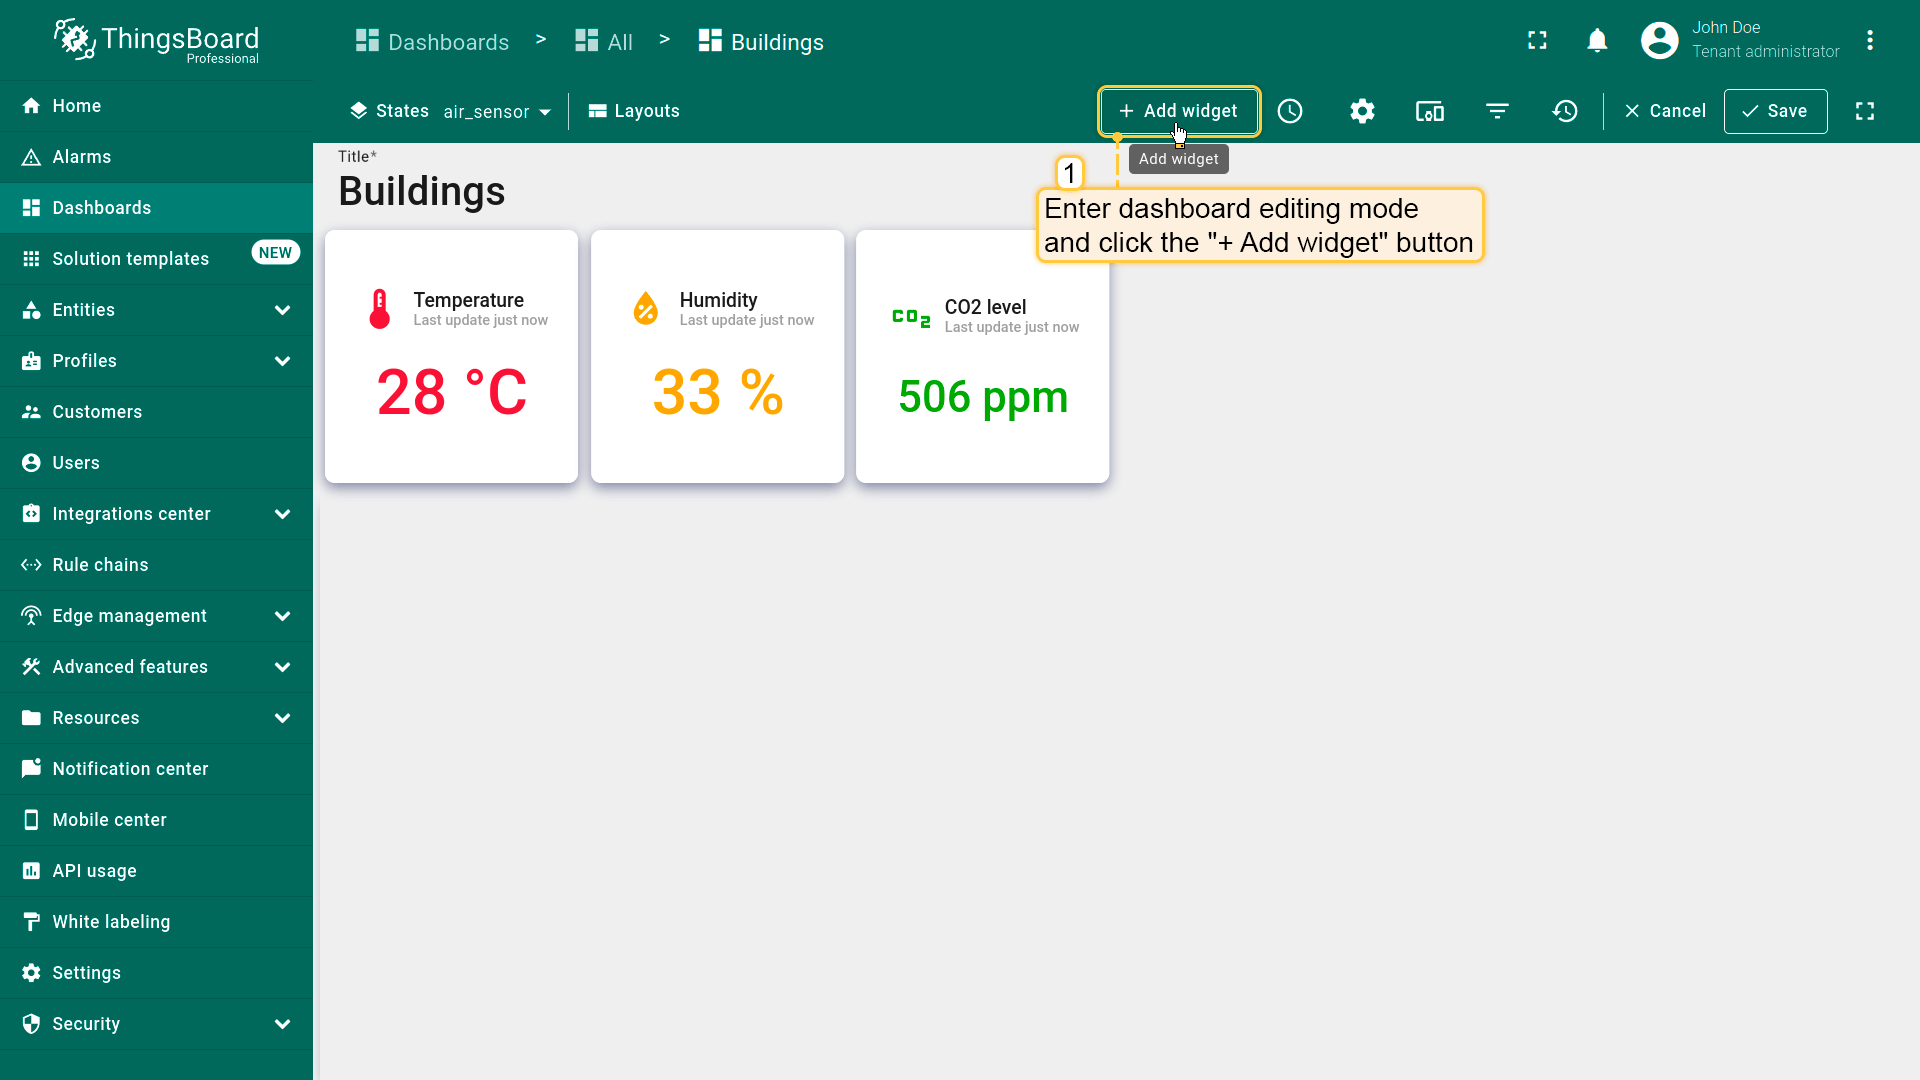
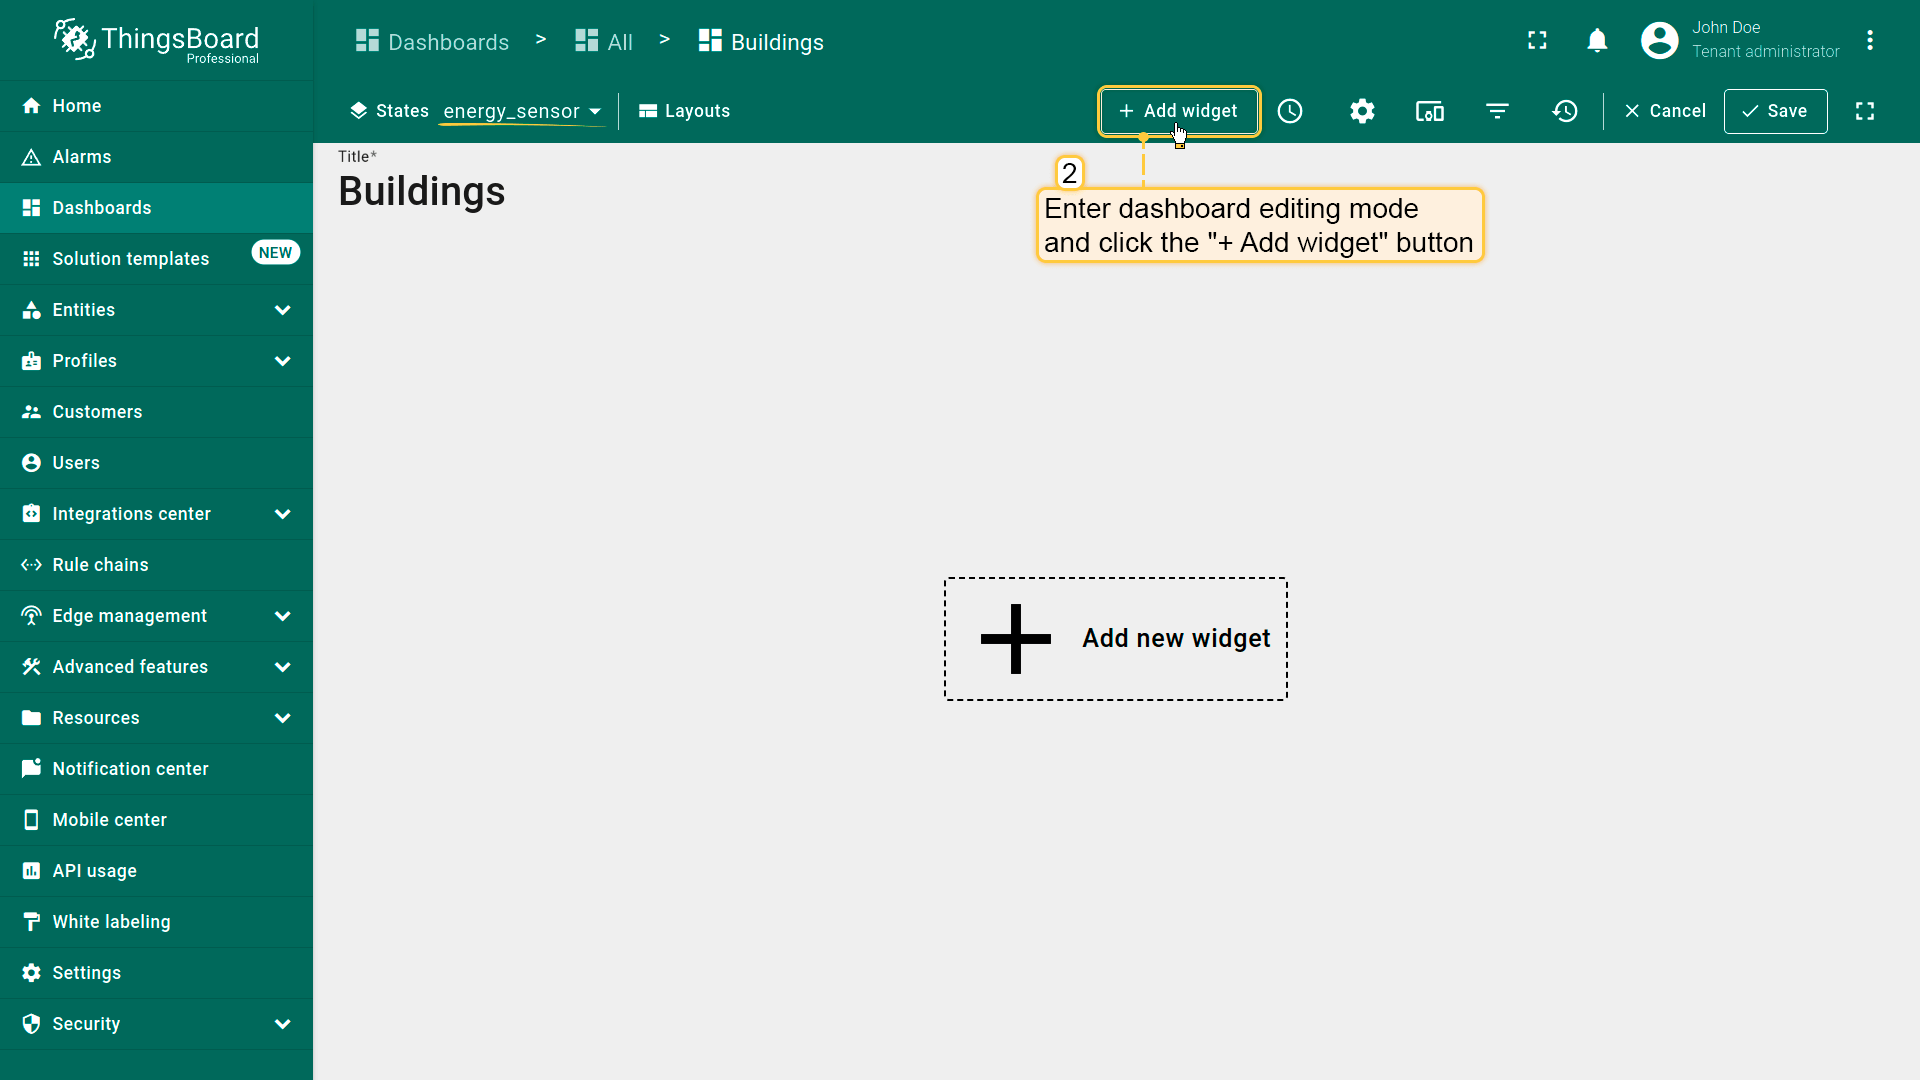
- 进入仪表板编辑模式,点击顶部的「+ Add widget」按钮或屏幕中央的大的「Add new widget」图标;
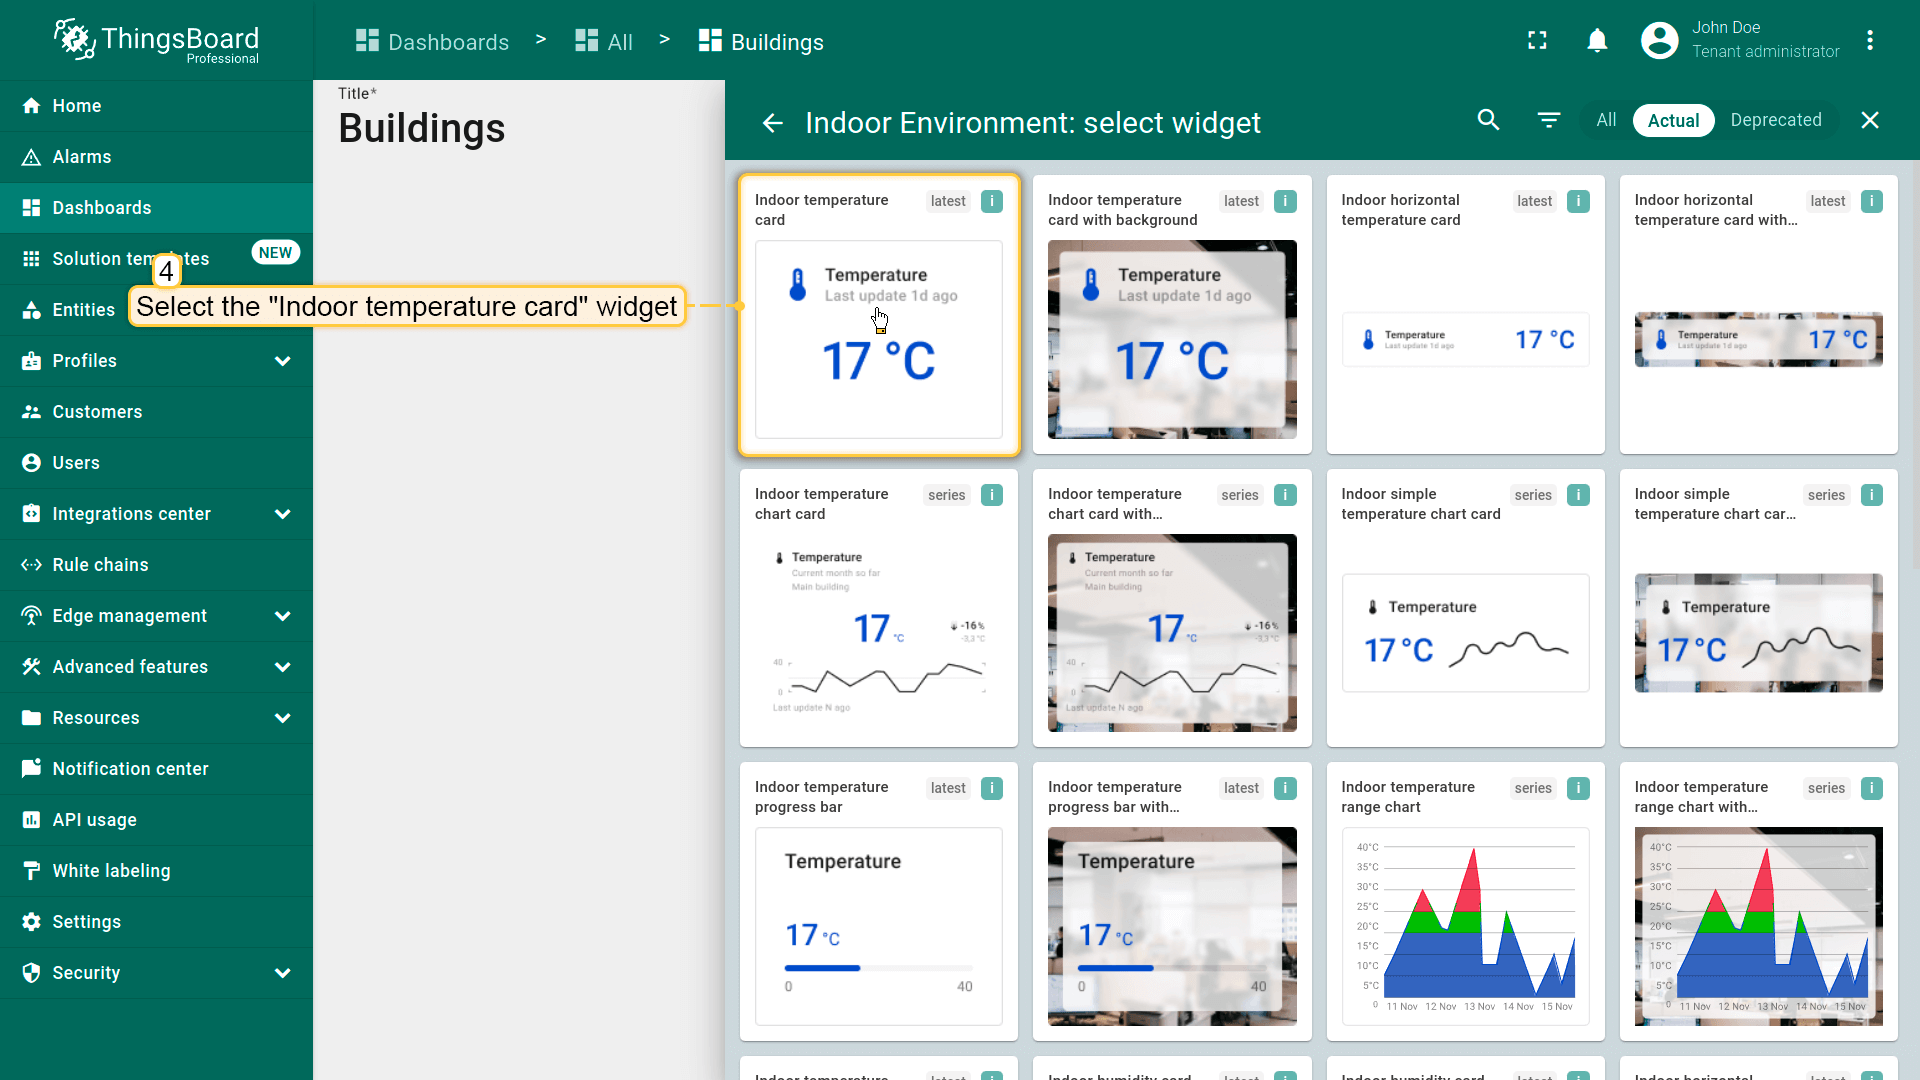
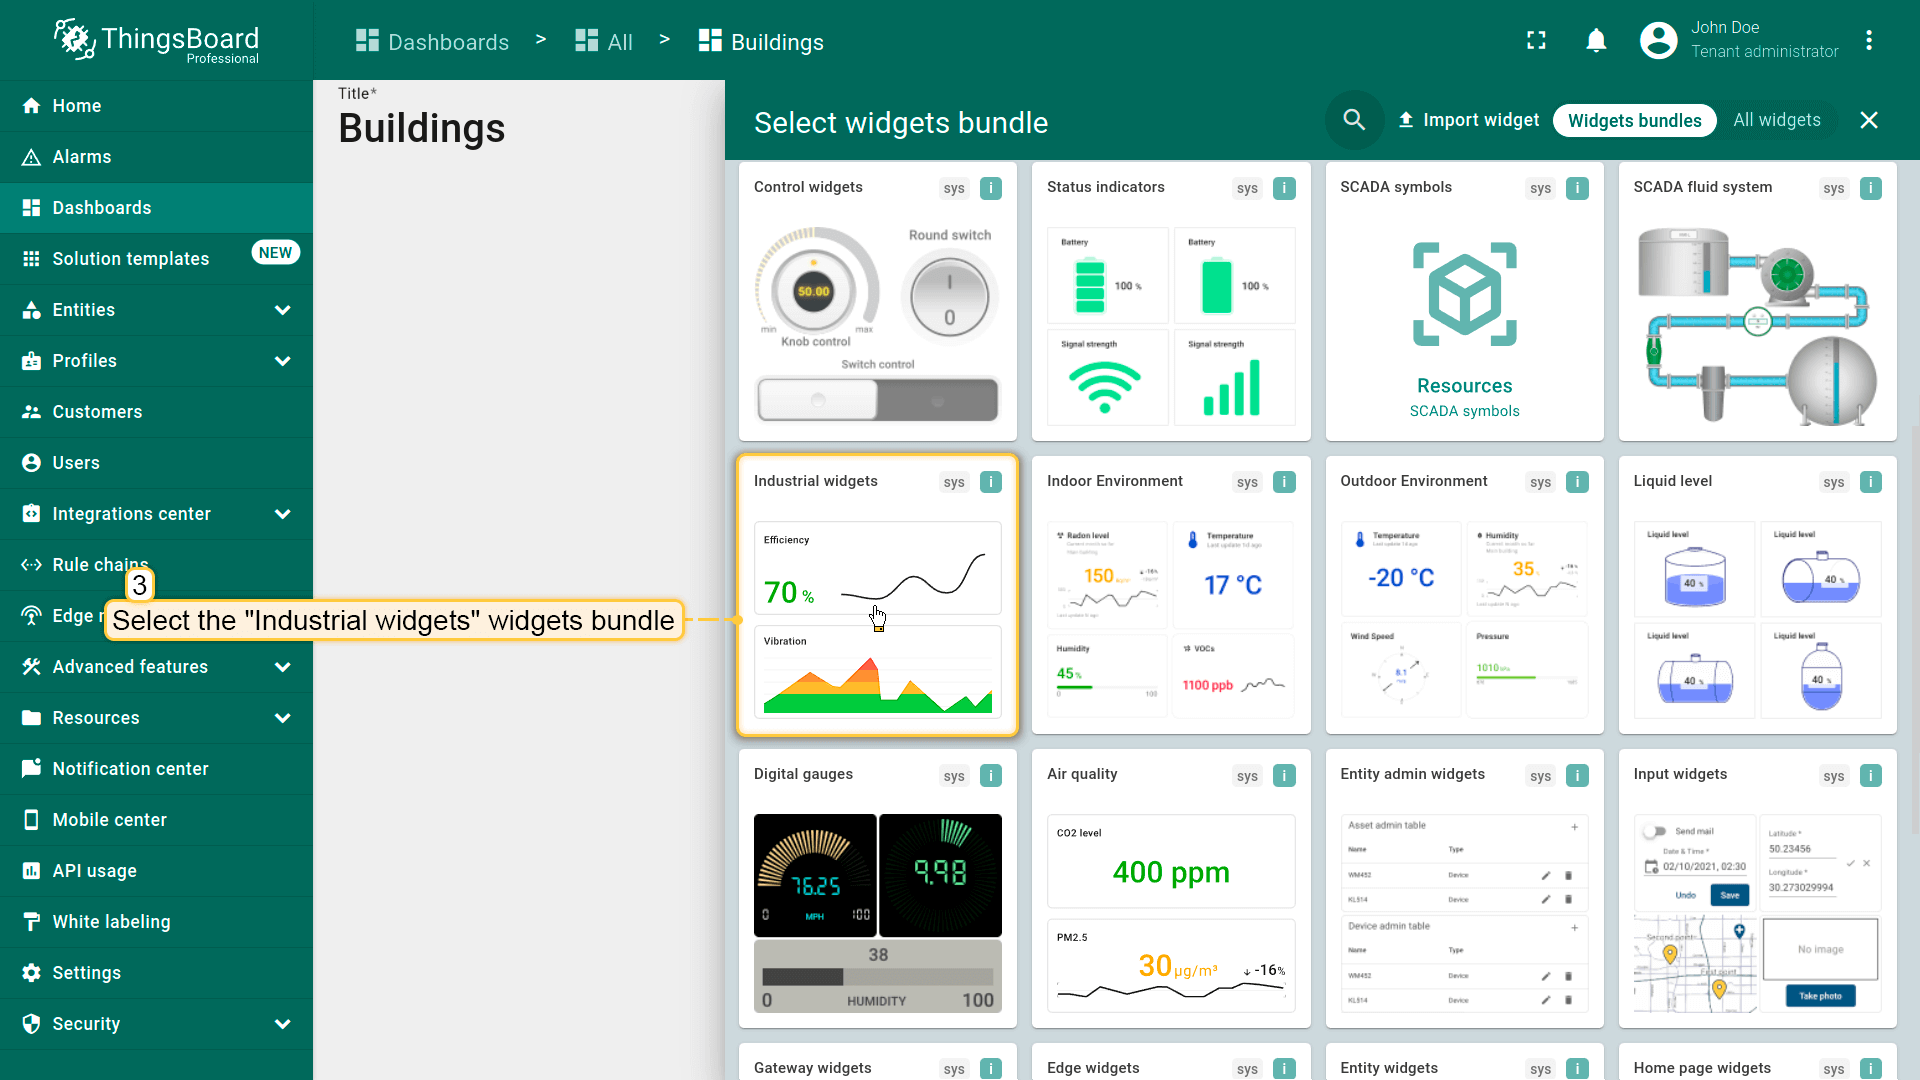
- 找到「Indoor Environment」部件包并点击;
- 选择「Indoor temperature card」部件;
- 将「Selected entity」别名指定为数据源。用于「提取」温度值的「temperature」键已添加;
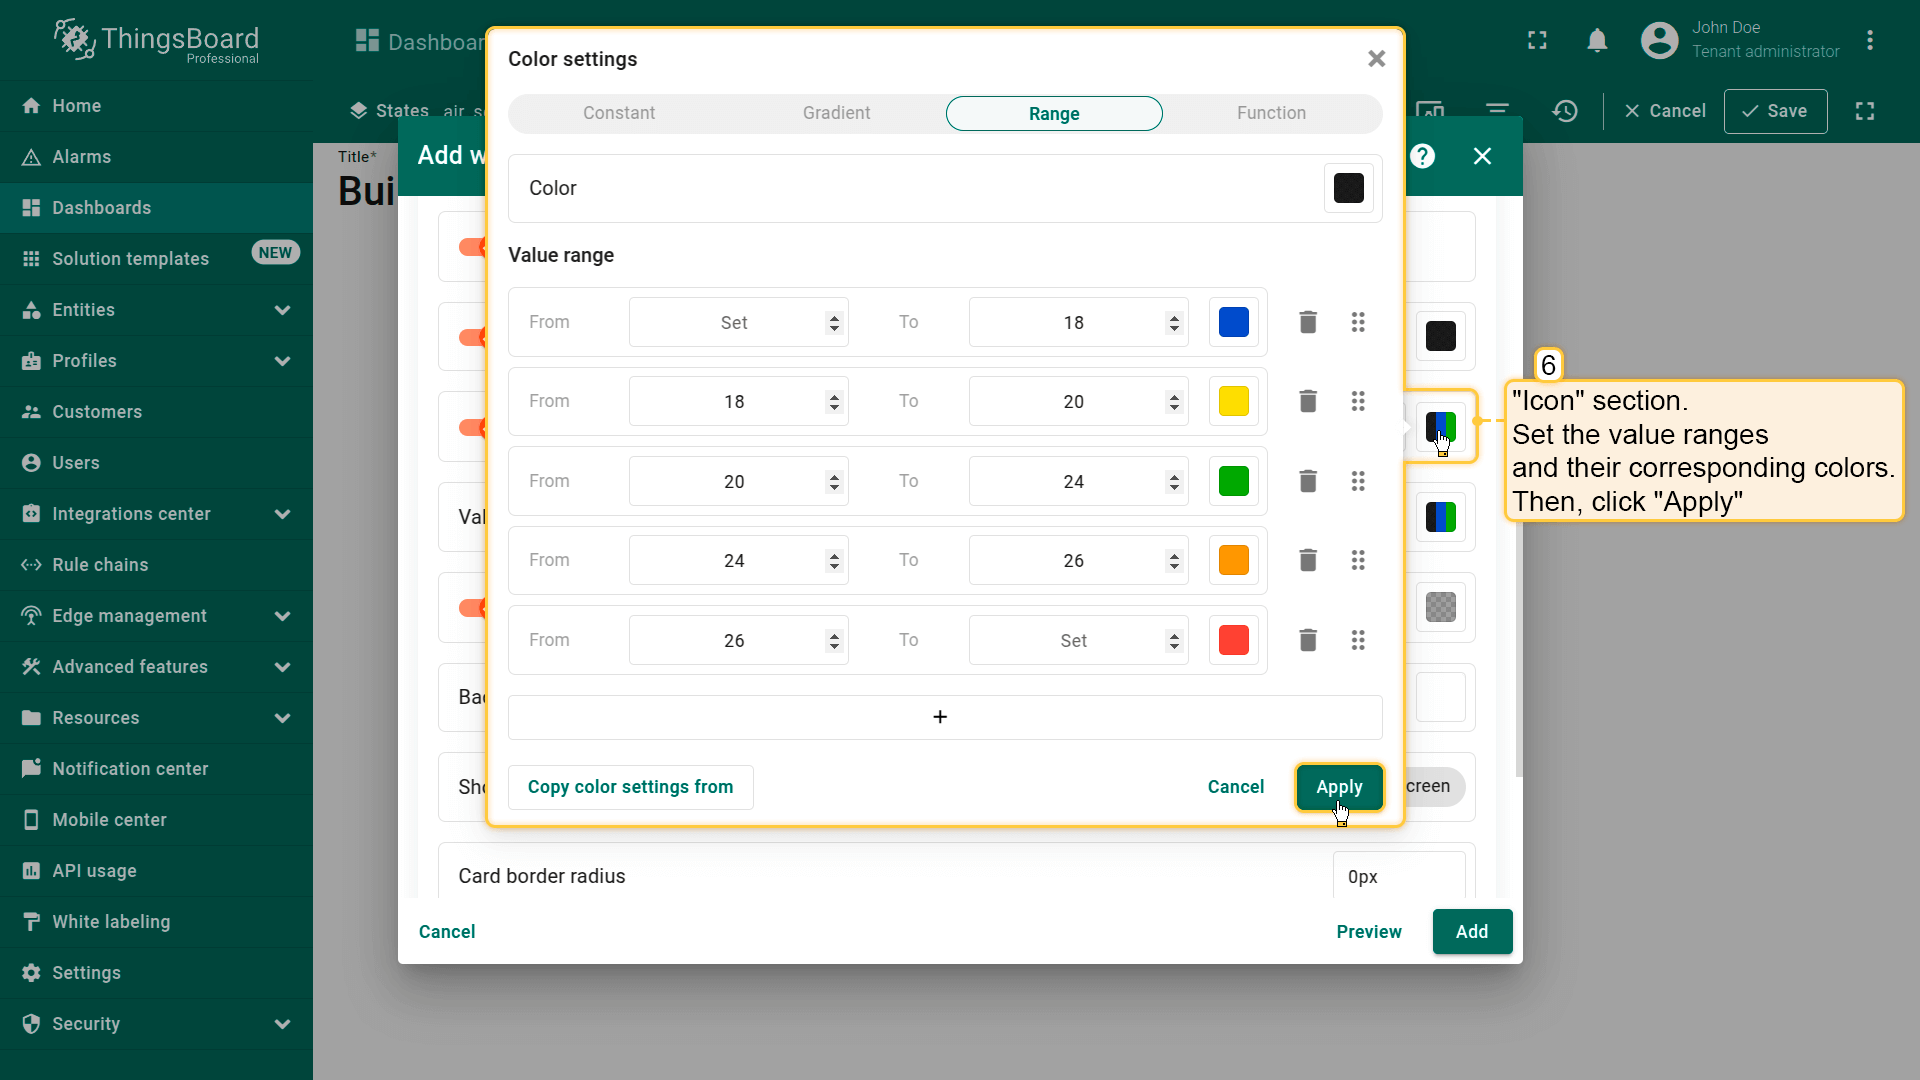
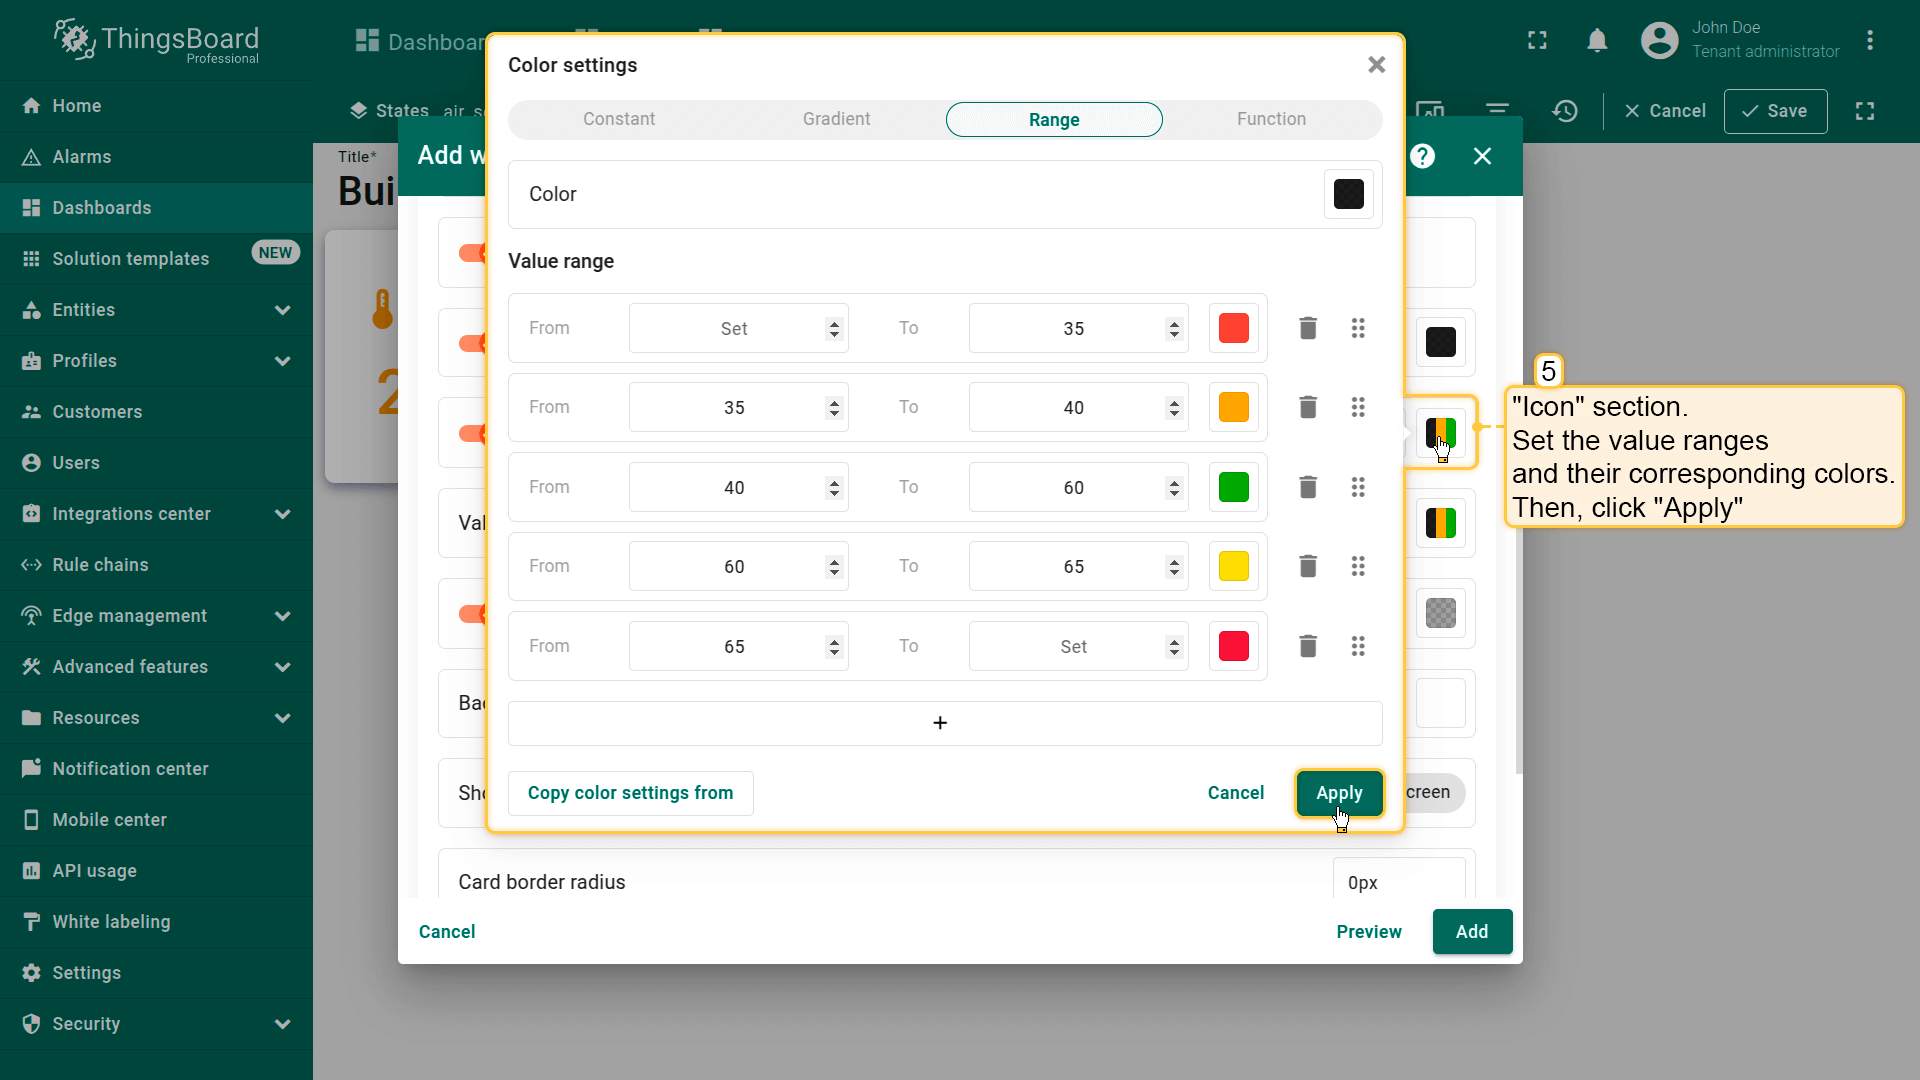
- 向下滚动到「Icon」区域。使用预定义范围根据温度值自定义图标颜色变化。便于更快估算温度值。设置取值范围及对应颜色。然后点击「Apply」;
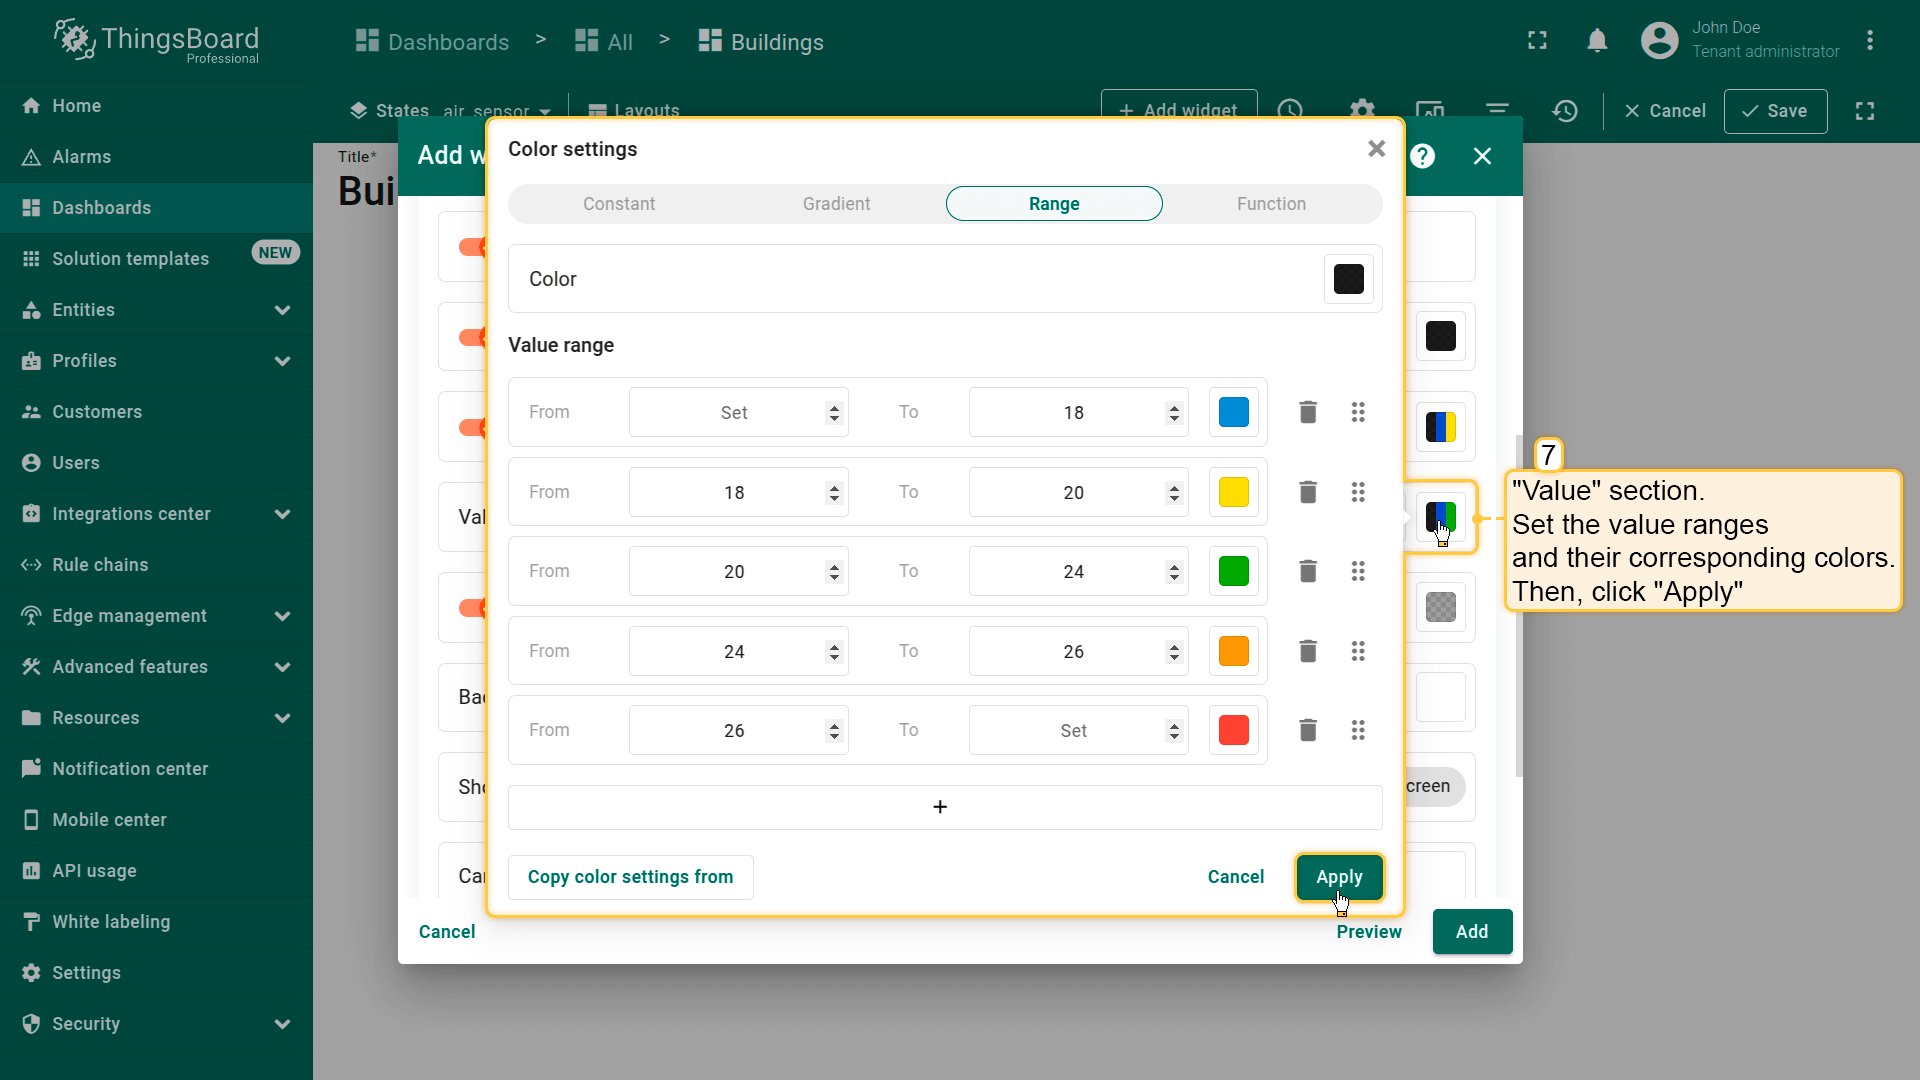
- 为「Value」区域设置取值范围及对应颜色。应用更改;
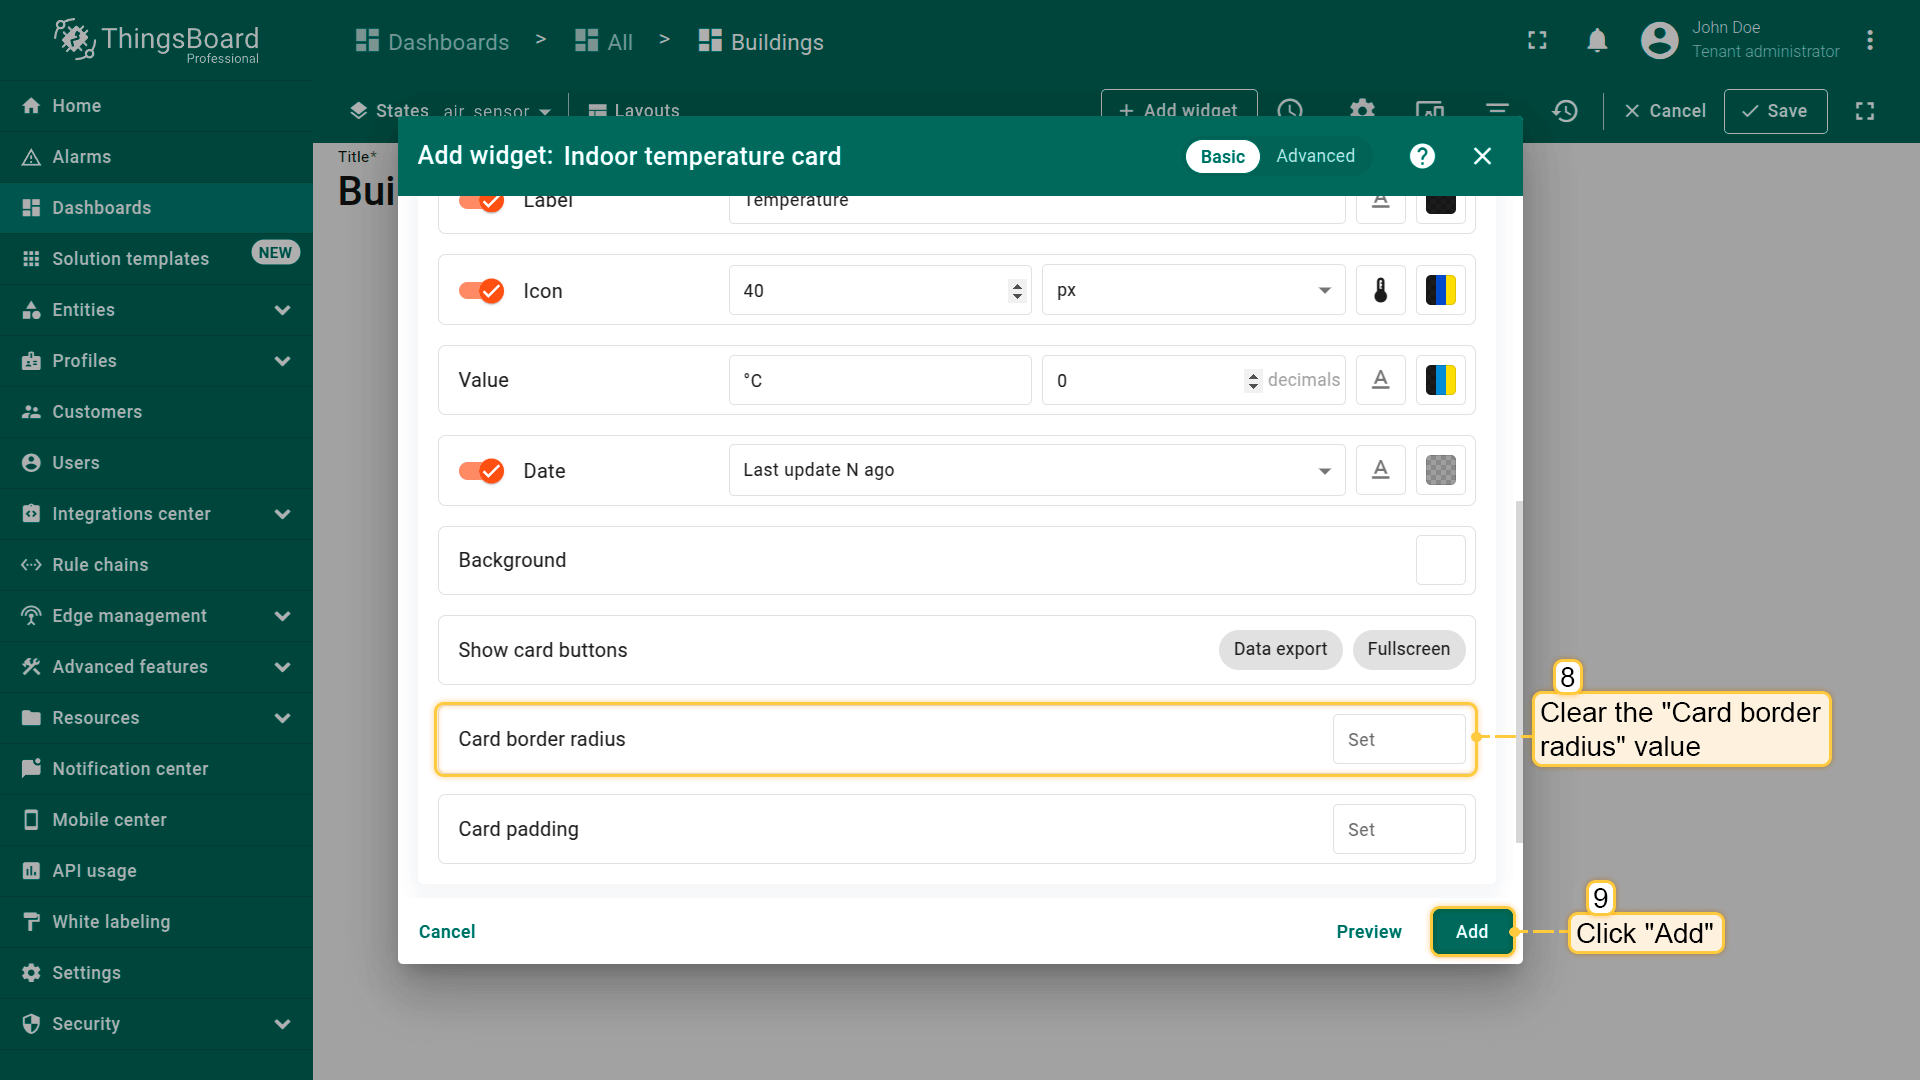
- 清空「Card border radius」值,点击「Add」;
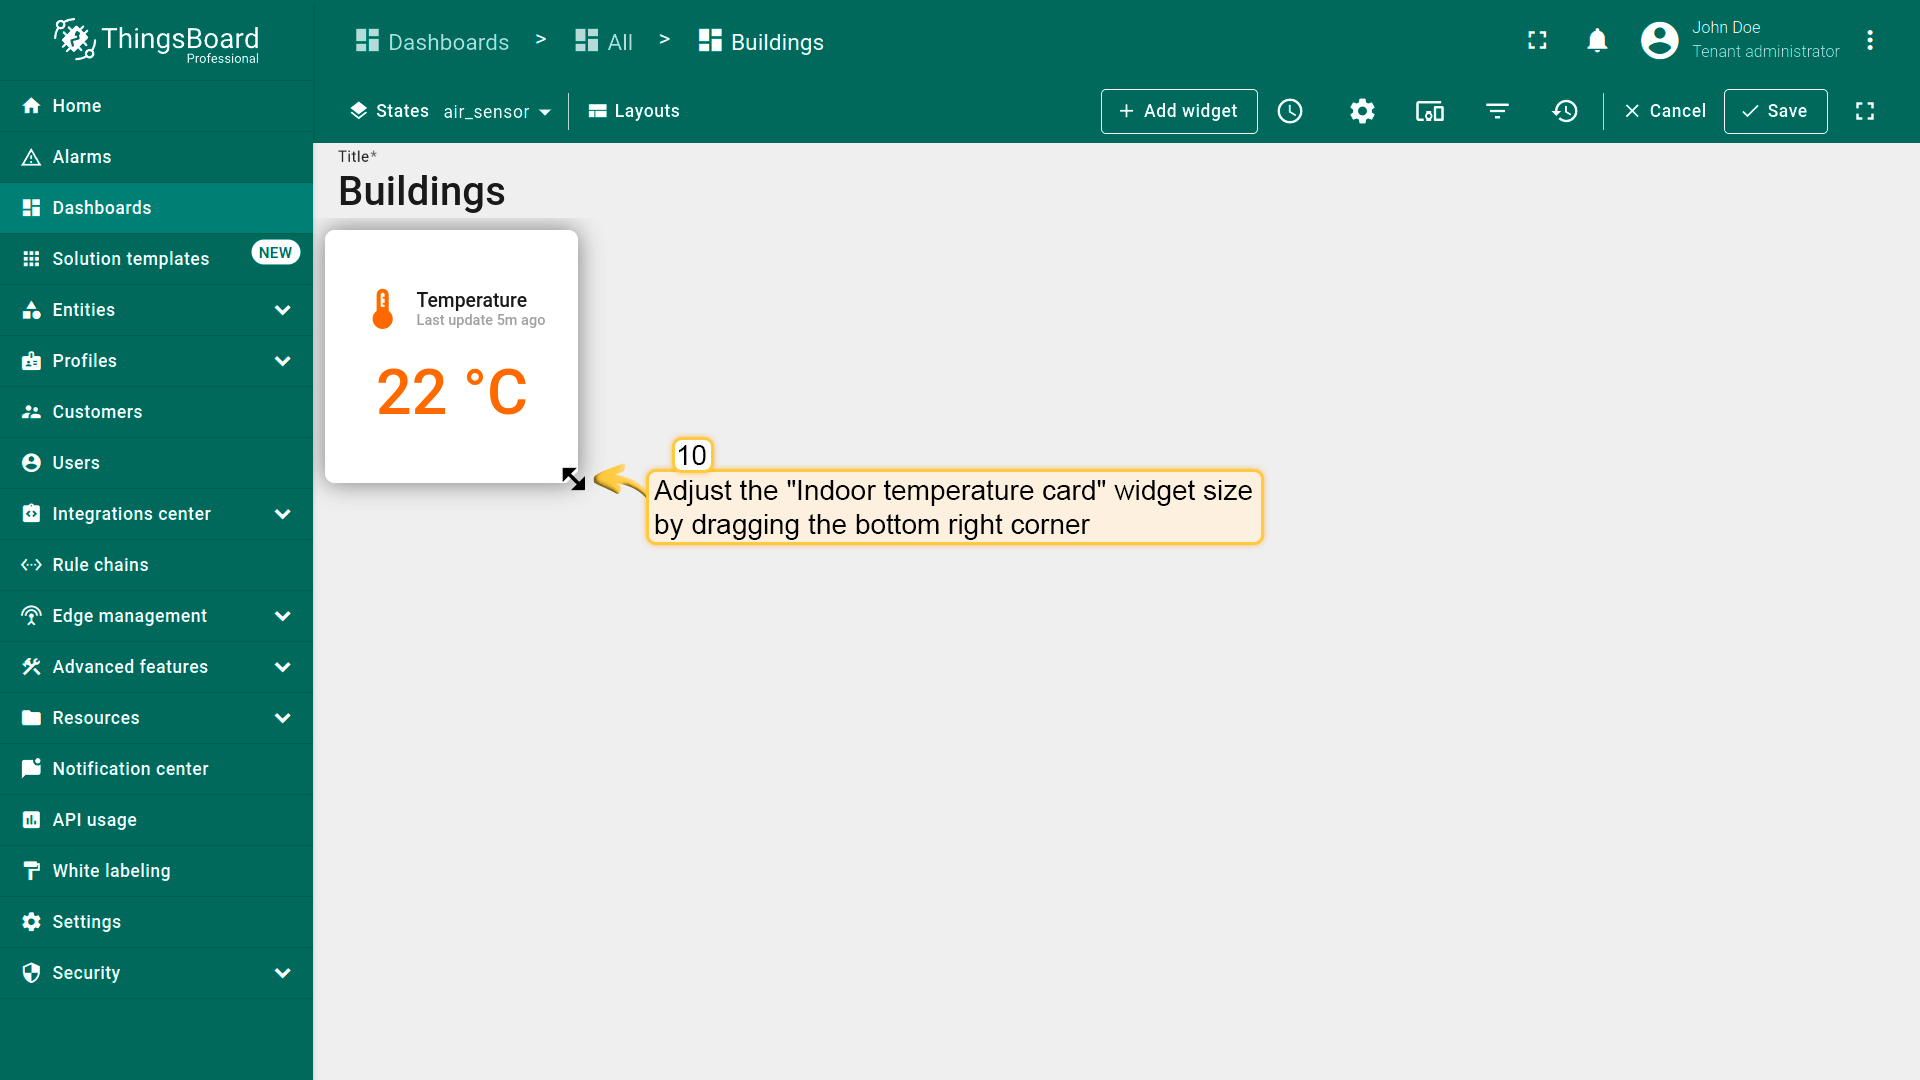
- 我们已添加显示当前温度的部件。按需调整部件大小。


Now, add a widget to display the humidity.
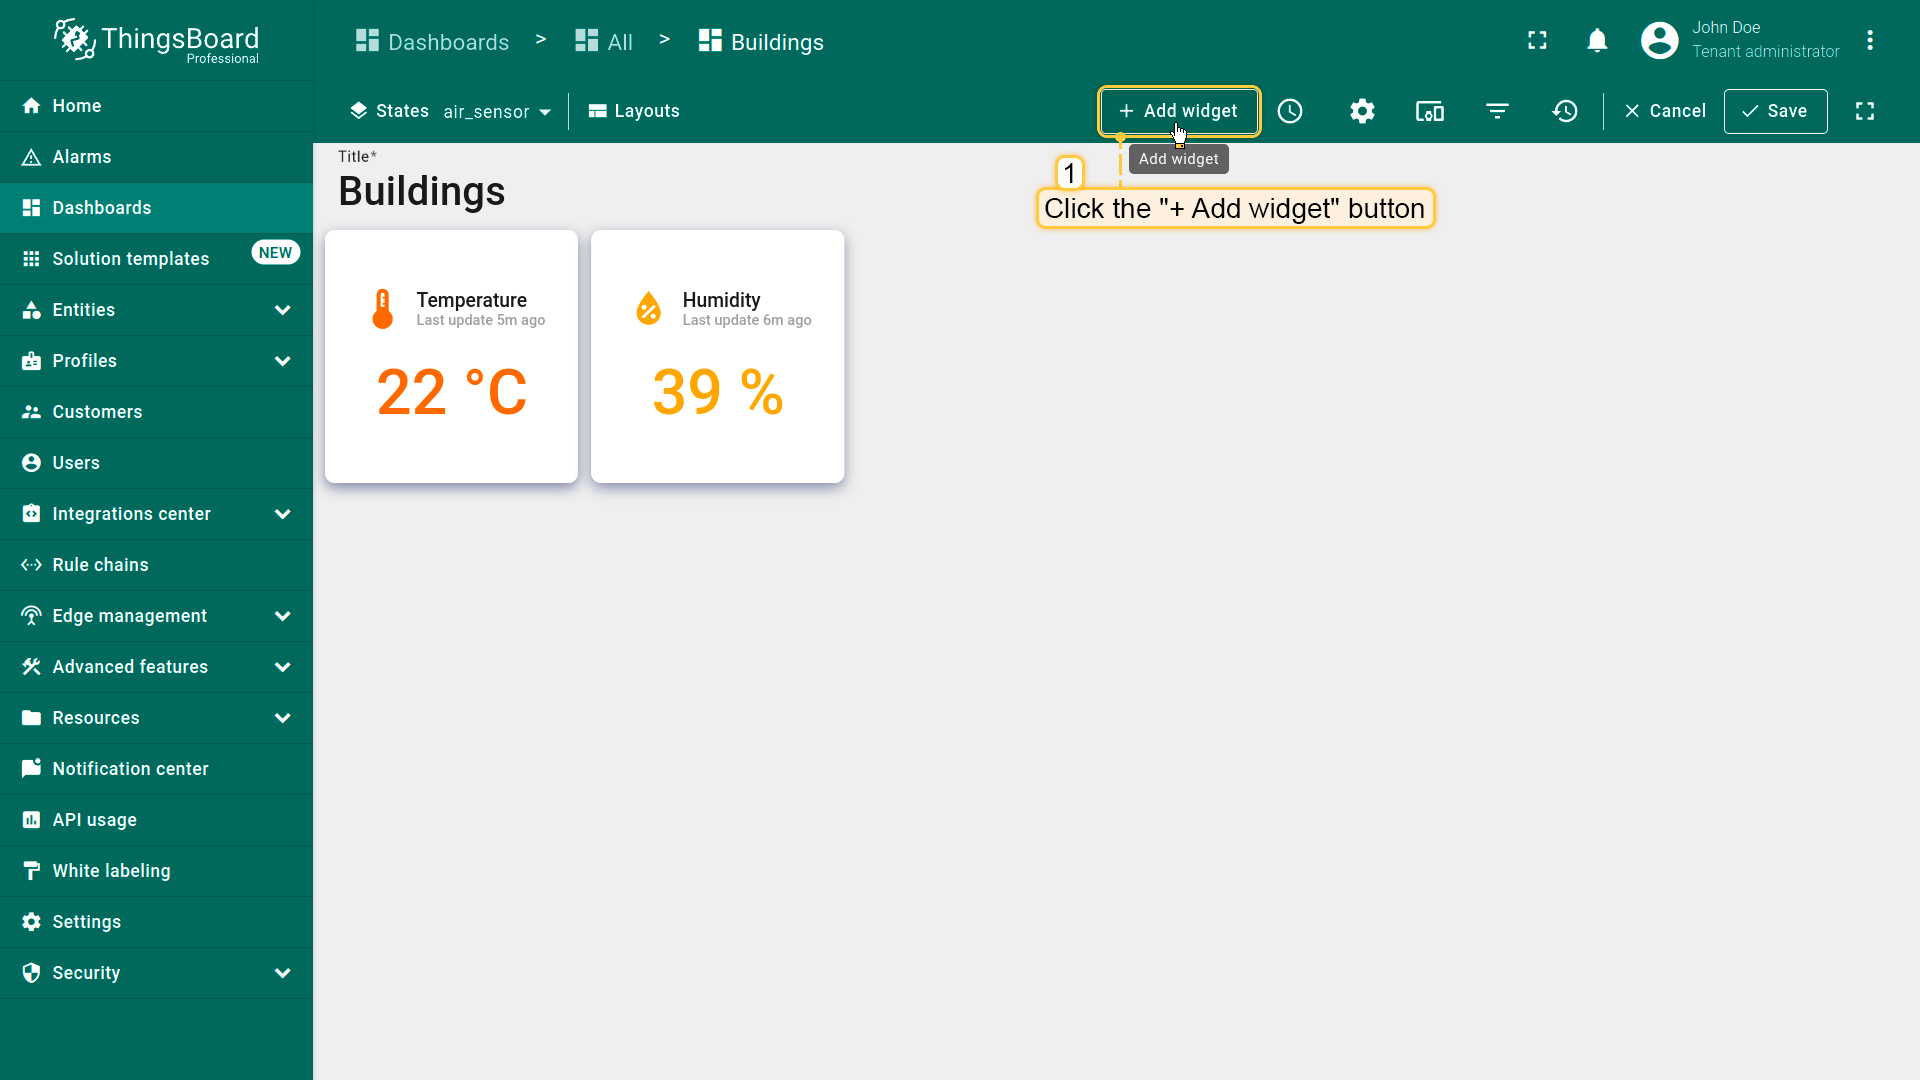
- 点击屏幕顶部的「Add widget」按钮;
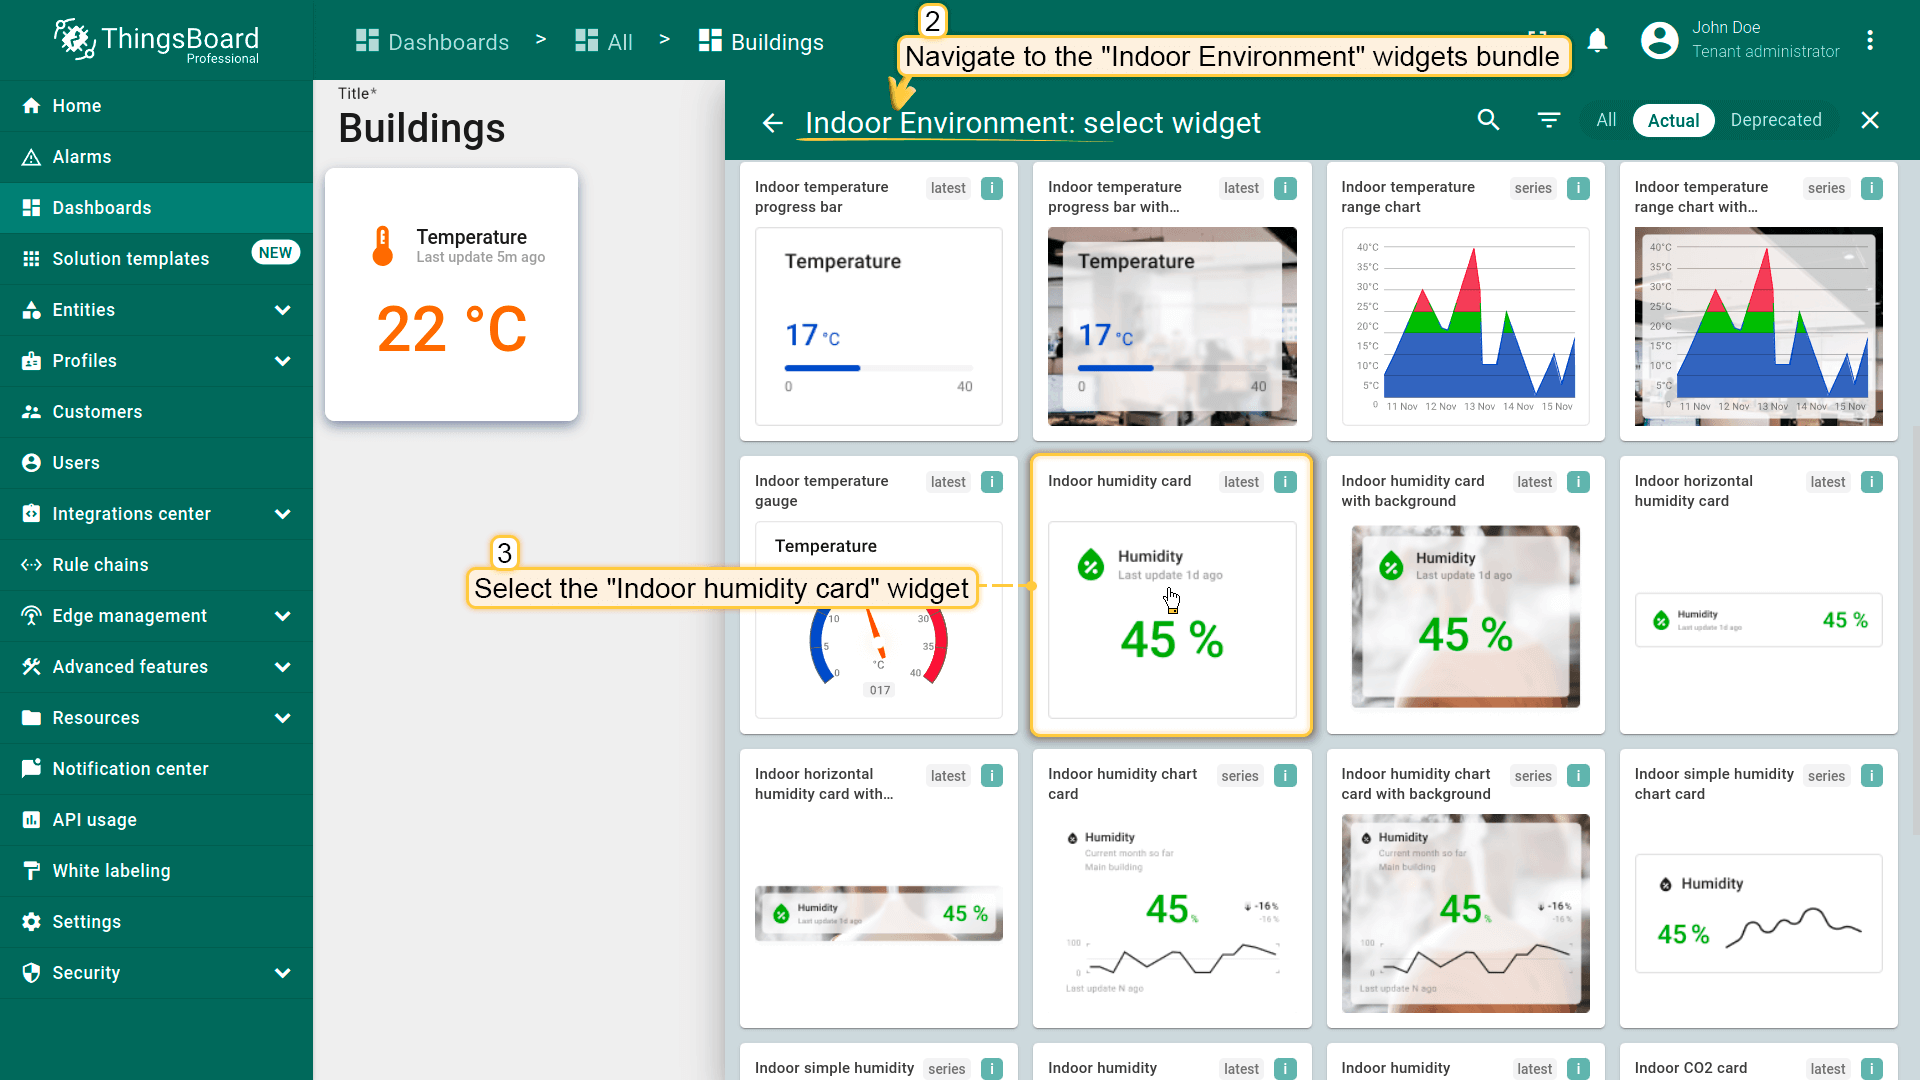
- 进入「Indoor Environment」部件包并选择「Indoor humidity card」部件;
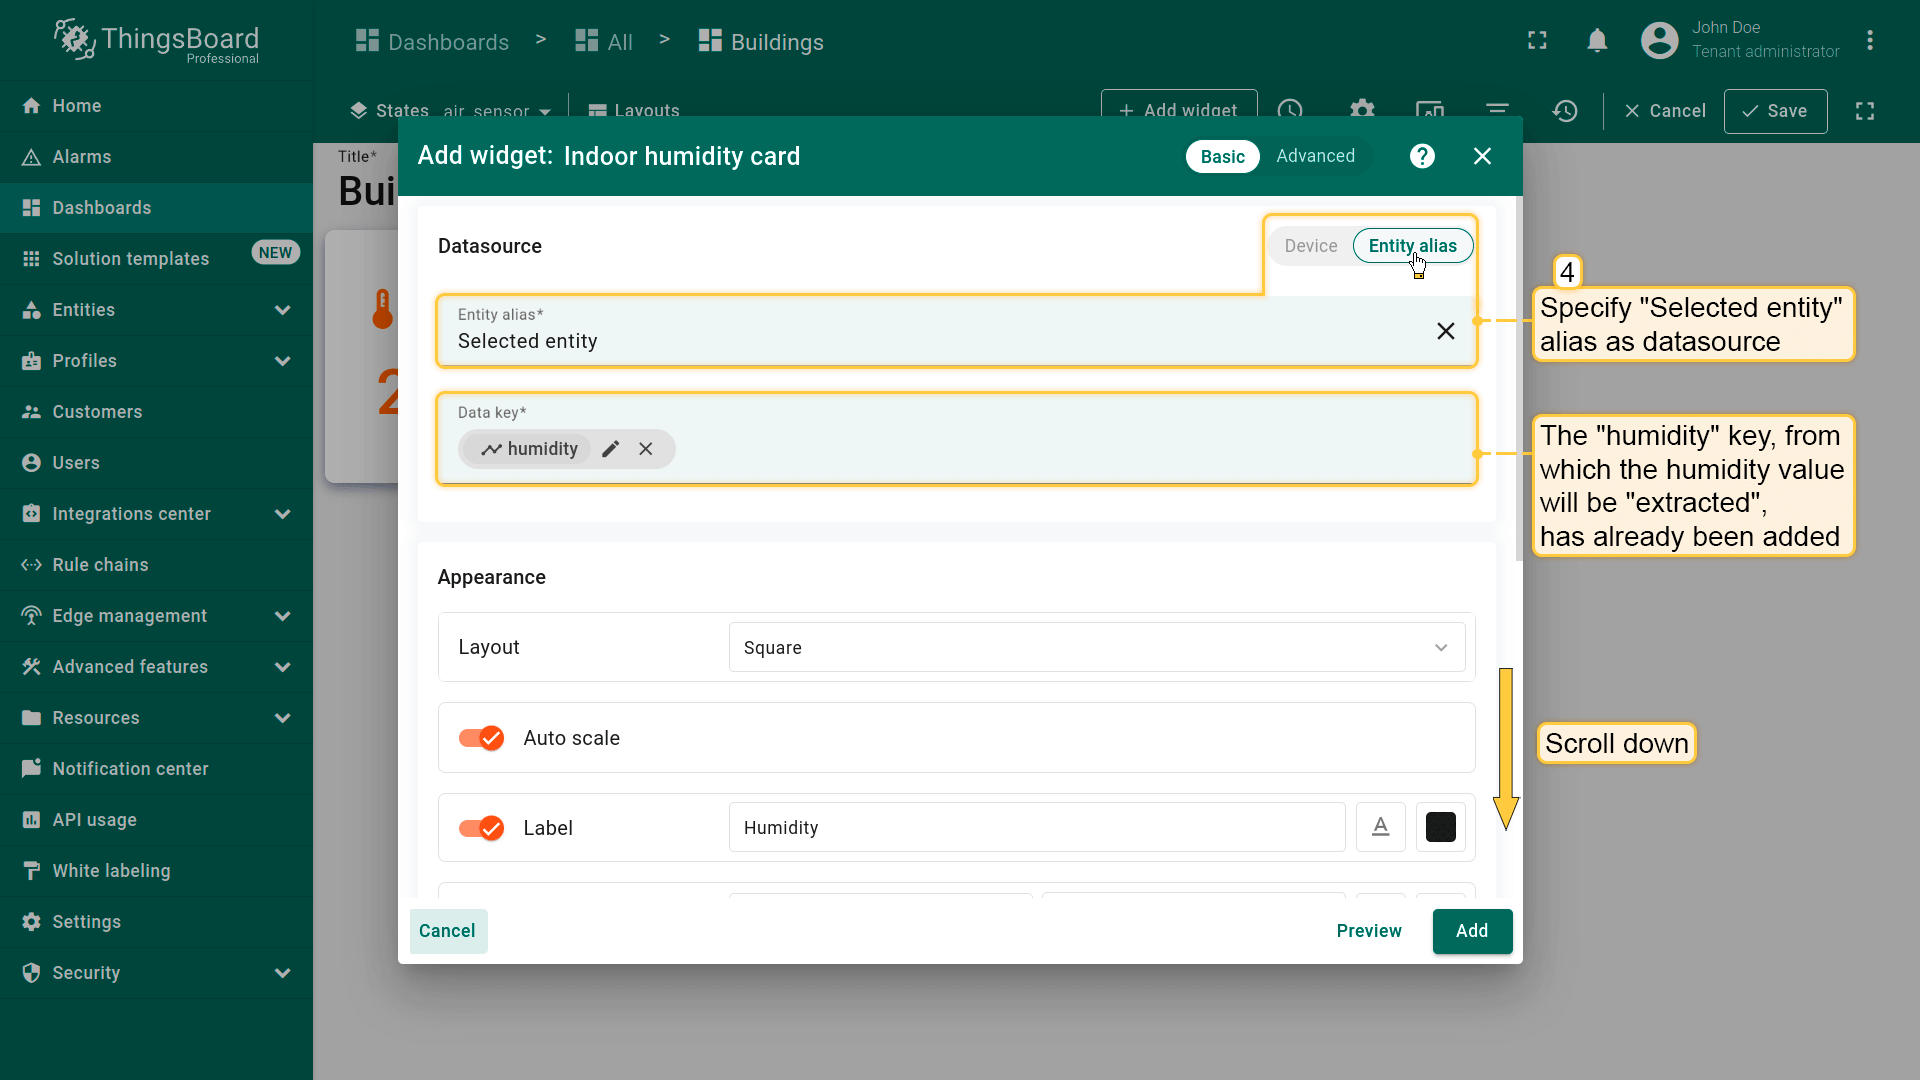
- 将「Selected entity」别名指定为数据源。用于「提取」湿度值的「humidity」键已添加;
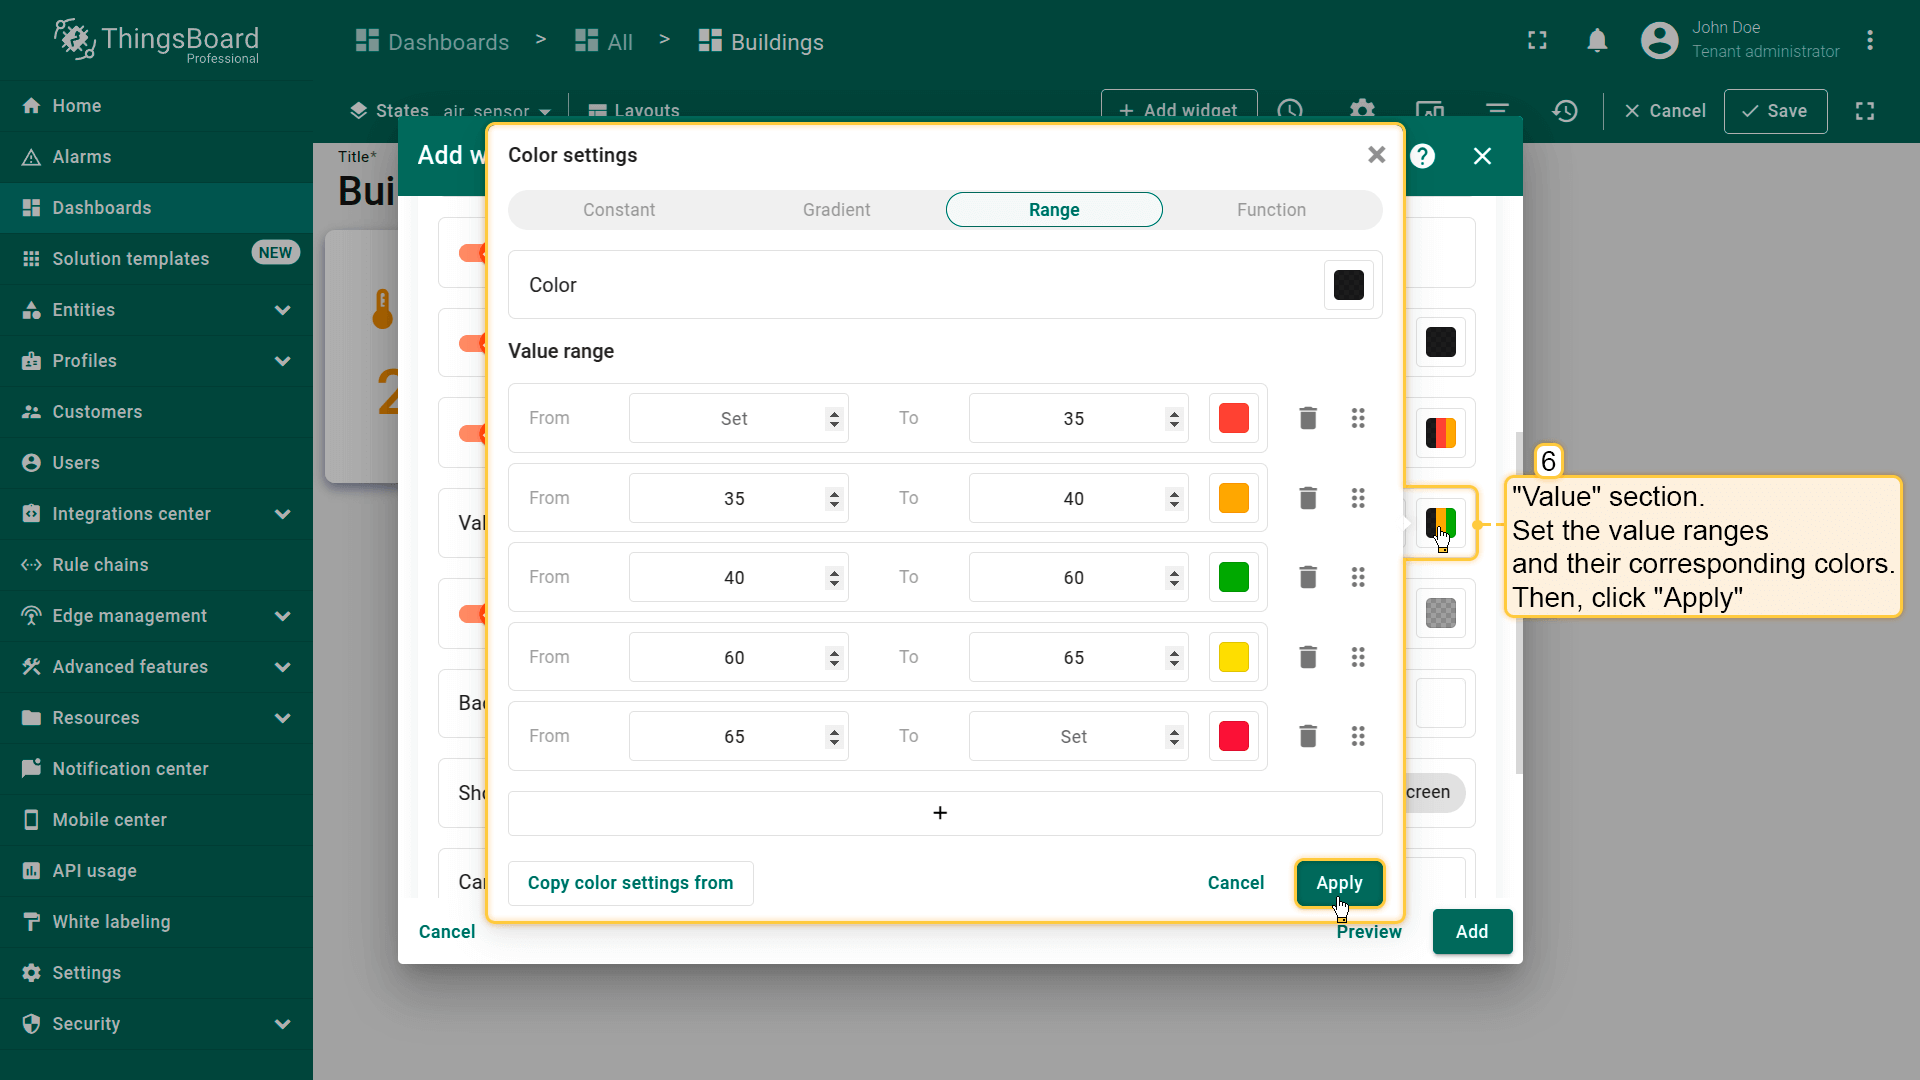
- 向下滚动到「Icon」区域。设置取值范围及对应颜色。然后点击「Apply」;
- 为「Value」区域设置取值范围及对应颜色。应用更改;
- 清空「Card border radius」值。点击「Add」;
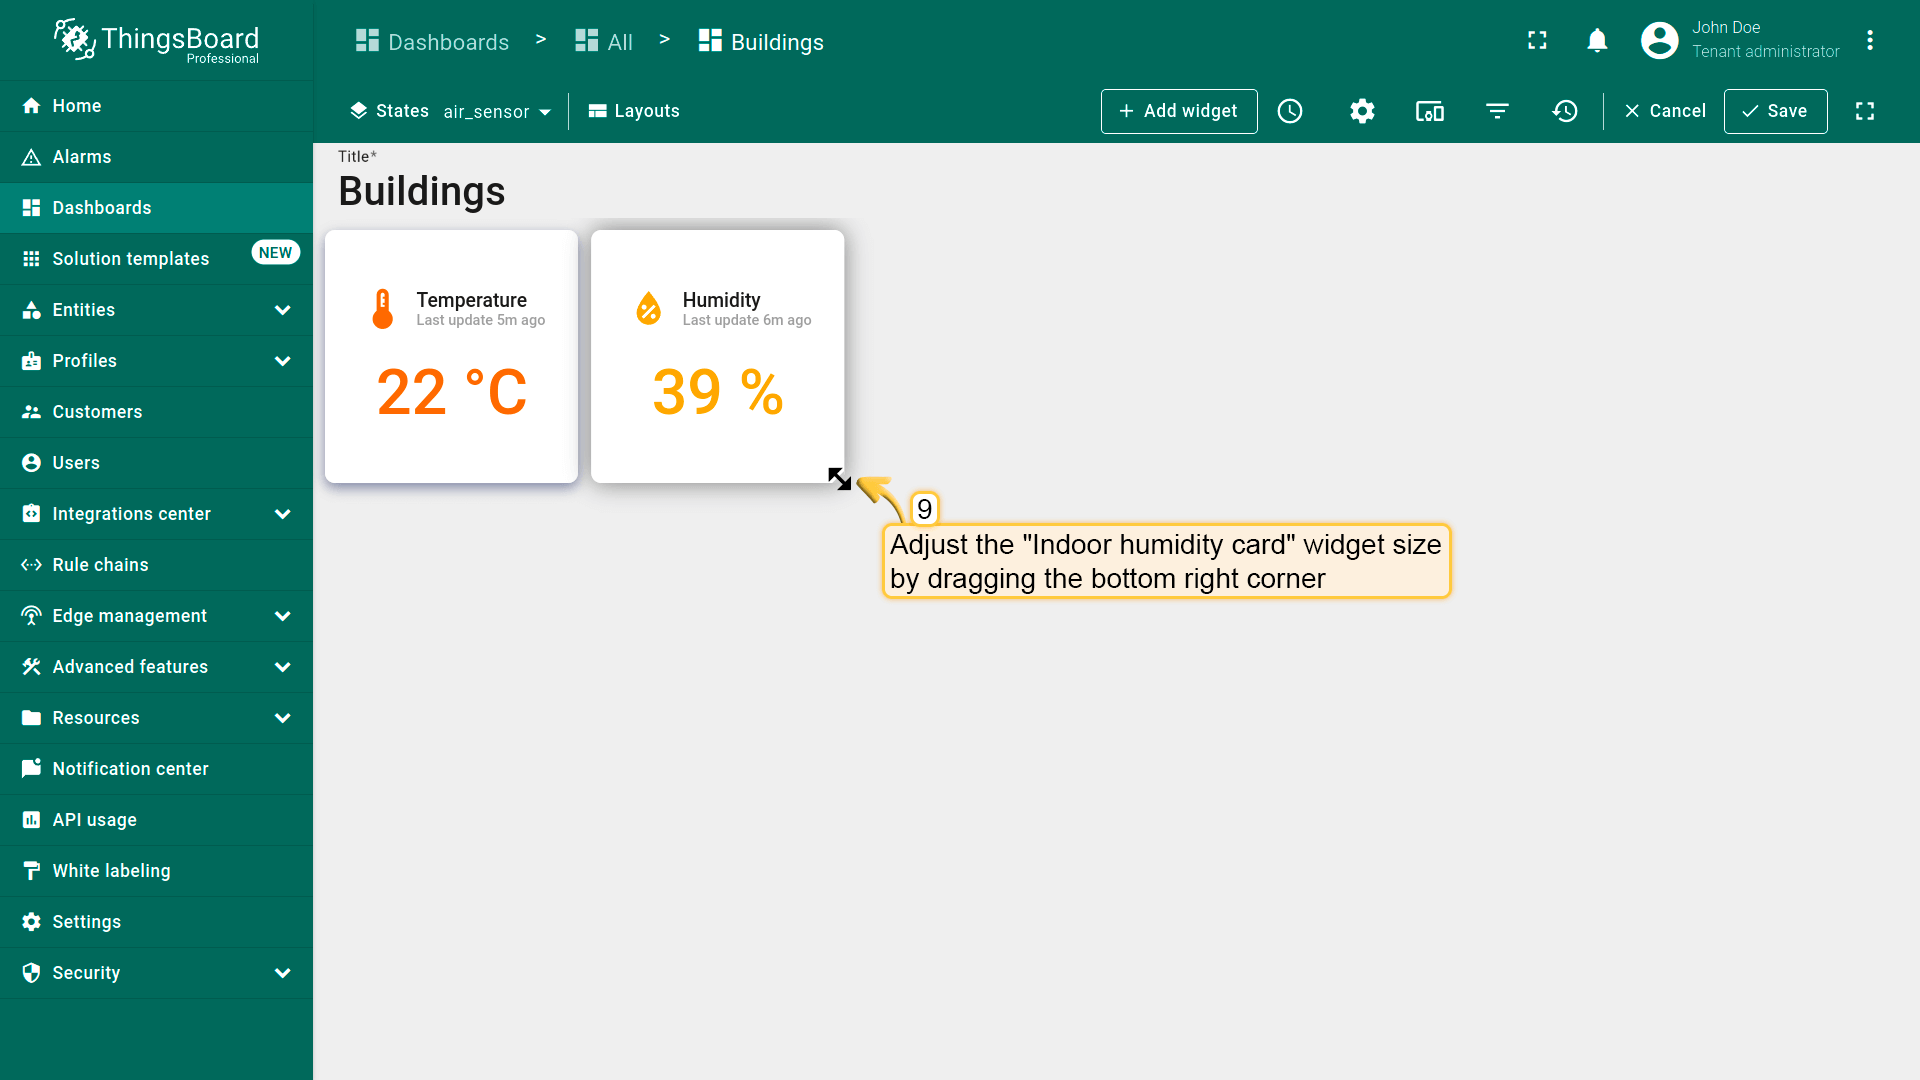
- 已添加显示当前湿度的部件。将其放在「Temperature」卡片部件右侧并调整大小。

Add another card widget to display the CO2 level.
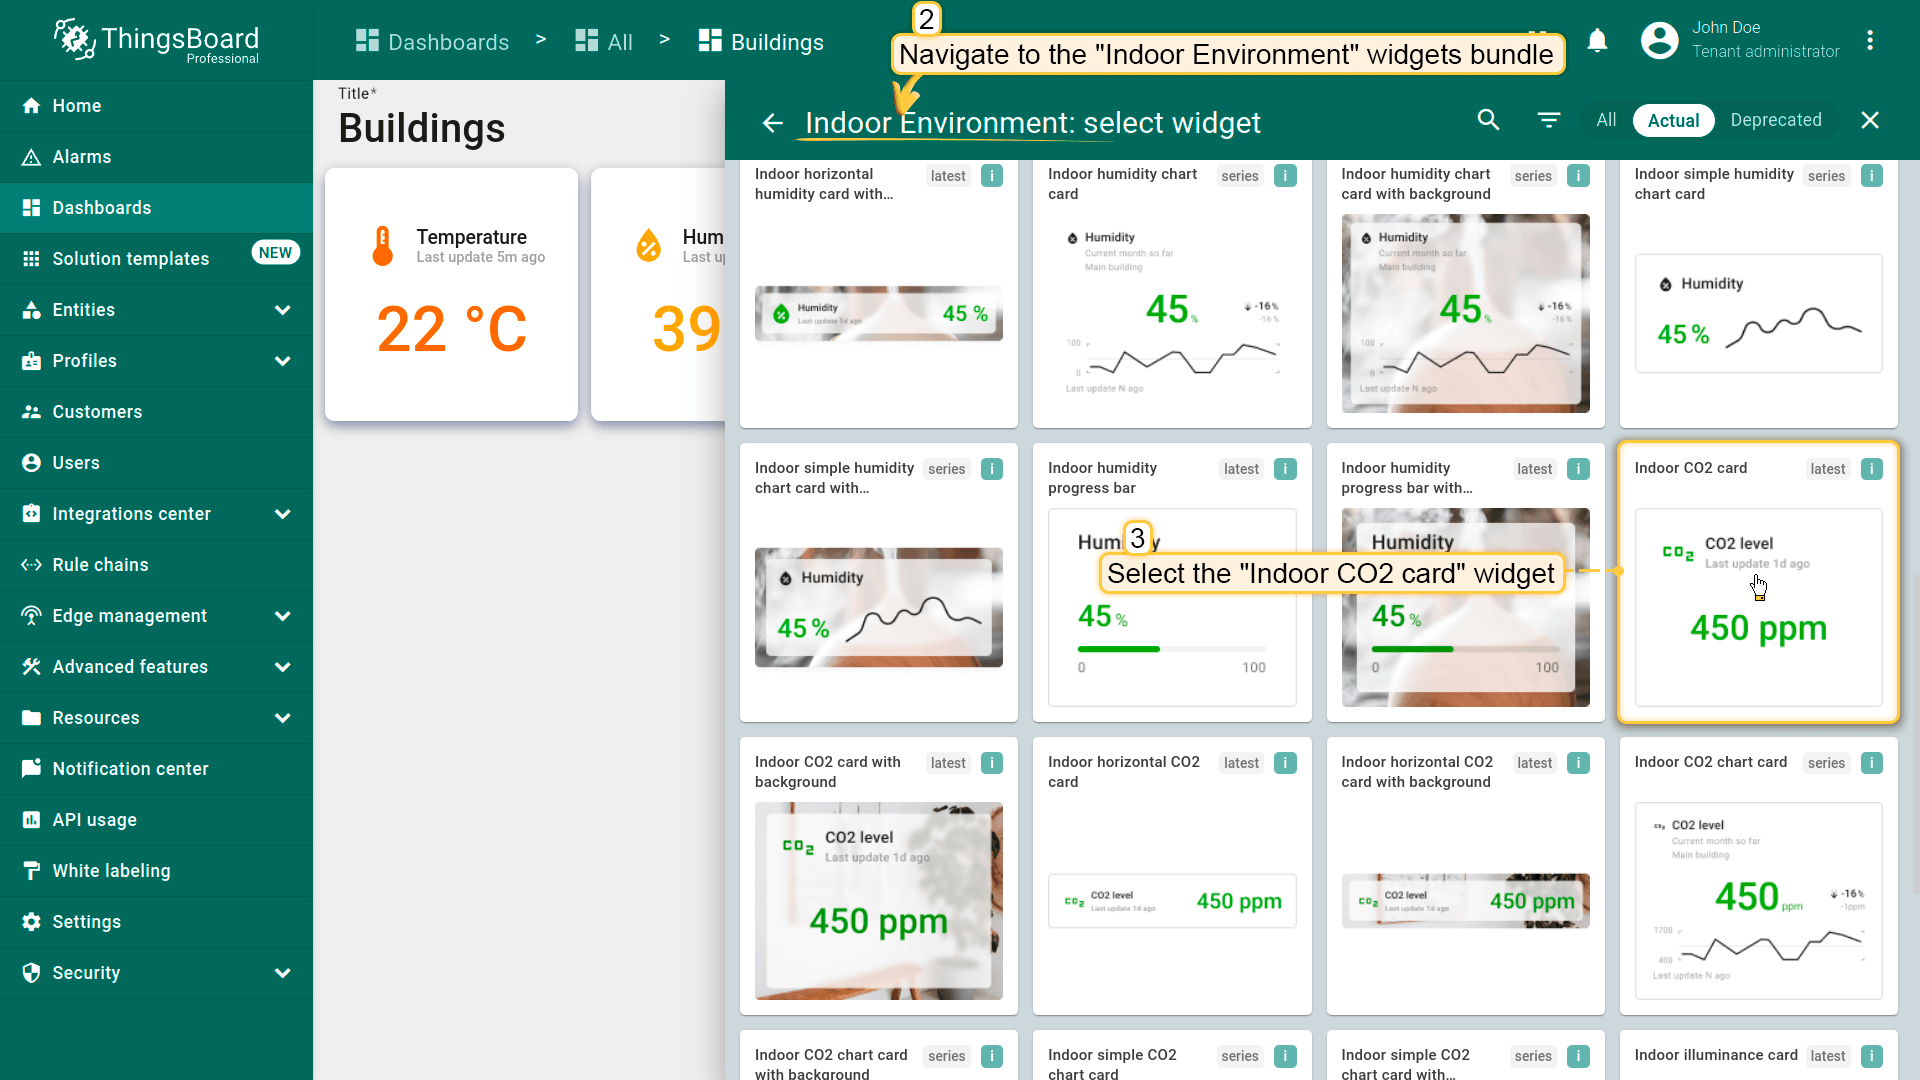
- 点击屏幕顶部的「+ Add widget」按钮;
- 选择「Indoor CO2 card」部件。该部件位于「Indoor Environment」部件包中;
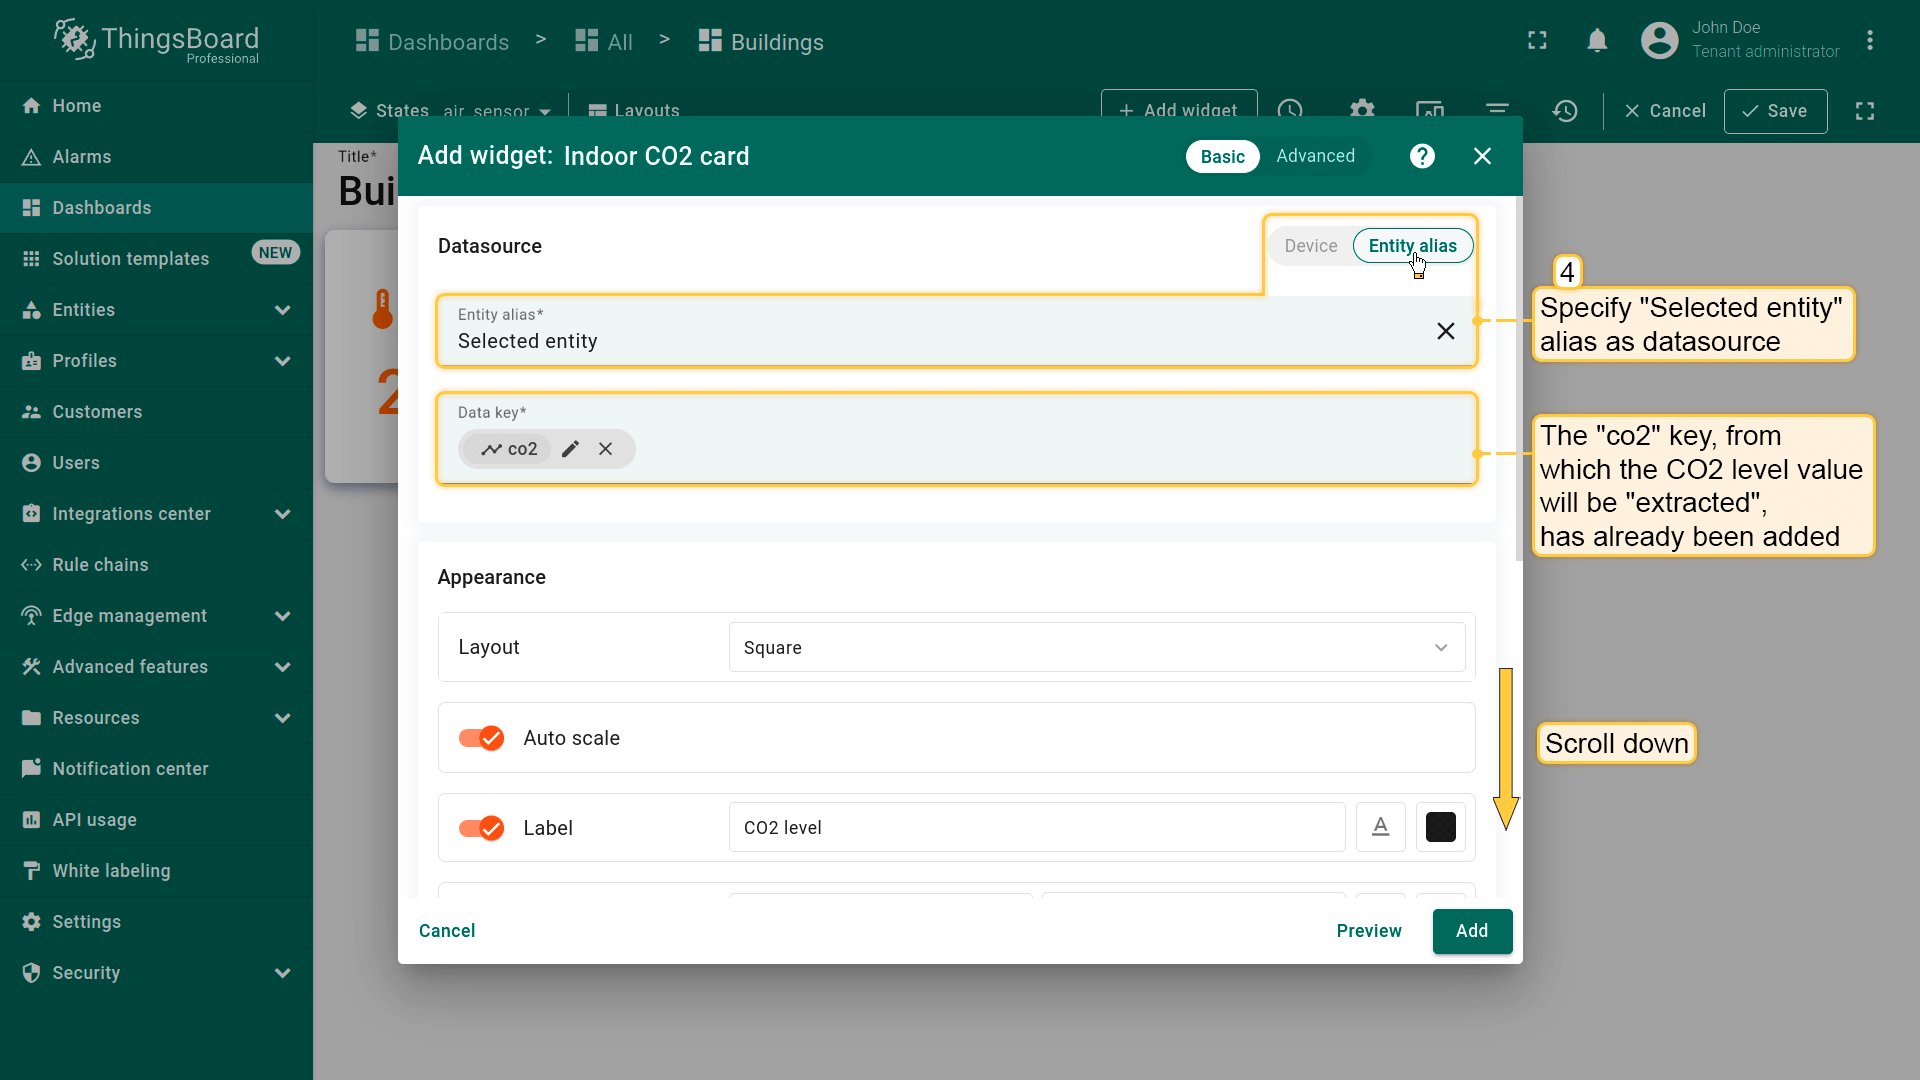
- 将「Selected entity」别名指定为数据源。用于「提取」空气中 CO2 值的「CO2」键已添加;
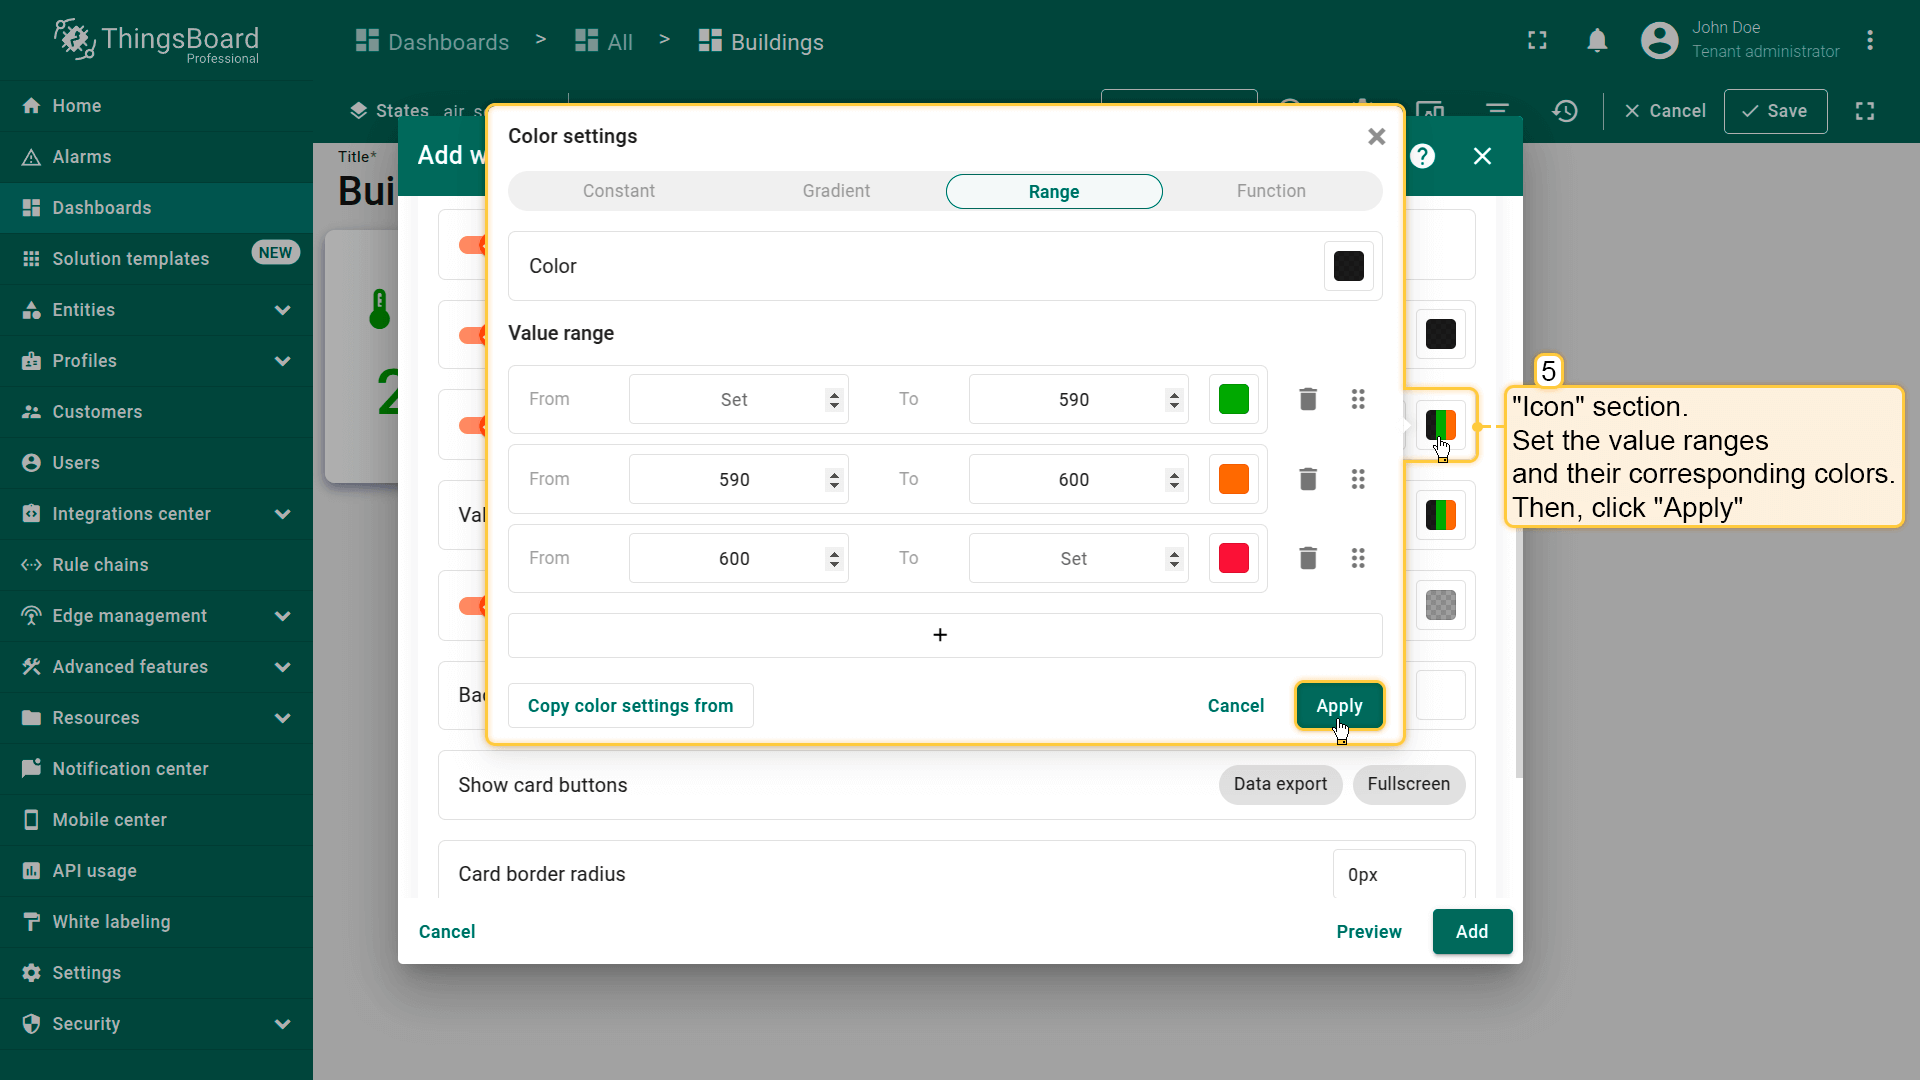
- 向下滚动到「Icon」区域。设置取值范围及对应颜色。然后点击「Apply」;
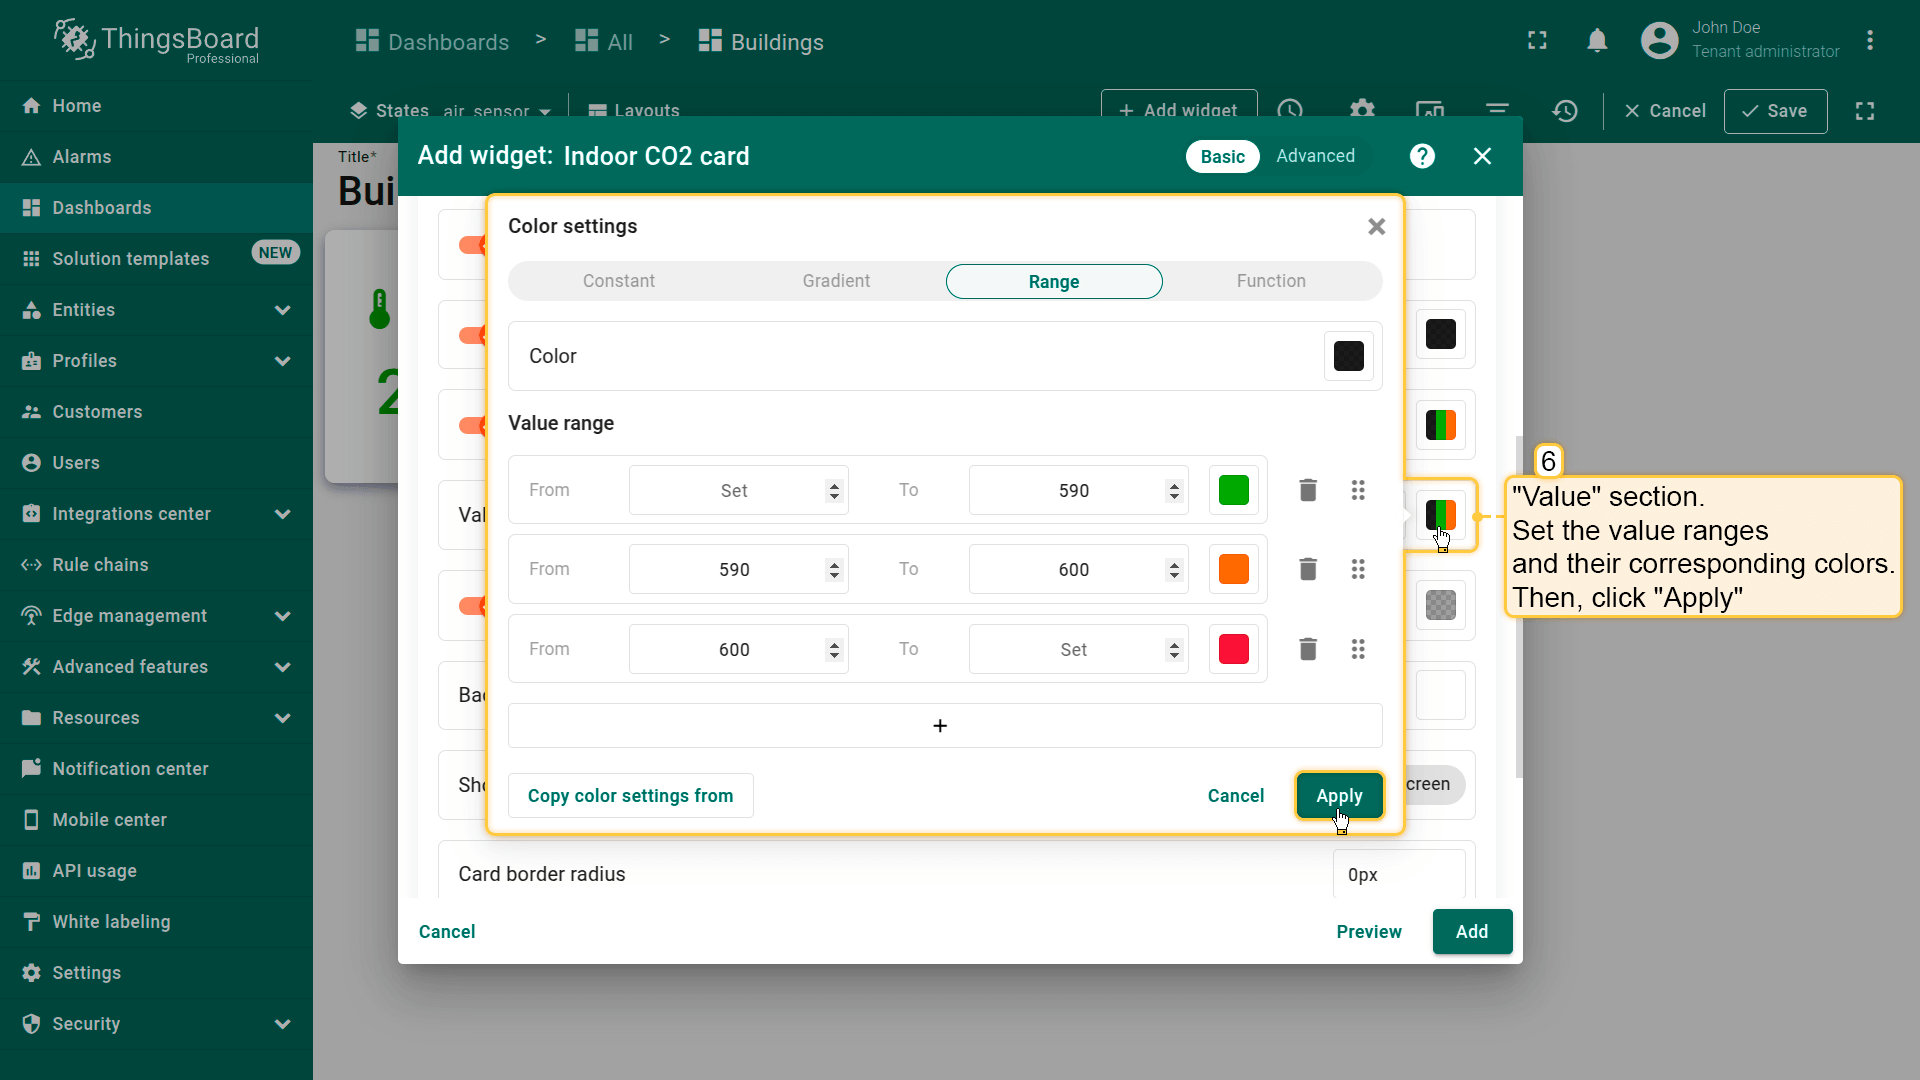
- 为「Value」区域设置取值范围及对应颜色。应用更改;
- 清空「Card border radius」值。点击「Add」;
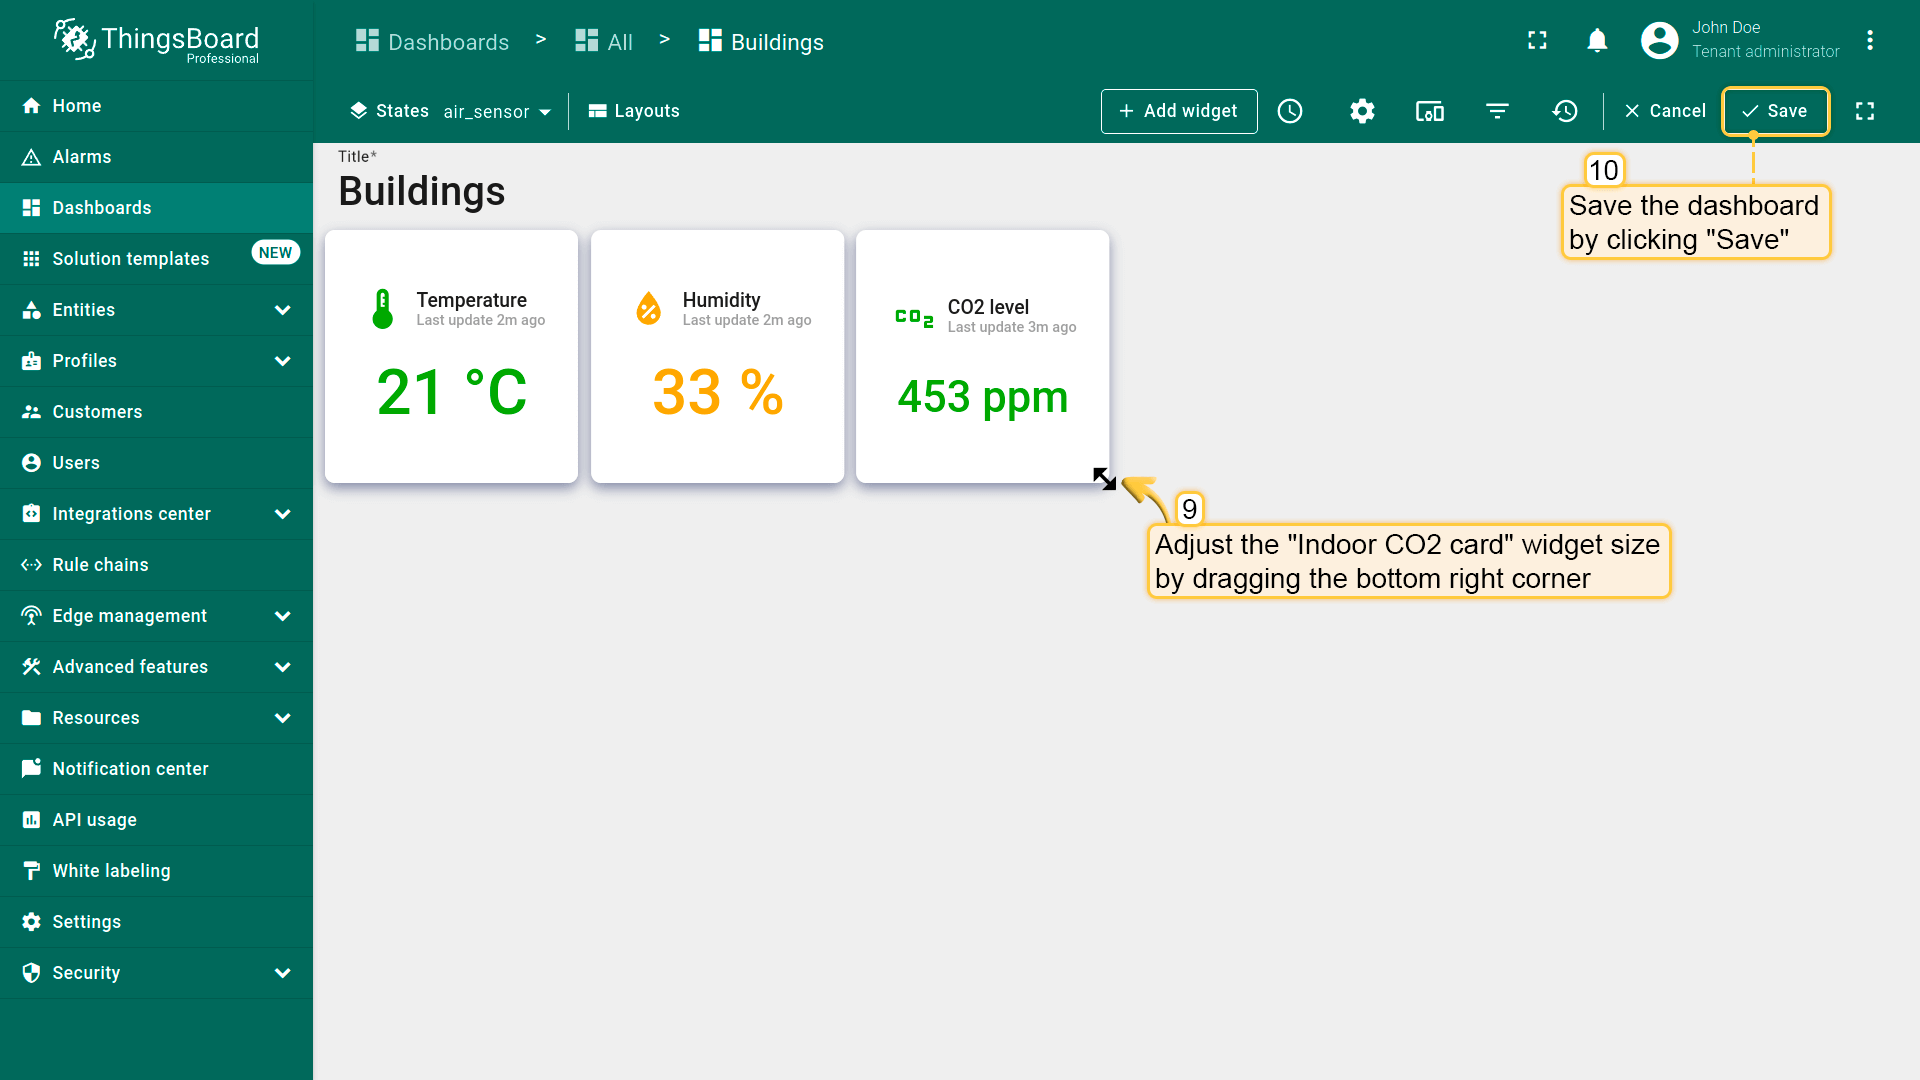
- 已添加显示当前 CO2 水平的部件。将其放在「Humidity」部件右侧。调整部件大小以匹配仪表板样式,并保存仪表板。

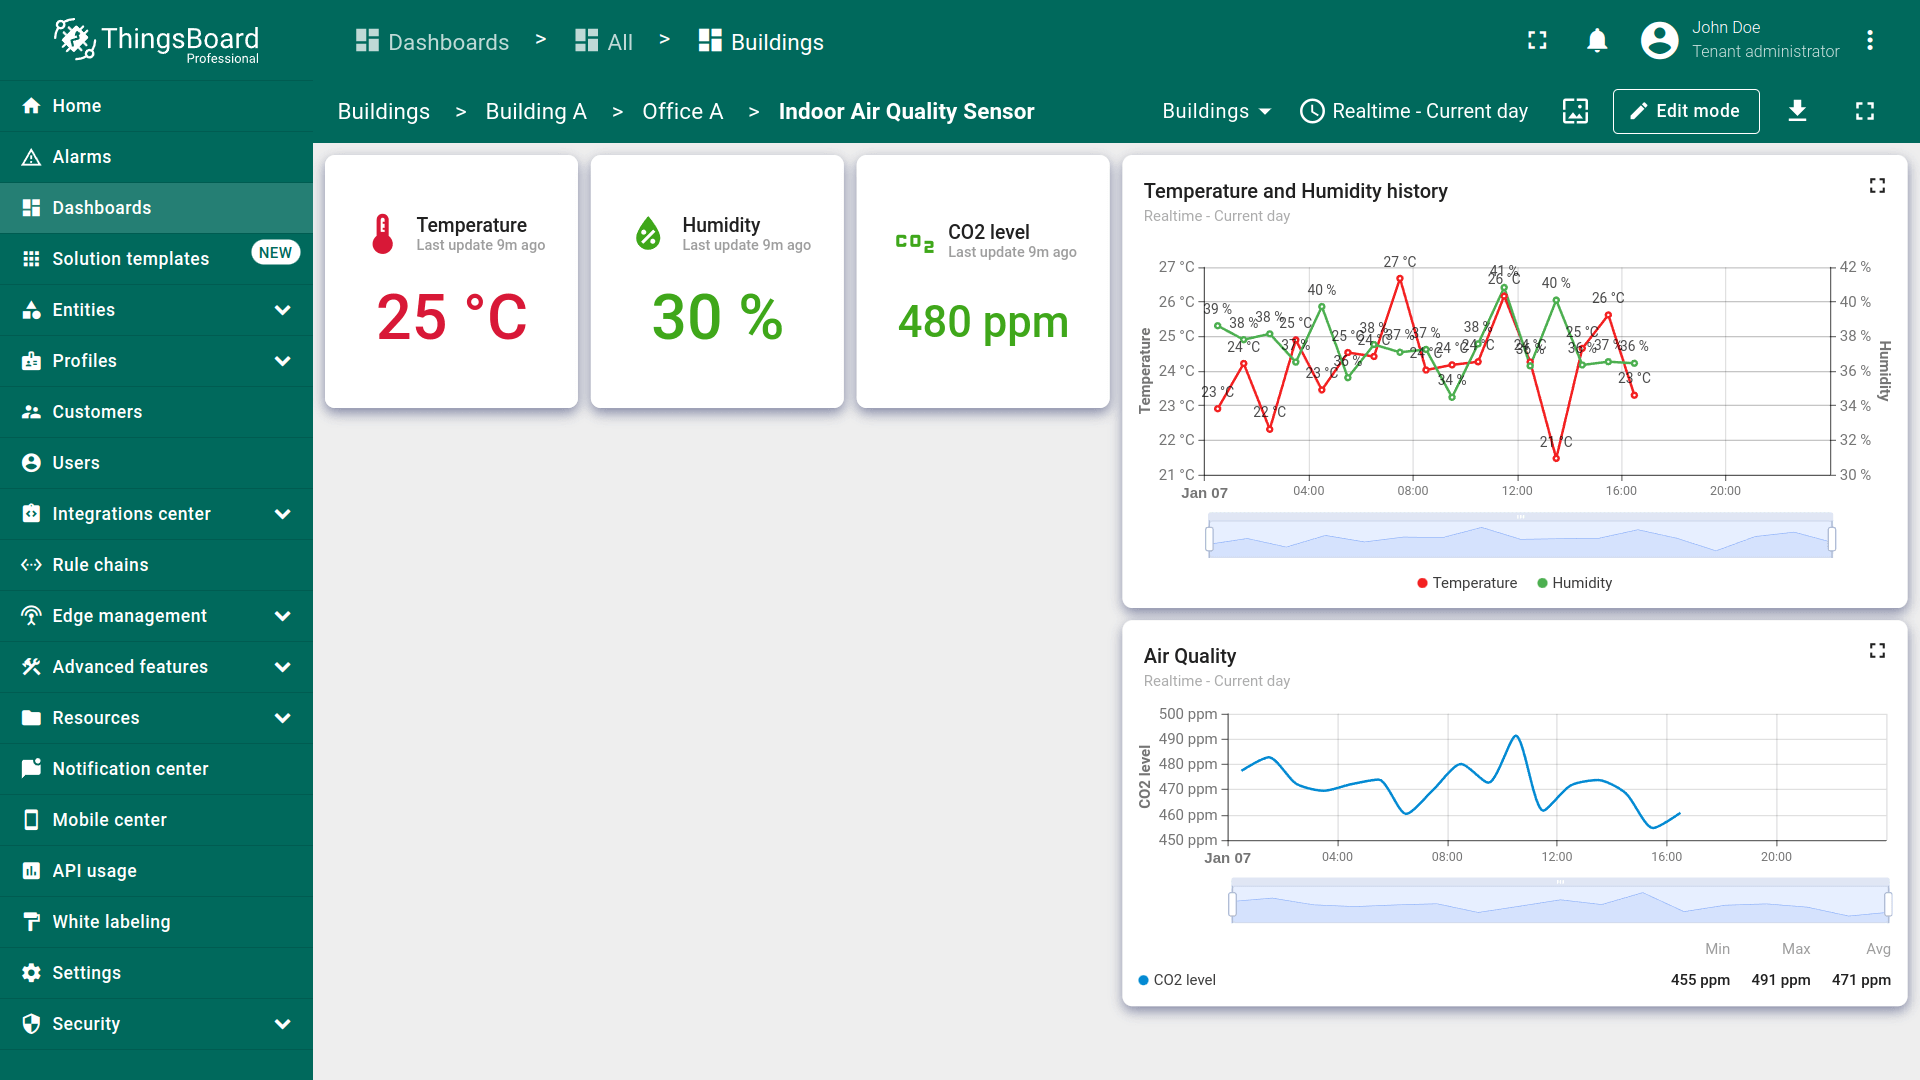
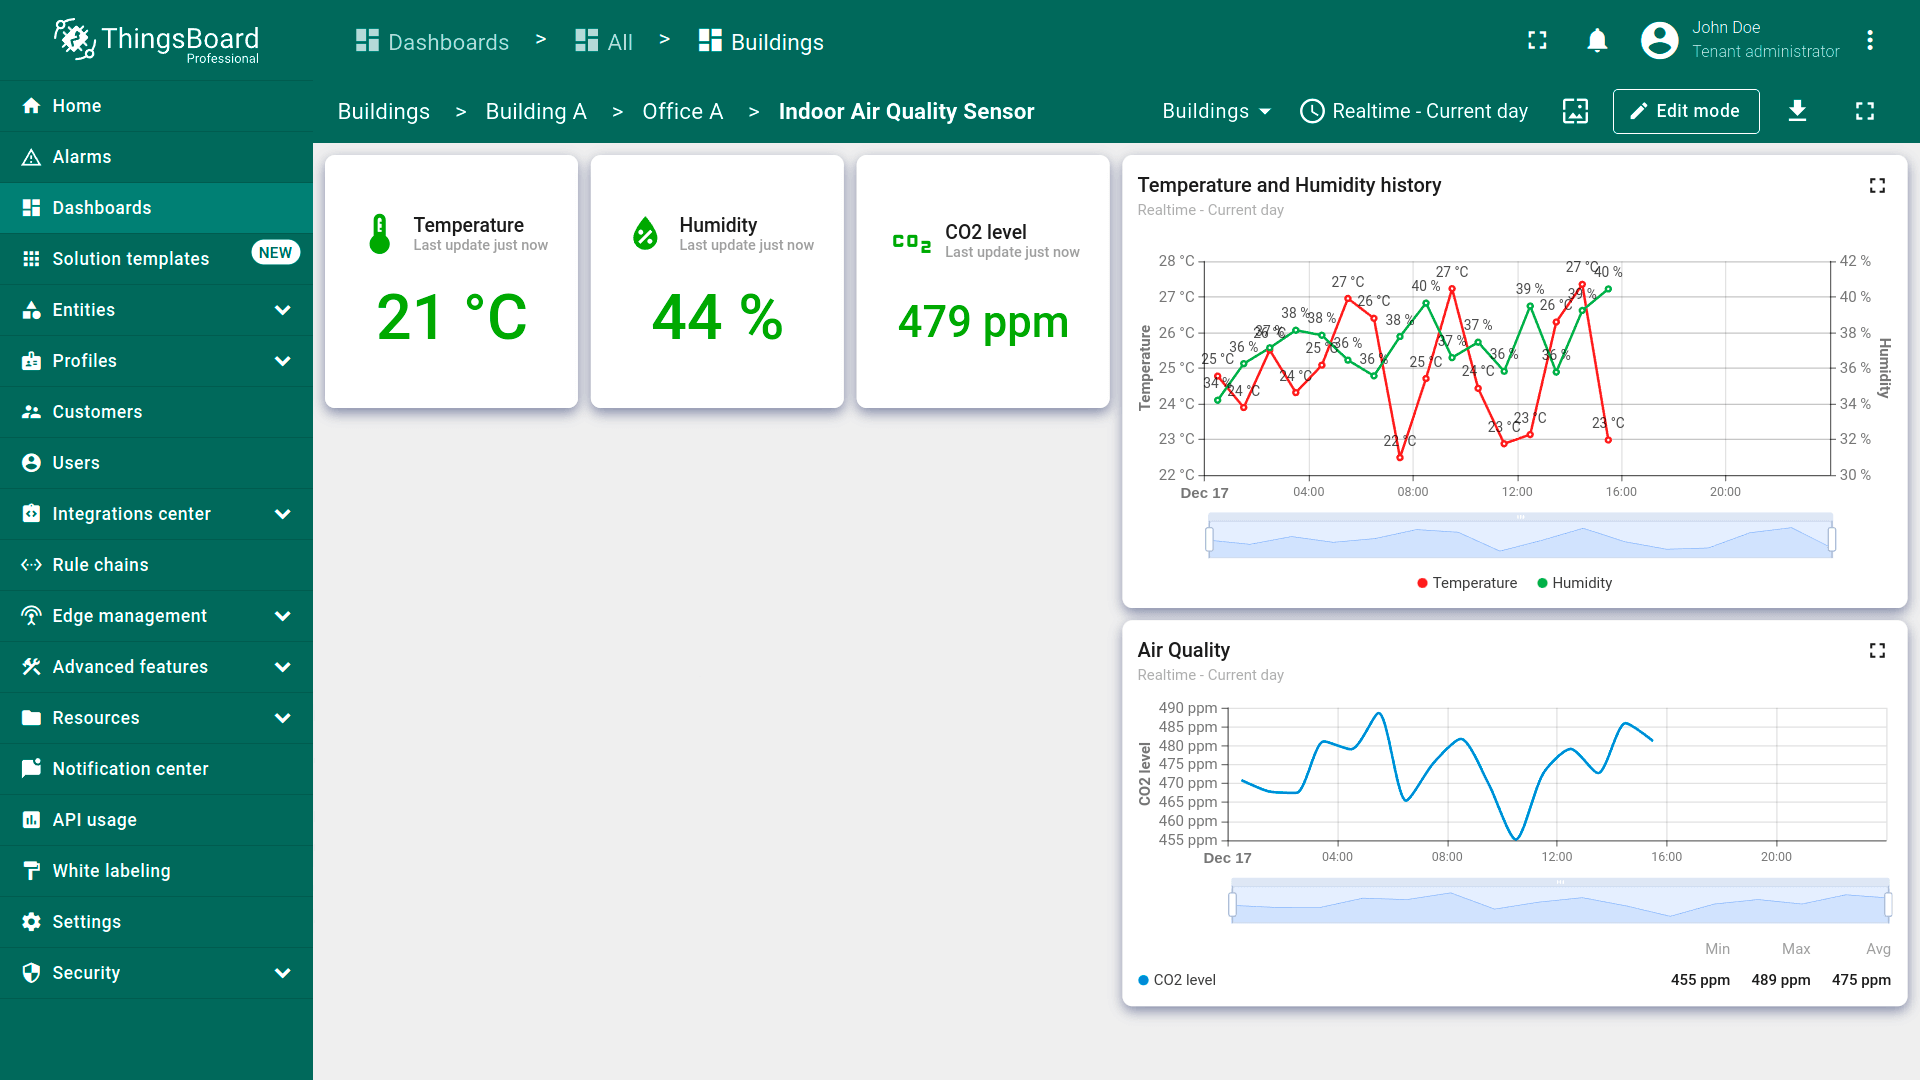
Now you can see the current temperature, humidity, and CO2 values.
Temperature and humidity history chart
Now, we will add a chart widget to display historical data on temperature and humidity in the office. This widget will use its own time window settings. The configuration we set will allow us to view the hourly average values of temperature and humidity for the current day. This way, we can monitor their changes over time.
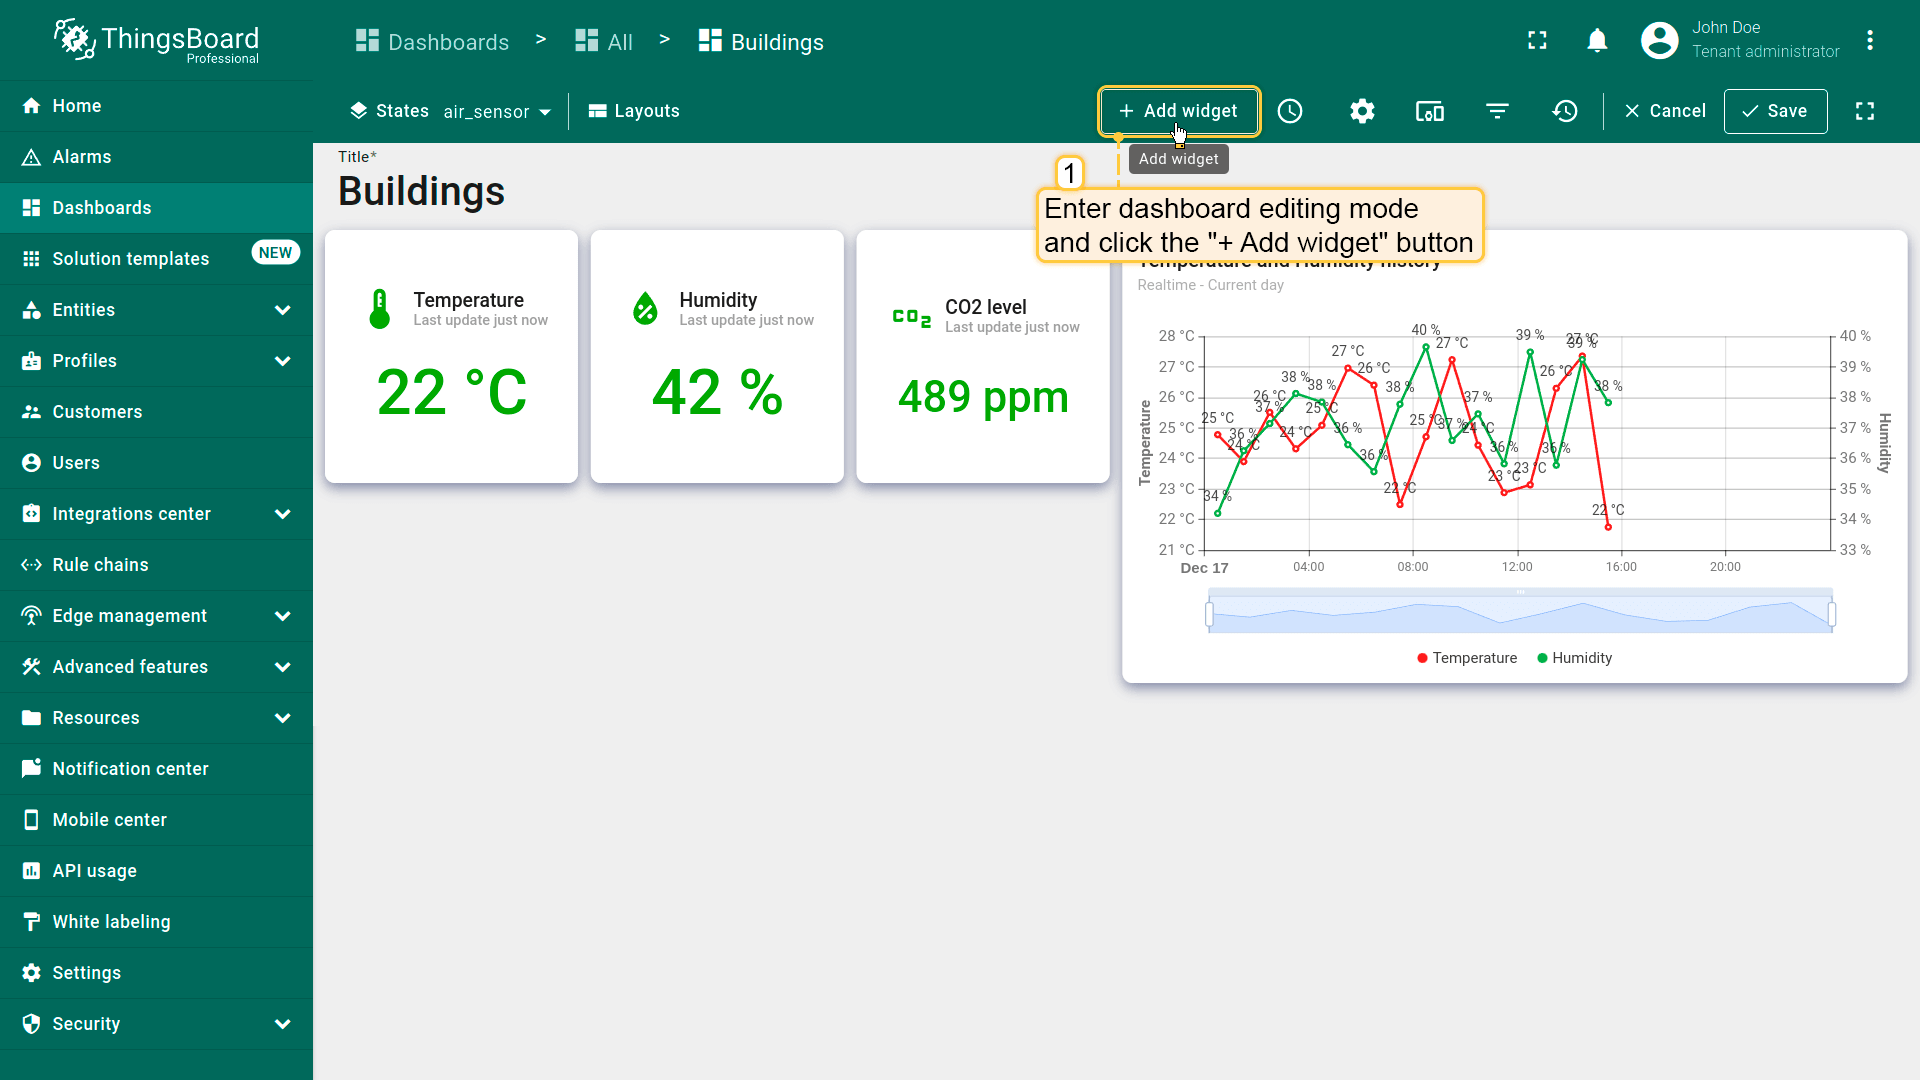
- 进入仪表板编辑模式,点击「+ Add widget」按钮;
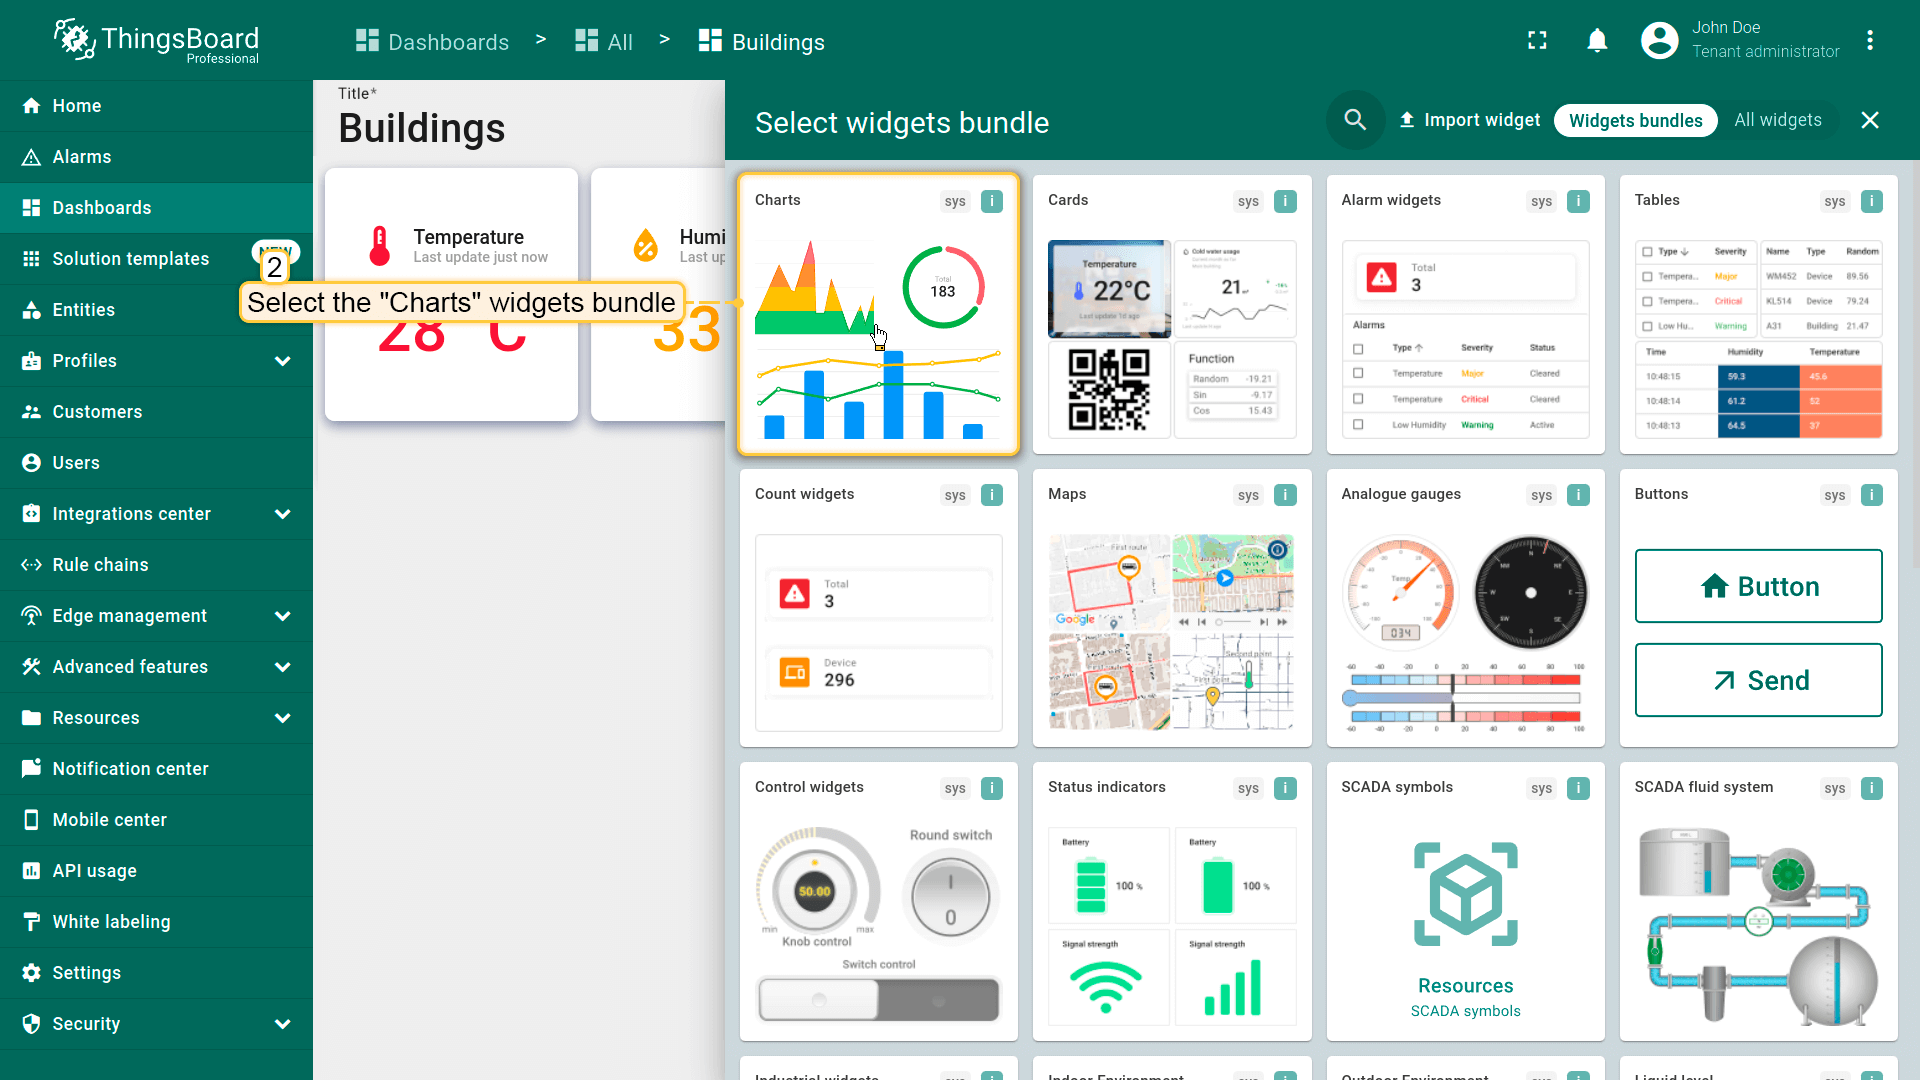
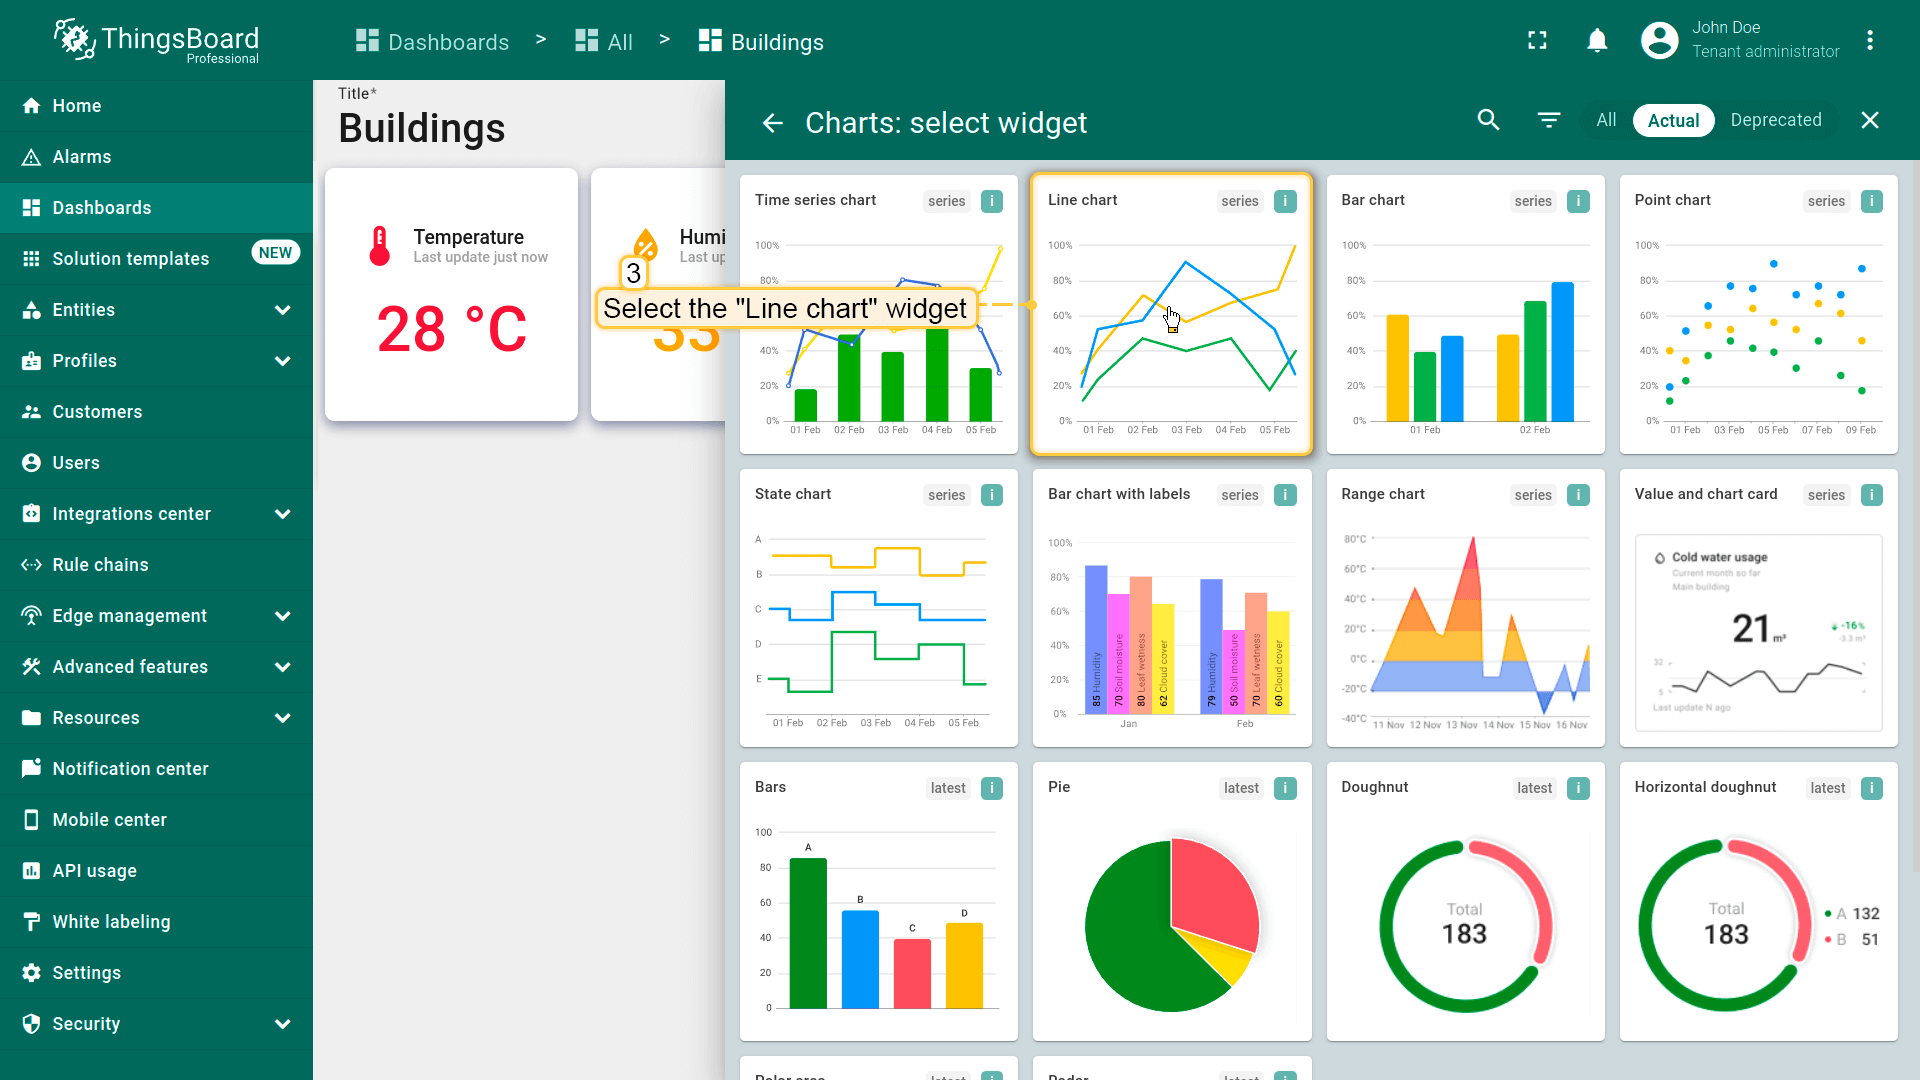
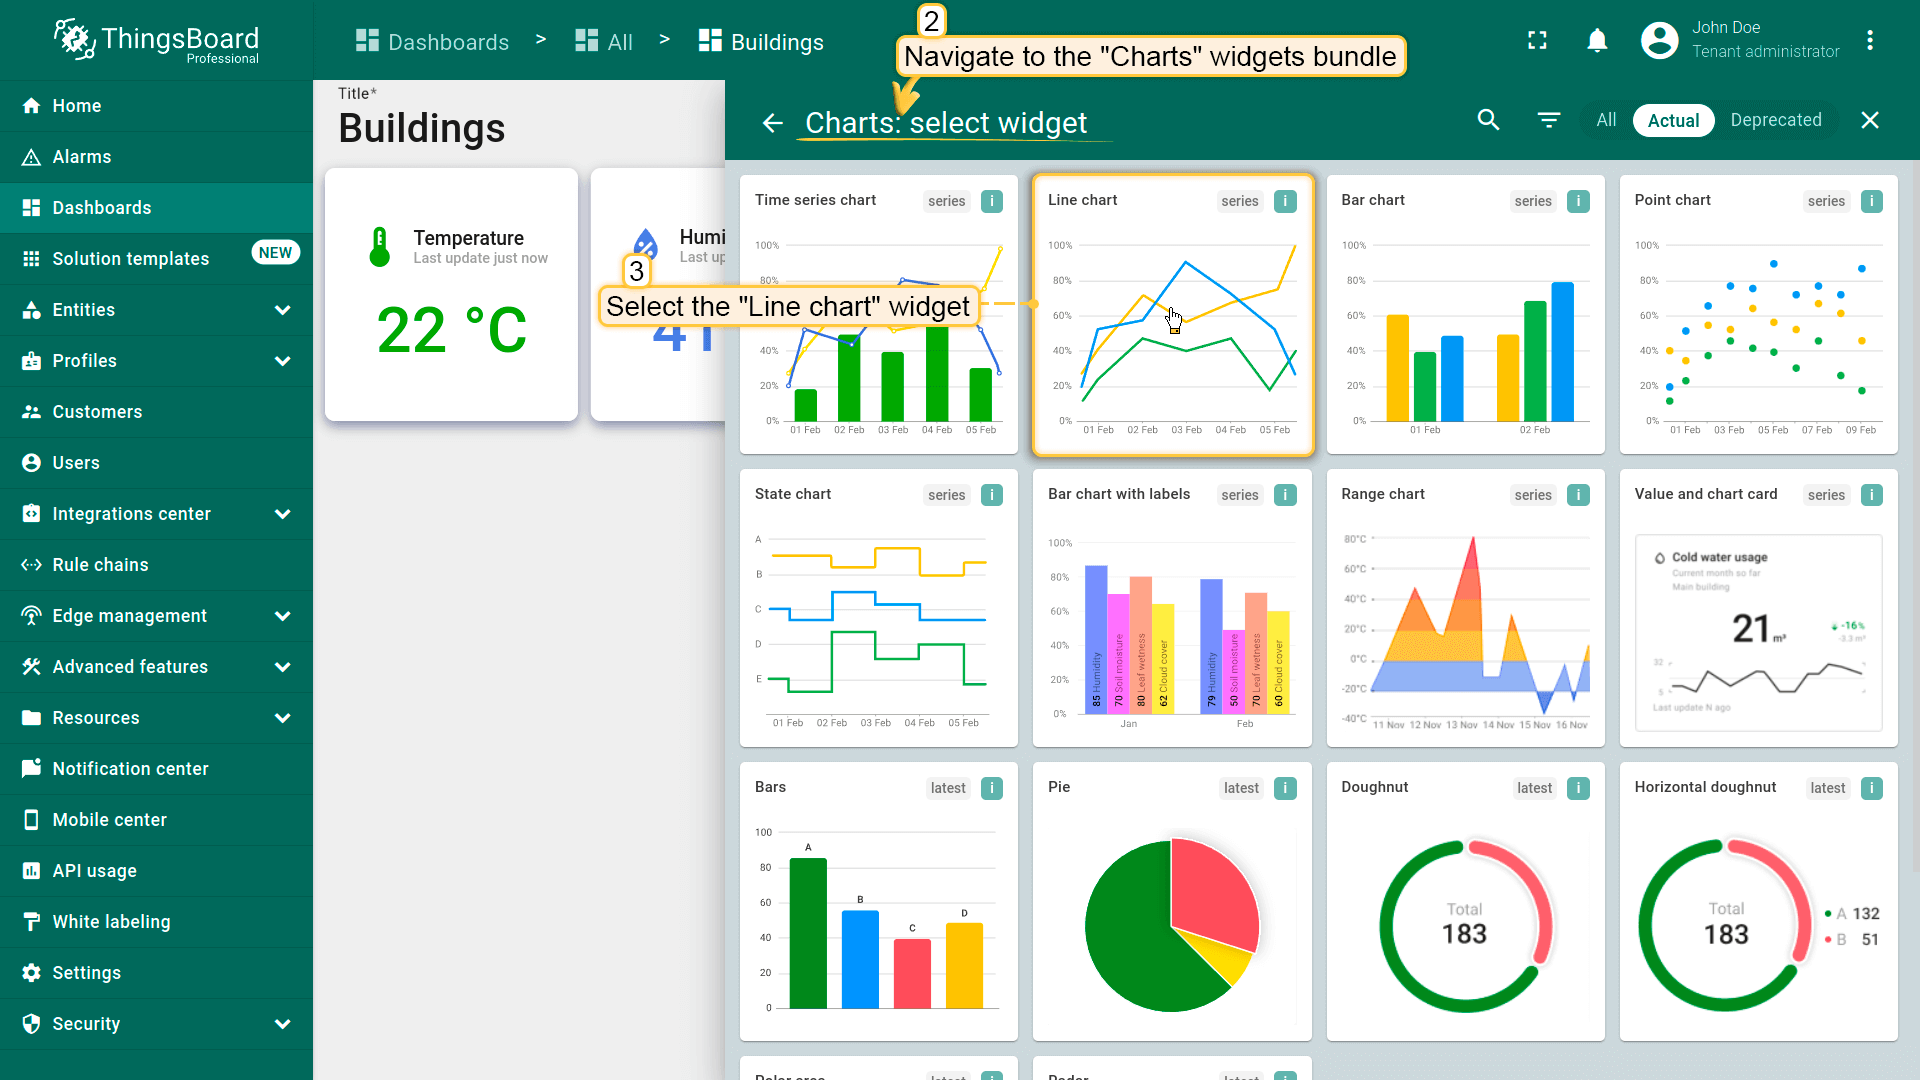
- 找到「Charts」部件包并点击;
- 选择「Line chart」部件;
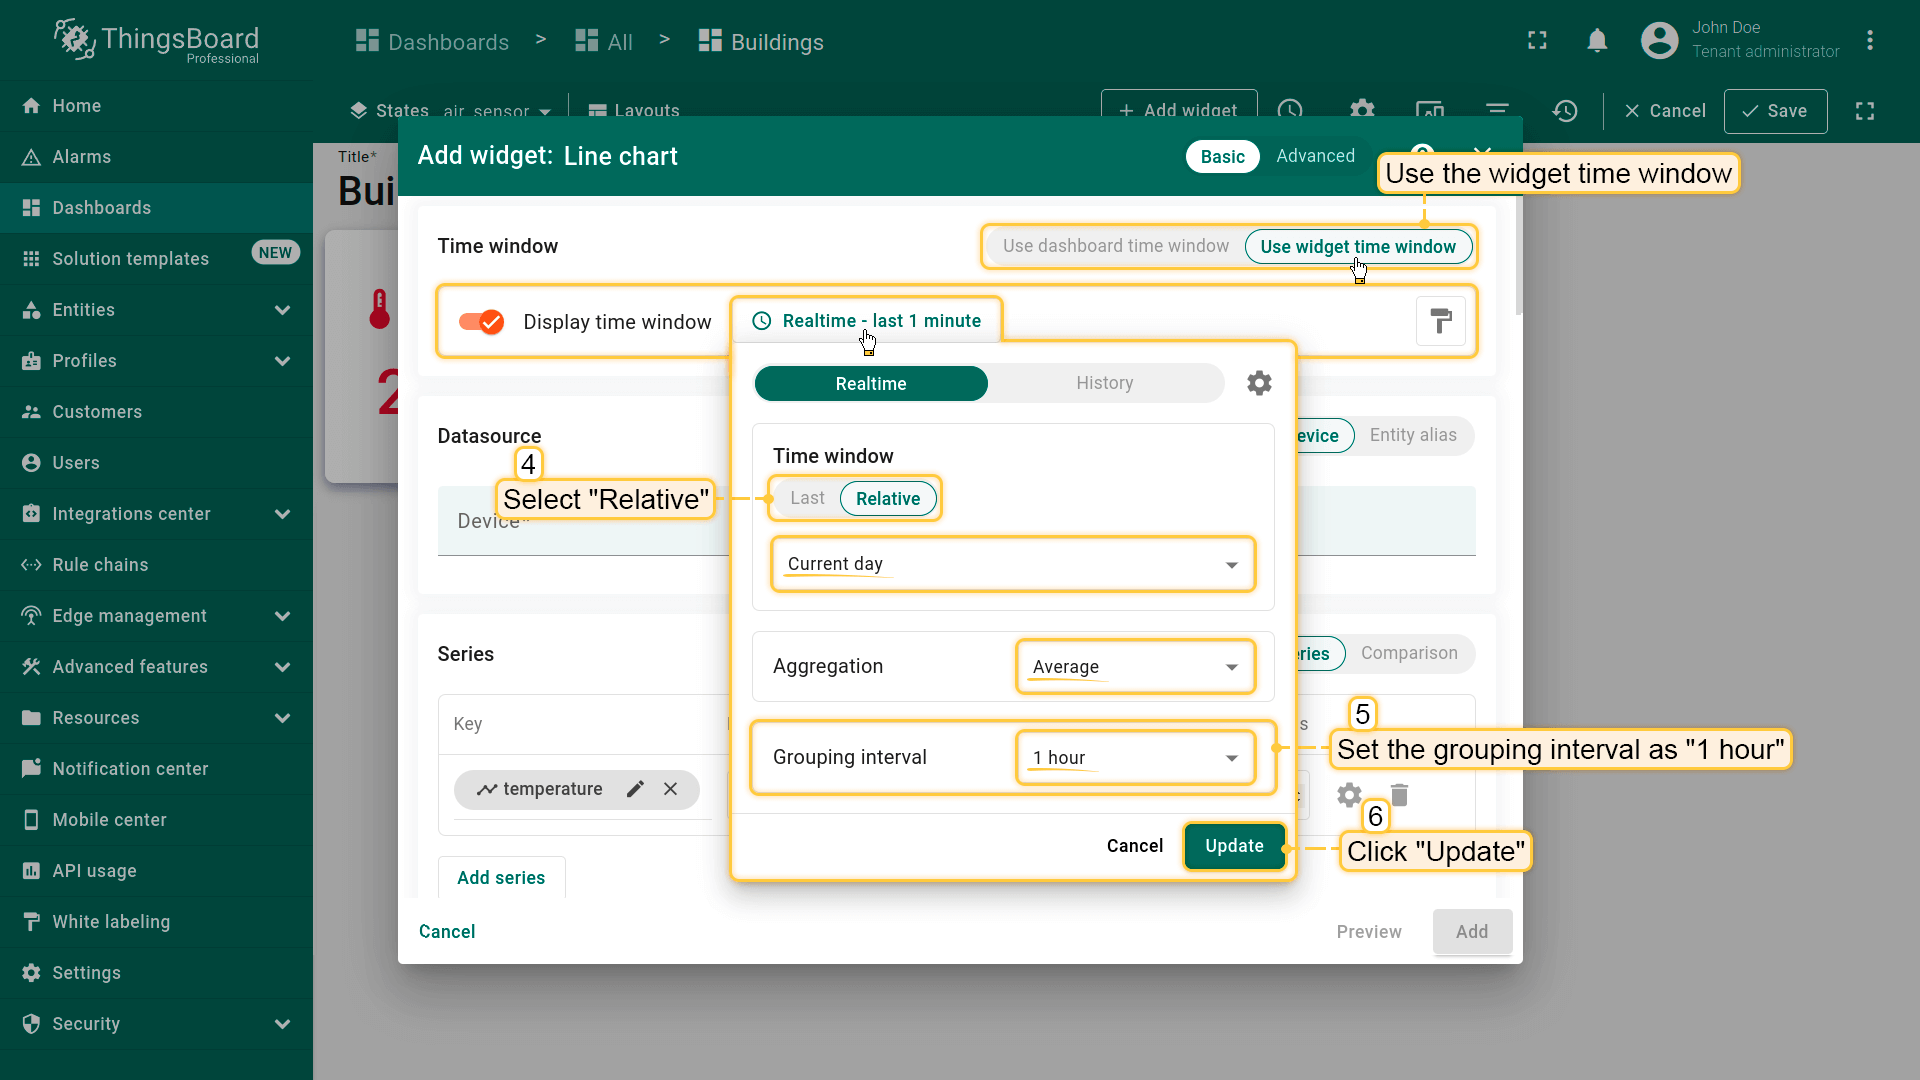
- 使用部件的时间窗口并修改其设置。选择「Relative」,将时间间隔设为「Current day」。聚合函数保持「Average」,分组间隔设为 1 小时。然后点击「Update」;
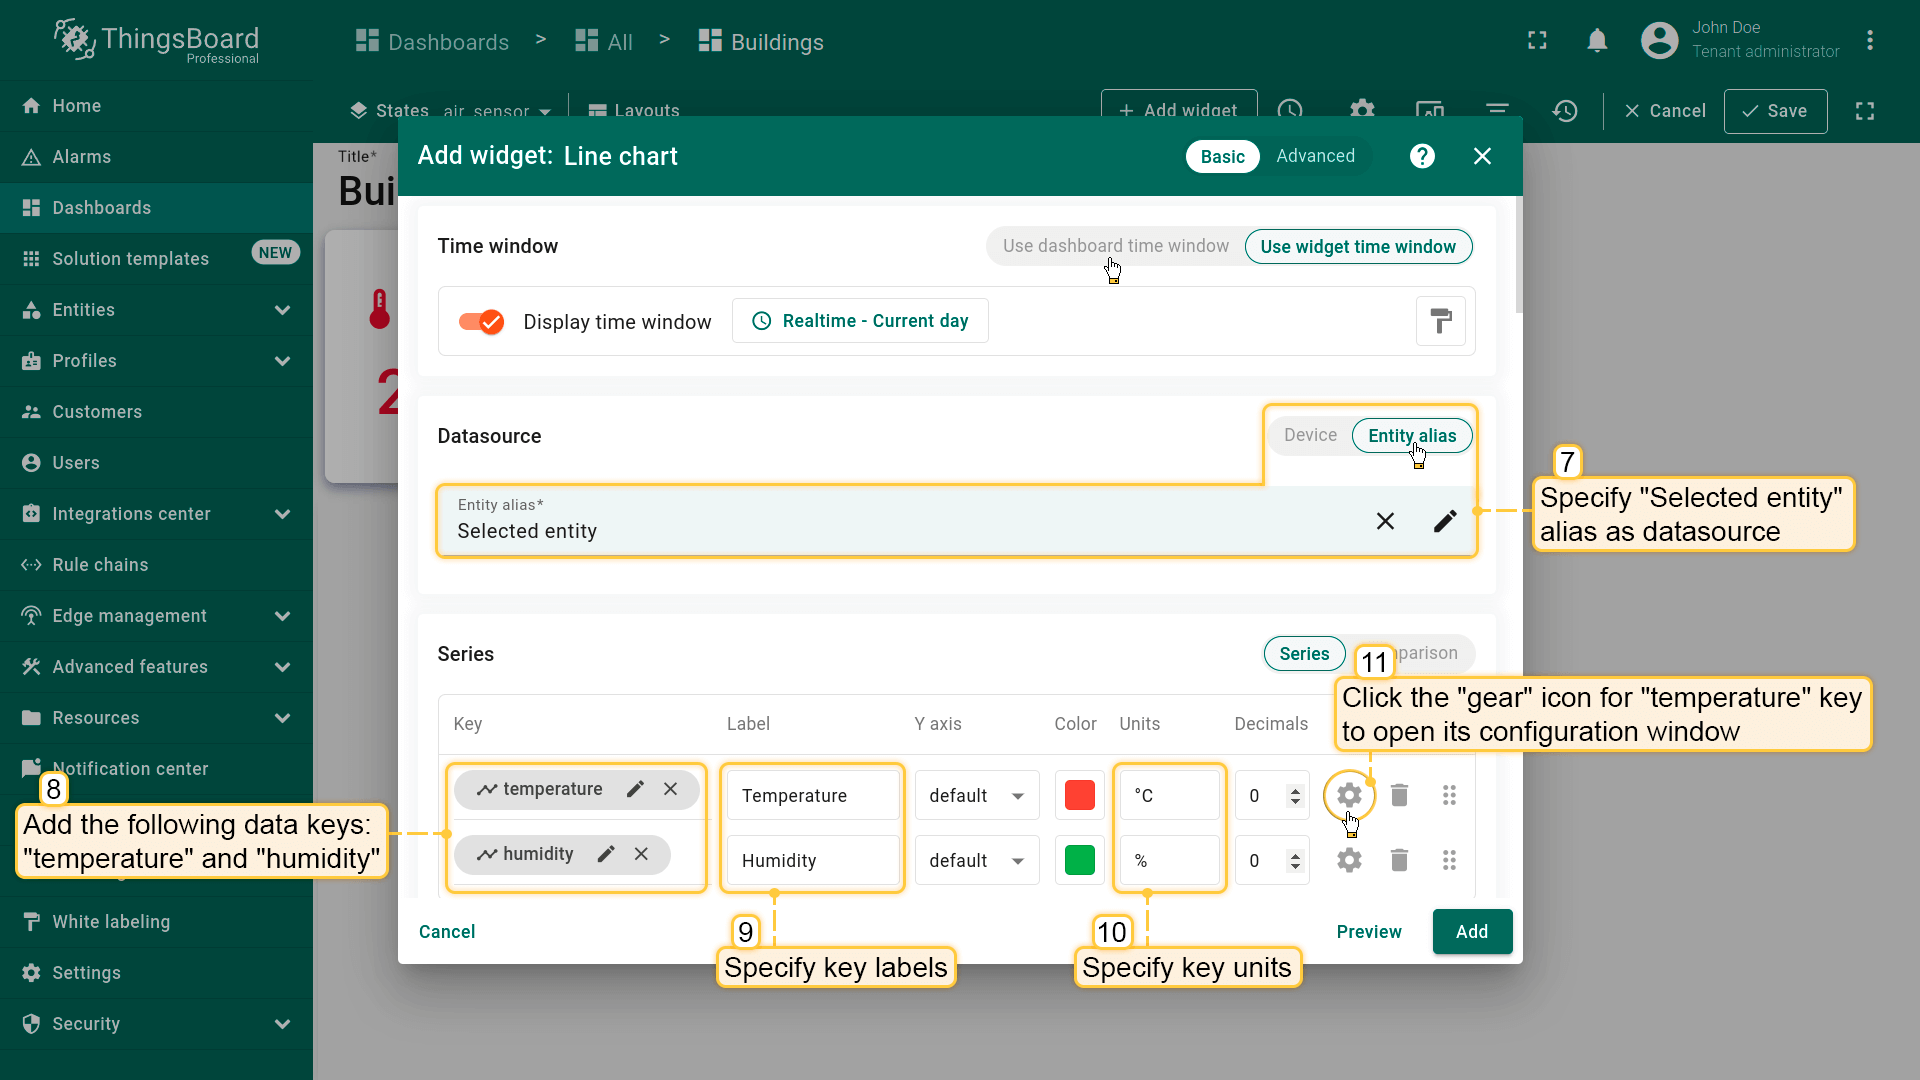
- 将「Selected entity」别名指定为数据源。添加数据键「temperature」和「humidity」并指定其标签和单位。然后点击「temperature」键的「齿轮」图标打开其配置窗口;
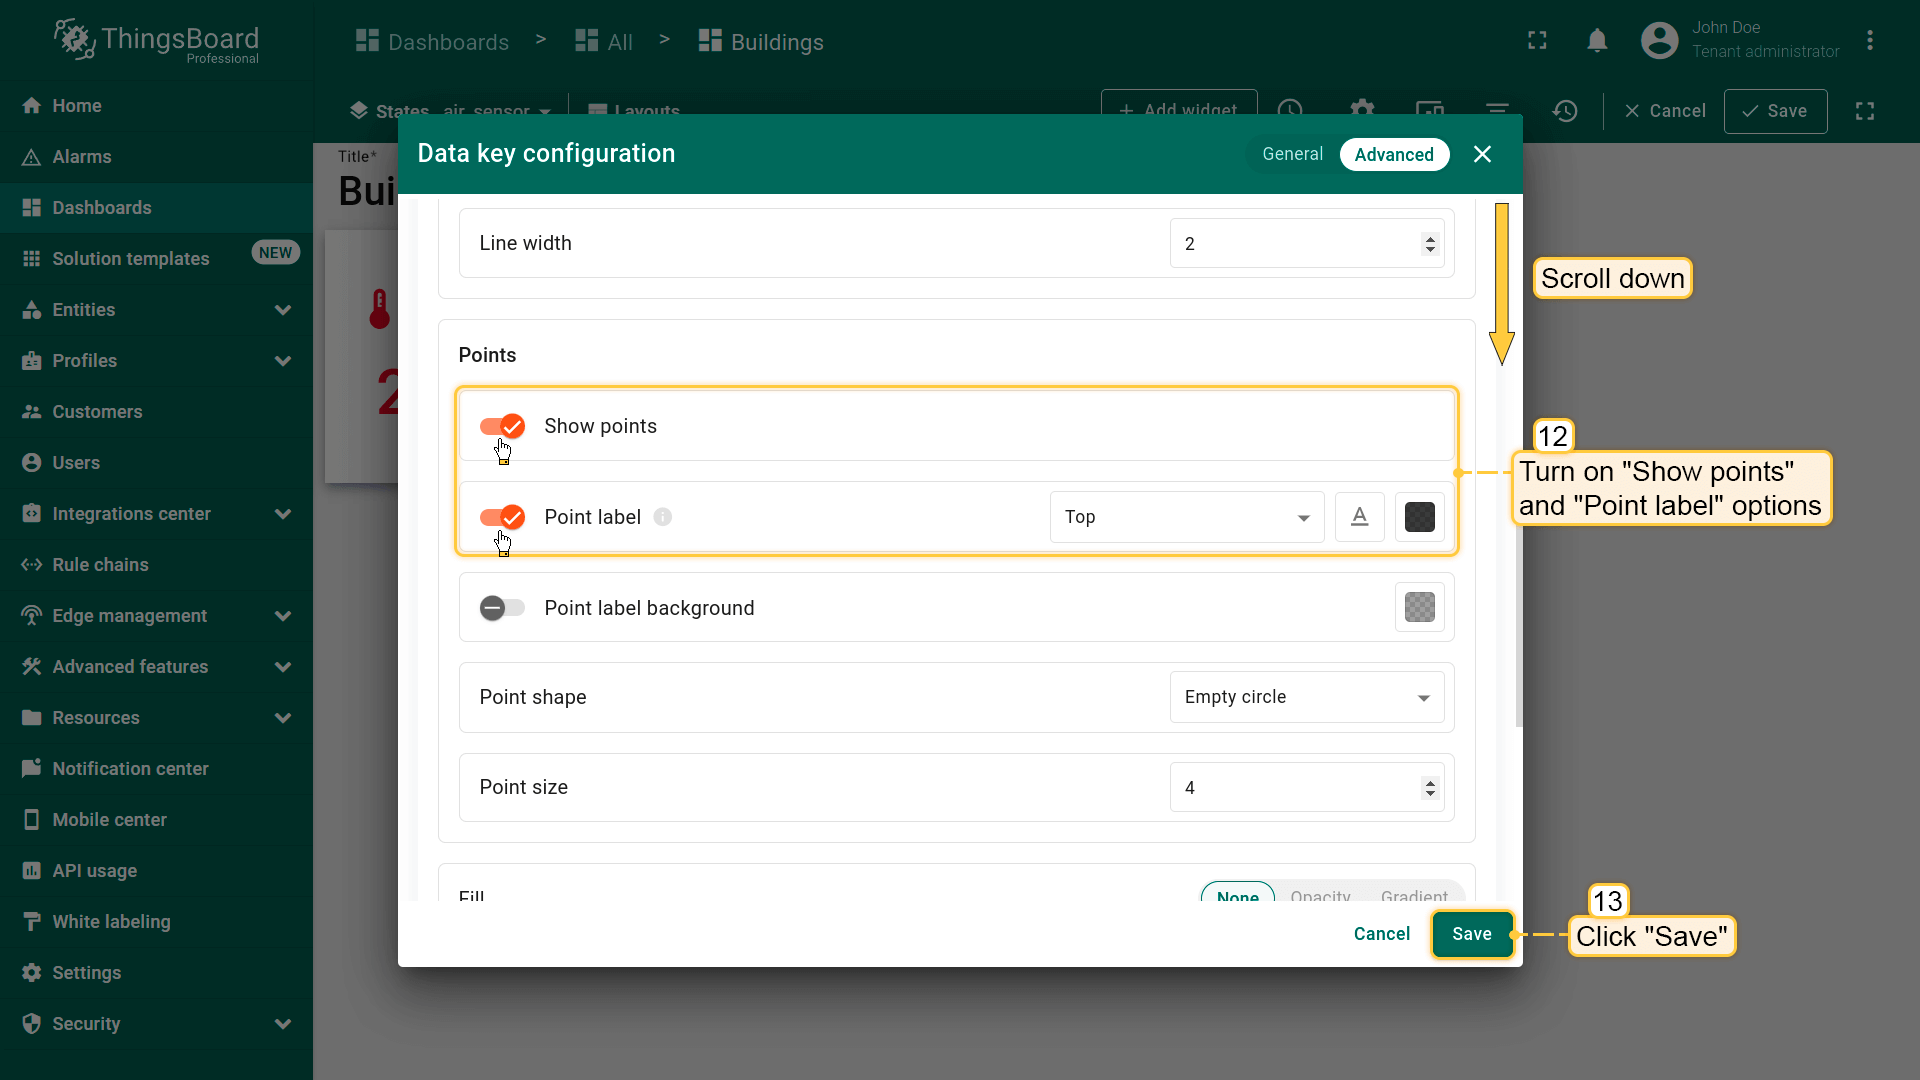
- 开启「Show points」和「Point label」选项。点击「Save」。对「humidity」数据键重复此操作;
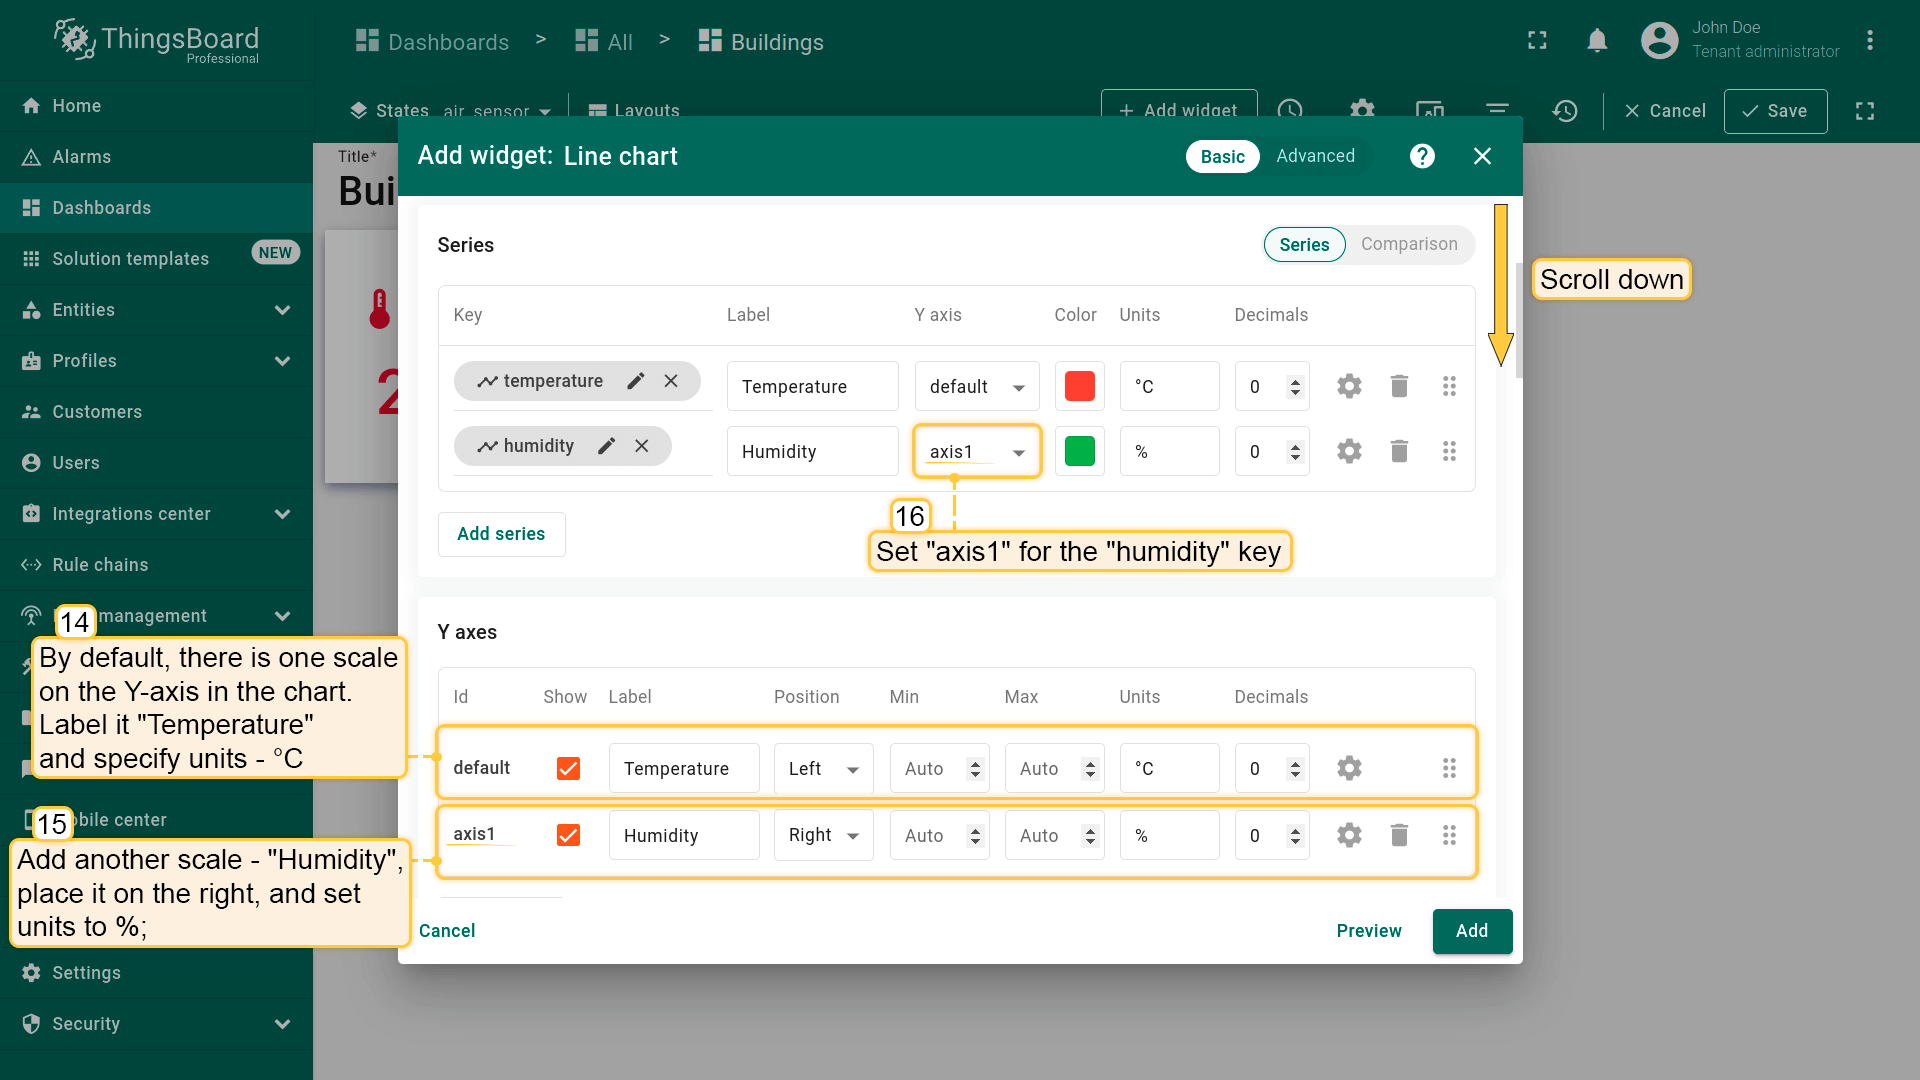
- 默认情况下图表在 Y 轴包含一个刻度。将其标为「Temperature」并设置单位为 °C。为「Humidity」添加另一刻度,置于右侧,单位设为 %。将「axis1」刻度应用到「humidity」键;
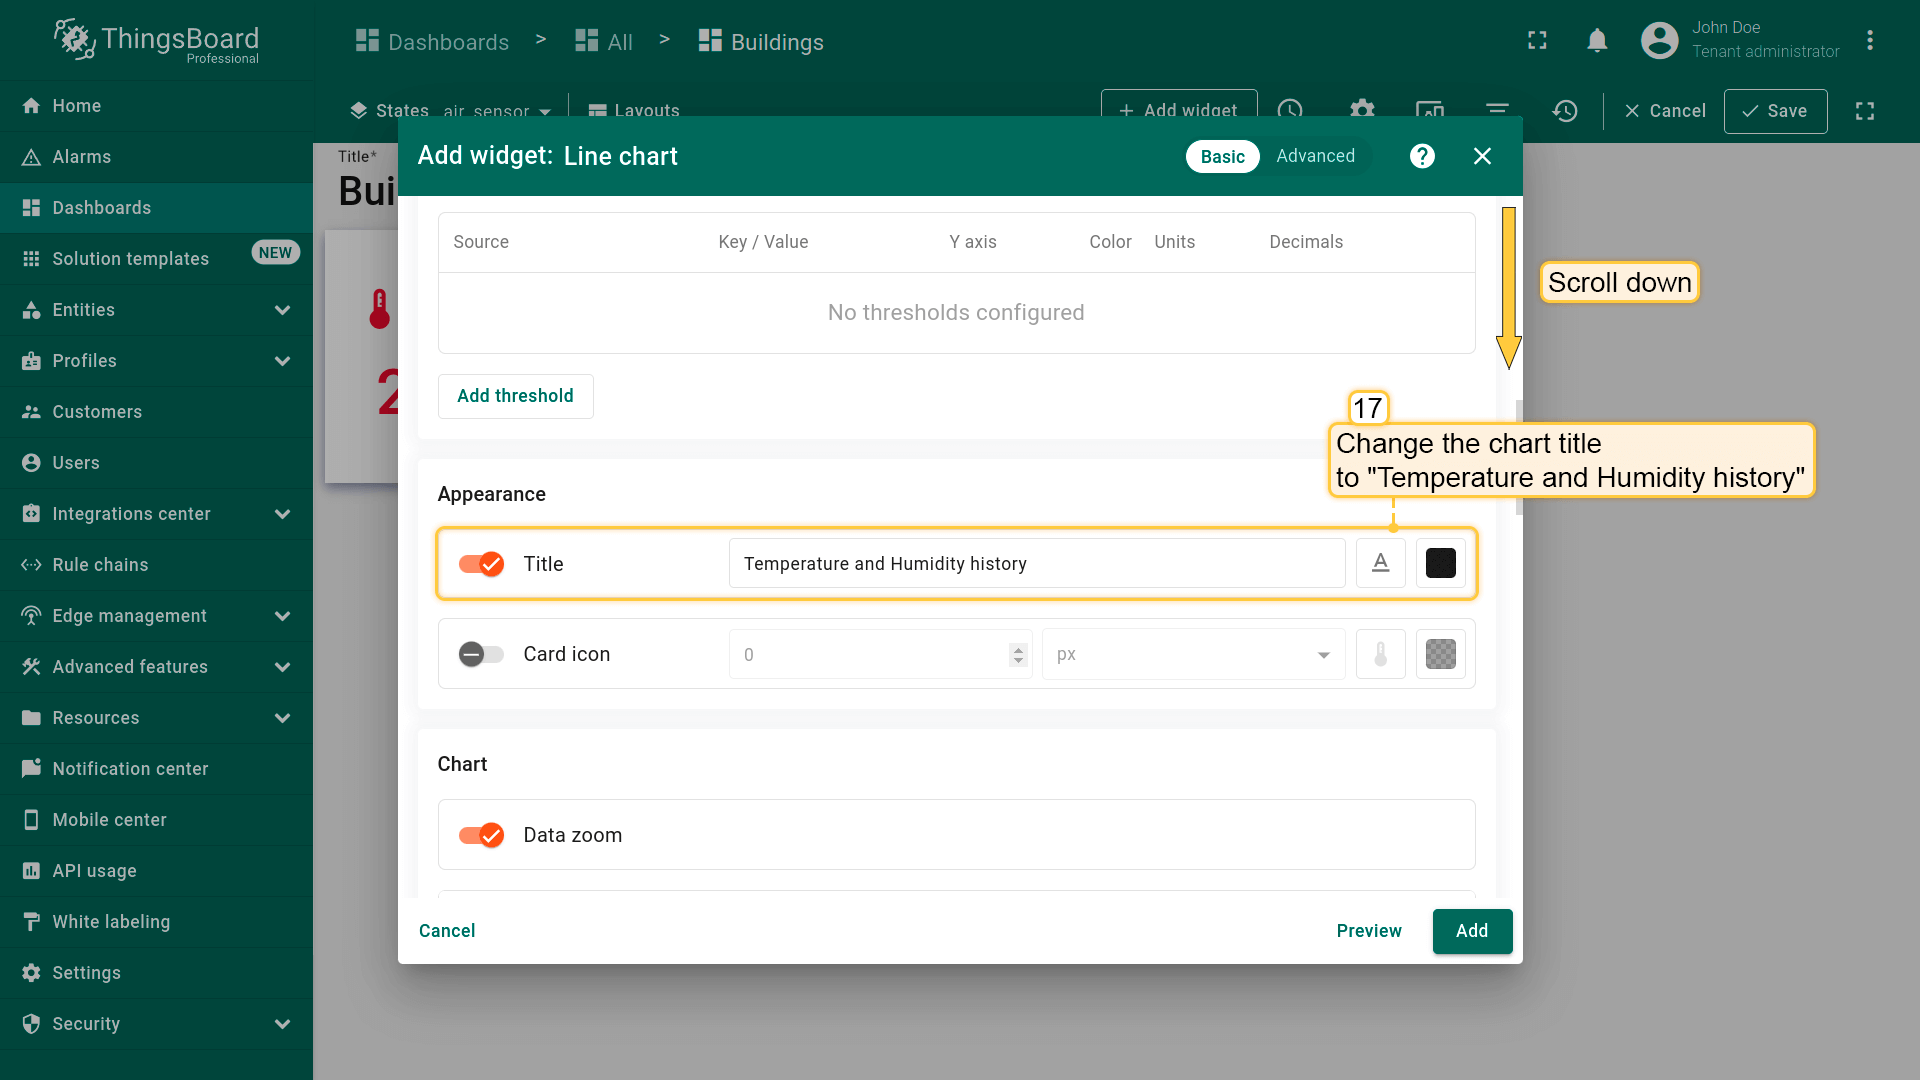
- 将图表标题改为「Temperature and Humidity history」;
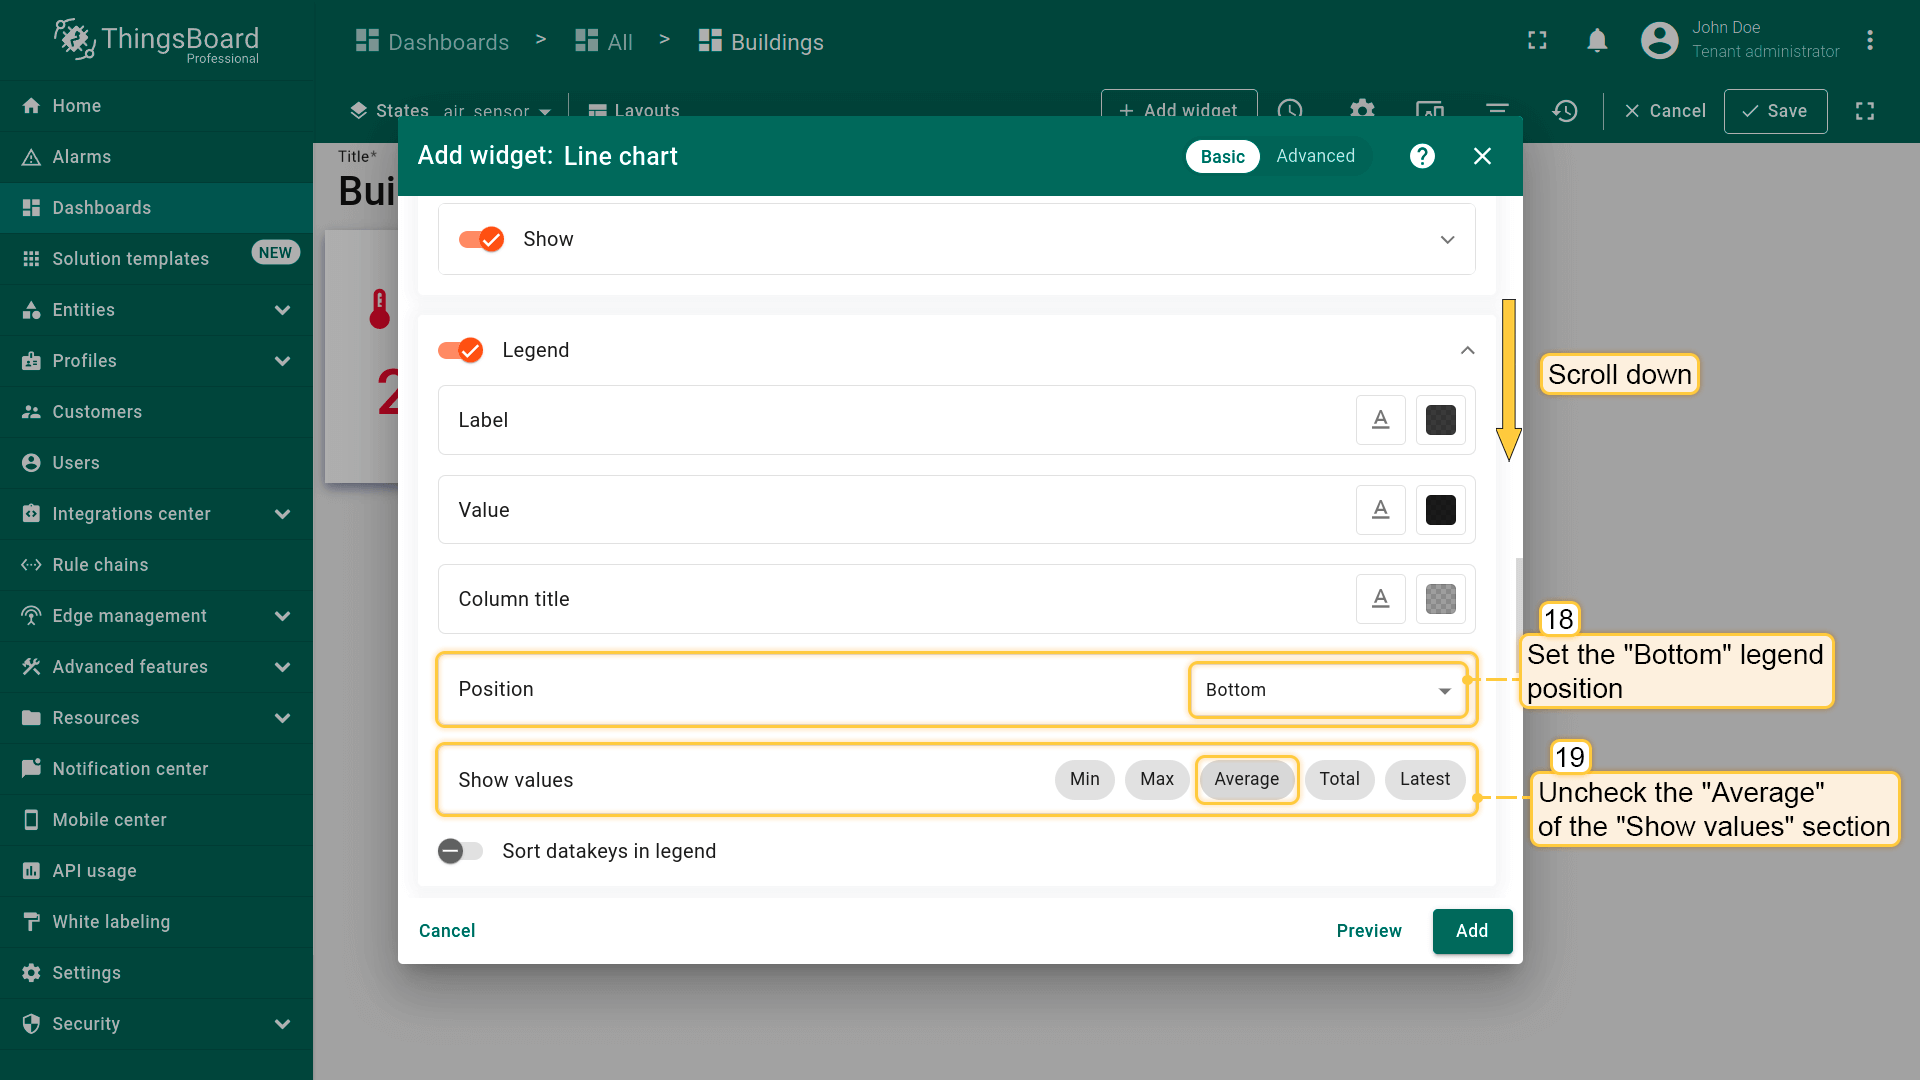
- 将图例位置设为「Bottom」,取消勾选「Show values」中的「Average」;
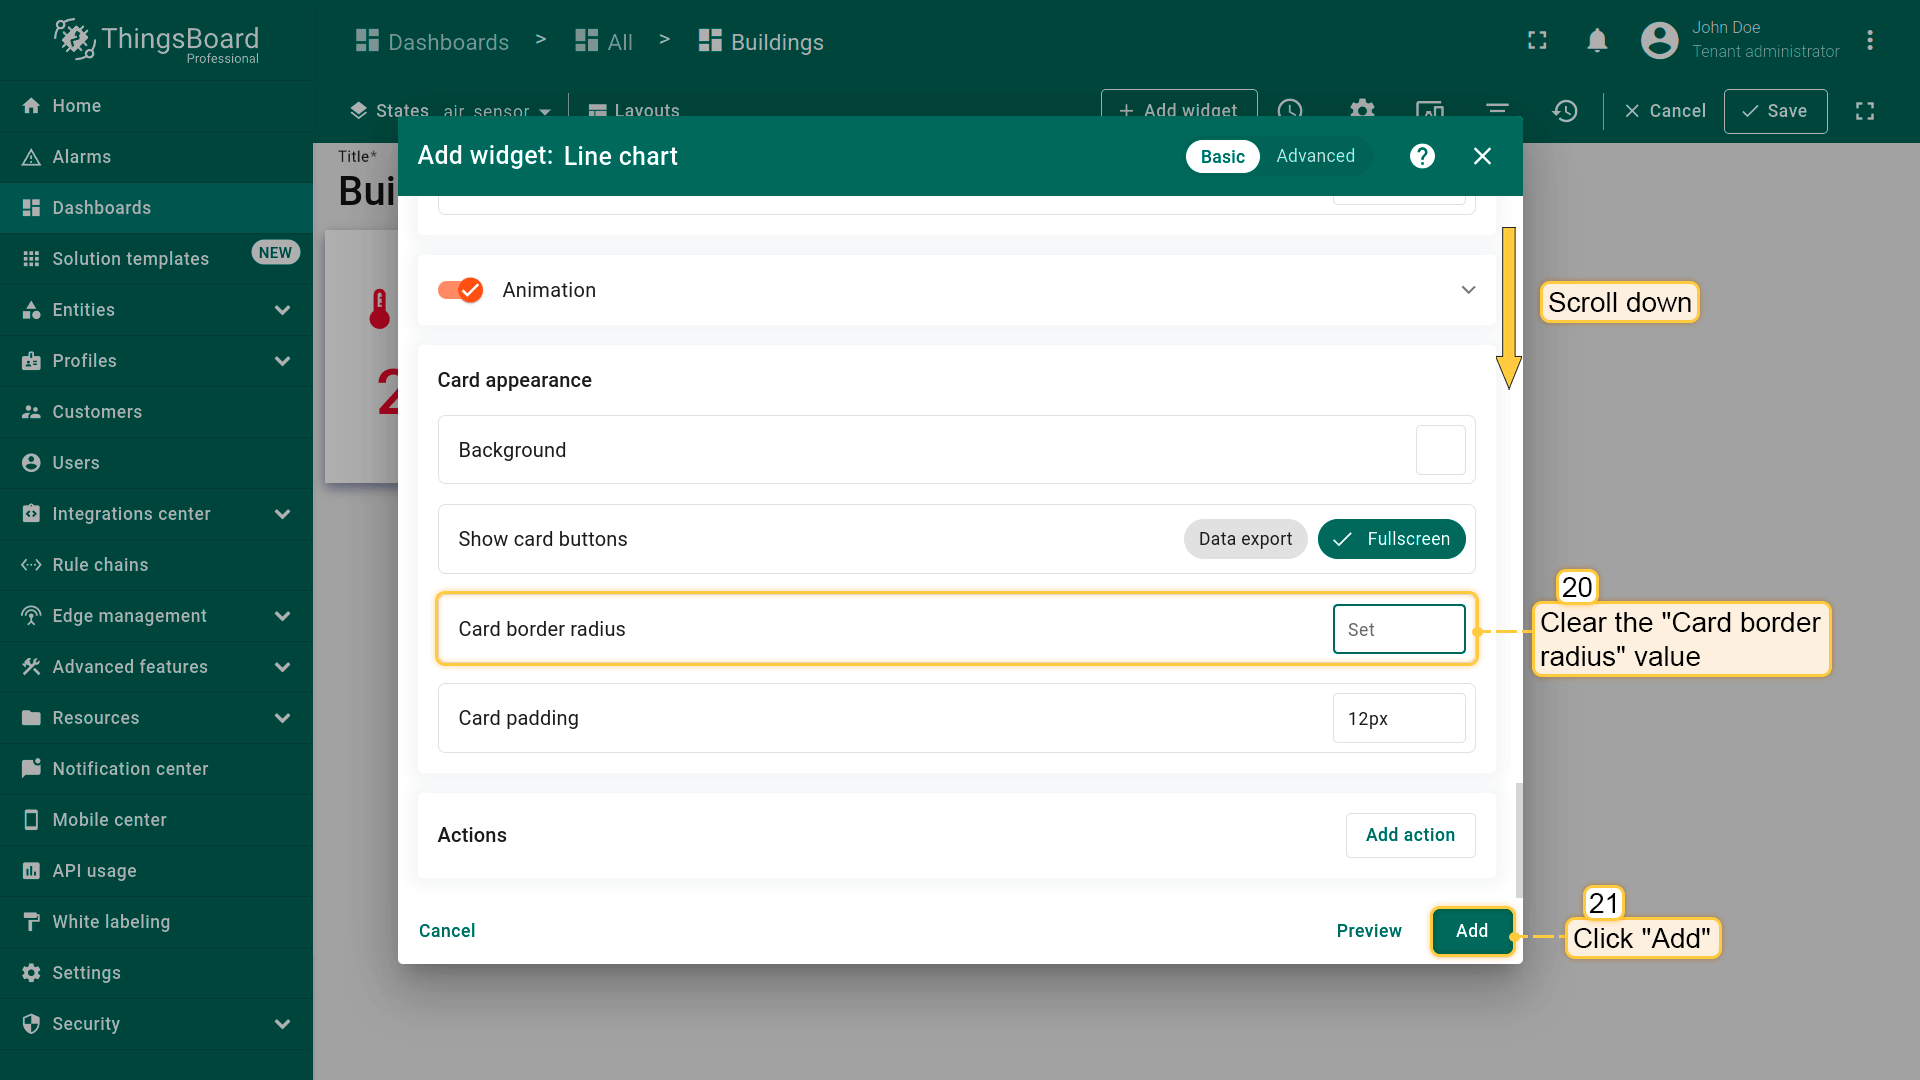
- 清空「Card border radius」值以简化部件外观。点击「Add」;
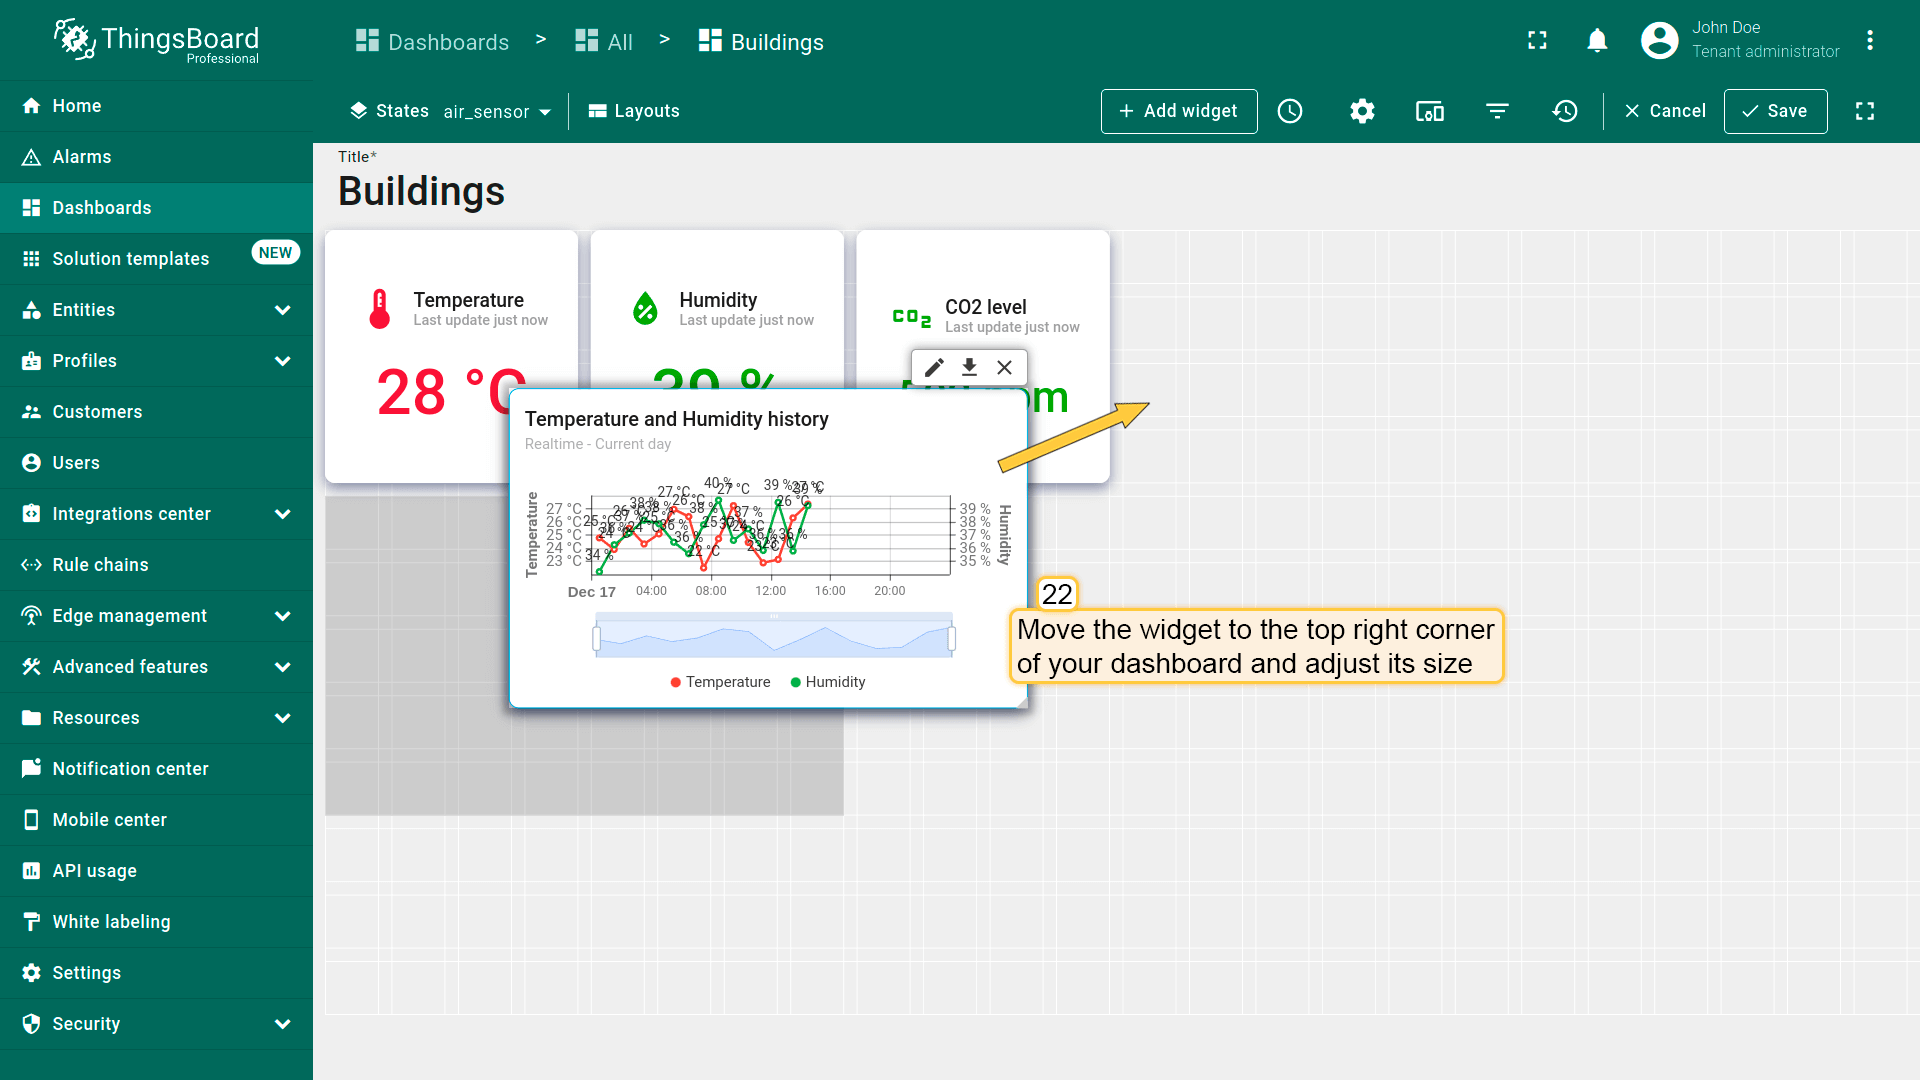
- 将部件移至仪表板右上角并调整大小;
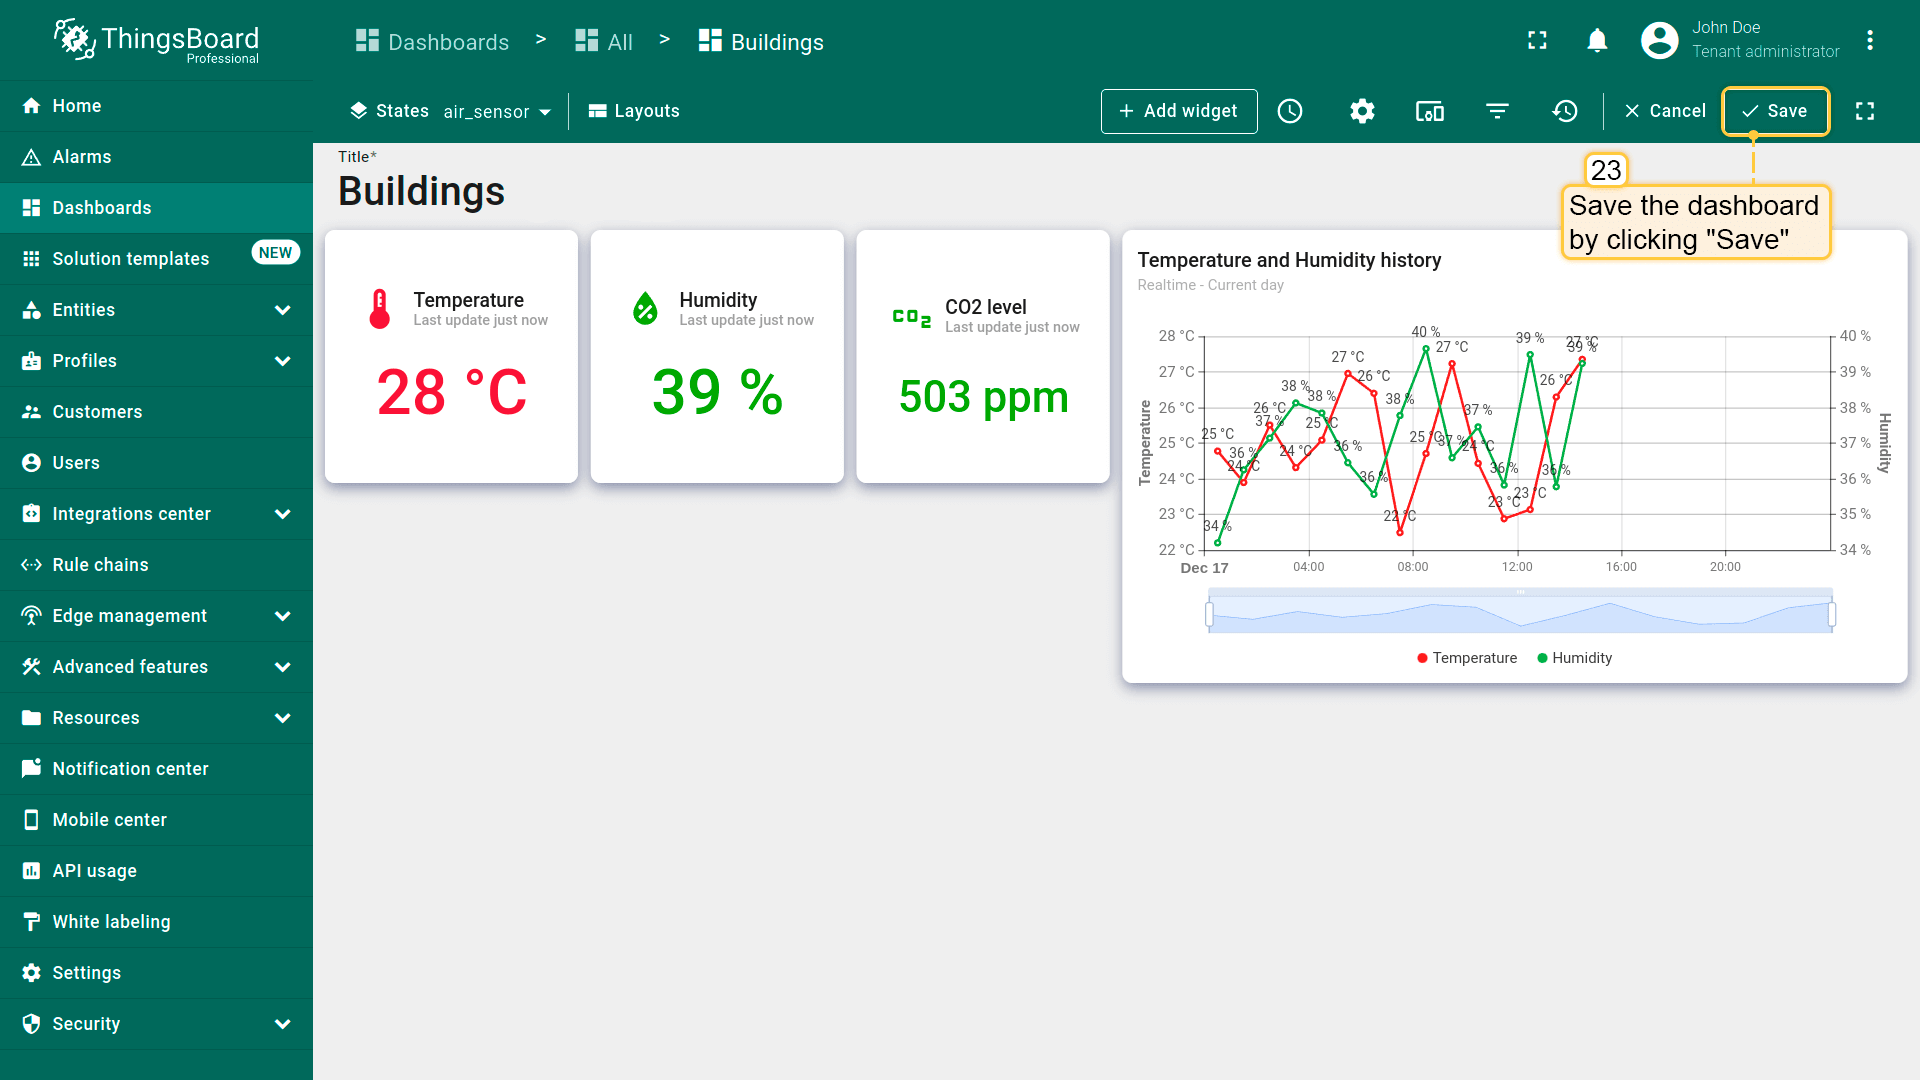
- 已添加「Temperature and Humidity history」部件。保存仪表板以应用更改。
CO2 level chart
Add another line chart widget to display air quality data. This widget will also use its own time window settings, showing hourly data for the selected time period.
- 进入仪表板编辑模式,点击「+ Add widget」按钮;
- 选择「Charts」部件包中的「Line chart」部件;
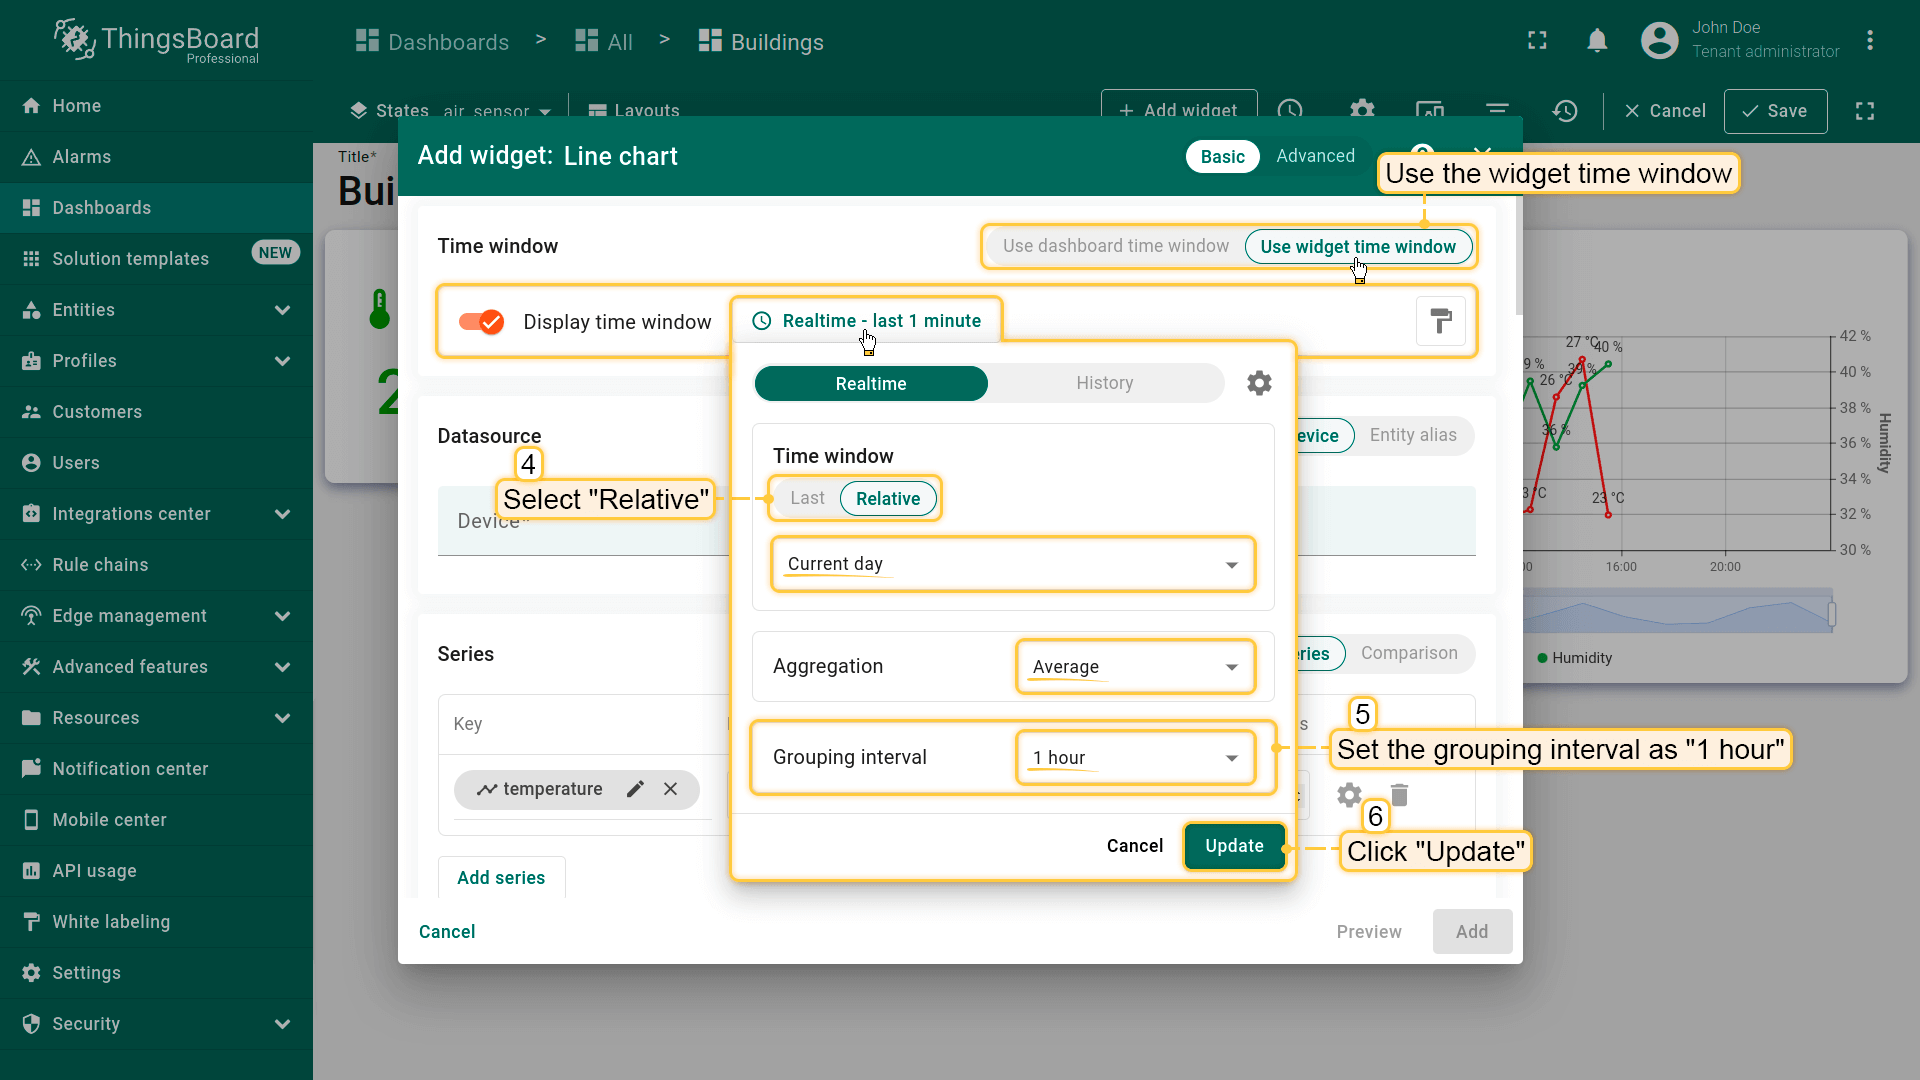
- 使用部件的时间窗口。在时间窗口设置中选择「Relative」,将时间间隔设为「Current day」。聚合函数保持「Average」,分组间隔设为 1 小时。然后点击「Update」;
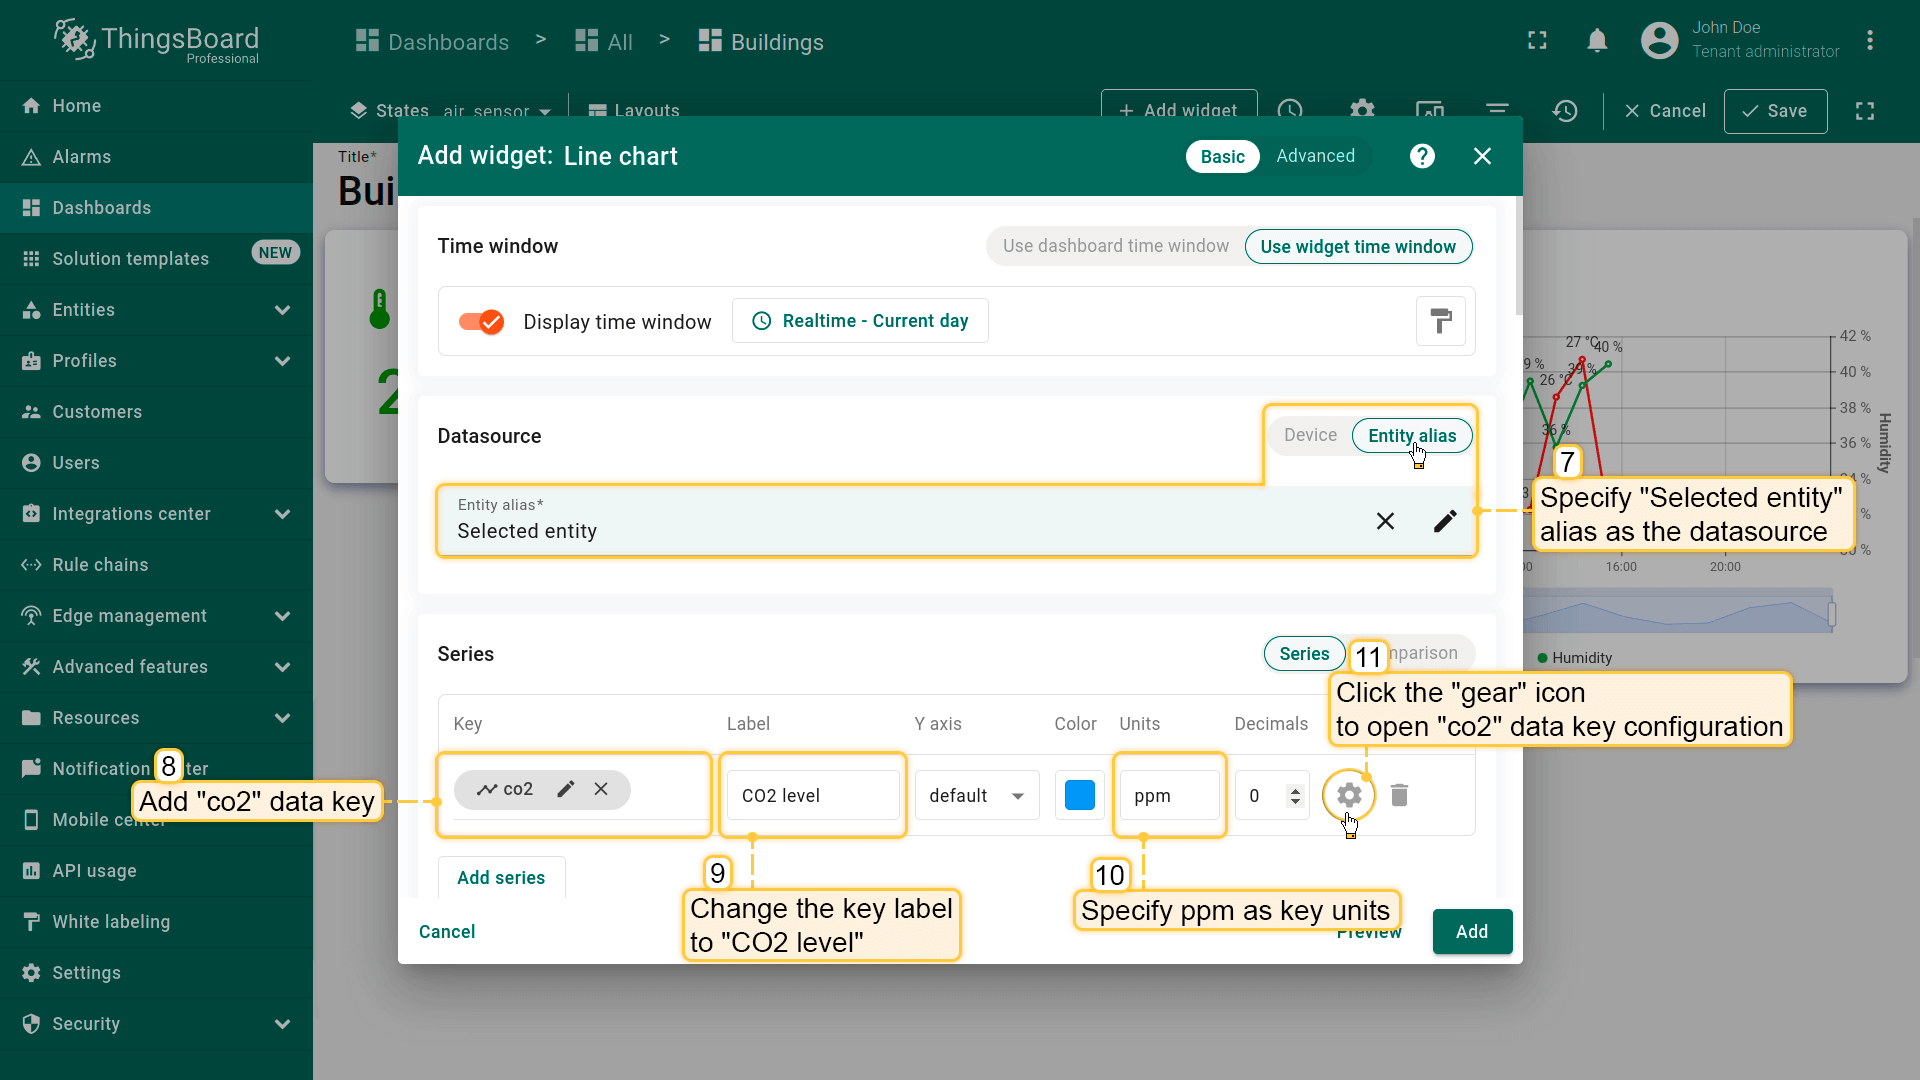
- 将「Selected entity」别名指定为数据源。添加「co2」作为数据键并设置其标签和单位。然后点击「齿轮」图标配置「co2」数据键设置;
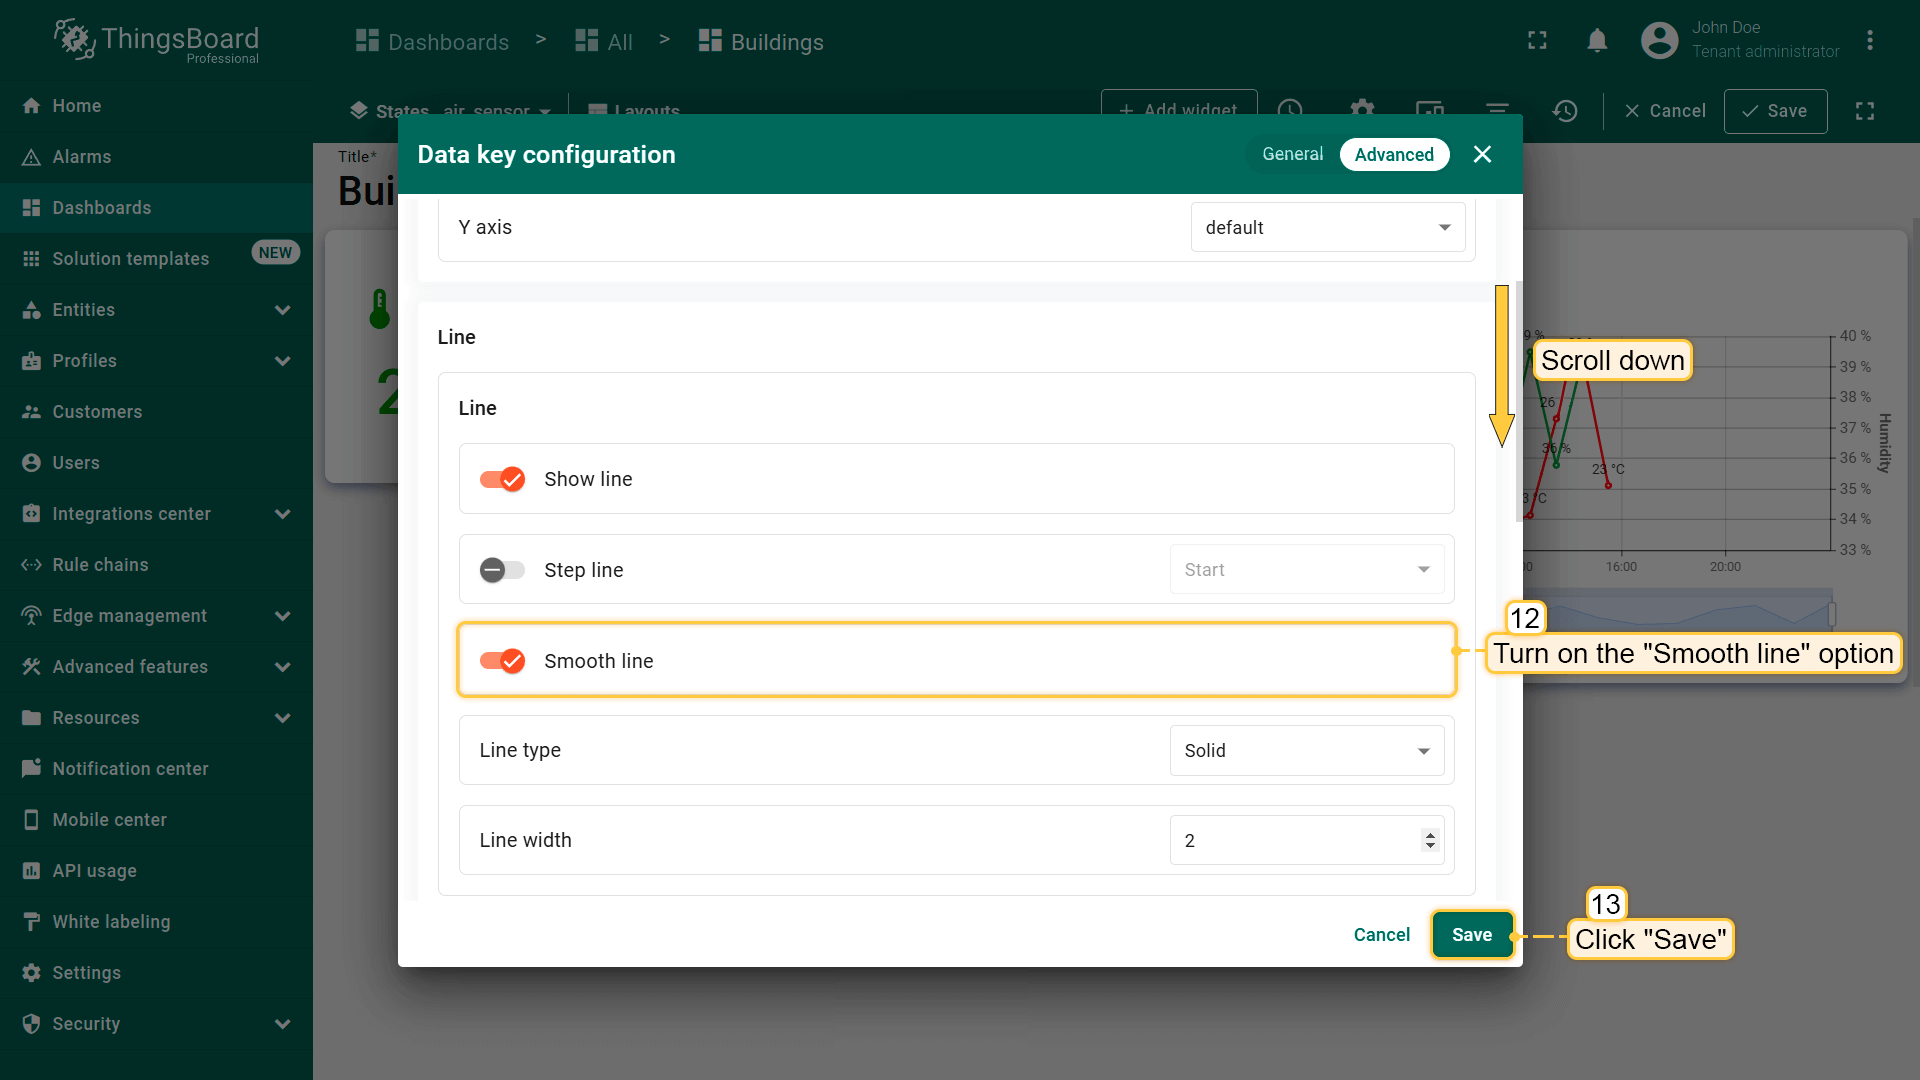
- 开启「Smooth line」选项使图表线条更平滑。点击「Save」;
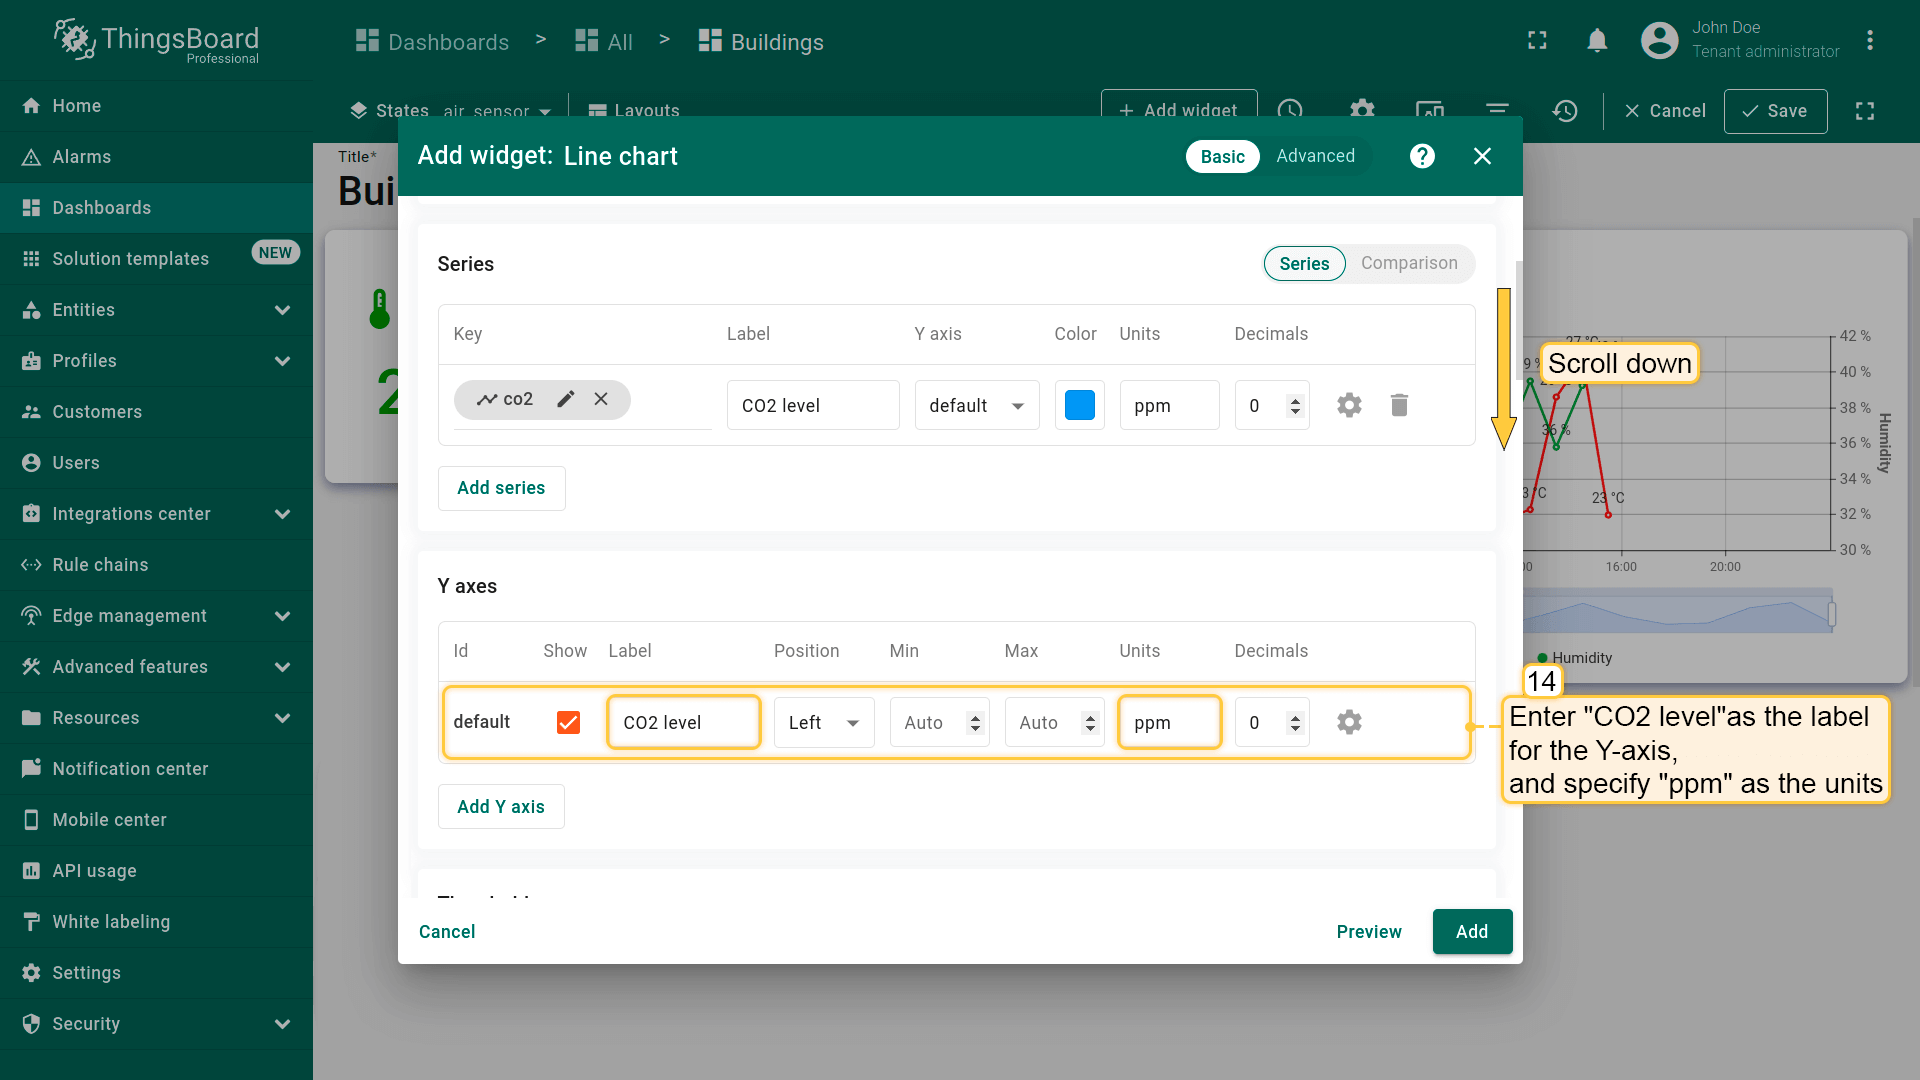
- 为 Y 轴输入名称,如「CO2 level」,单位设为「ppm」;
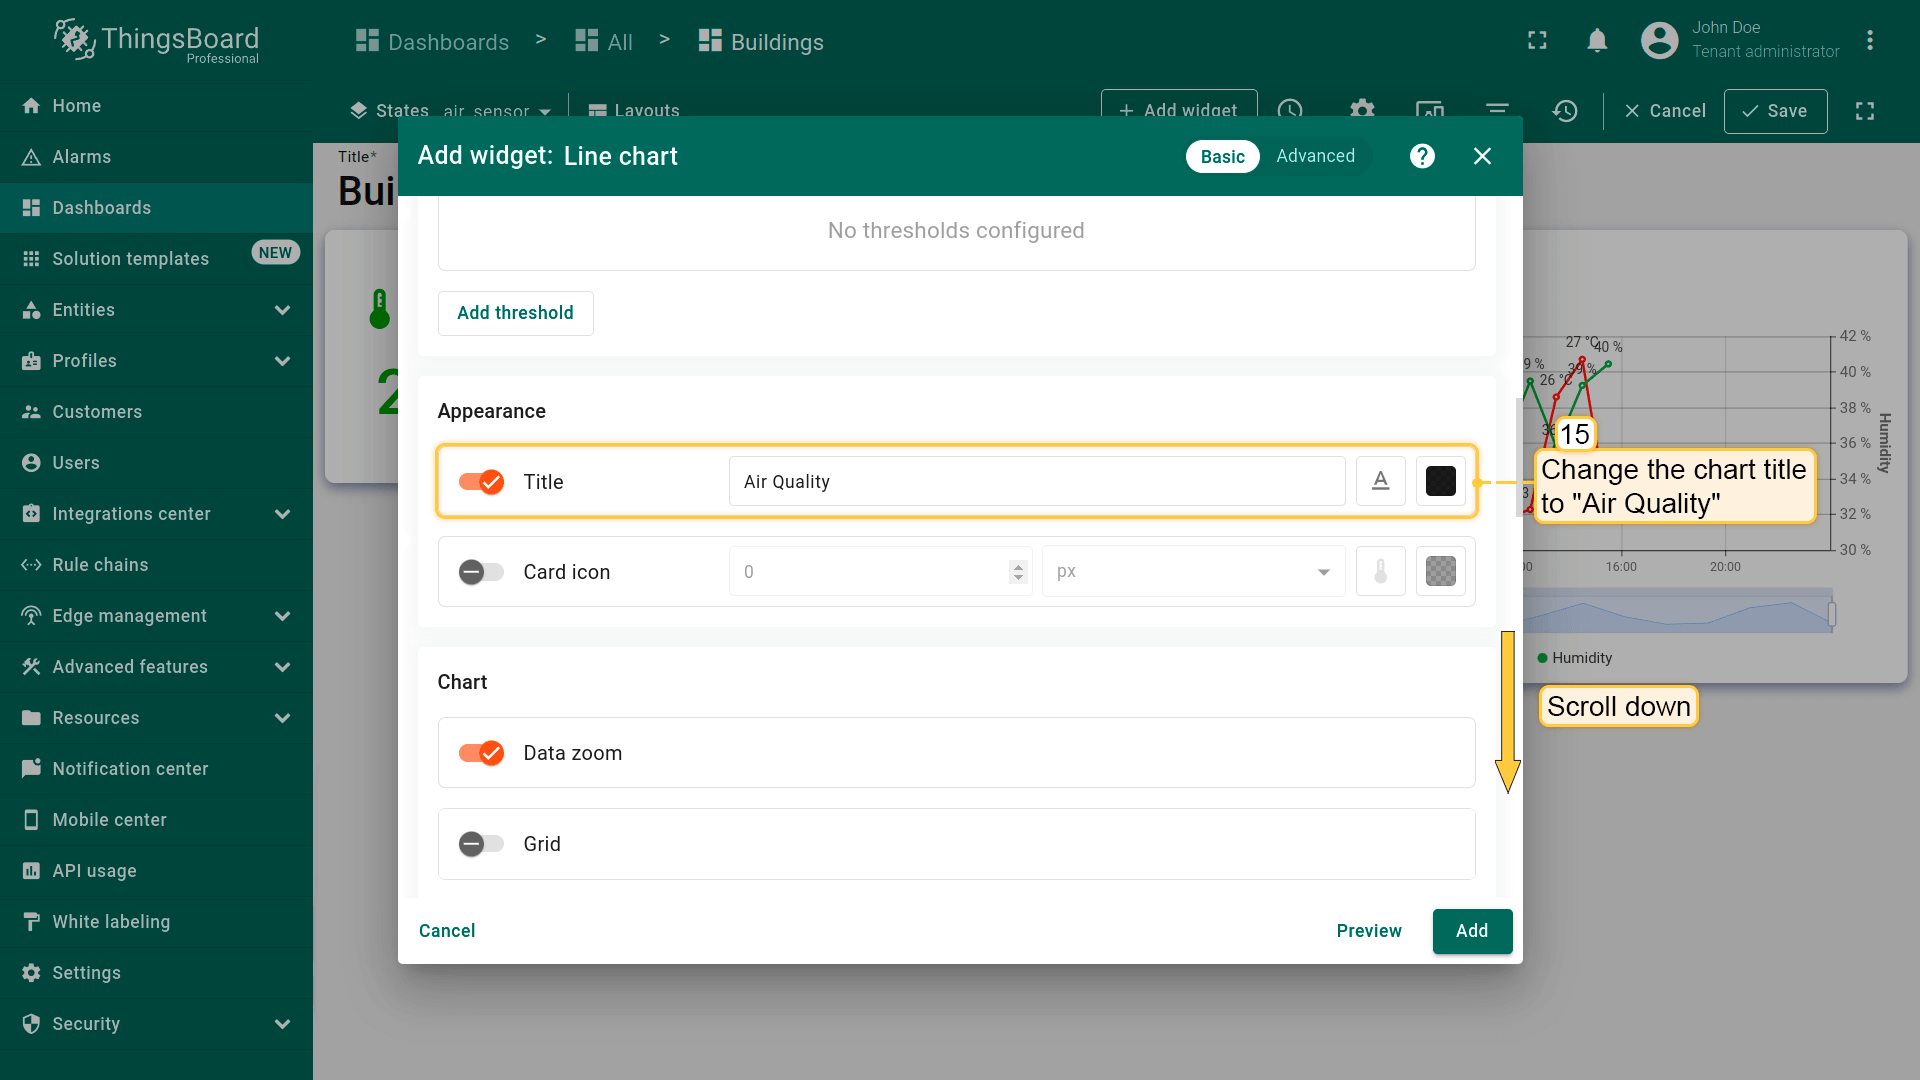
- 将图表标题改为「Air Quality」;
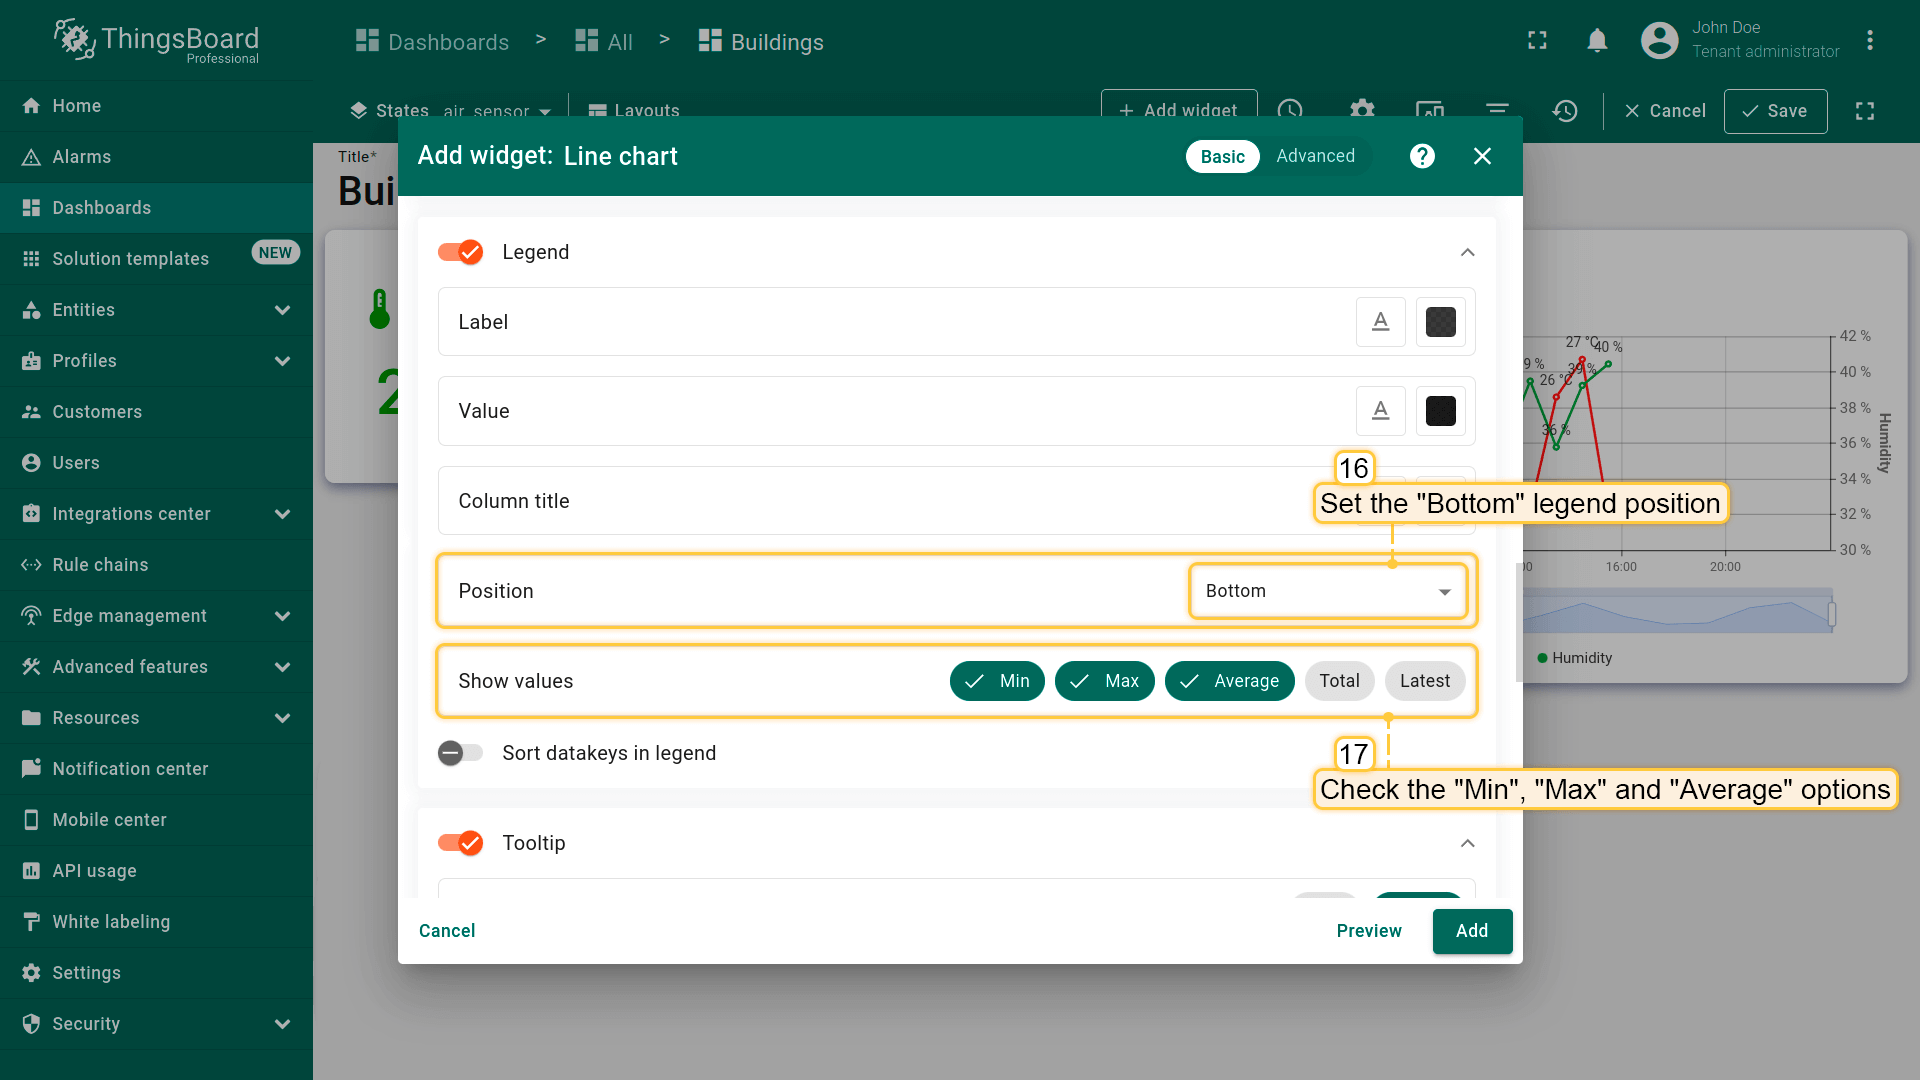
- 将图例位置设为「Bottom」。勾选「Show values」中的「Min」「Max」「Average」以在图表上显示这些统计值;
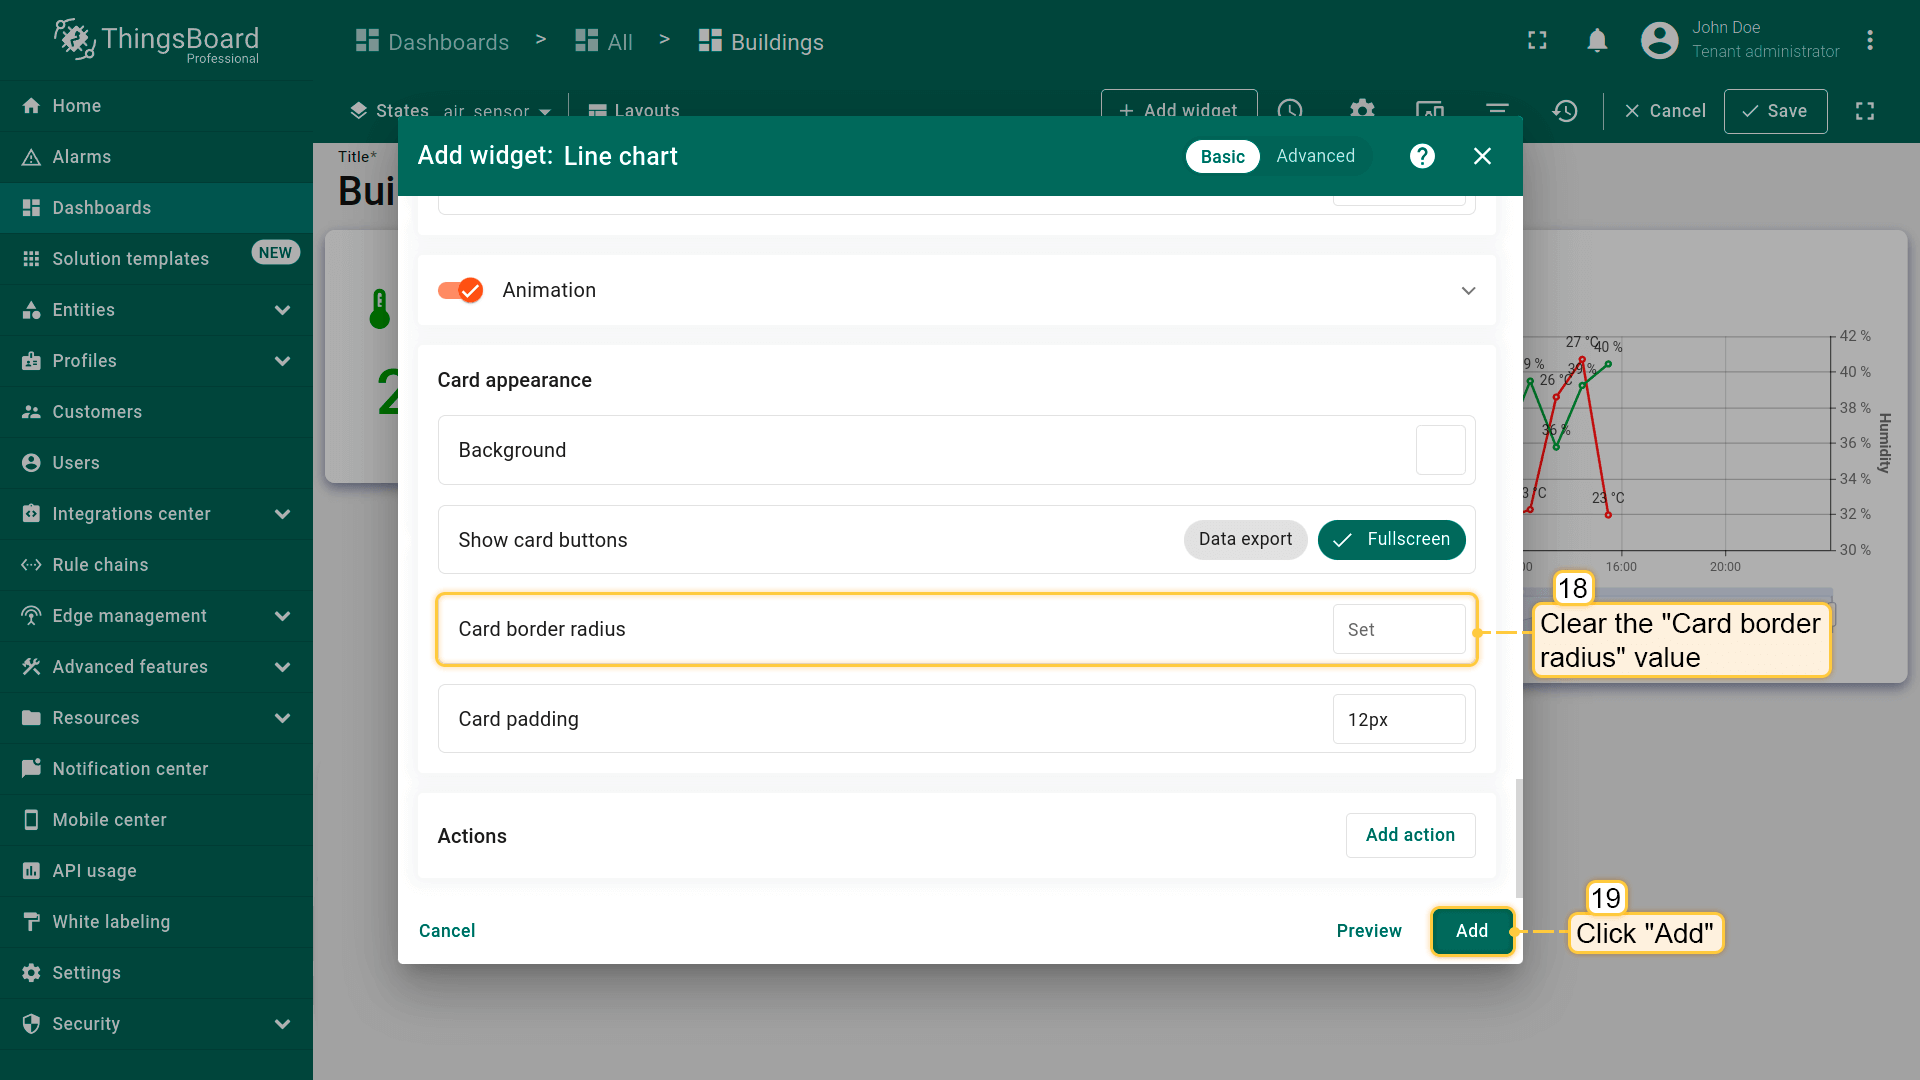
- 清空「Card border radius」值。点击「Add」;
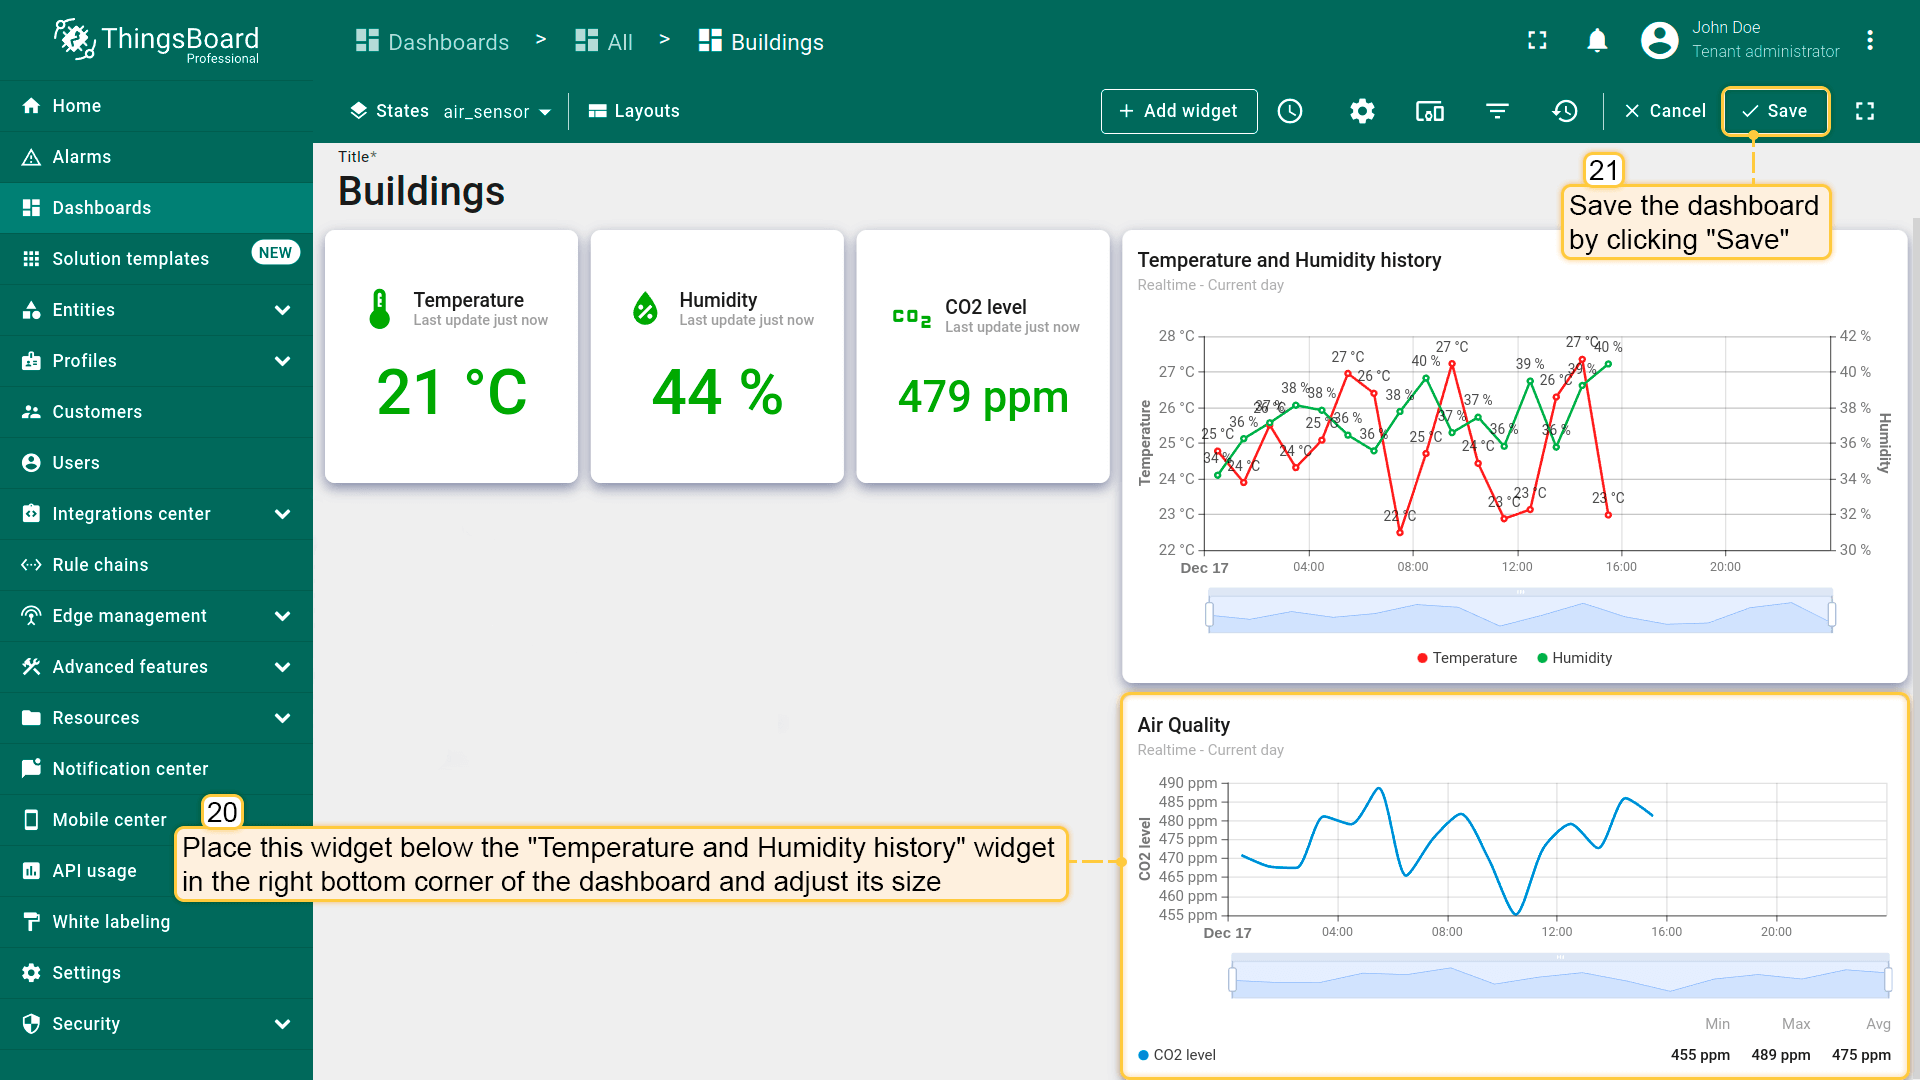
- 将此部件放在「Temperature and Humidity history」部件下方、仪表板右下角,并调整大小。保存仪表板以应用更改。
Monitor the current air quality status and analyze its changes over time in a separate dashboard state.
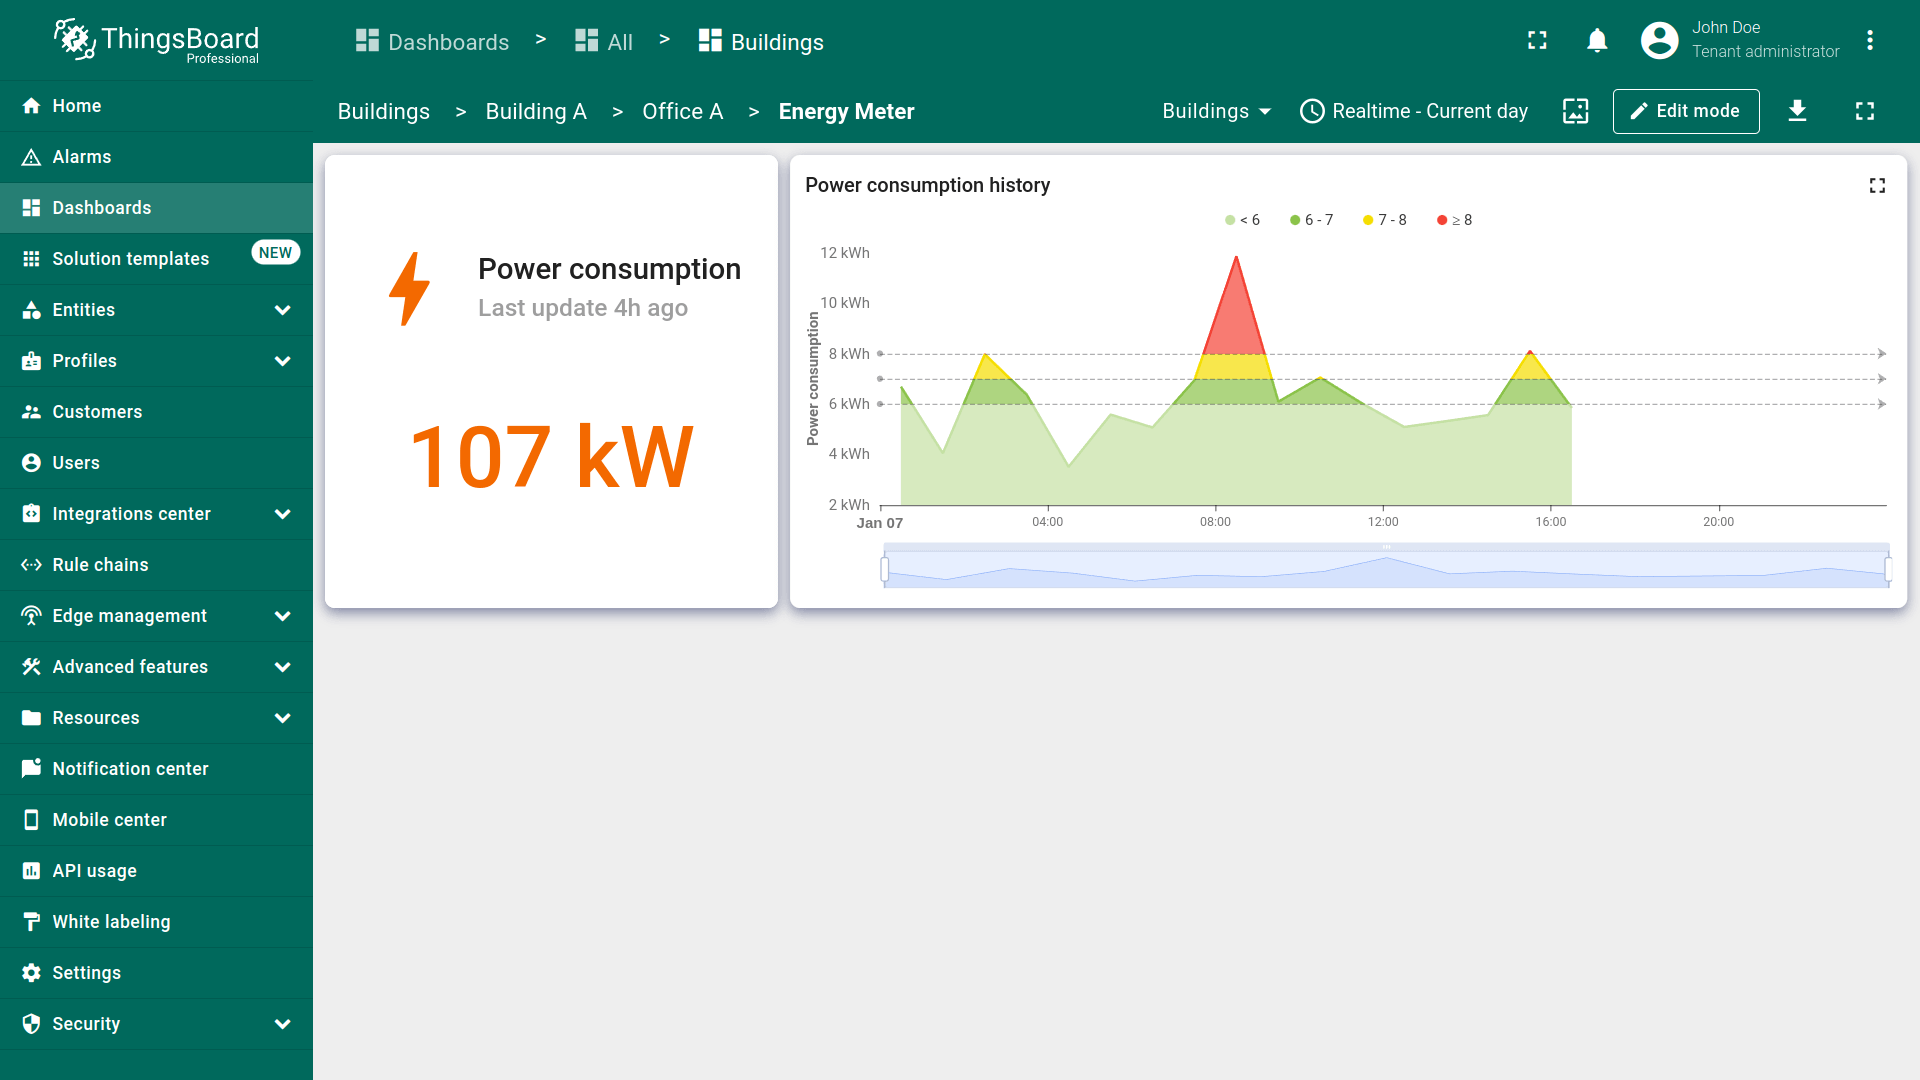
Configuring energy_sensor state
Let's move on to configuring the energy_sensor state. We will add two widgets: one to display the total energy consumption for the current day and another to display historical data on hourly energy consumption.
Current power consumption
To display total power consumption, use the “Power consumption card” widget from the “Industrial widgets” bundle:
- 点击「办公室传感器列表」部件中的「Energy Meter」设备行以进入其状态;
- Enter dashboard editing mode, and click the "+ Add widget" button;
- 在部件库中找到并点击「Industrial widgets」包;
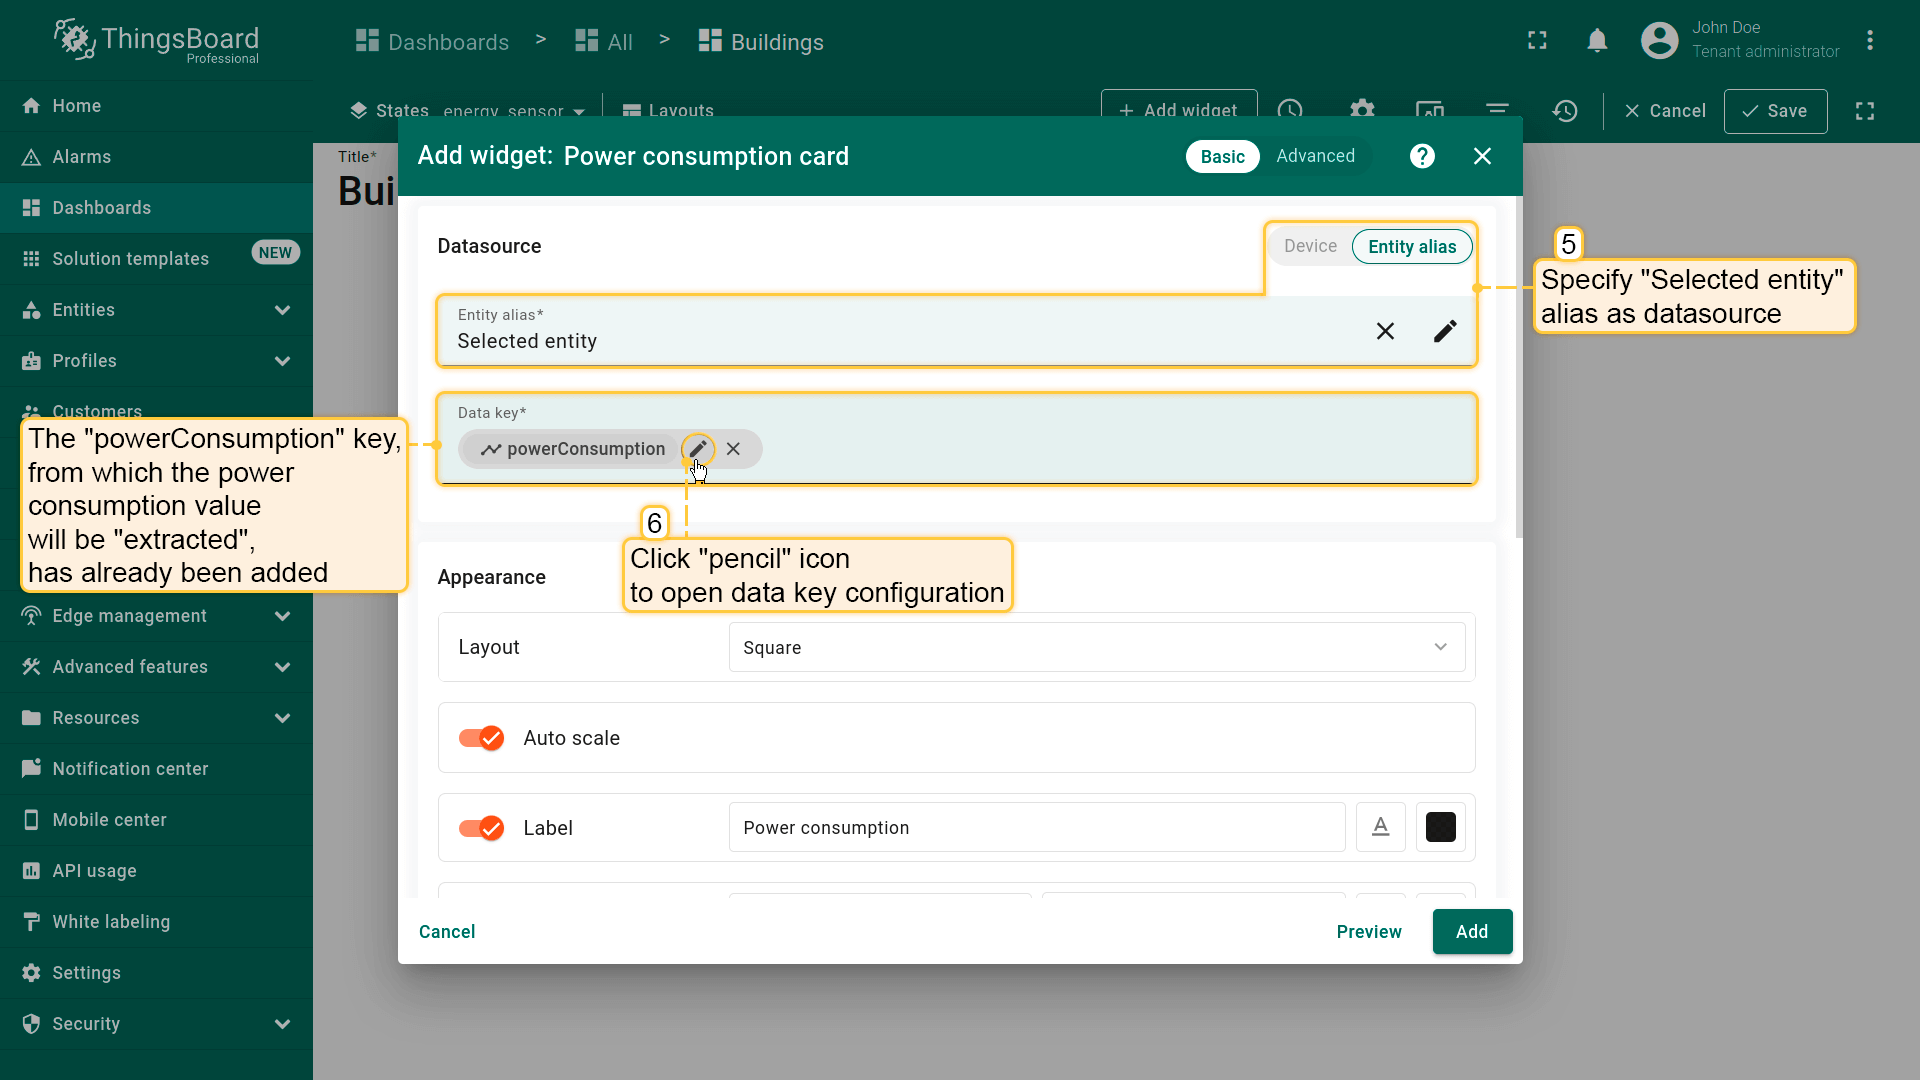
- 选择「Power consumption card」部件;
- 将「Selected entity」别名指定为数据源。「powerConsumption」键已指定为数据键。点击「铅笔」图标打开「powerConsumption」数据键配置;
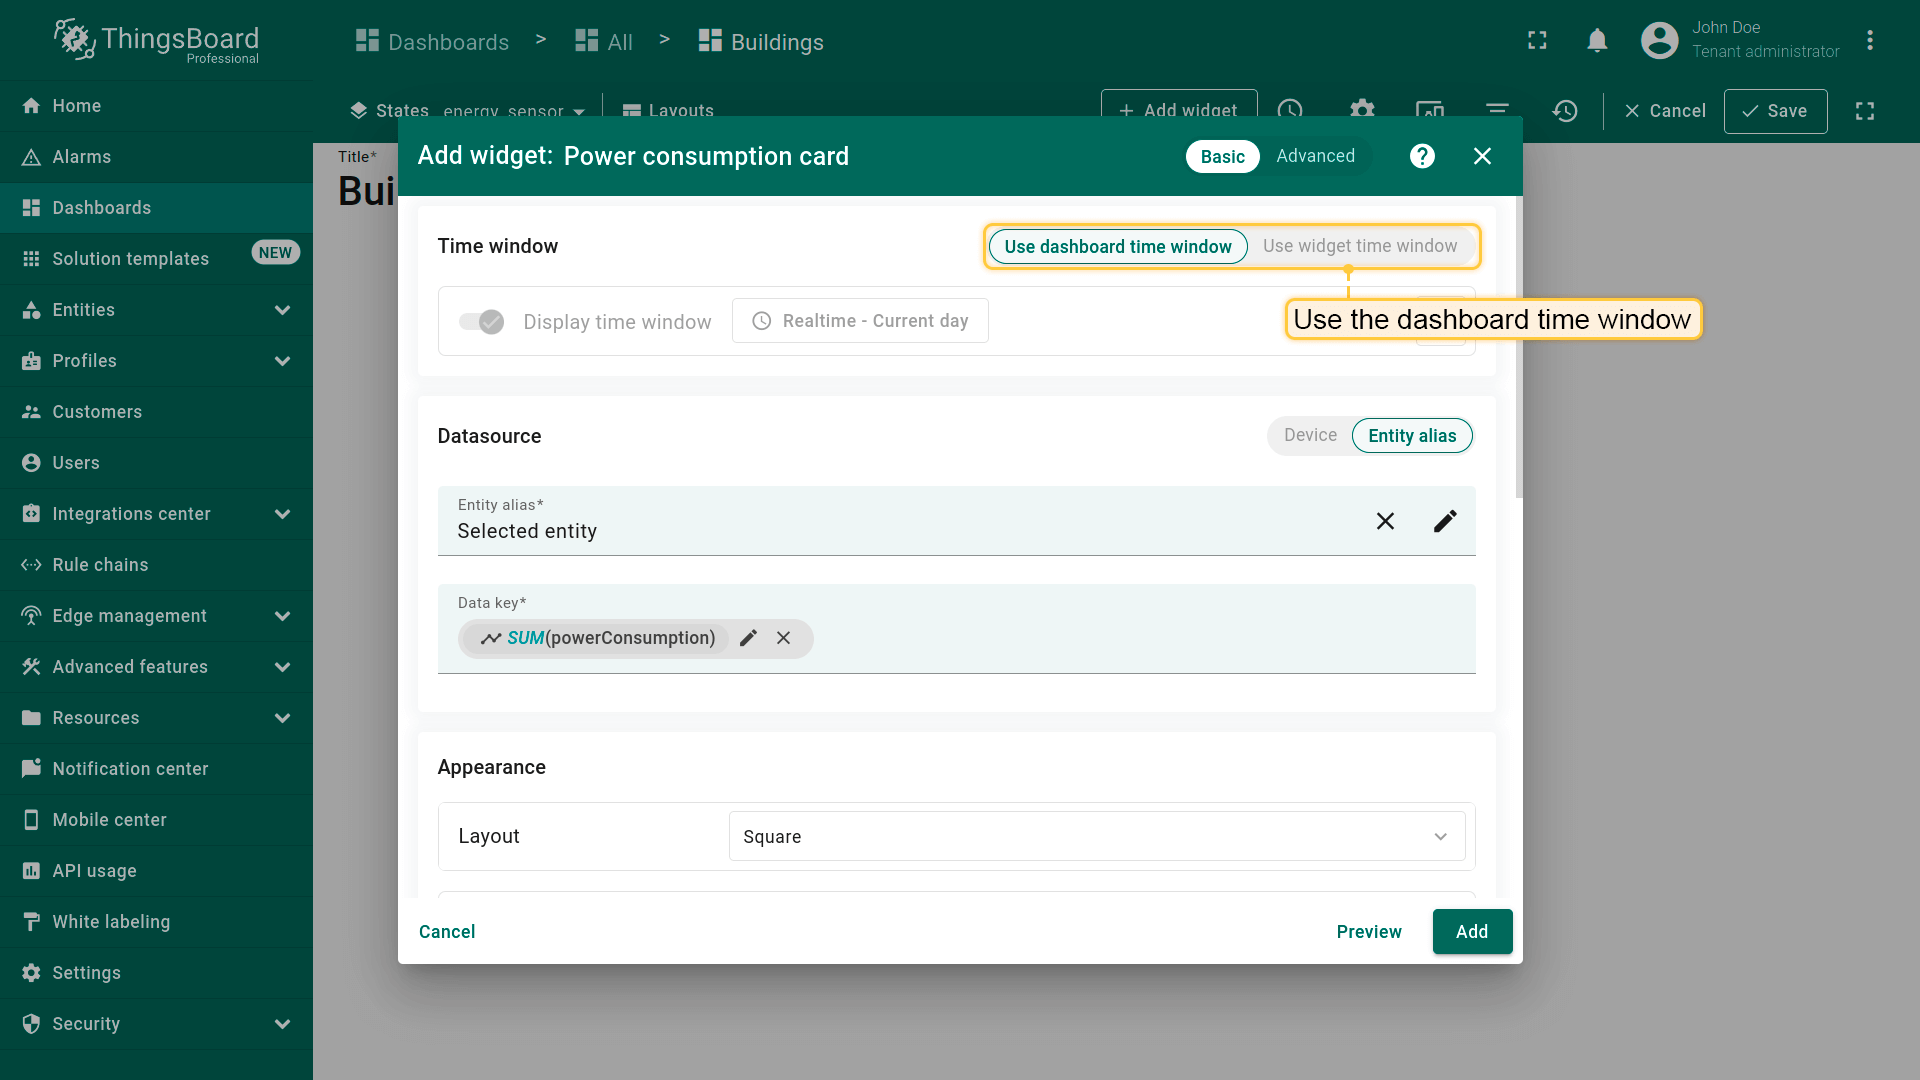
- 选择「Sum」作为聚合函数以汇总所选时间段内的所有数据点值。点击「Save」;
- 使用仪表板时间窗口;
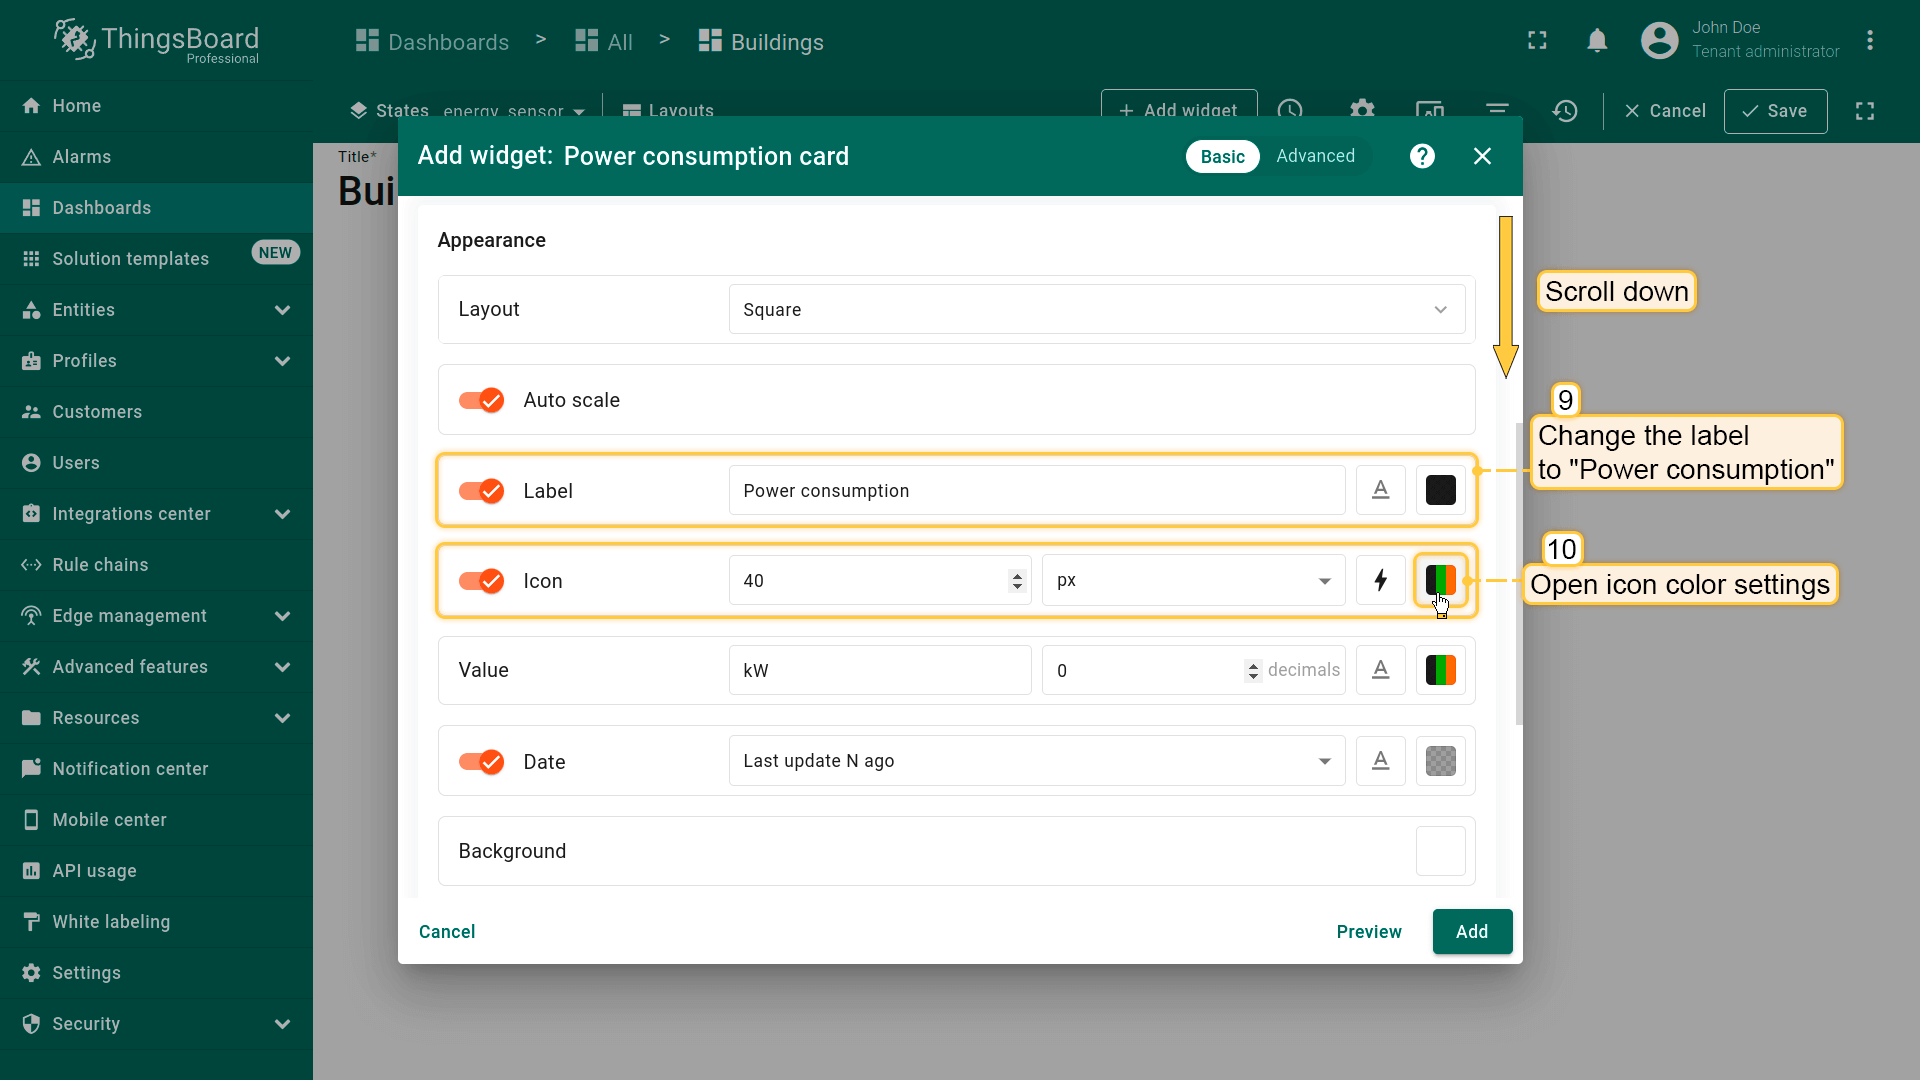
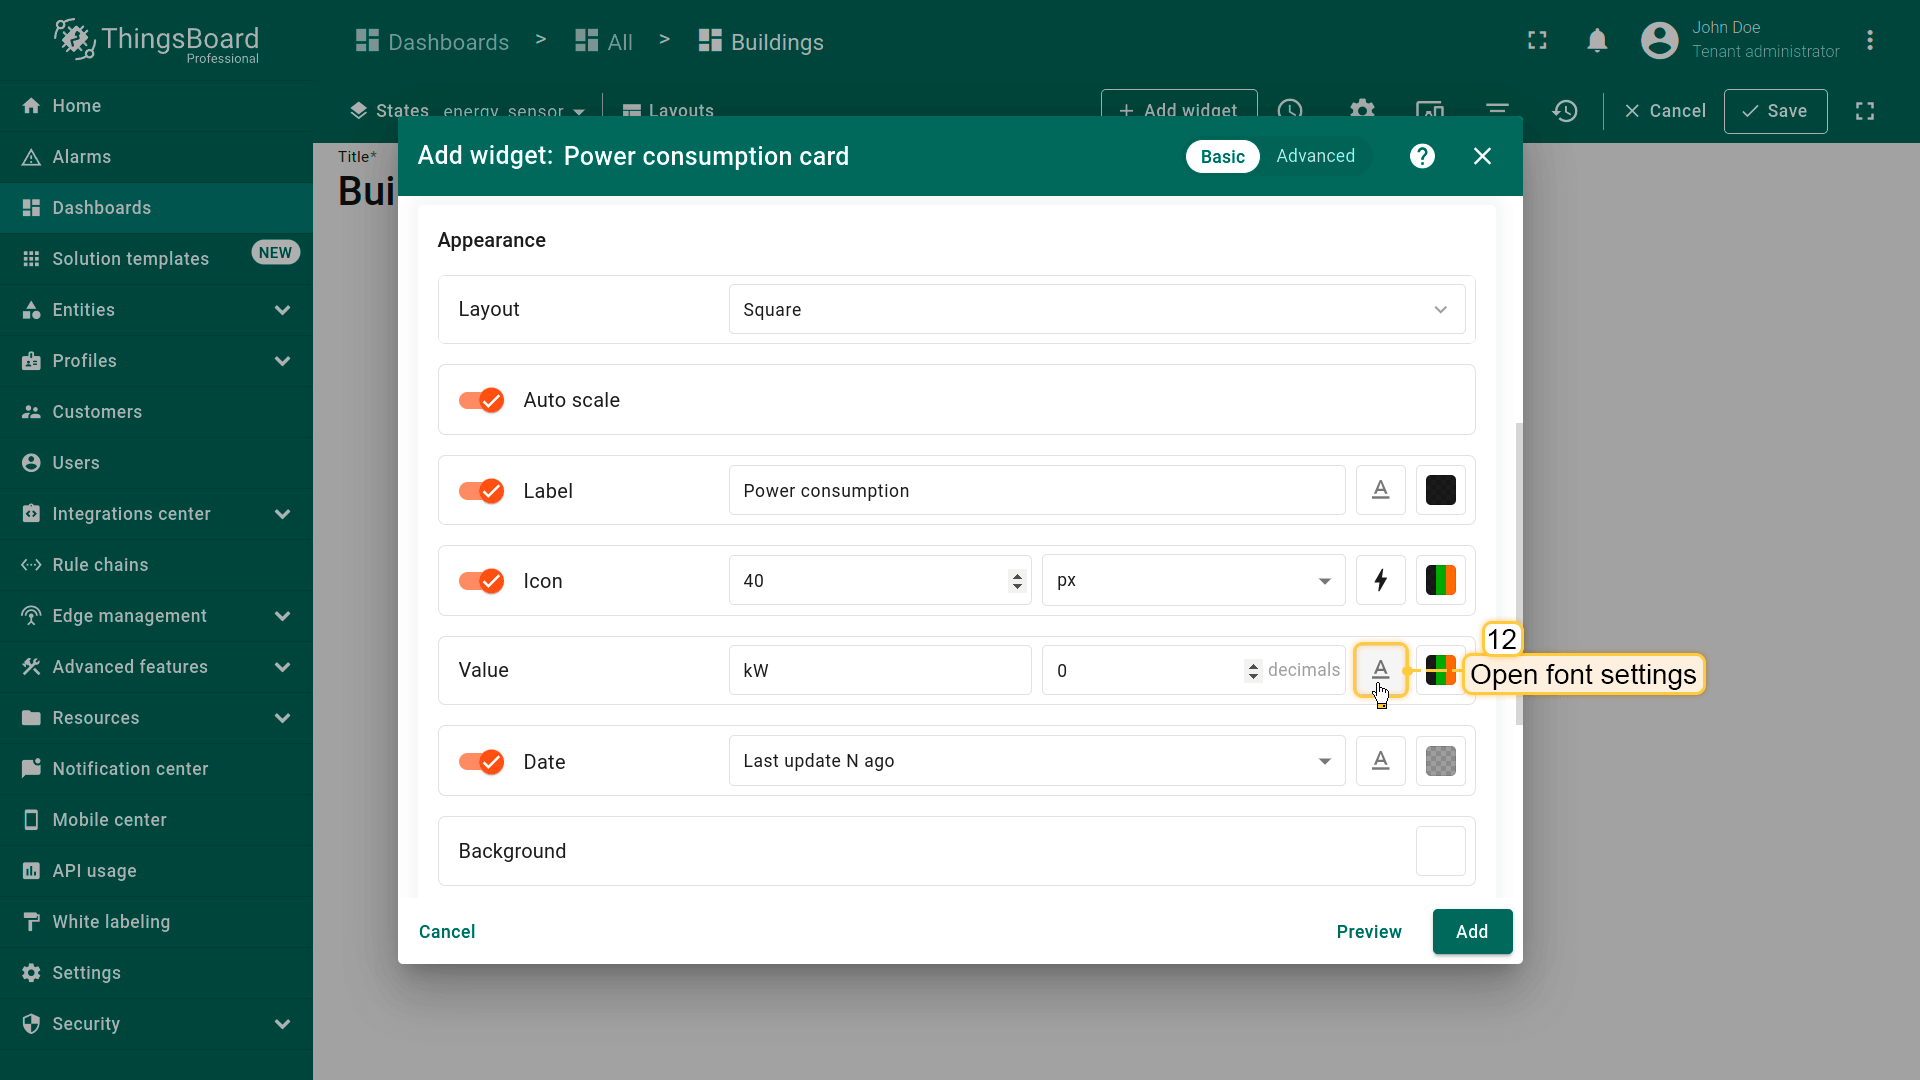
- 将部件标签改为「Power consumption」。打开图标颜色设置;
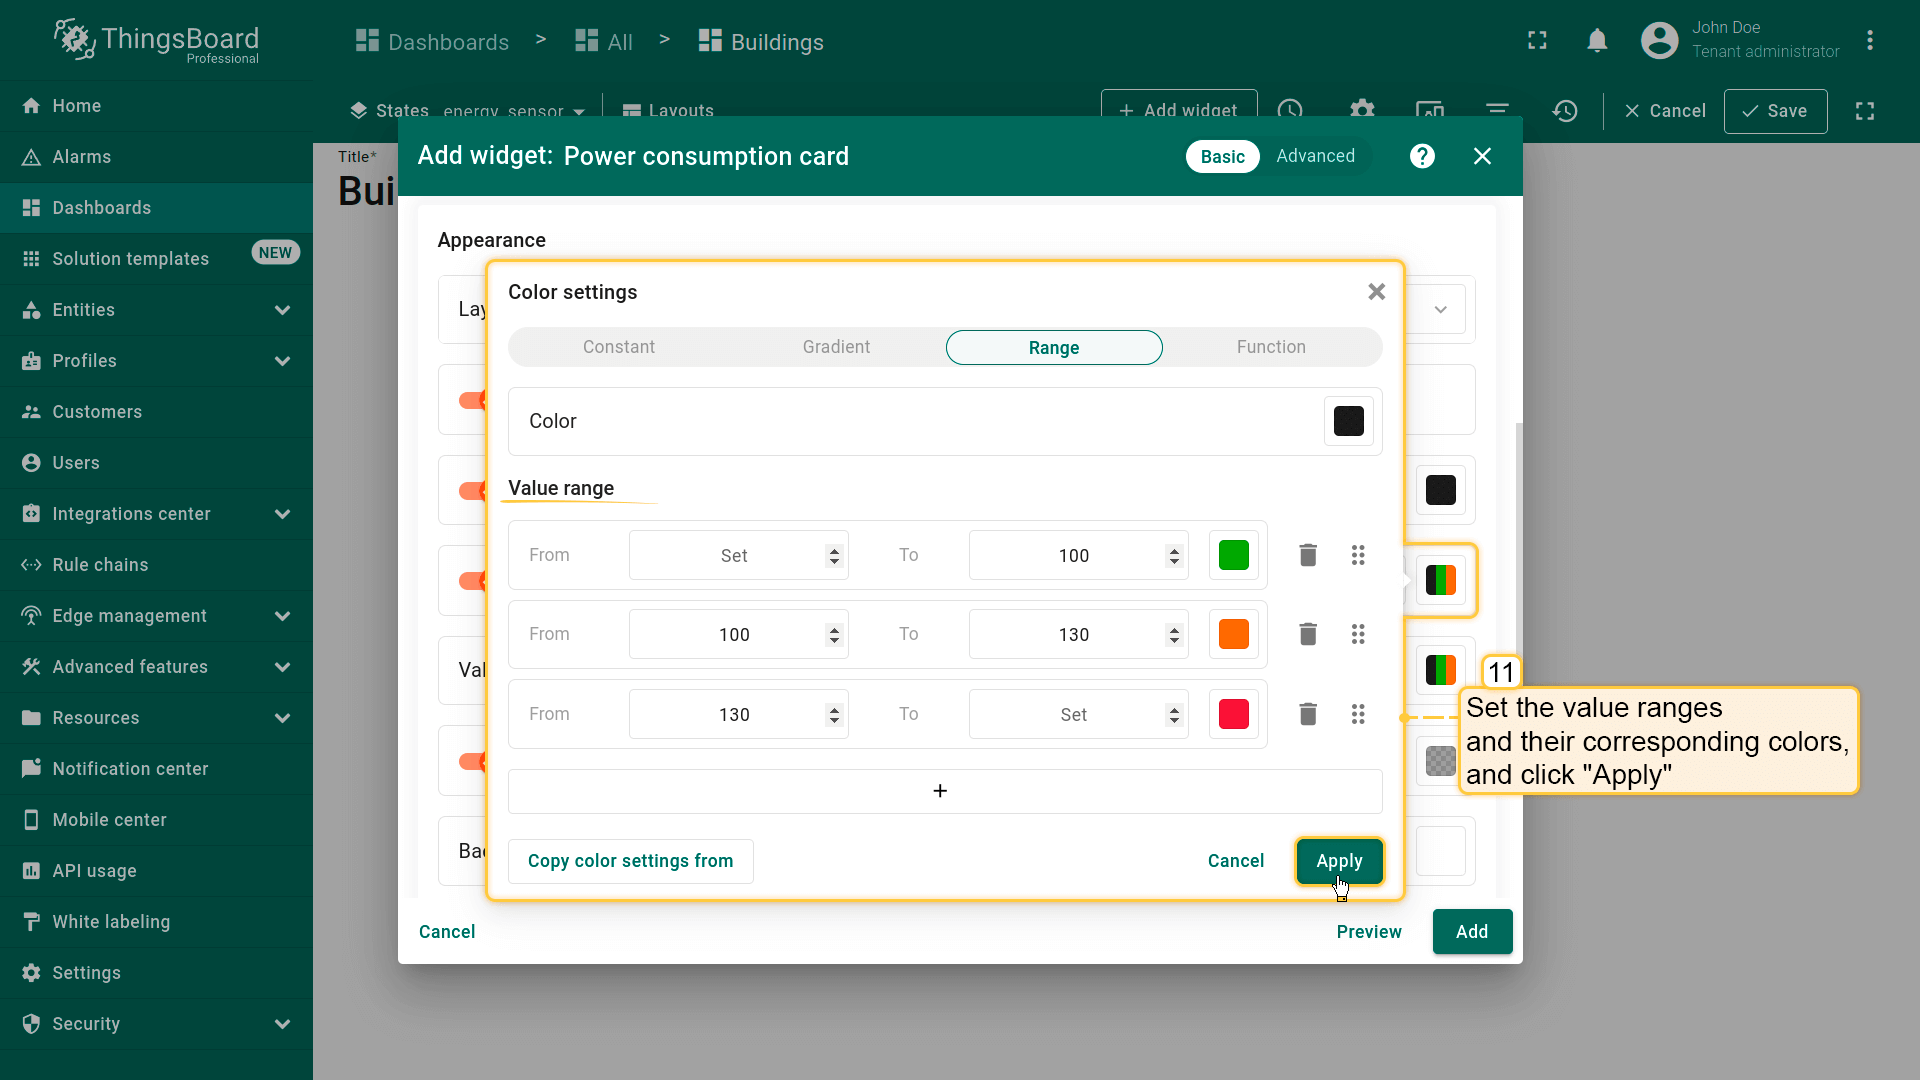
- 按截图所示设置取值范围及对应颜色。然后点击「Apply」;
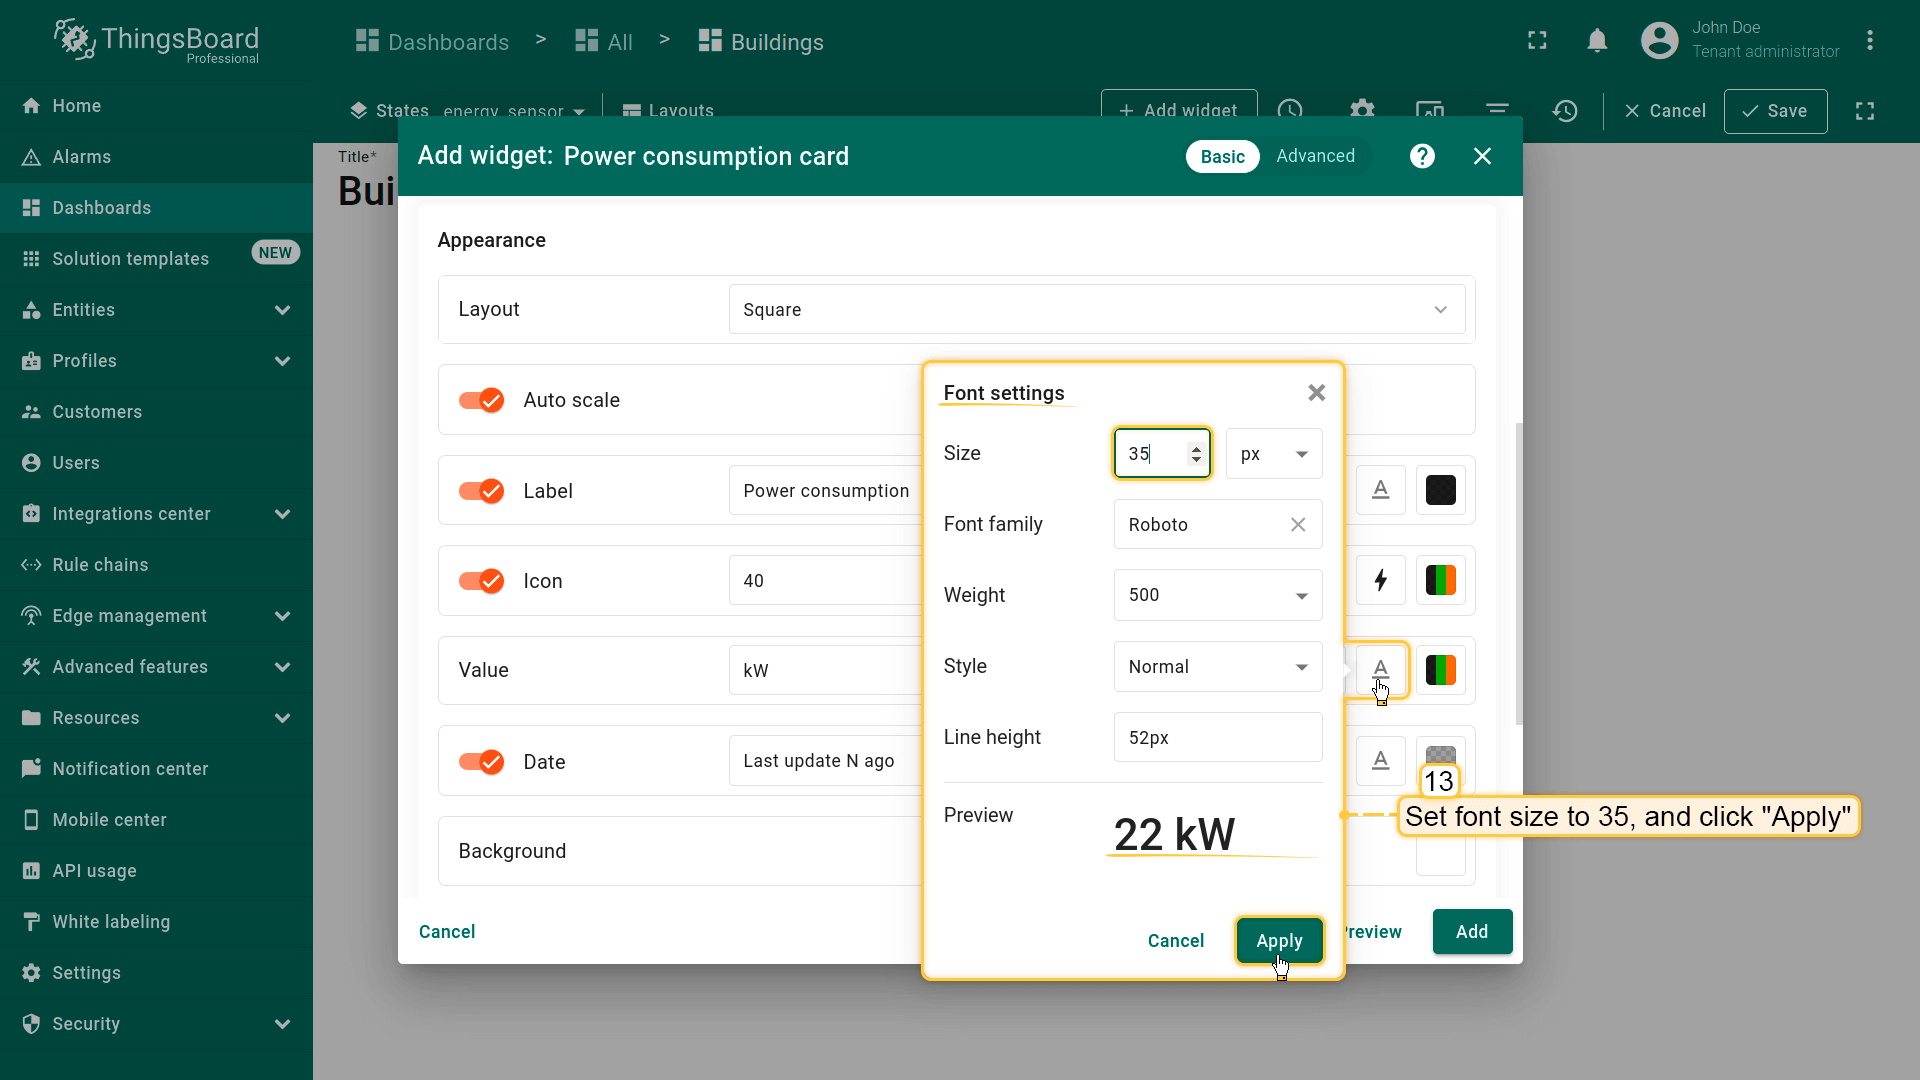
- 打开字体设置;
- 将字体大小设为 35 像素,点击「Apply」;
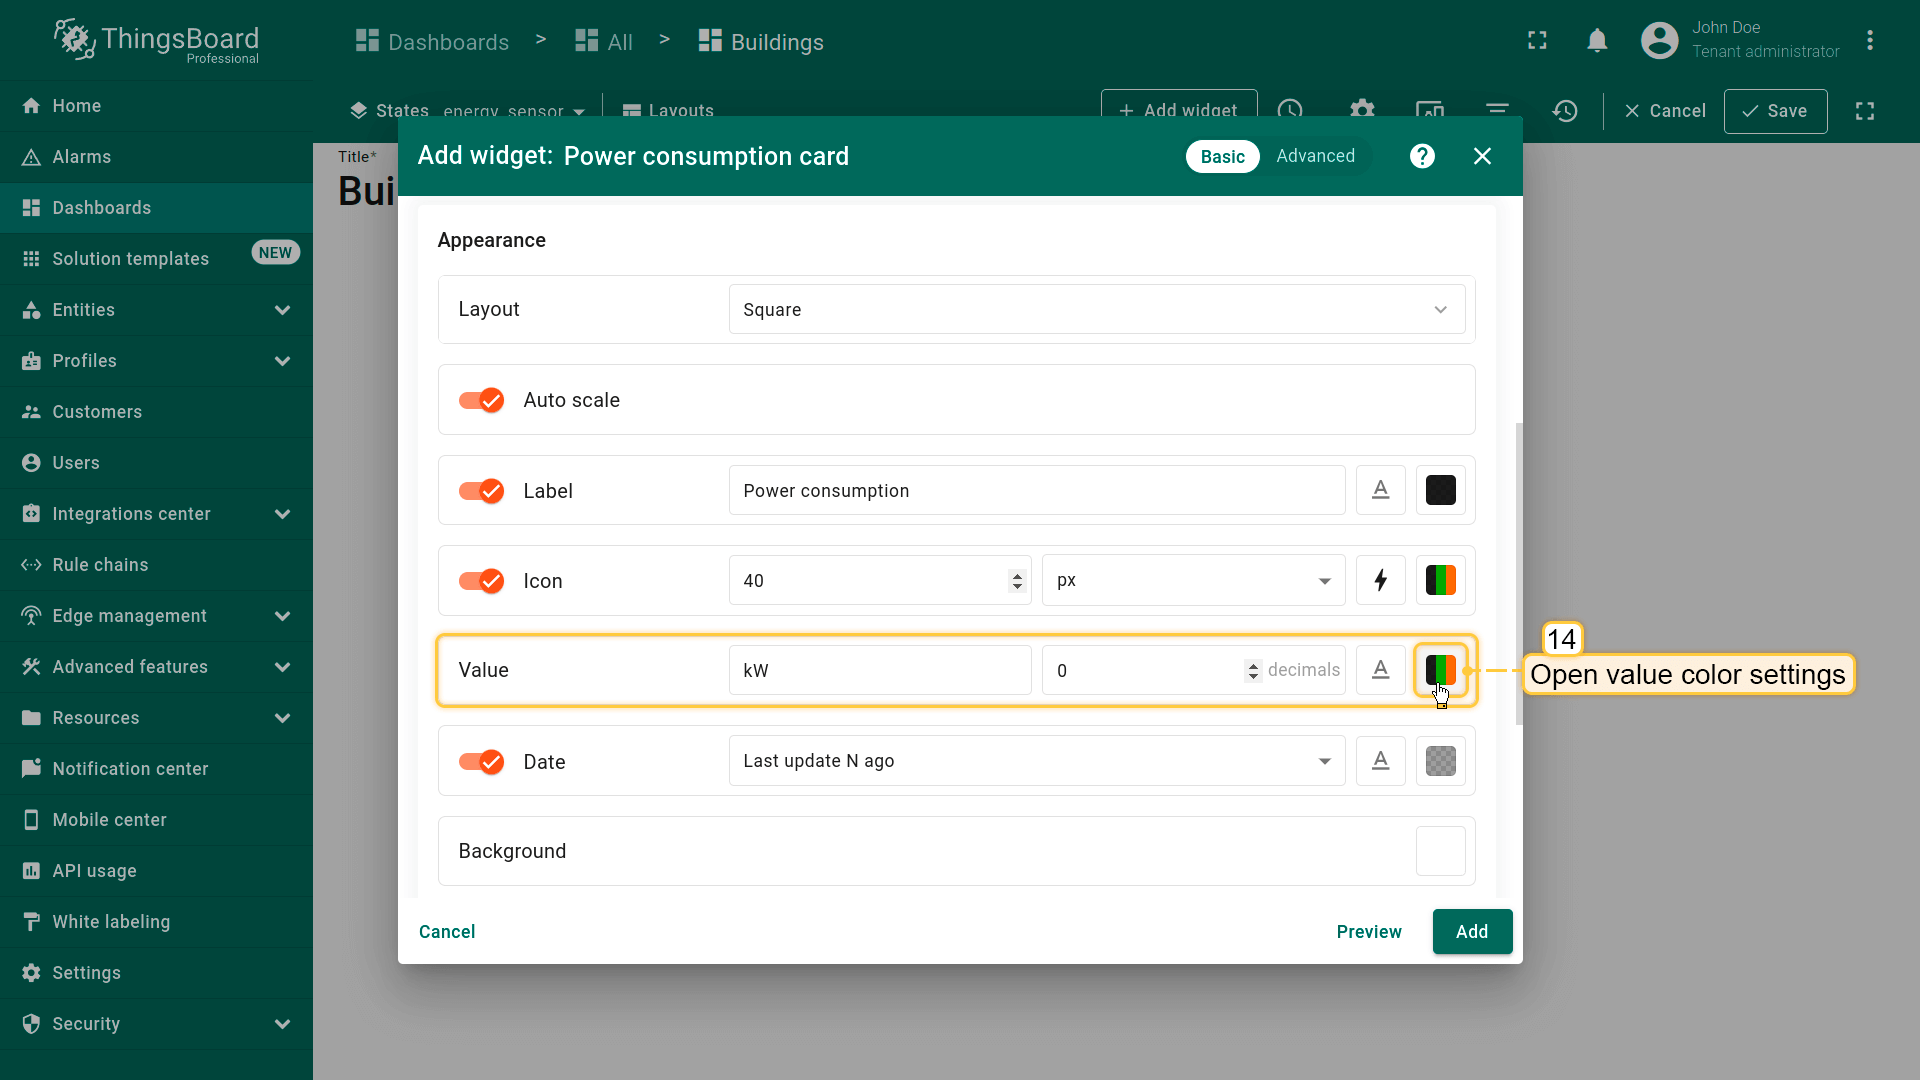
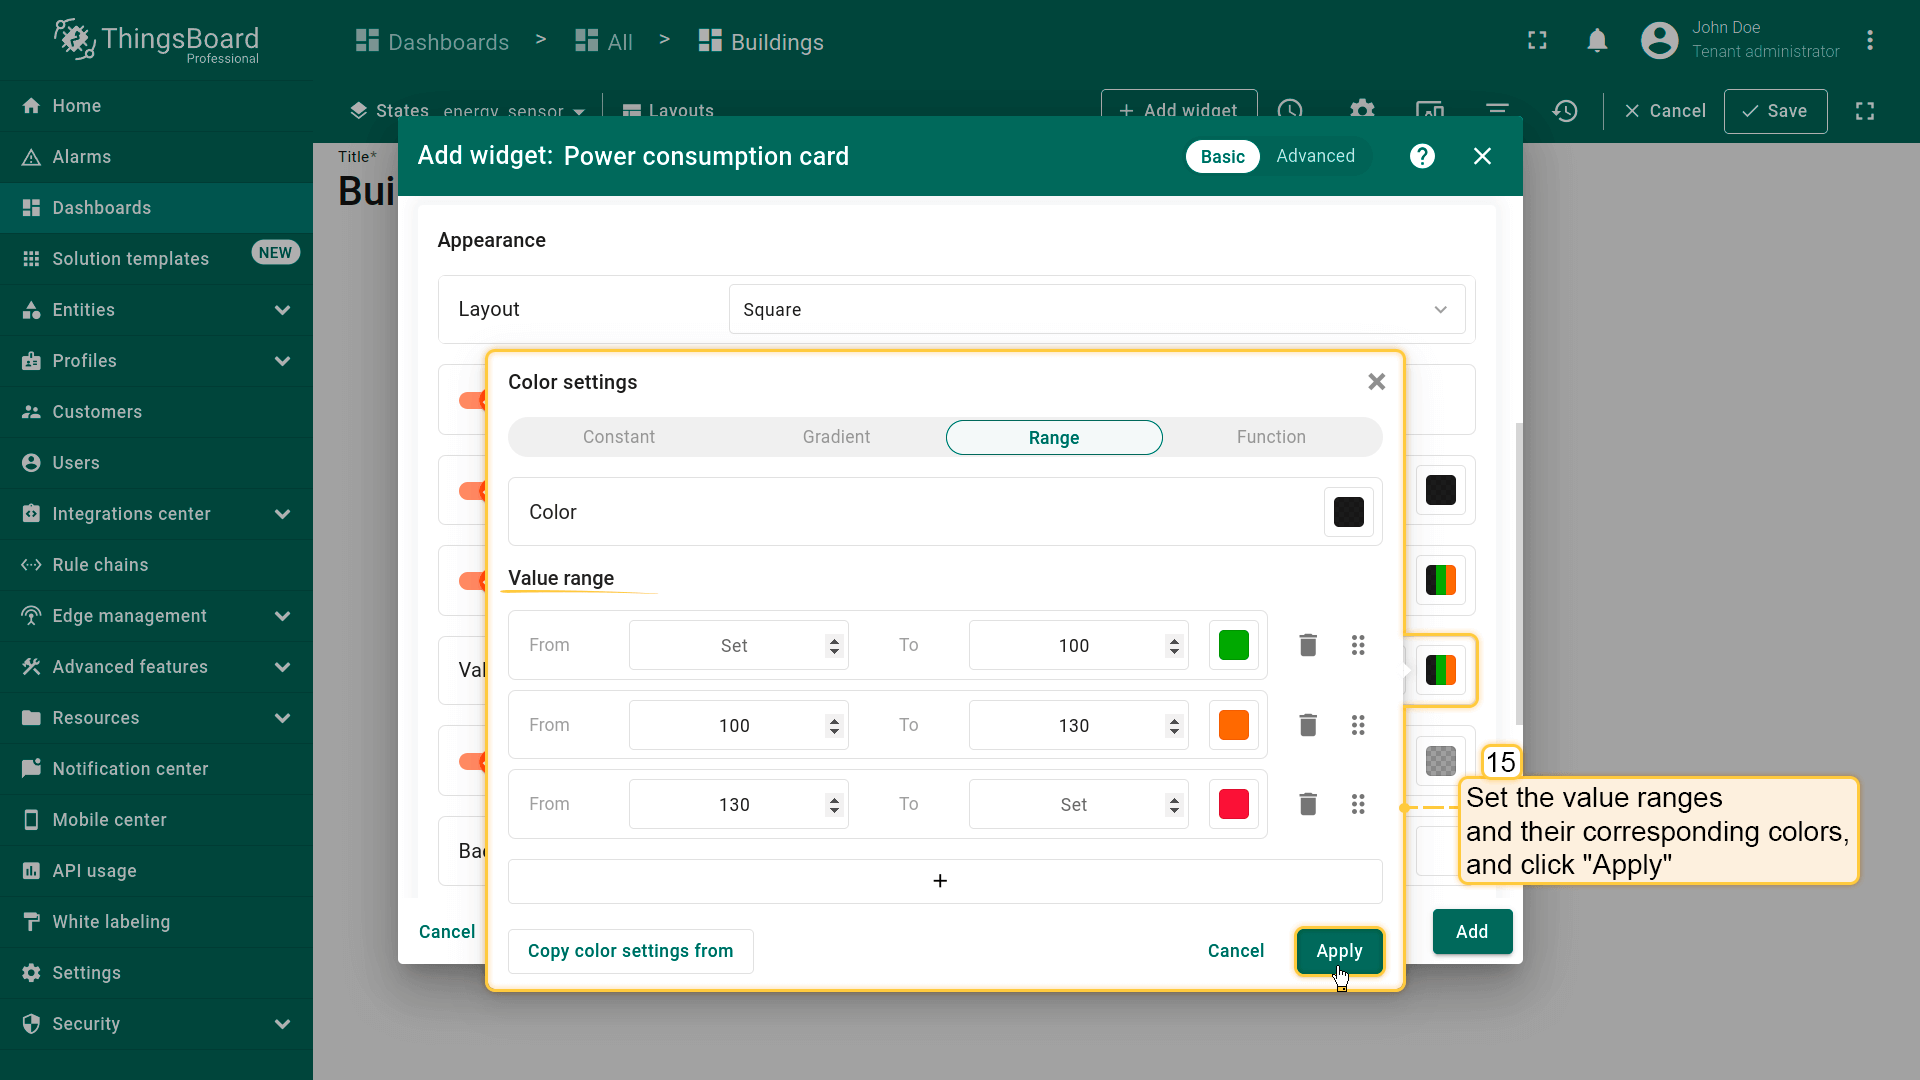
- 打开数值颜色设置;
- 按截图所示设置取值范围及对应颜色。然后点击「Apply」;
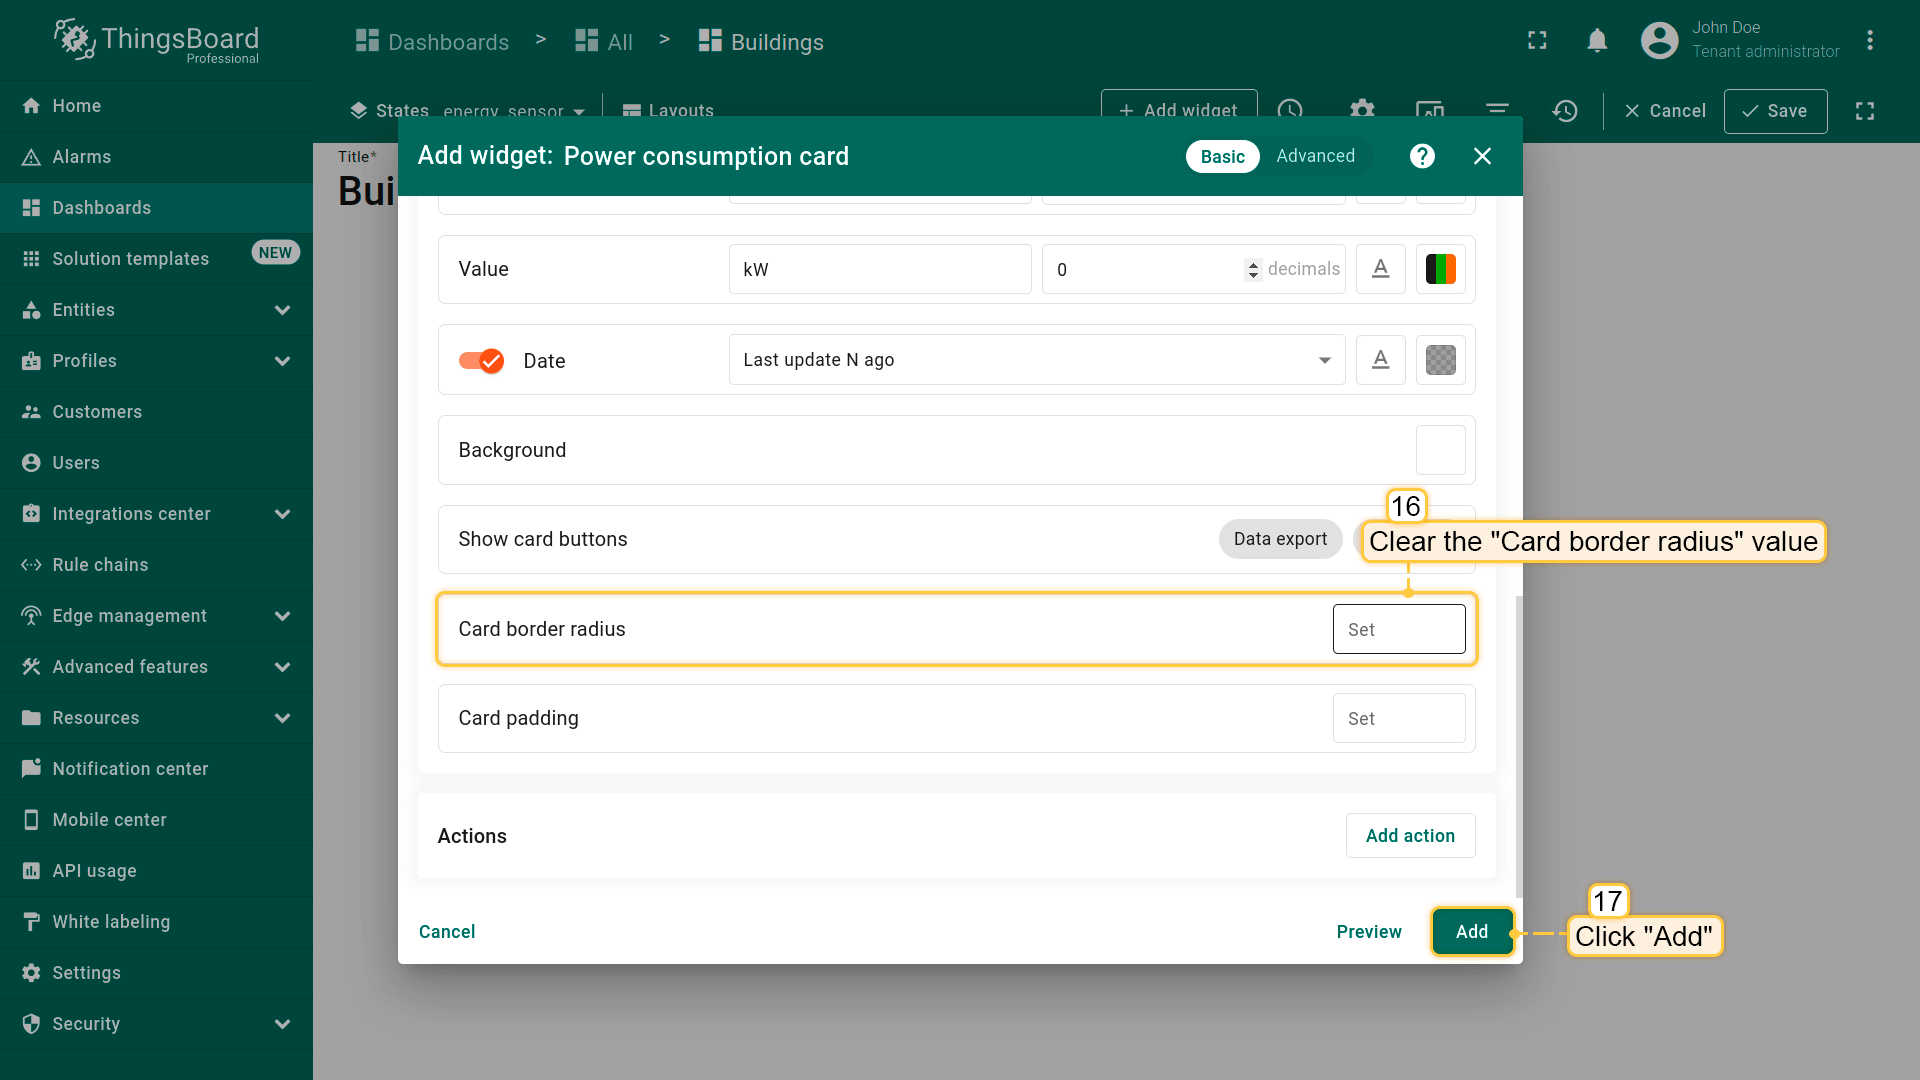
- 清空「Card border radius」值,点击「Add」;
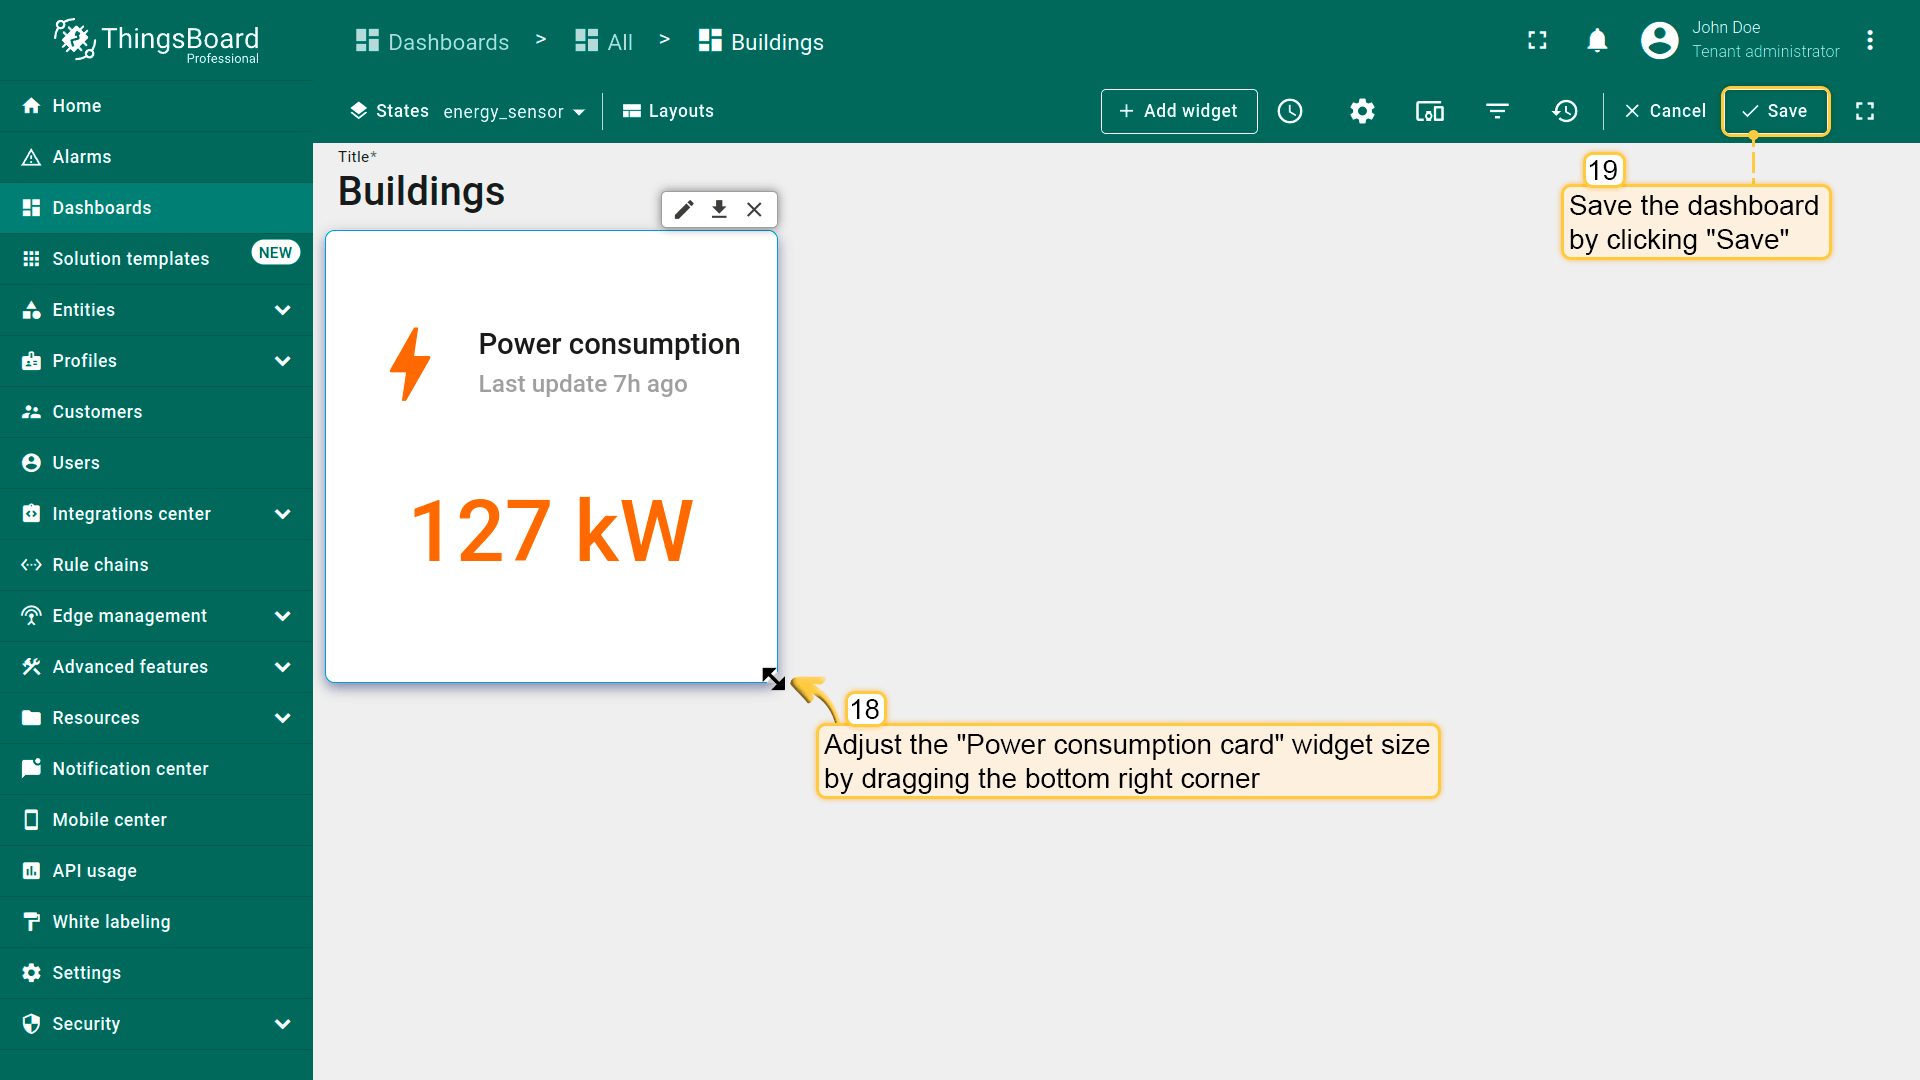
- 已添加显示仪表板时间窗口指定时间段内总功耗的部件。按需调整部件大小,然后保存仪表板以应用更改。


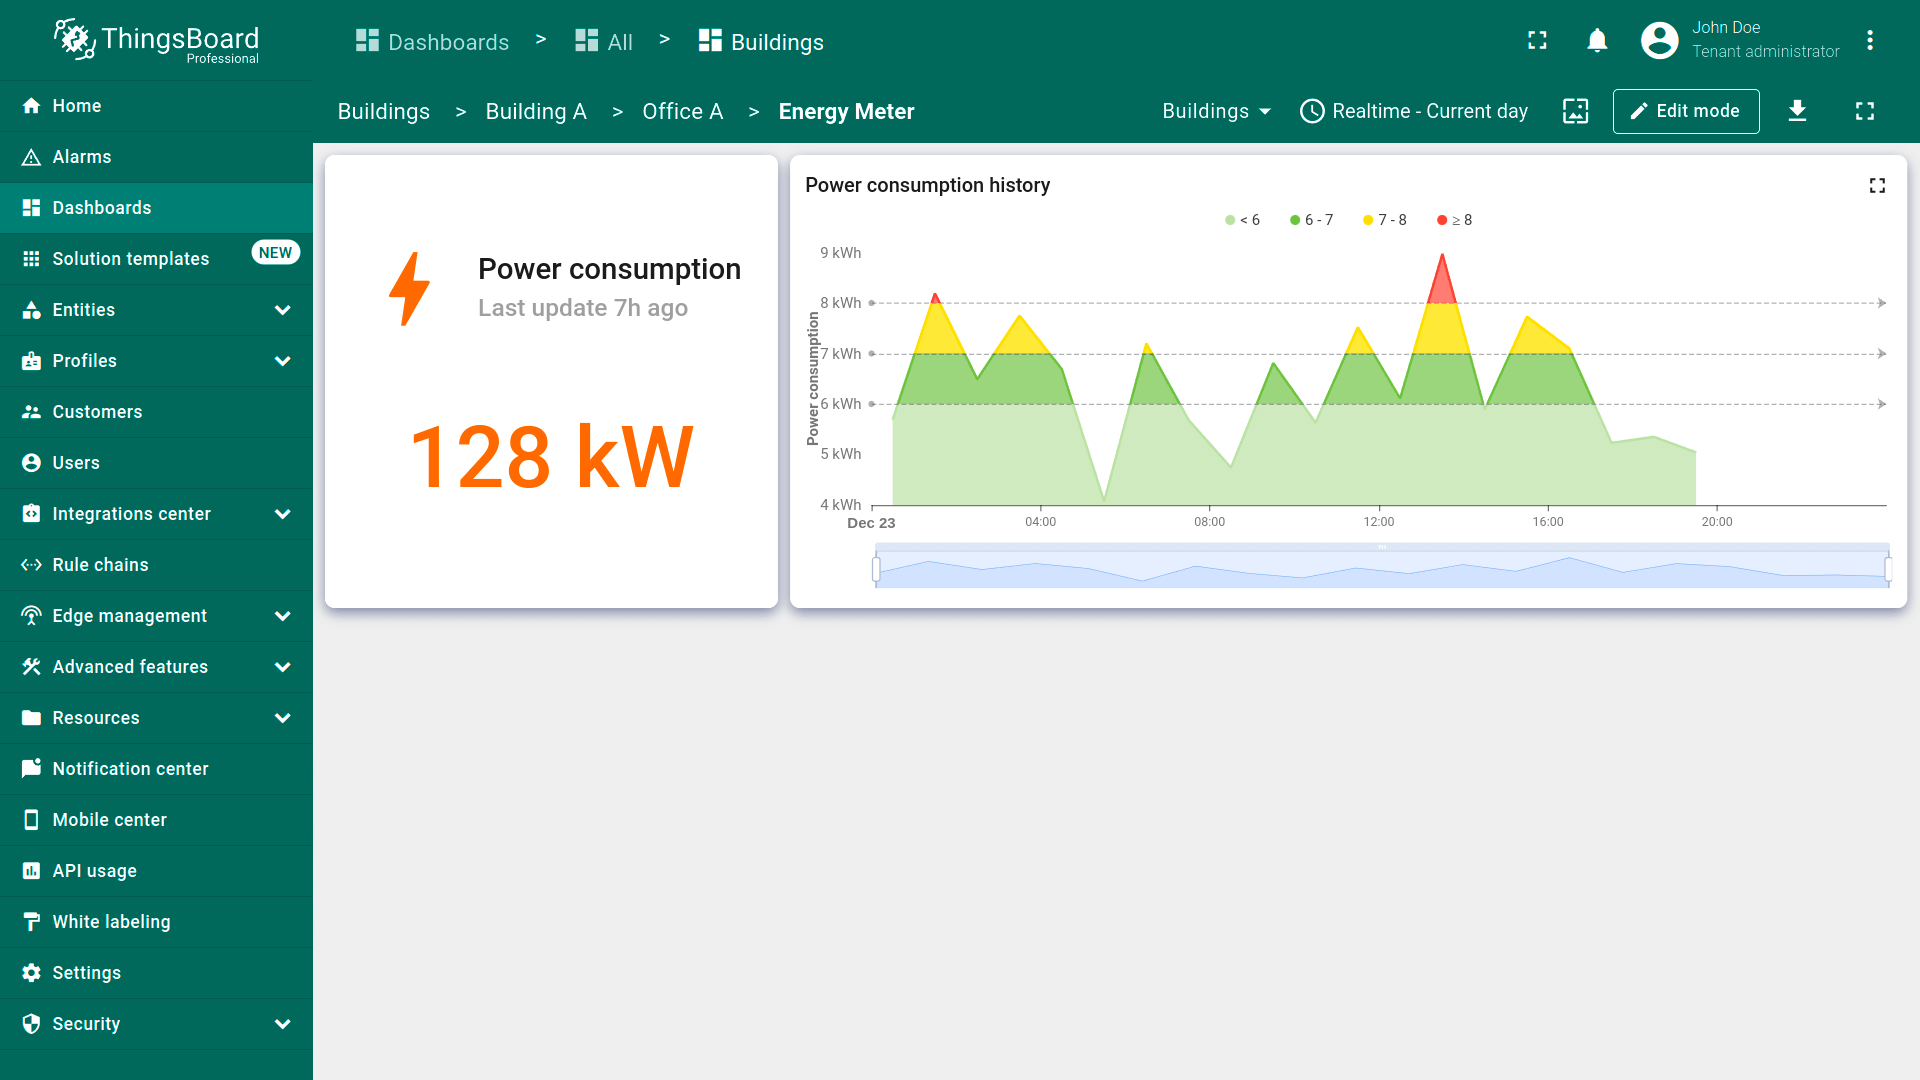
Power consumption chart
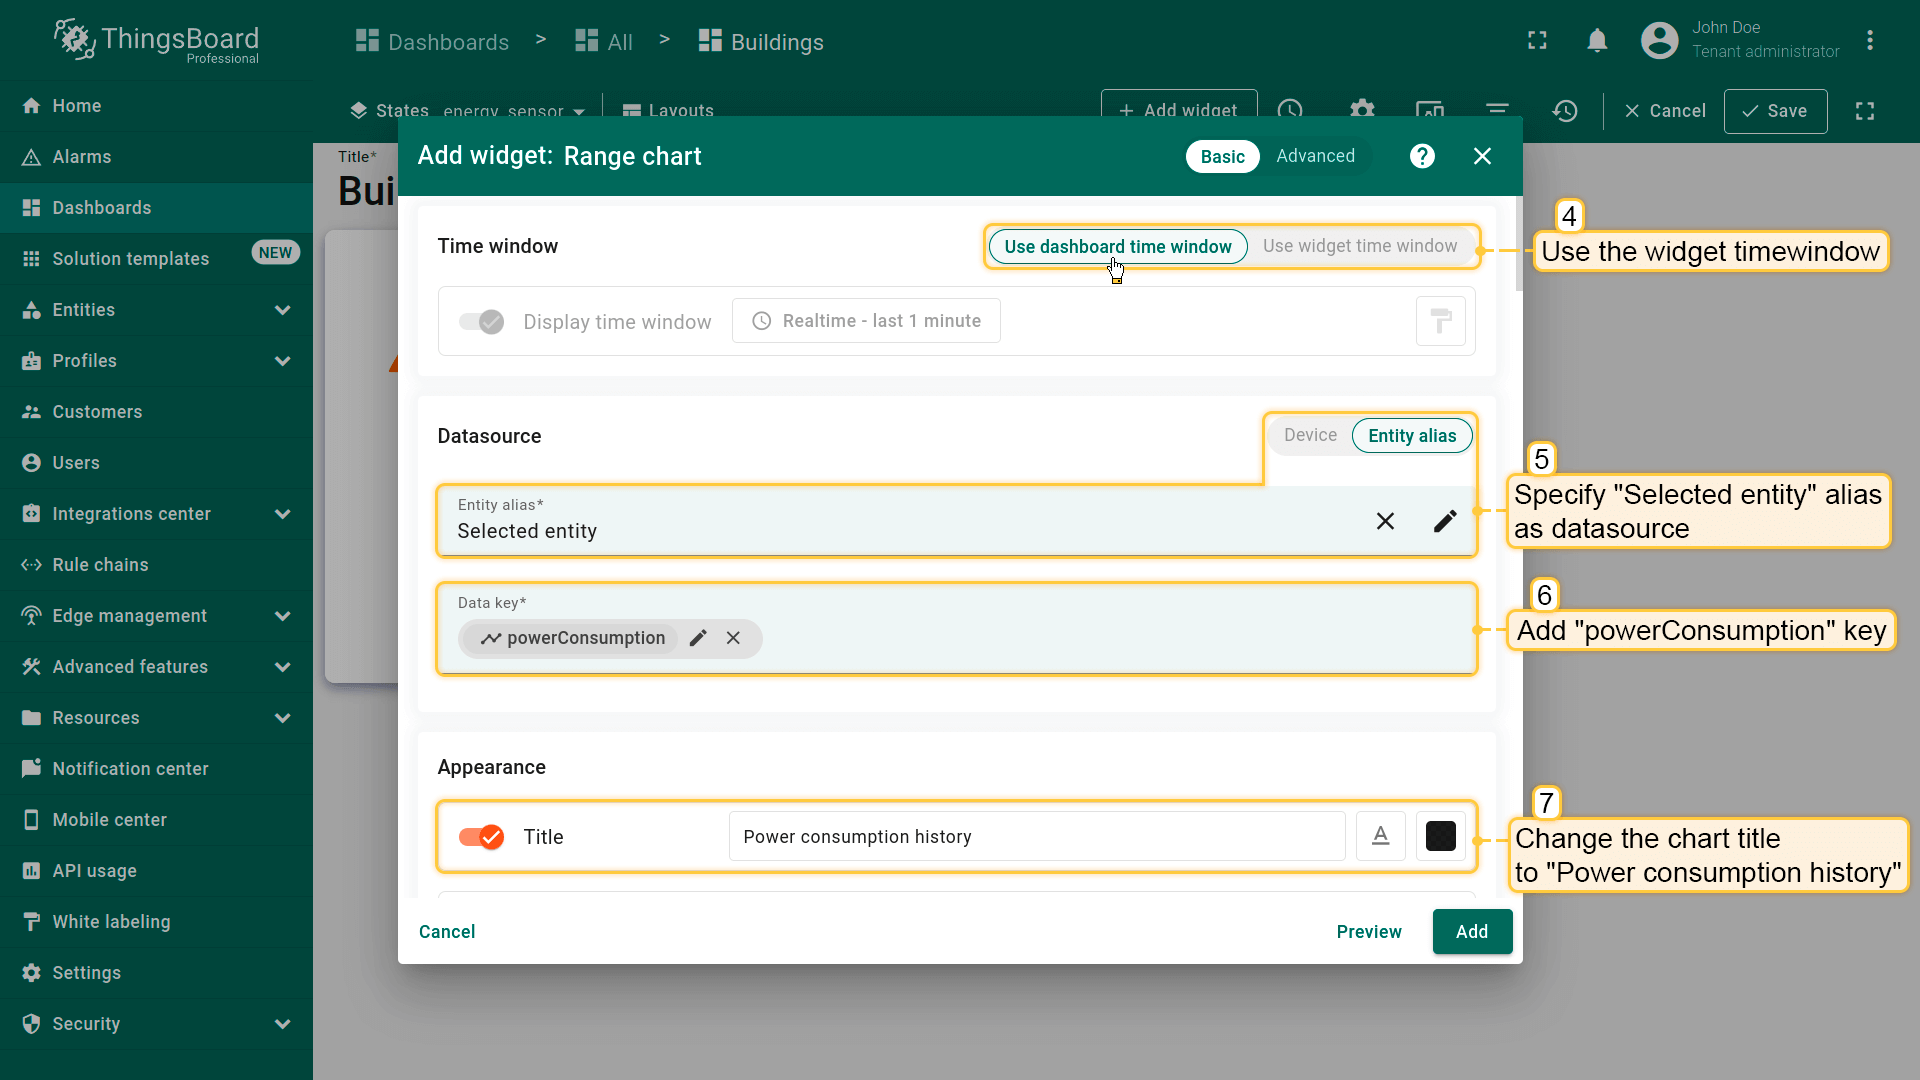
To display historical data on power consumption, we will add the “Range chart” widget. The unique feature of this widget is that changes in data values on the graph are visualized using configurable color ranges.
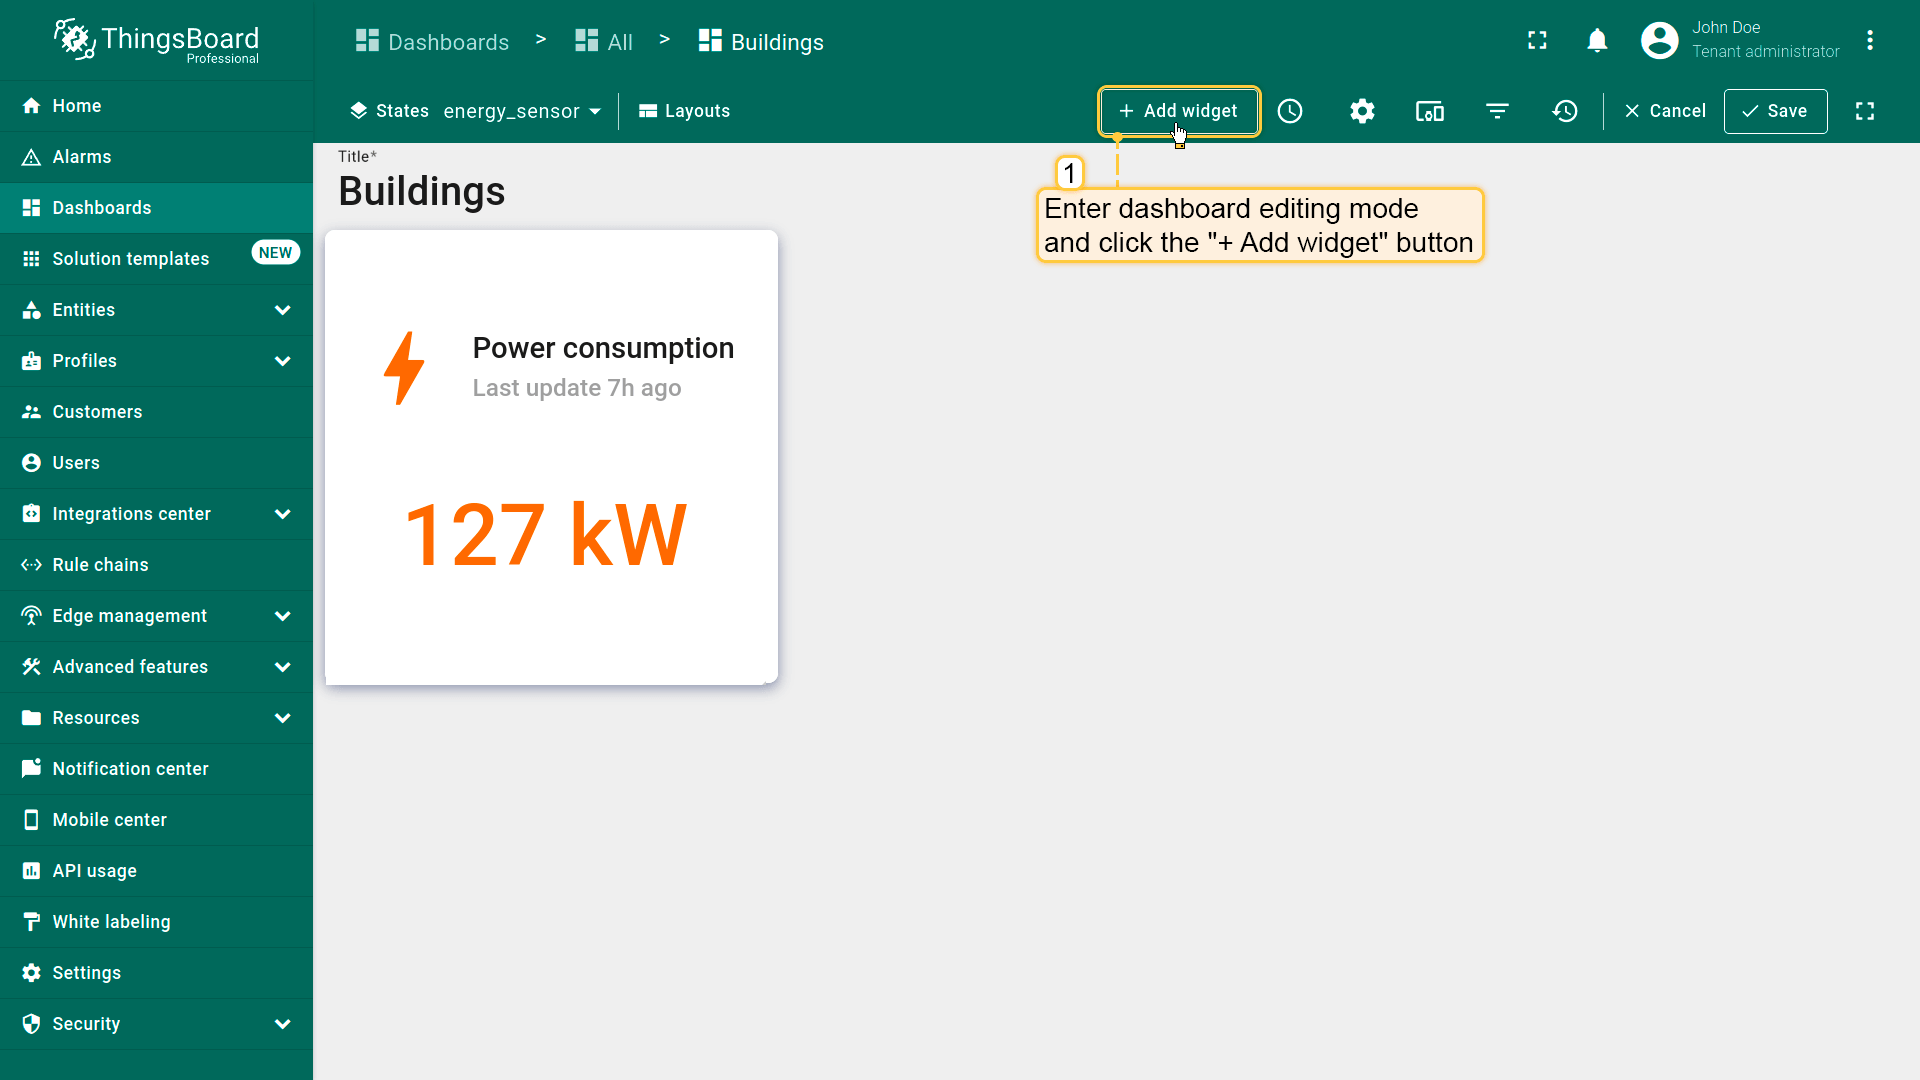
- 进入仪表板编辑模式,点击屏幕顶部的「+ Add widget」按钮;
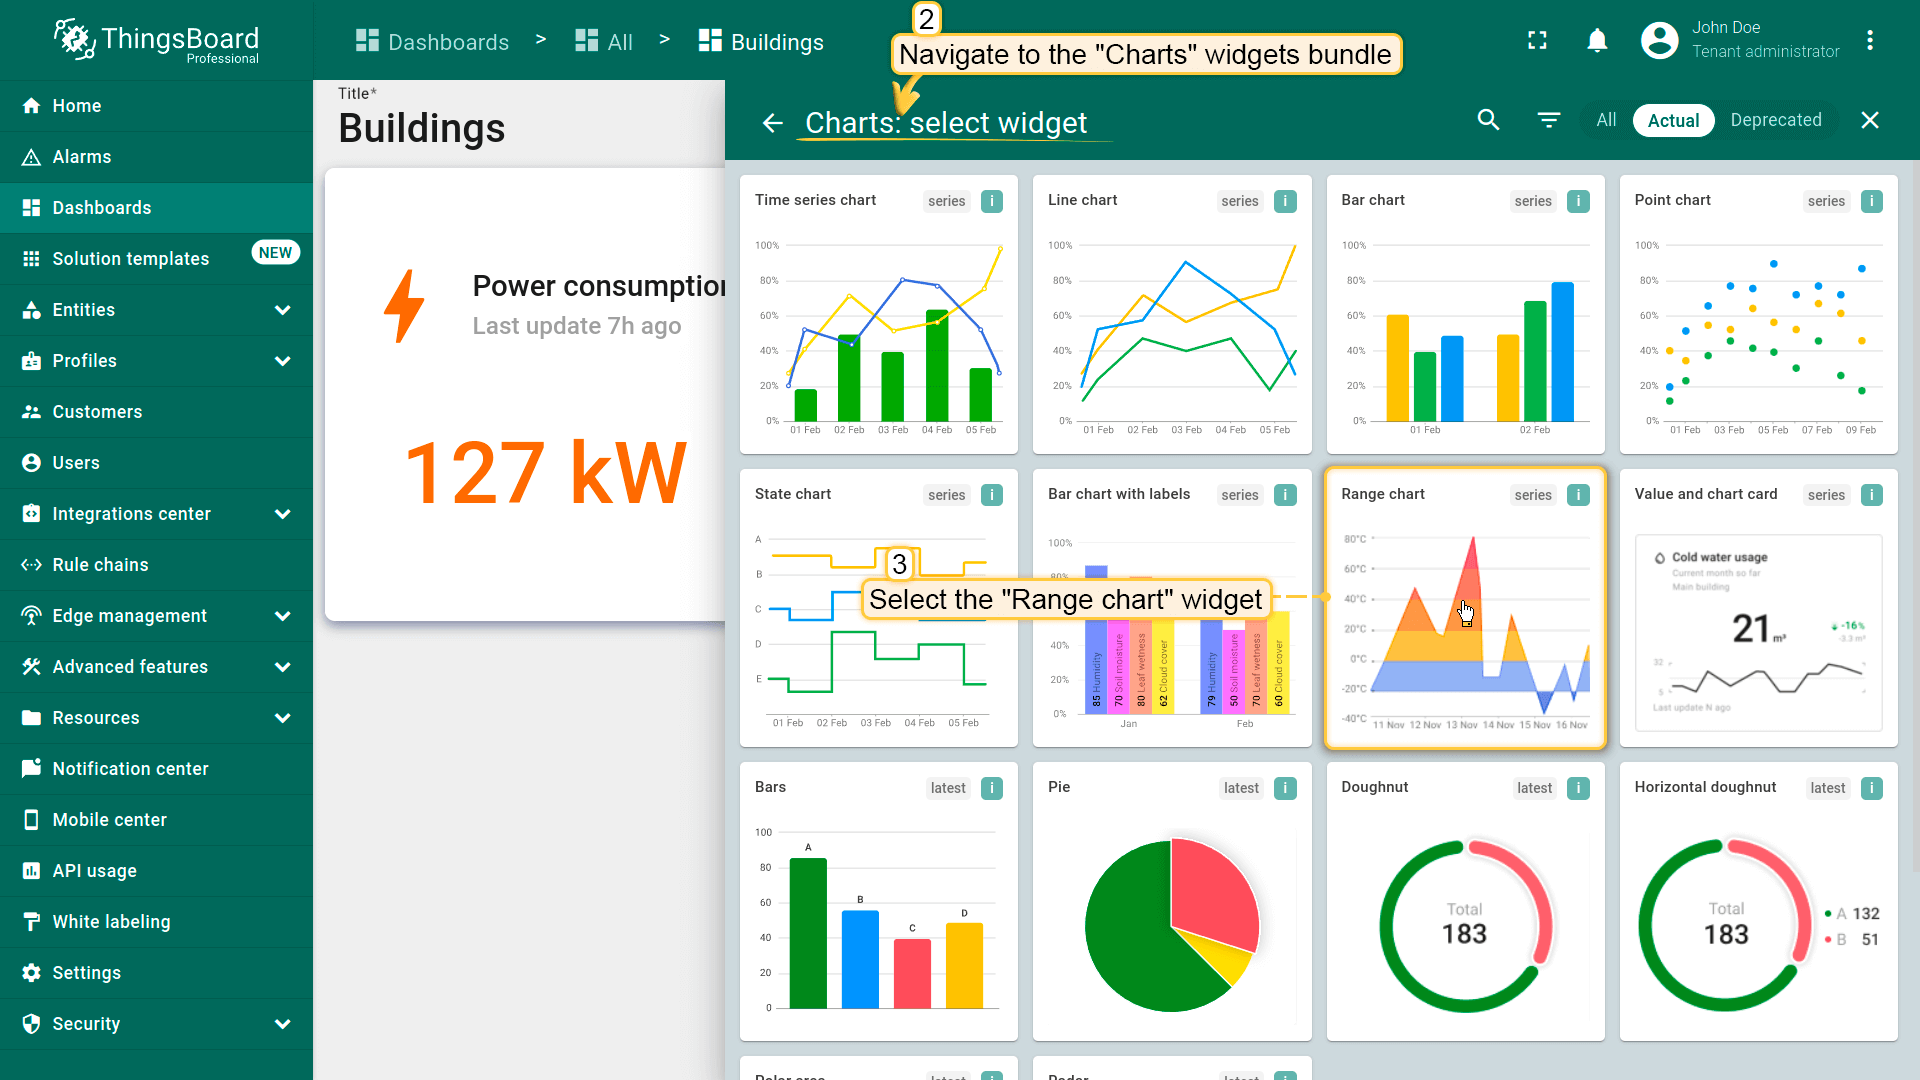
- 选择「Charts」部件包中的「Range chart」部件;
- 使用仪表板时间窗口。将「Selected entity」别名指定为数据源,「powerConsumption」键为数据键。将图表标题改为「Power consumption history」;
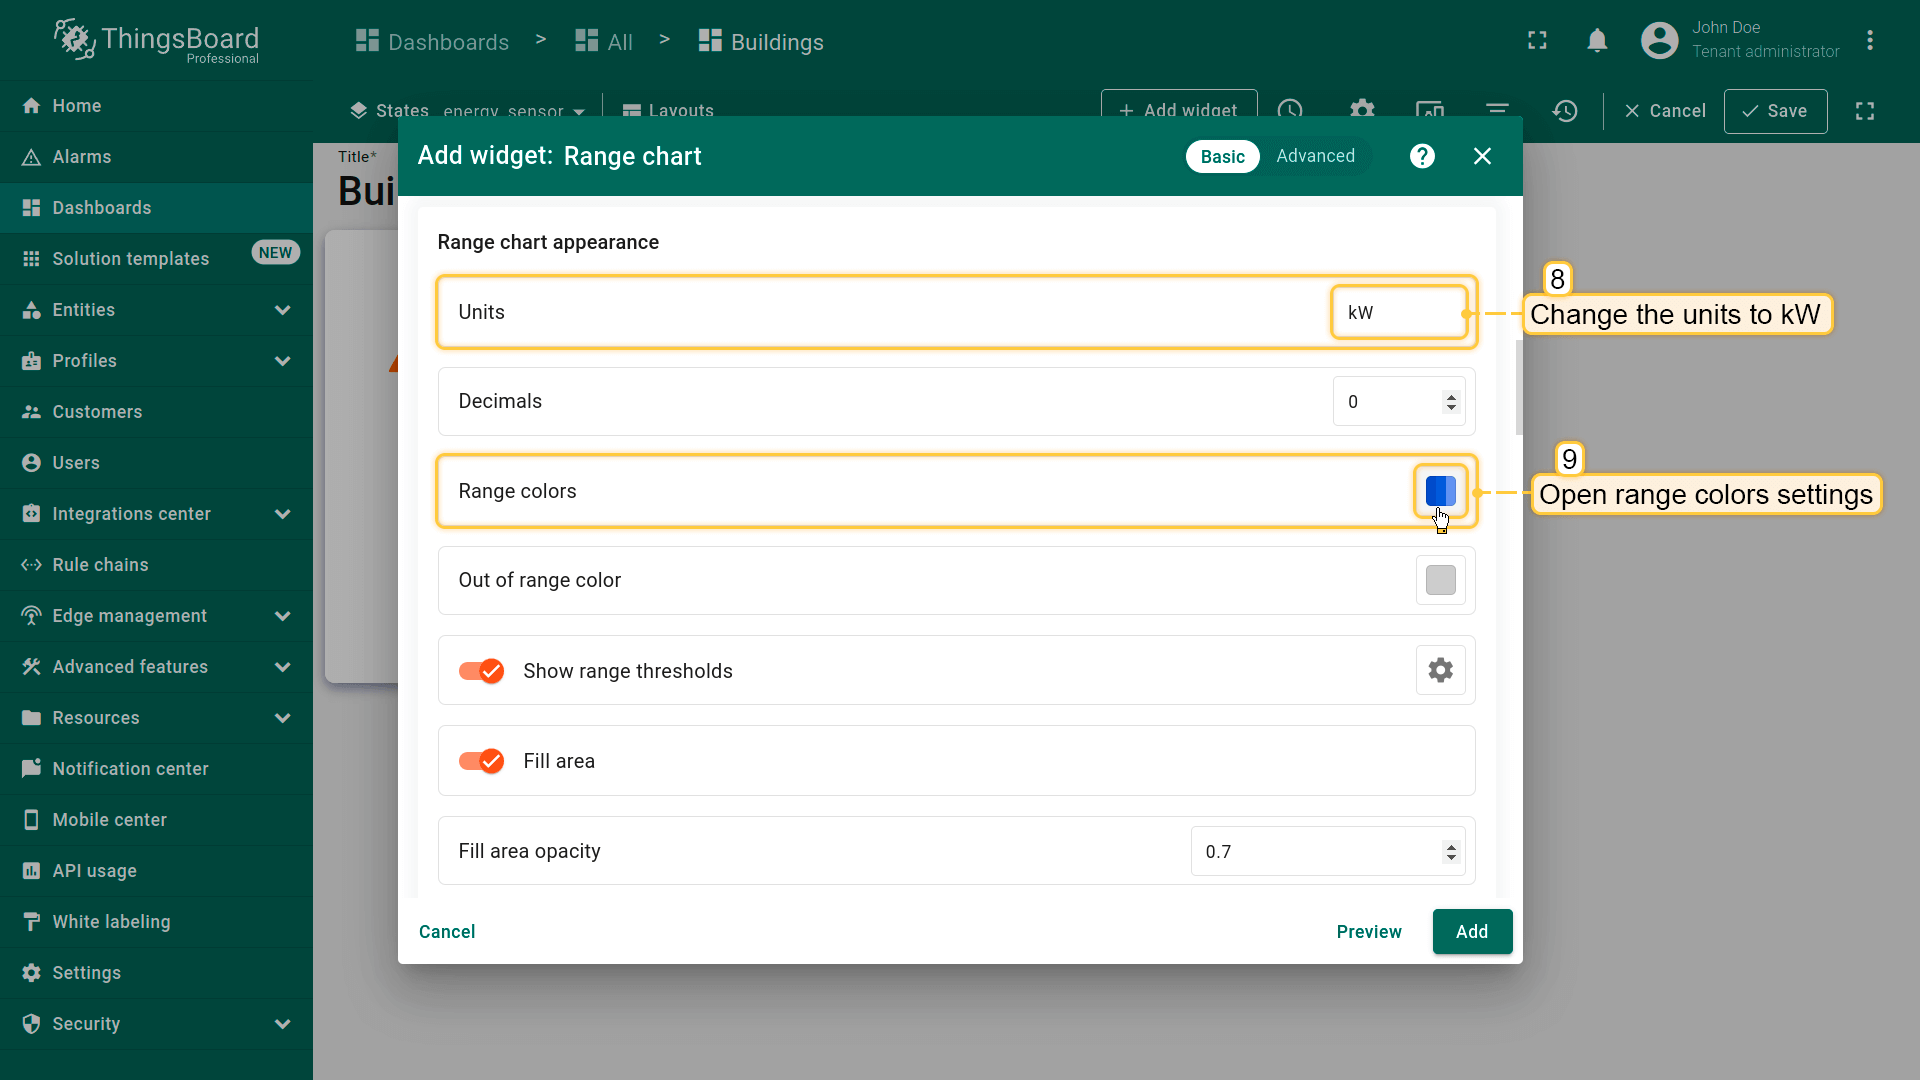
- 将单位改为 kW。然后打开范围颜色设置;
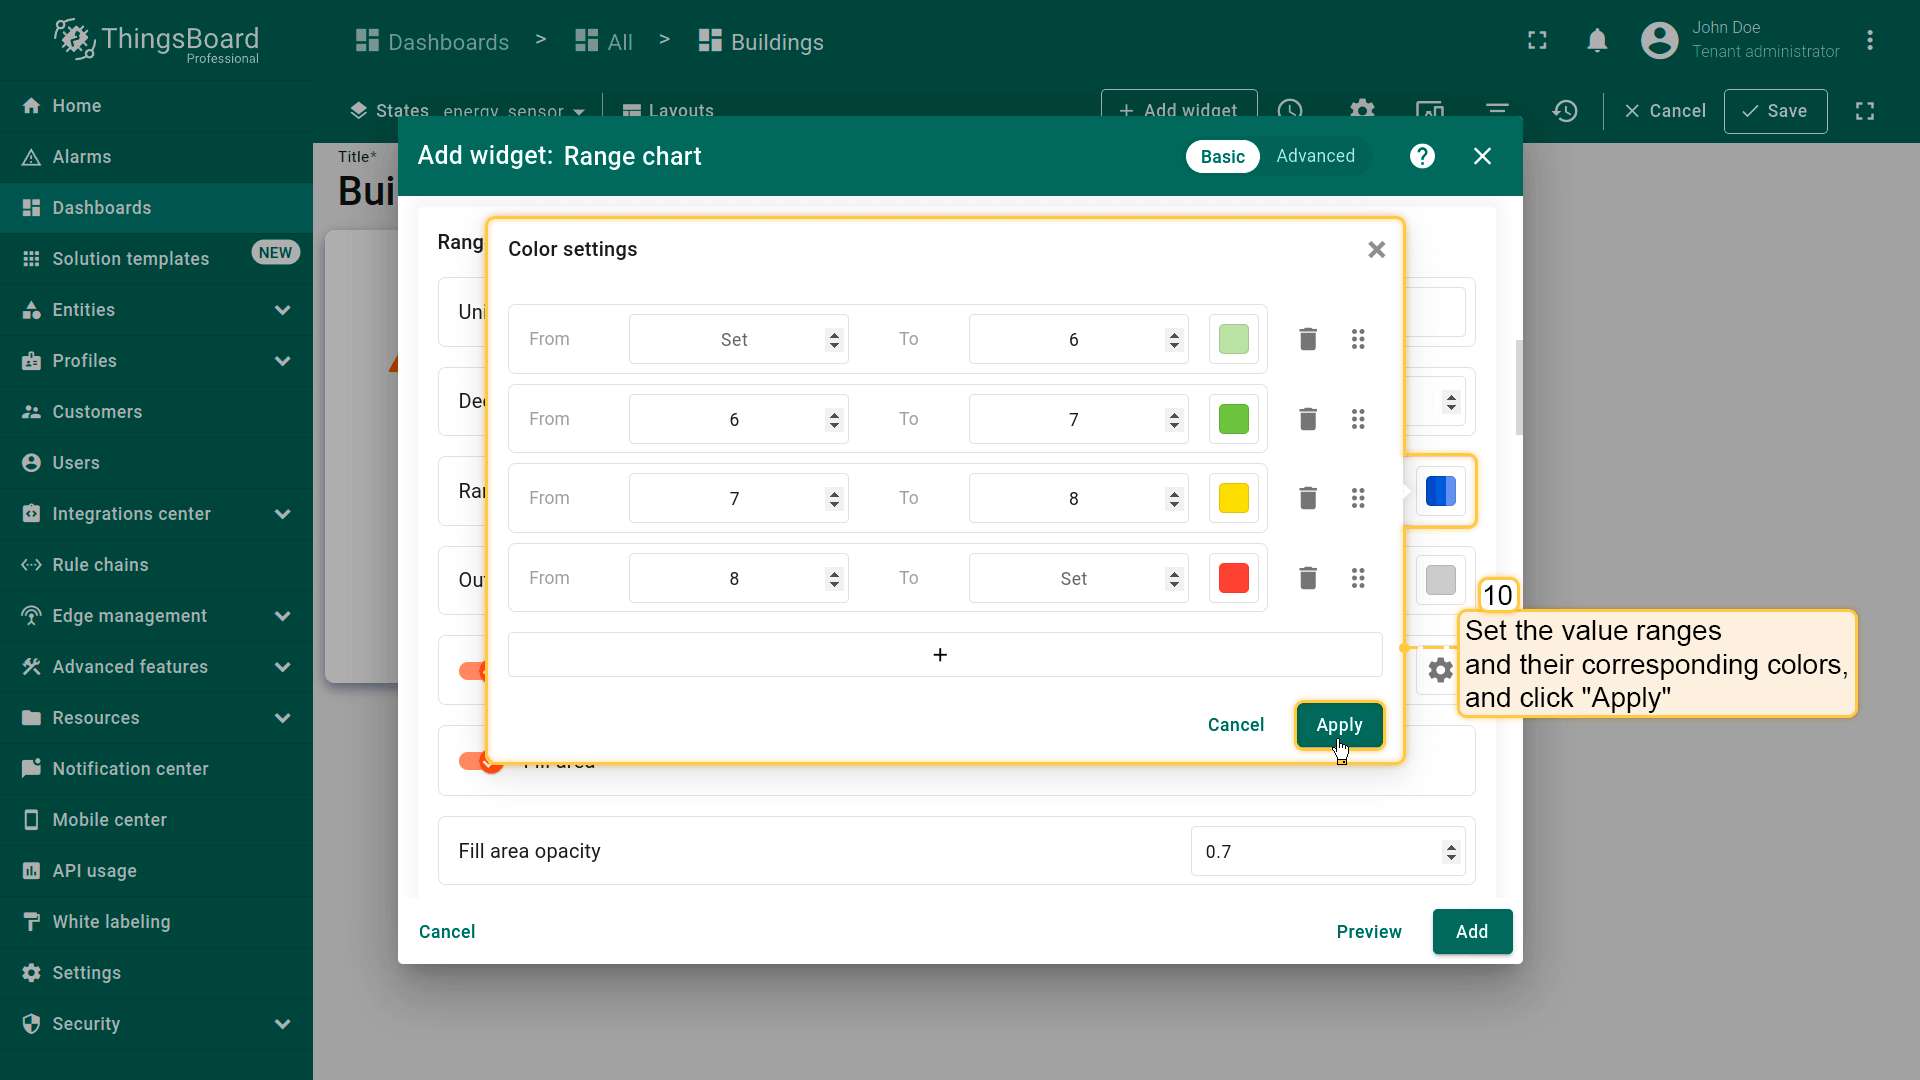
- 图表线条颜色根据数值所属范围着色,便于通过颜色变化快速了解数据。设置取值范围及对应颜色。点击「Apply」;
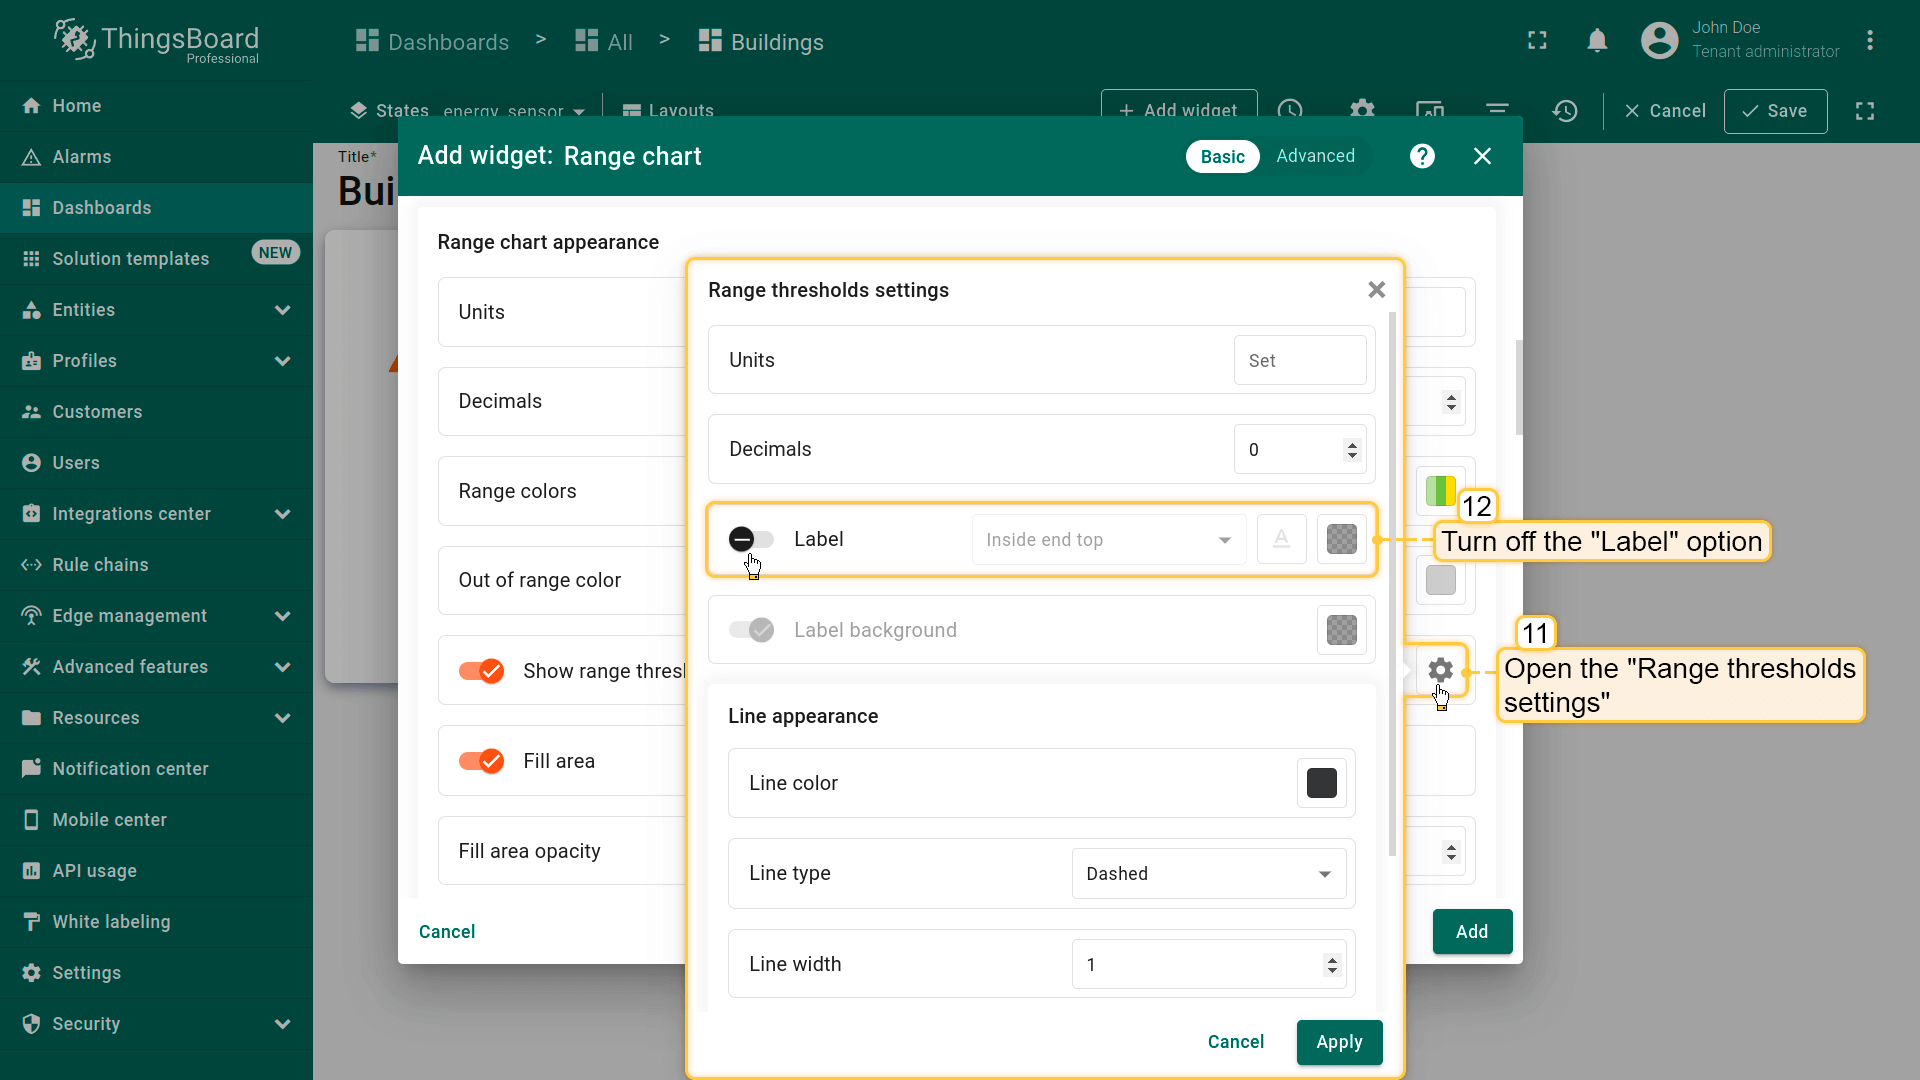
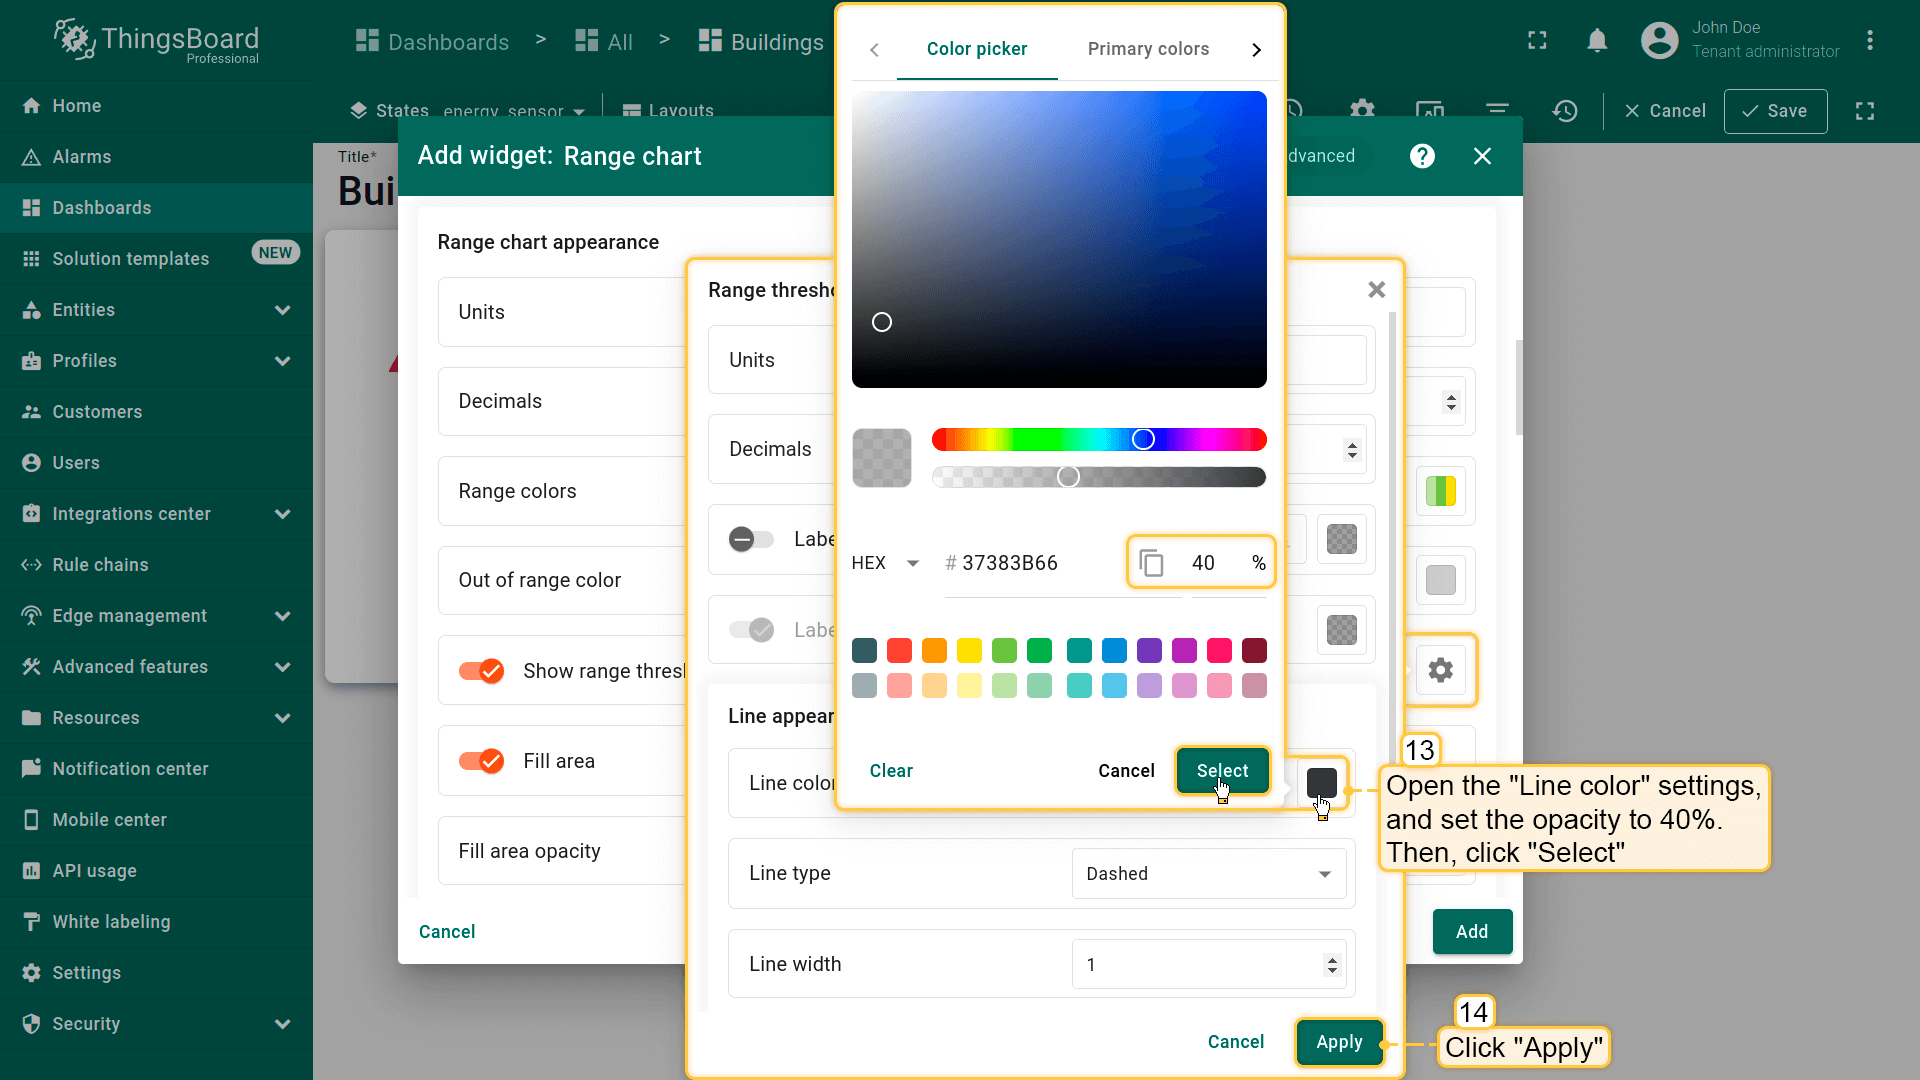
- 进入「Range thresholds settings」,关闭「Label」选项;
- 打开「Line color」设置,将不透明度设为 40%。应用更改;
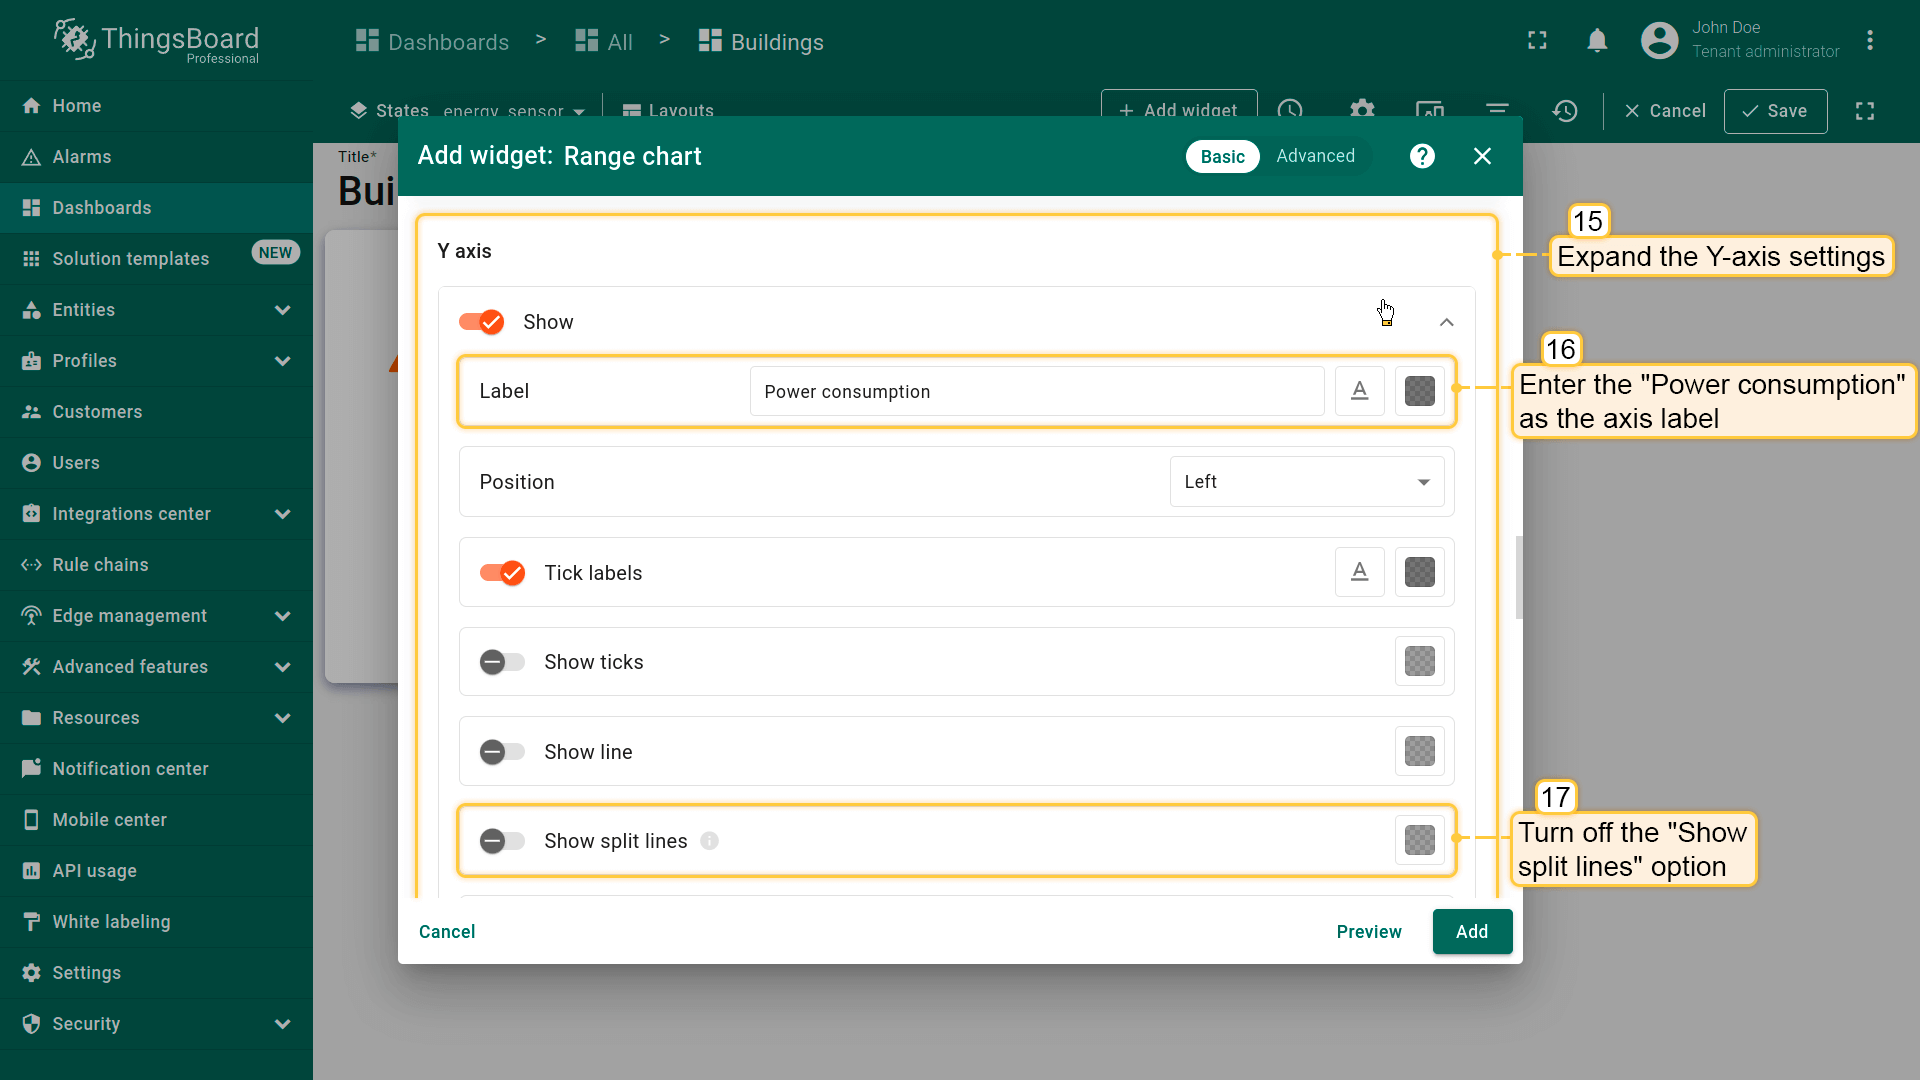
- 展开 Y 轴设置。输入「Power consumption」作为轴标签,关闭「Show split lines」选项;
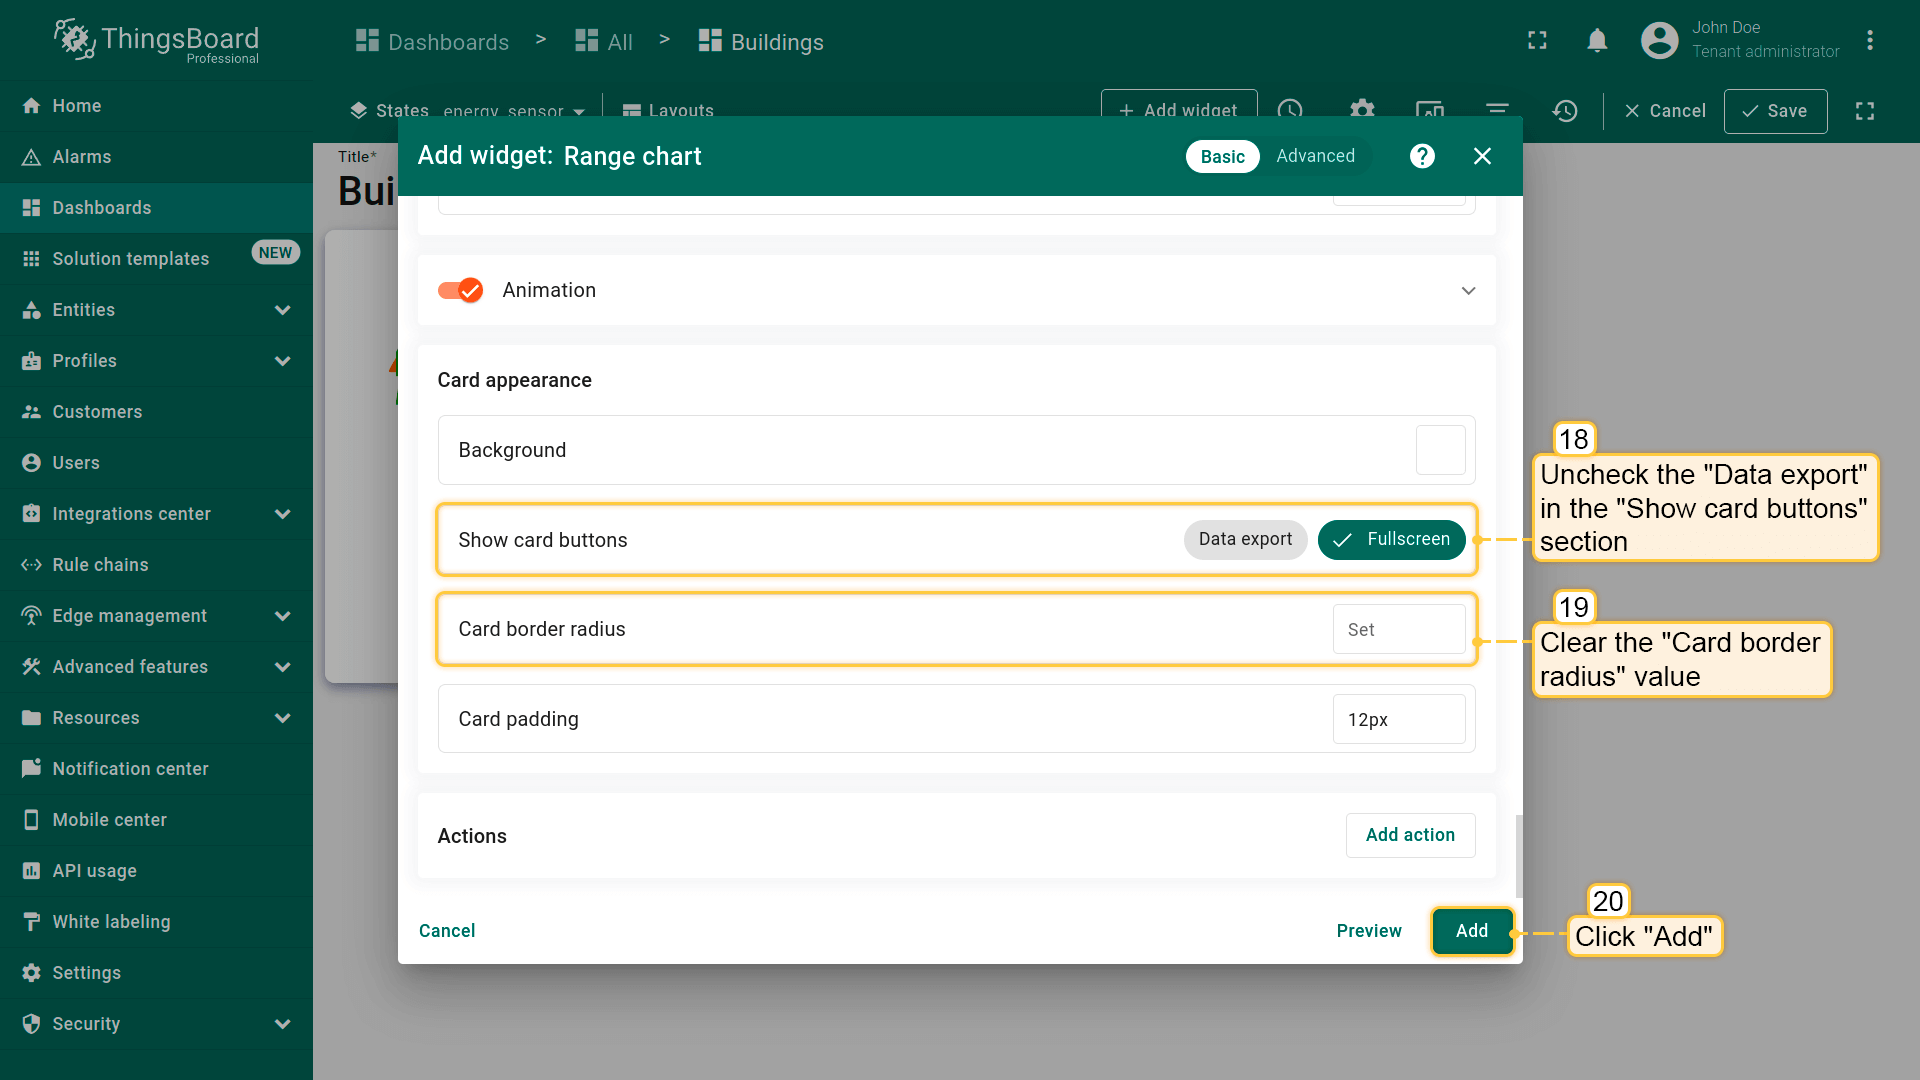
- 取消勾选「Show card buttons」中的「Data export」,移除「Card border radius」的值。点击「Add」完成范围图表部件的添加;
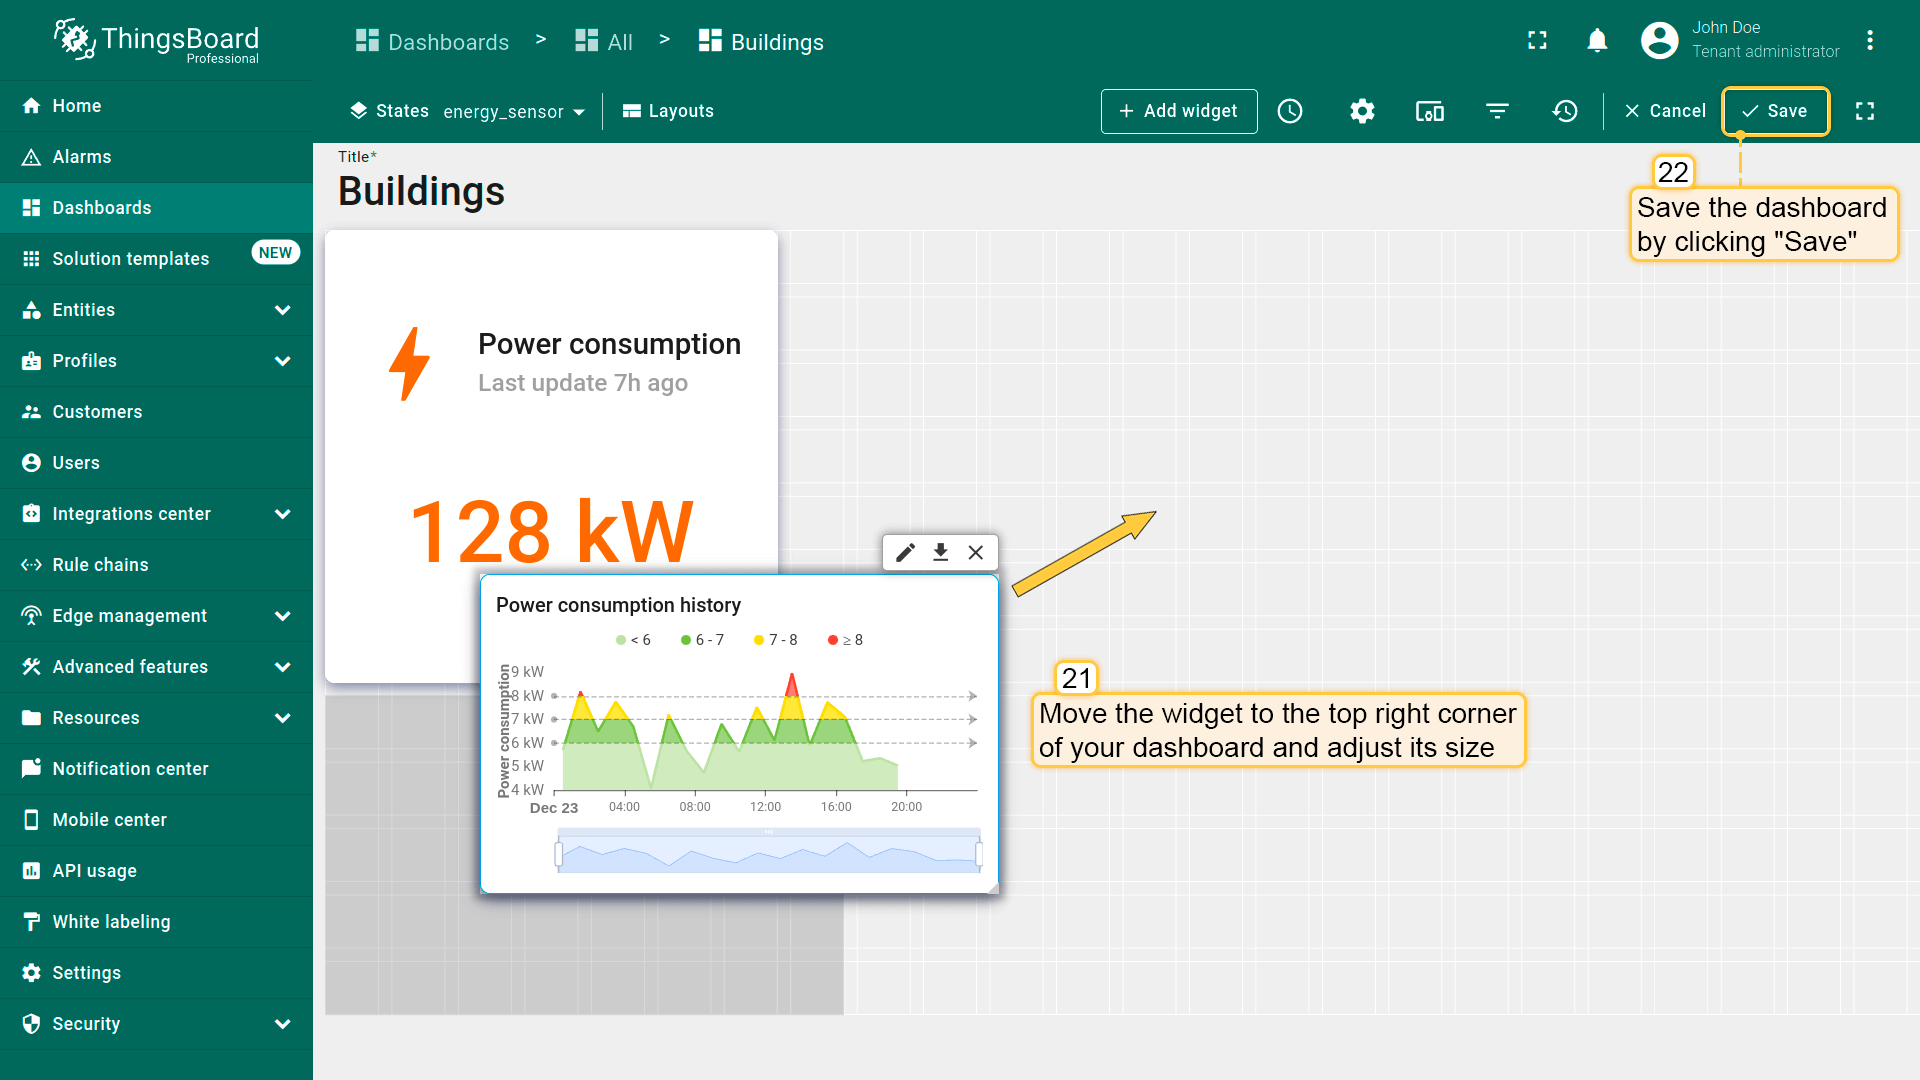
- 已添加「Power consumption history」部件。将其放在「Power consumption」部件右侧并调整大小。保存仪表板以应用更改。
Now you can monitor the total energy consumption for the current day and track historical data on hourly energy consumption.
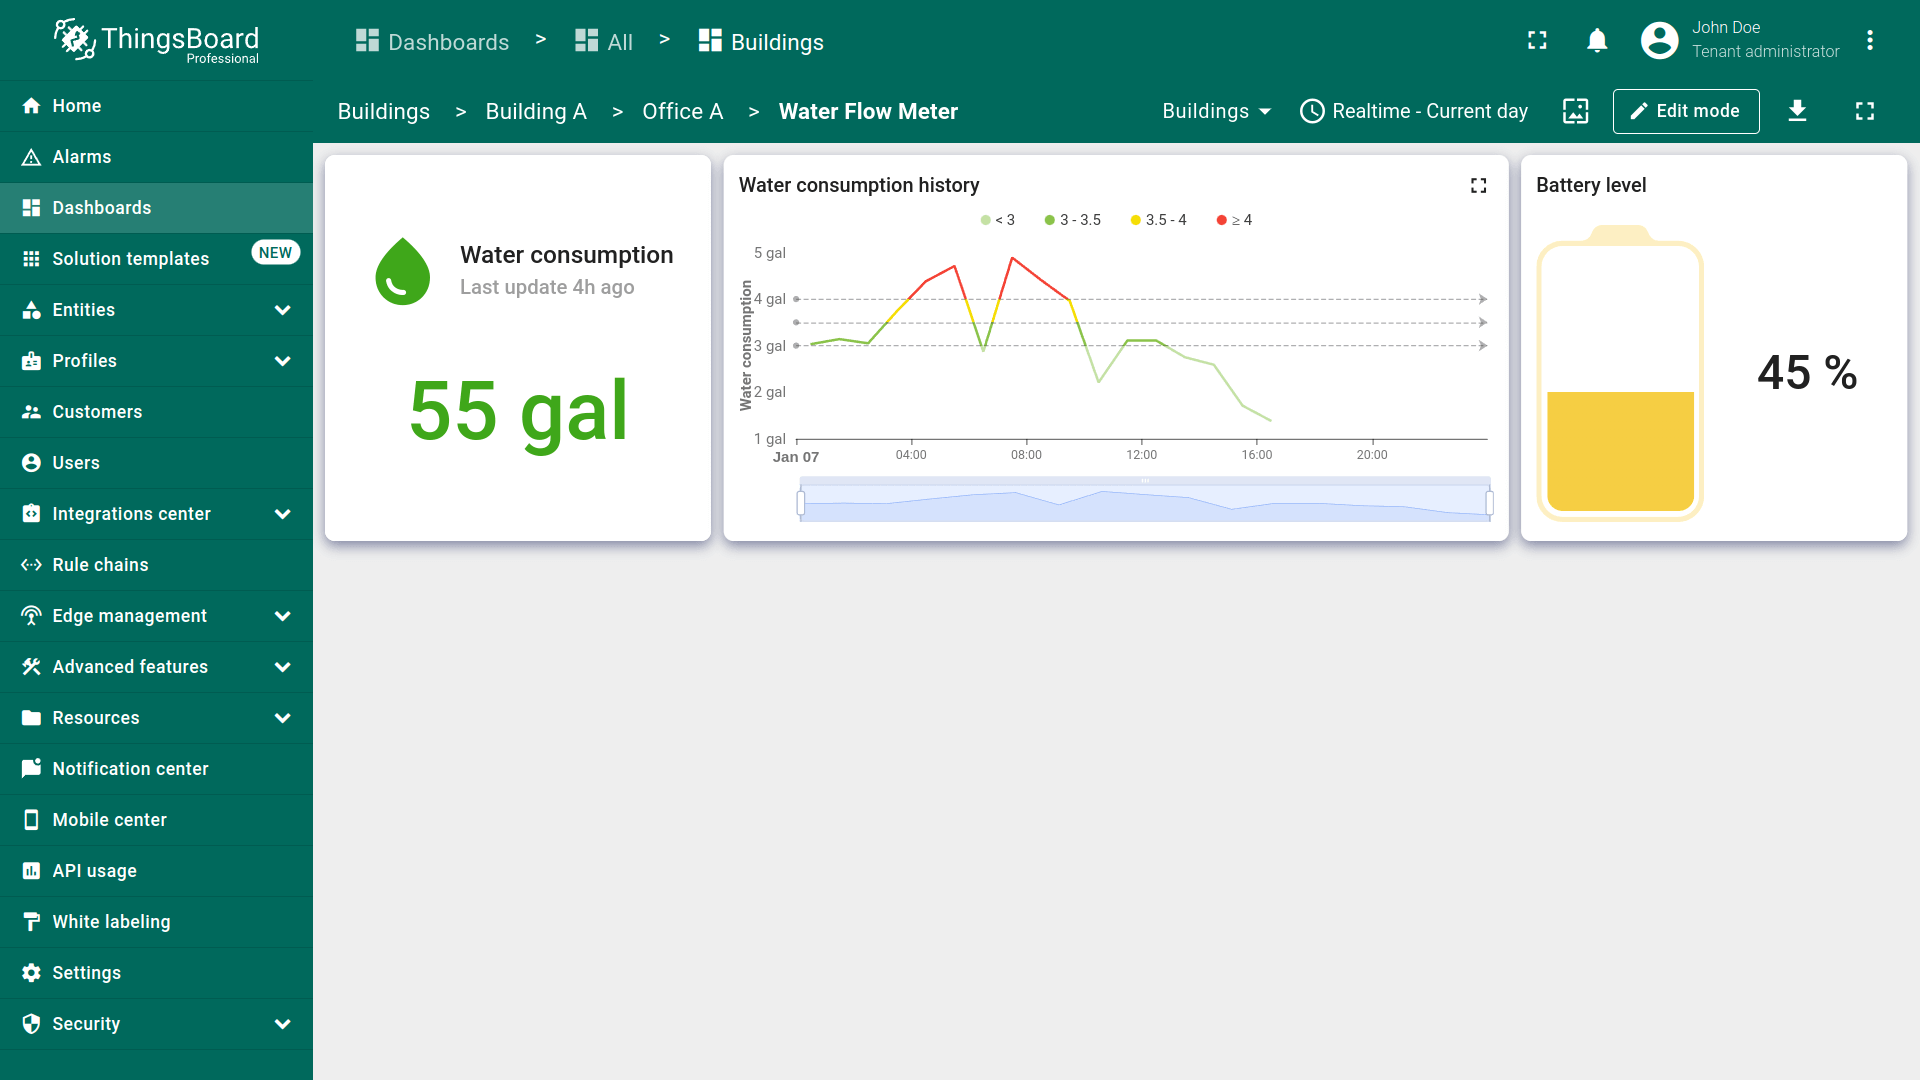
Configuring water_sensor state
Finally, we will configure the state for the “Water Flow Meter” device. This will include a card widget to display the total water consumption for the current day, a chart widget to show historical data on hourly water consumption, and a battery level widget for the device.
Current water consumption
If you need to display specific data but cannot find a suitable widget in the available bundles, you can customize any widget to fit your needs. Let’s take the “Flow rate card” widget from the “Industrial widgets” bundle as an example and configure it to display water consumption.
- 点击「办公室传感器列表」中的「Water Flow Meter」设备以进入其状态;
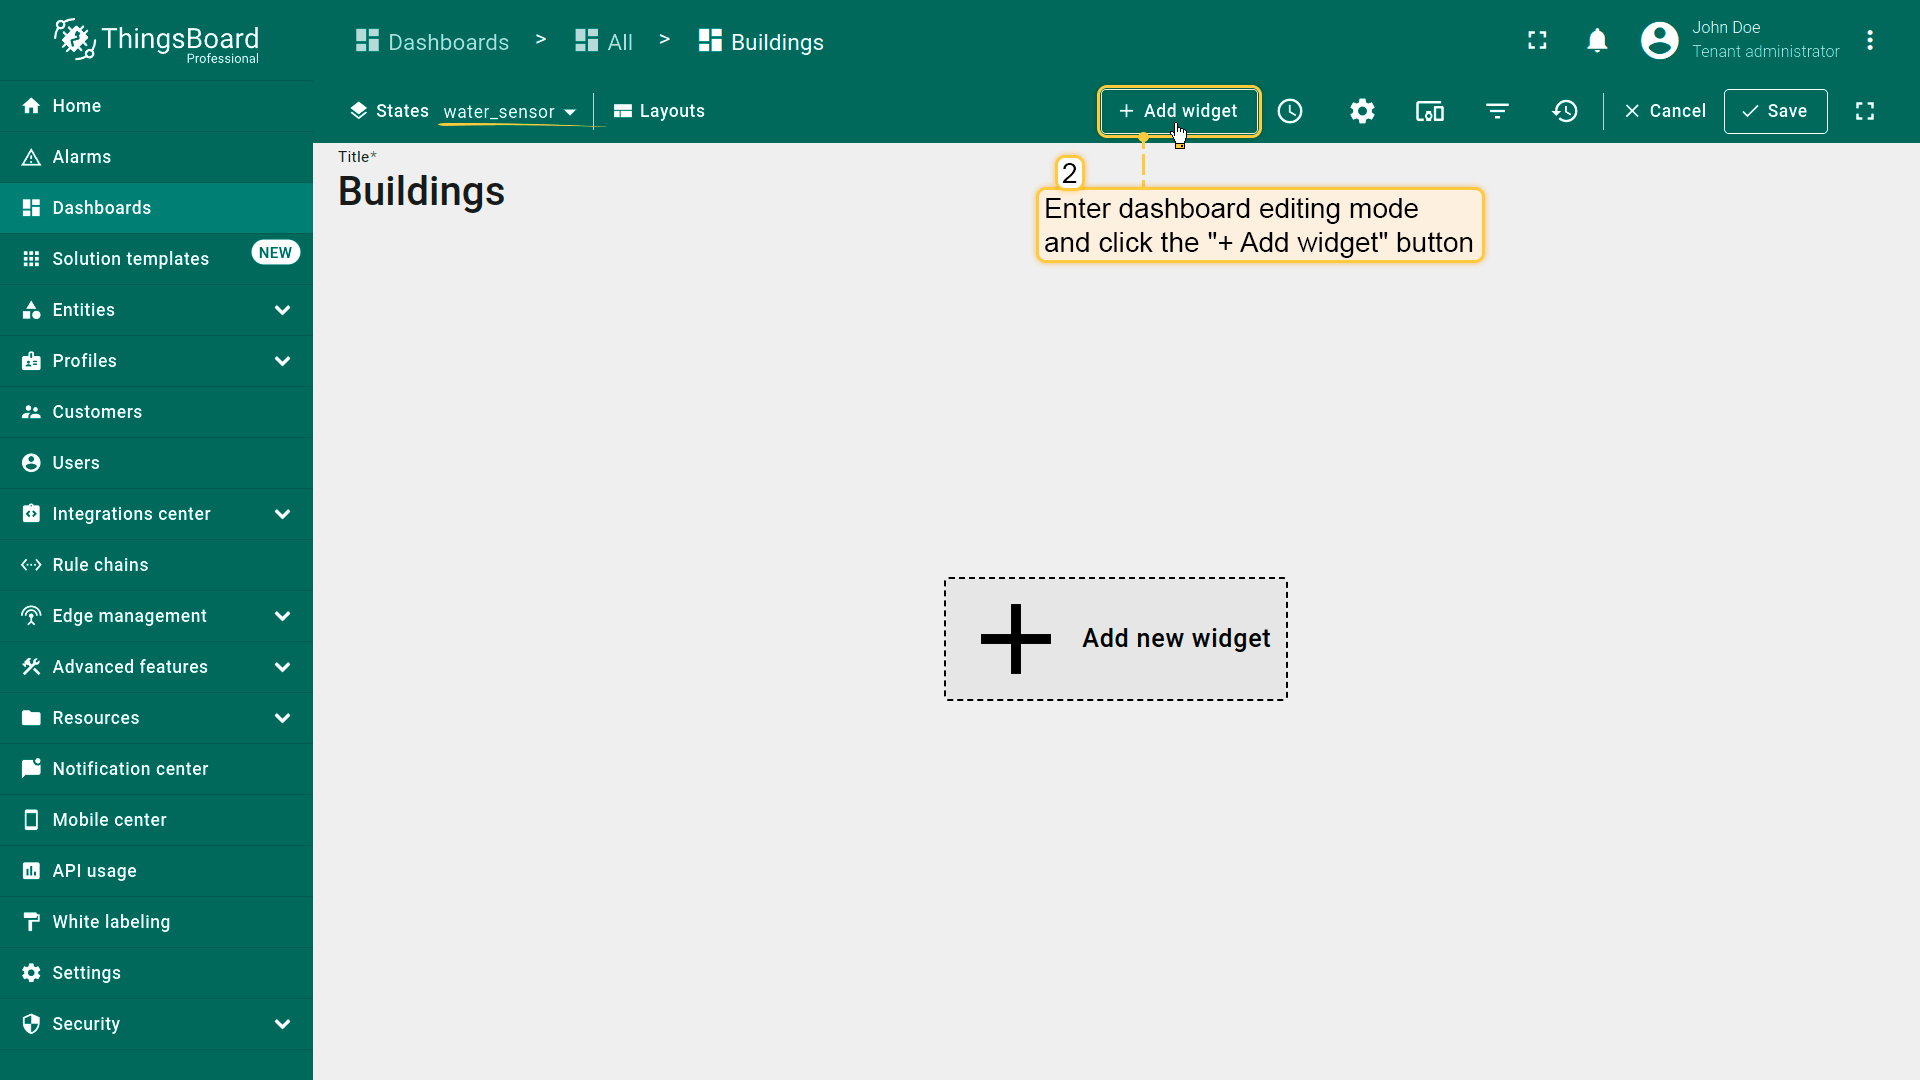
- 进入仪表板编辑模式,点击「+ Add widget」按钮;
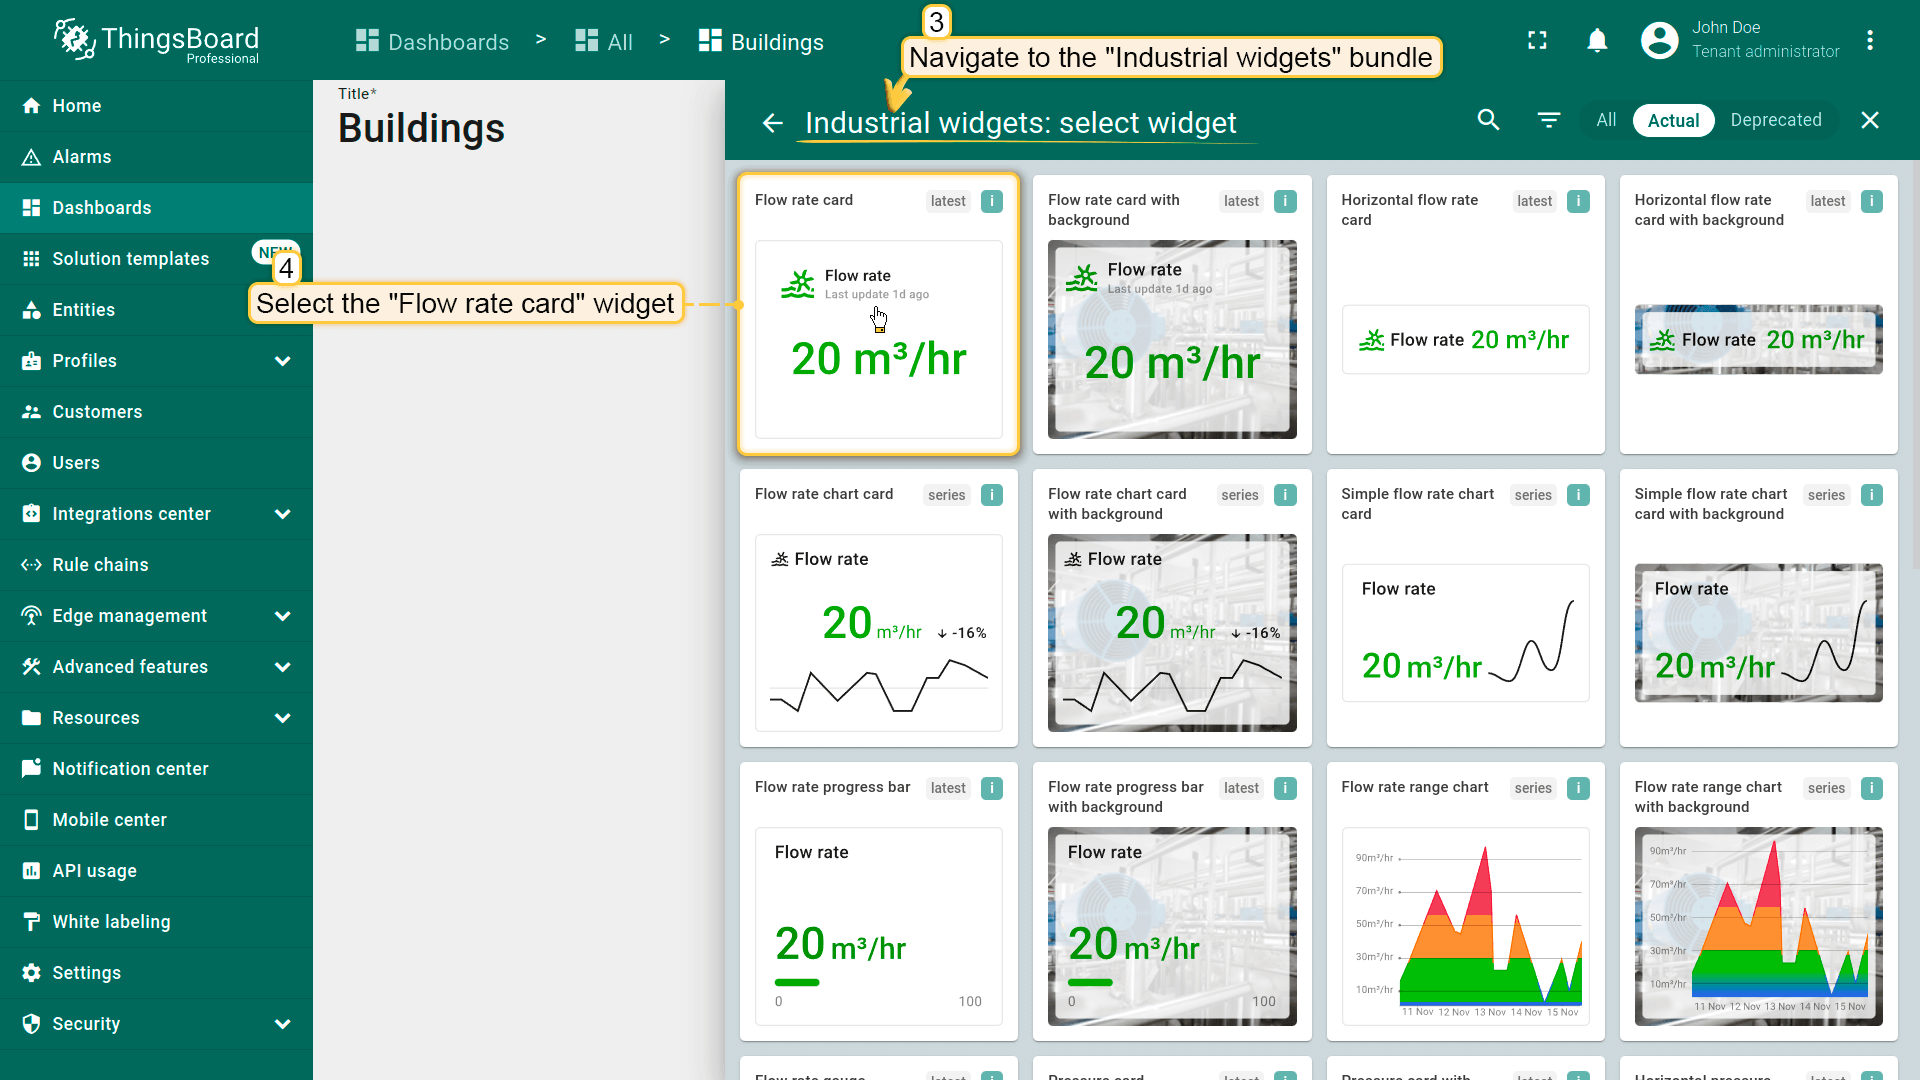
- 进入「Industrial widgets」包并选择任一部件,例如「Flow rate card」;
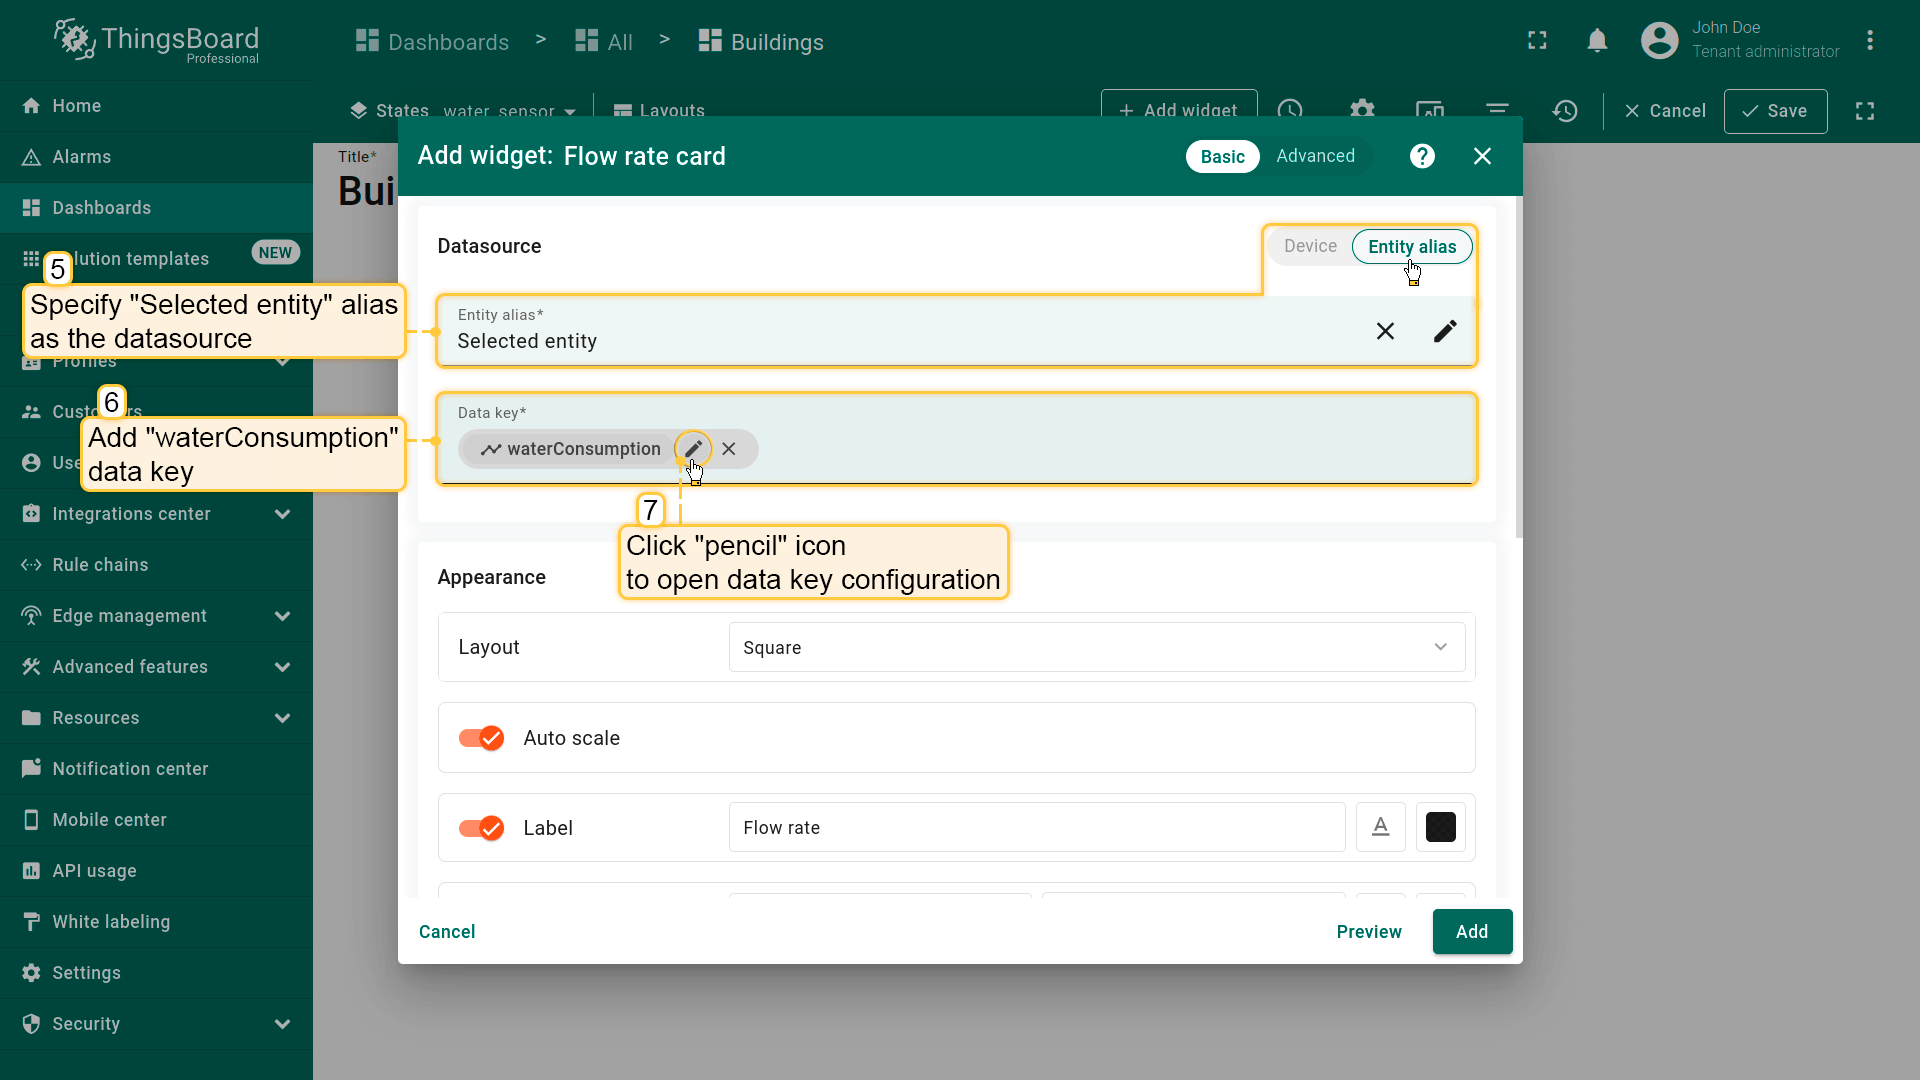
- 将「Selected entity」别名指定为数据源。添加「waterConsumption」键作为数据键,点击「铅笔」图标打开其数据键配置;
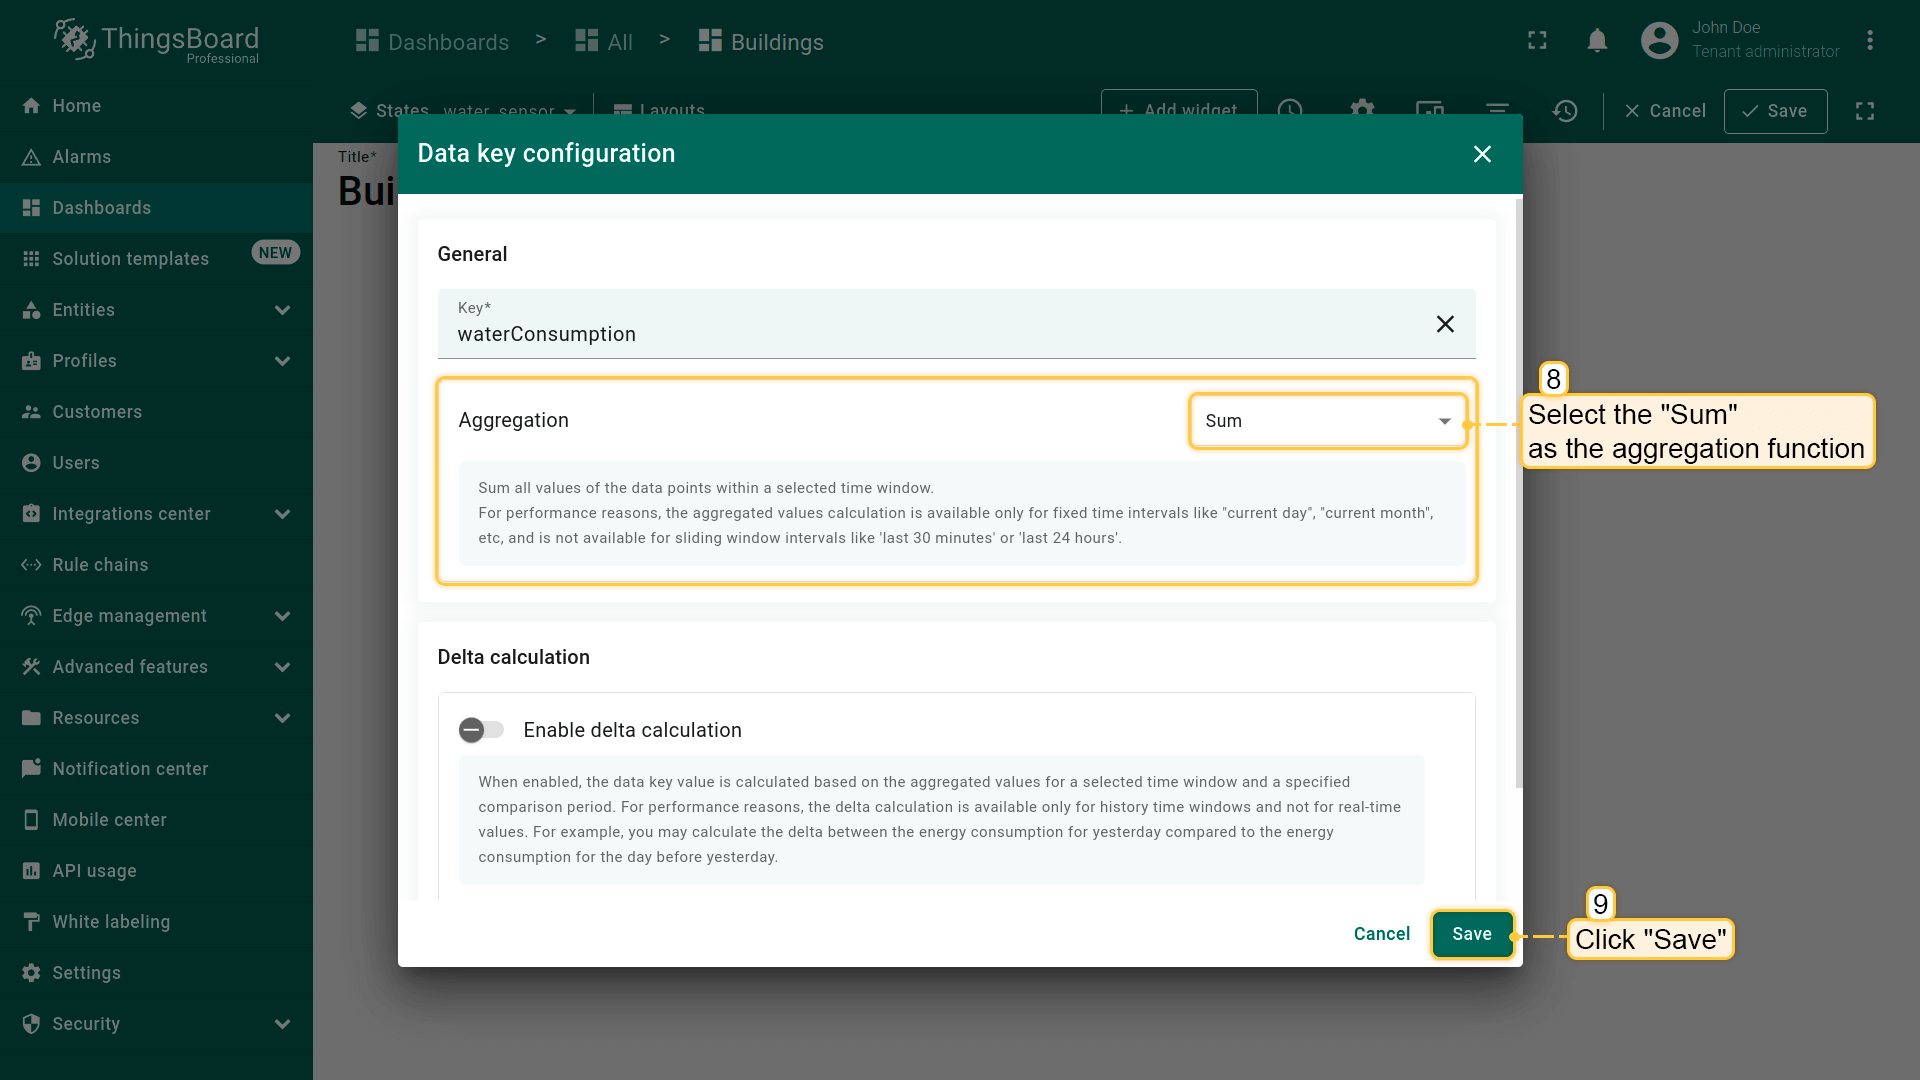
- 选择「Sum」作为聚合函数。点击「Save」;
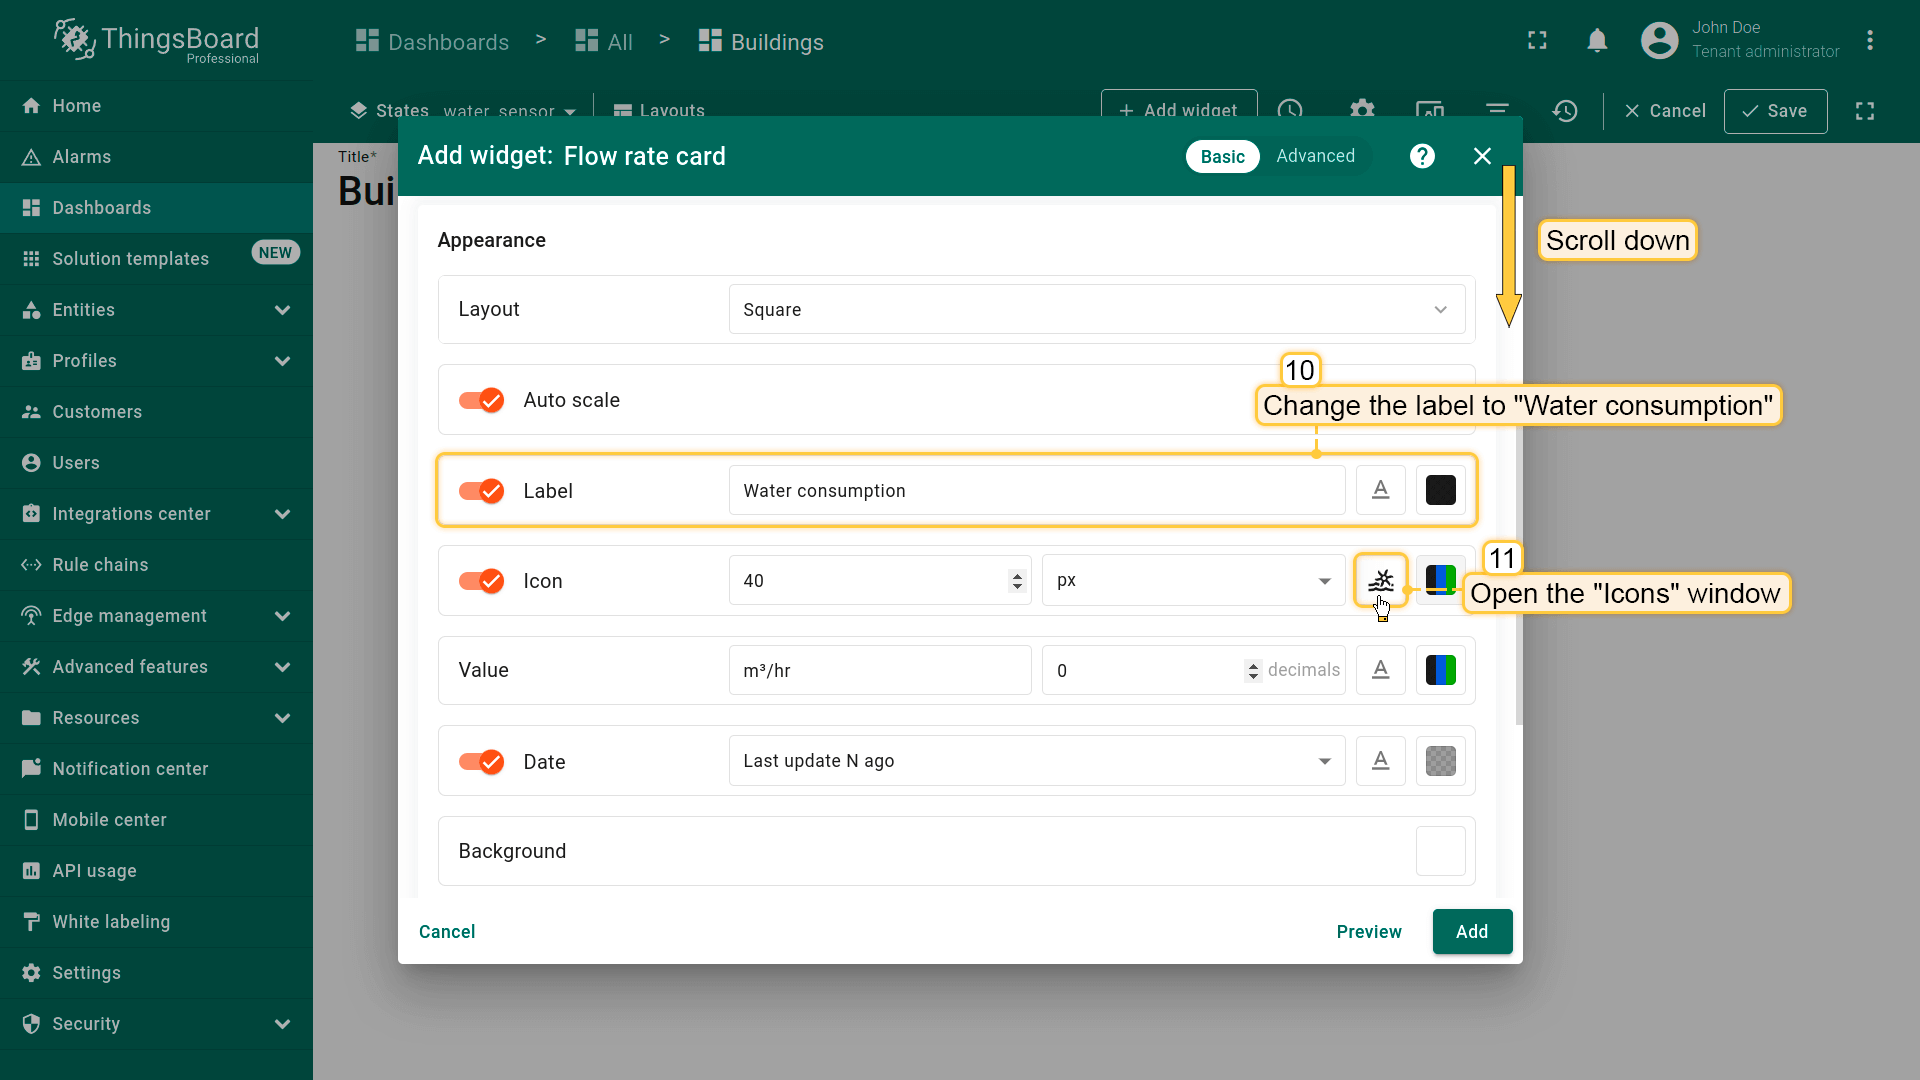
- 使用仪表板时间窗口。将部件标签改为「Water consumption」。修改部件图标以更好地匹配显示的数据类型。打开「Icons」窗口;
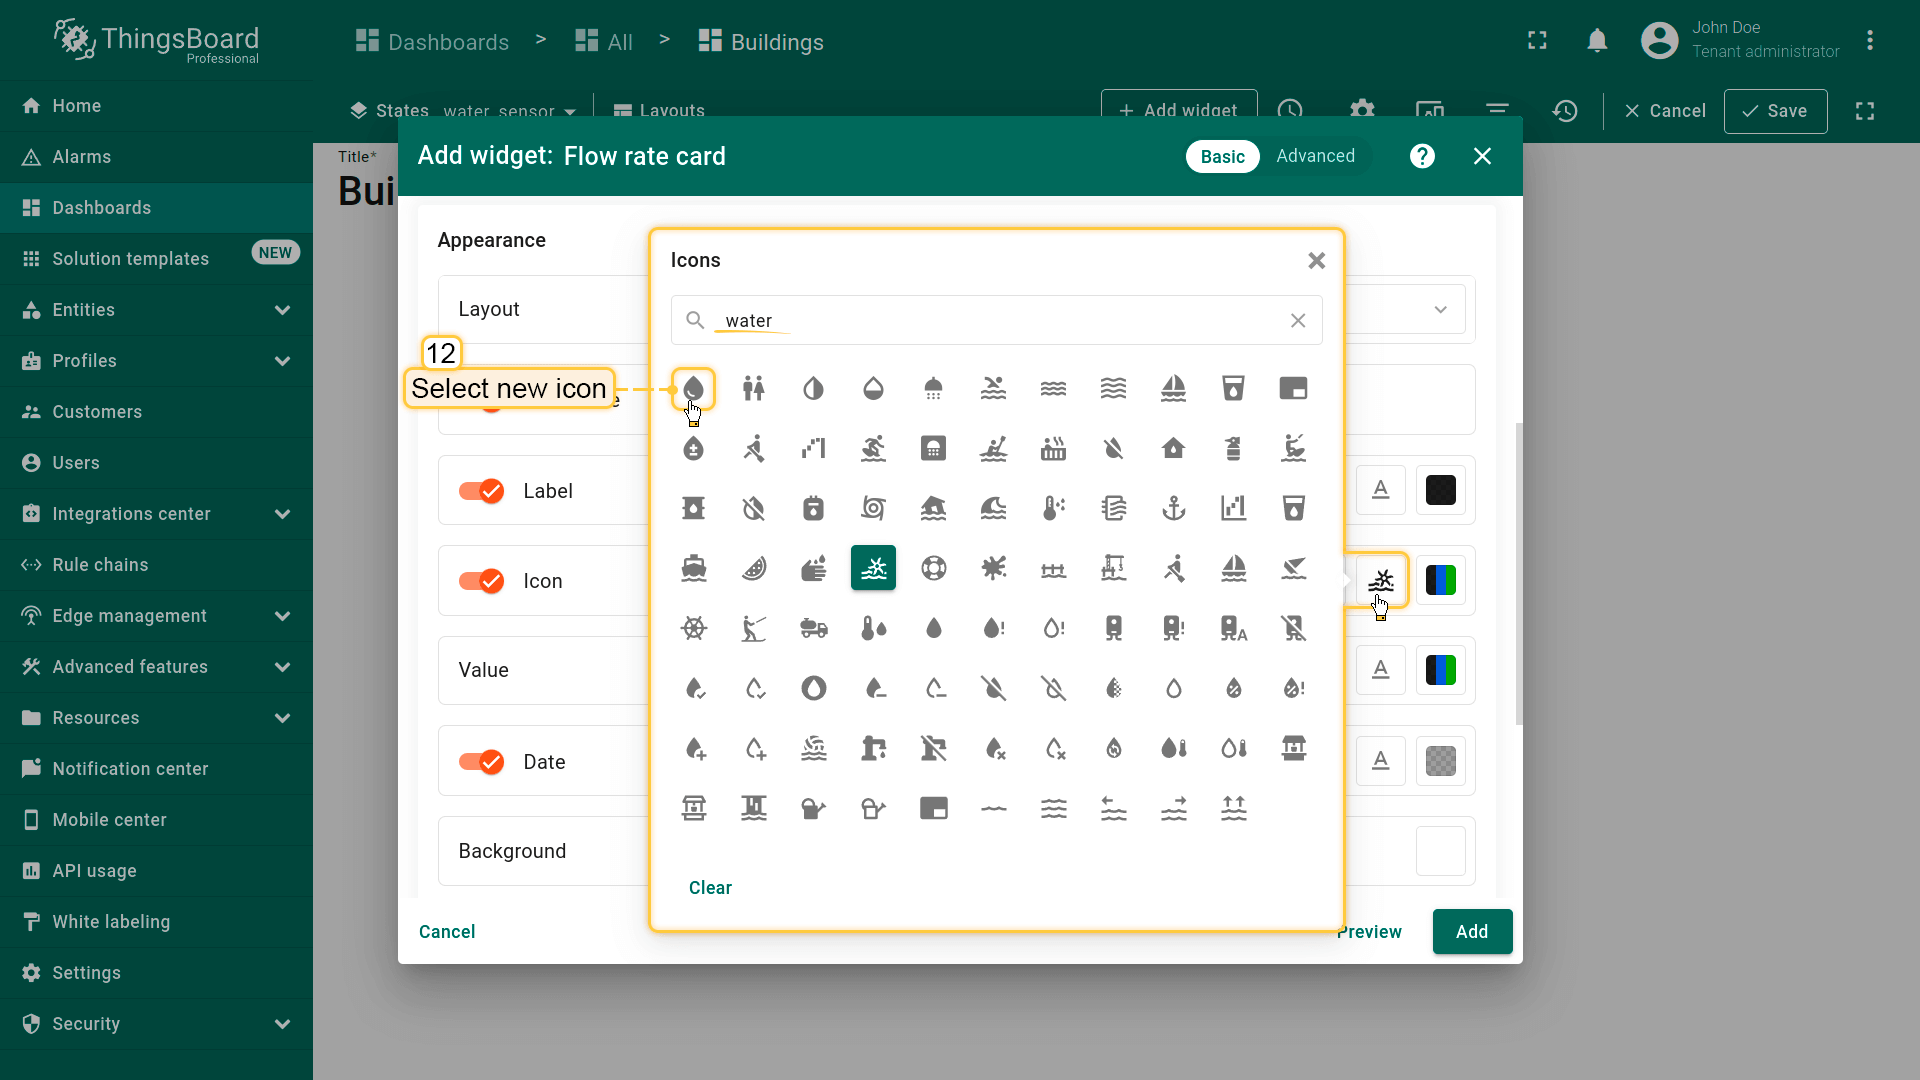
- 选择新图标;
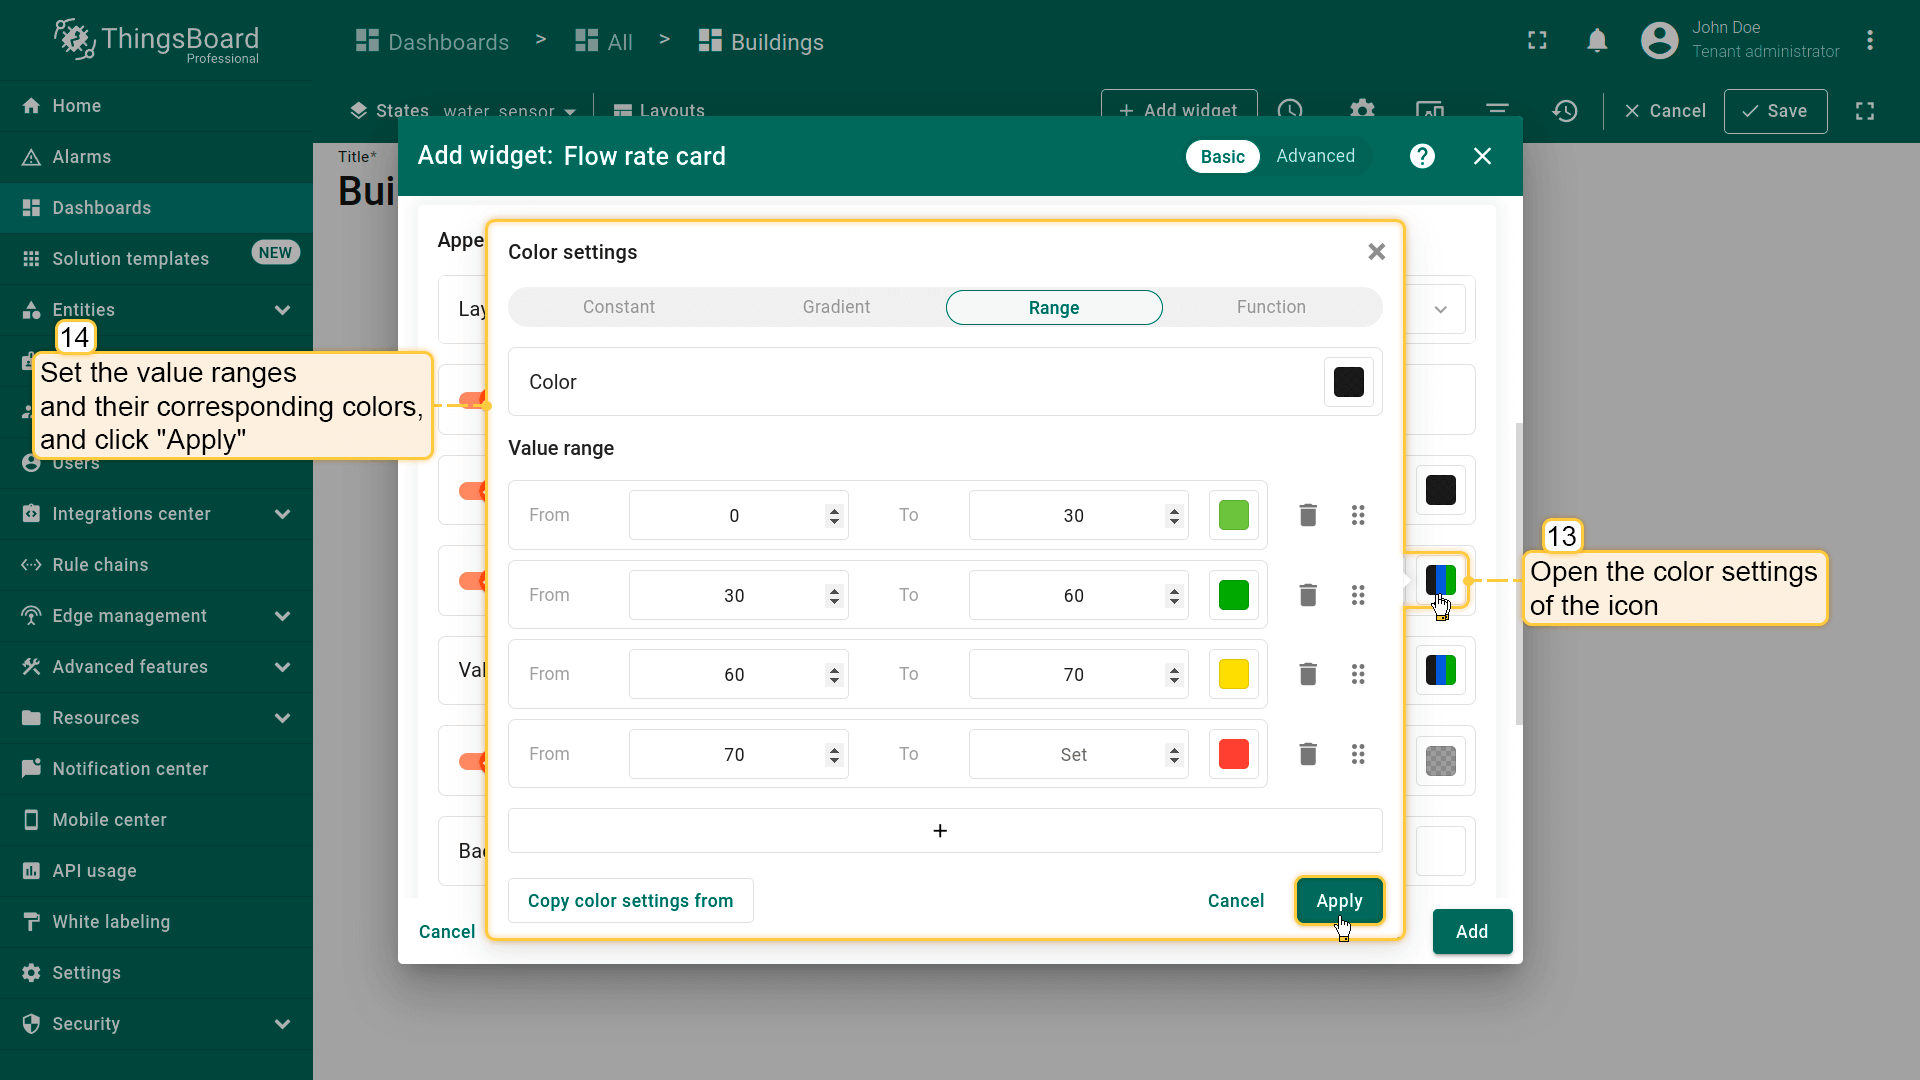
- 打开图标的颜色设置。设置取值范围及对应颜色。然后点击「Apply」;
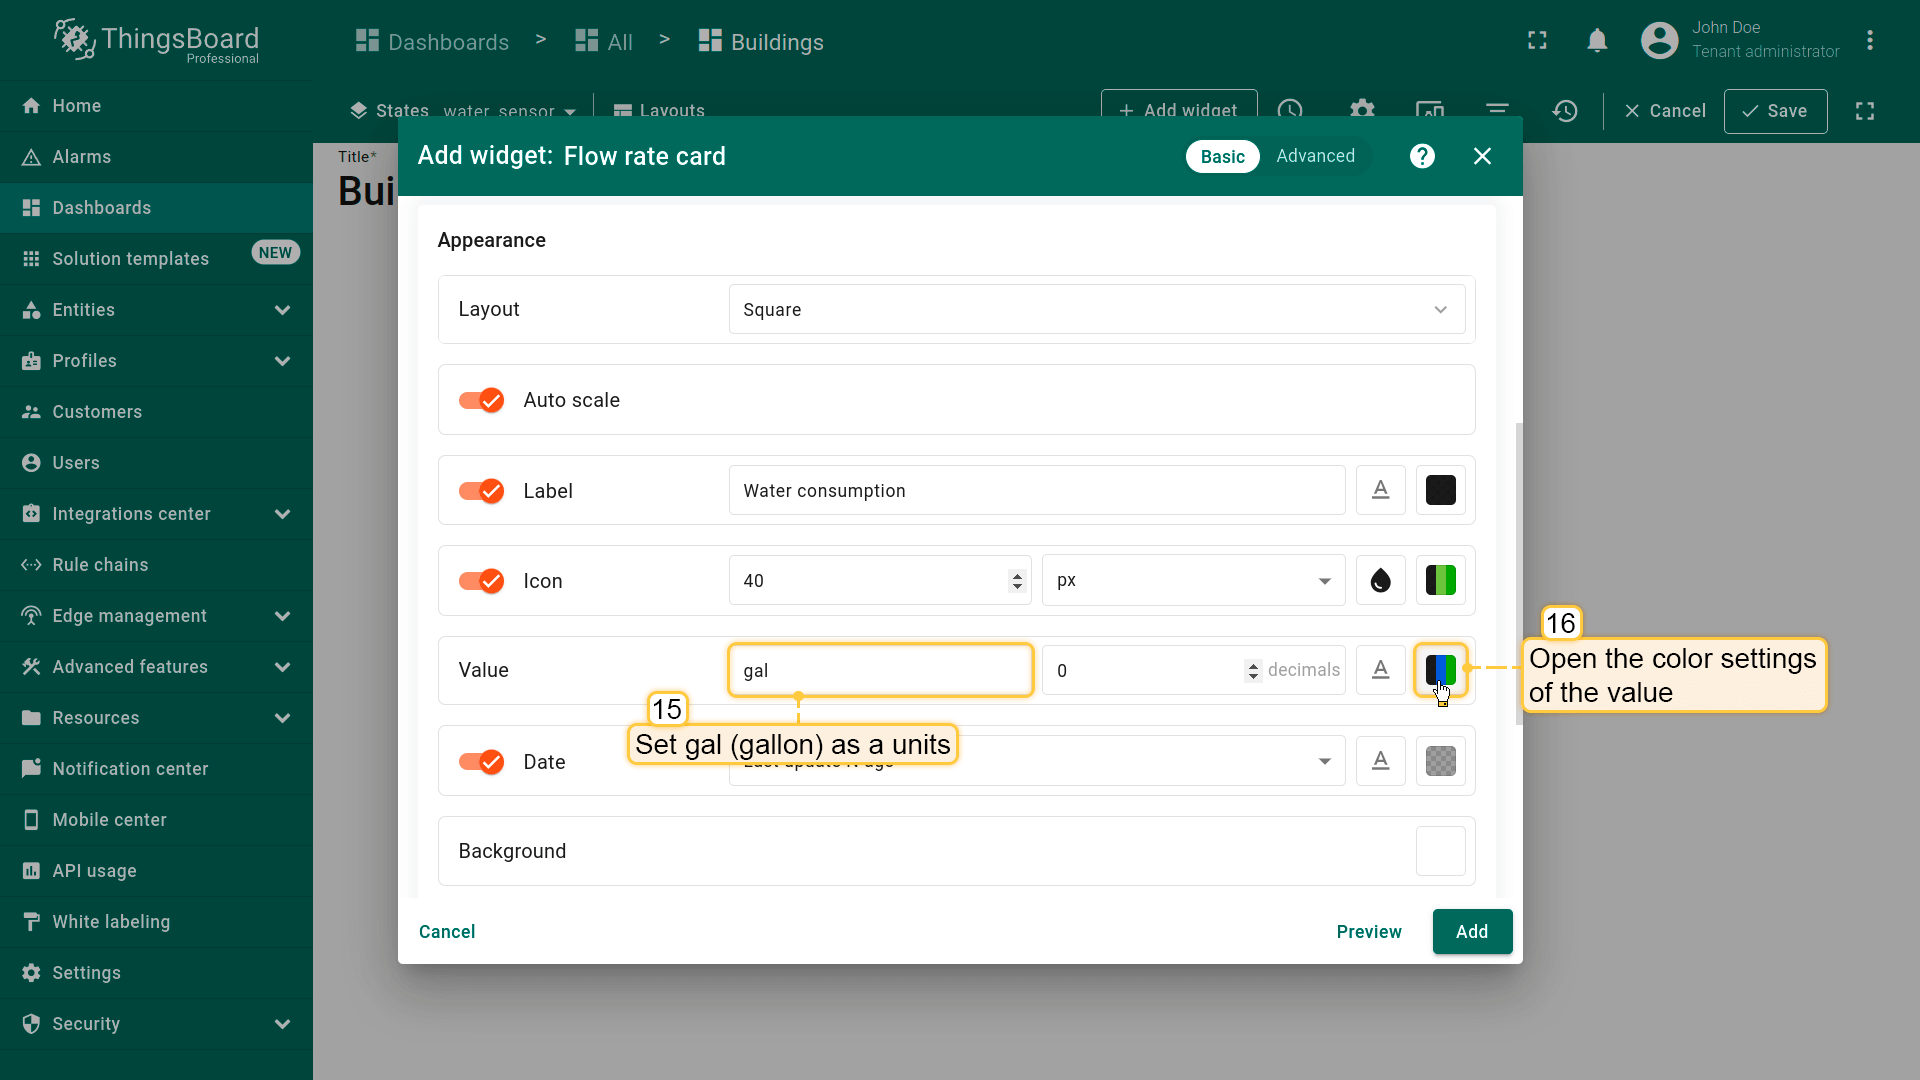
- 将单位设为 gallon。打开「Value」选项的颜色设置;
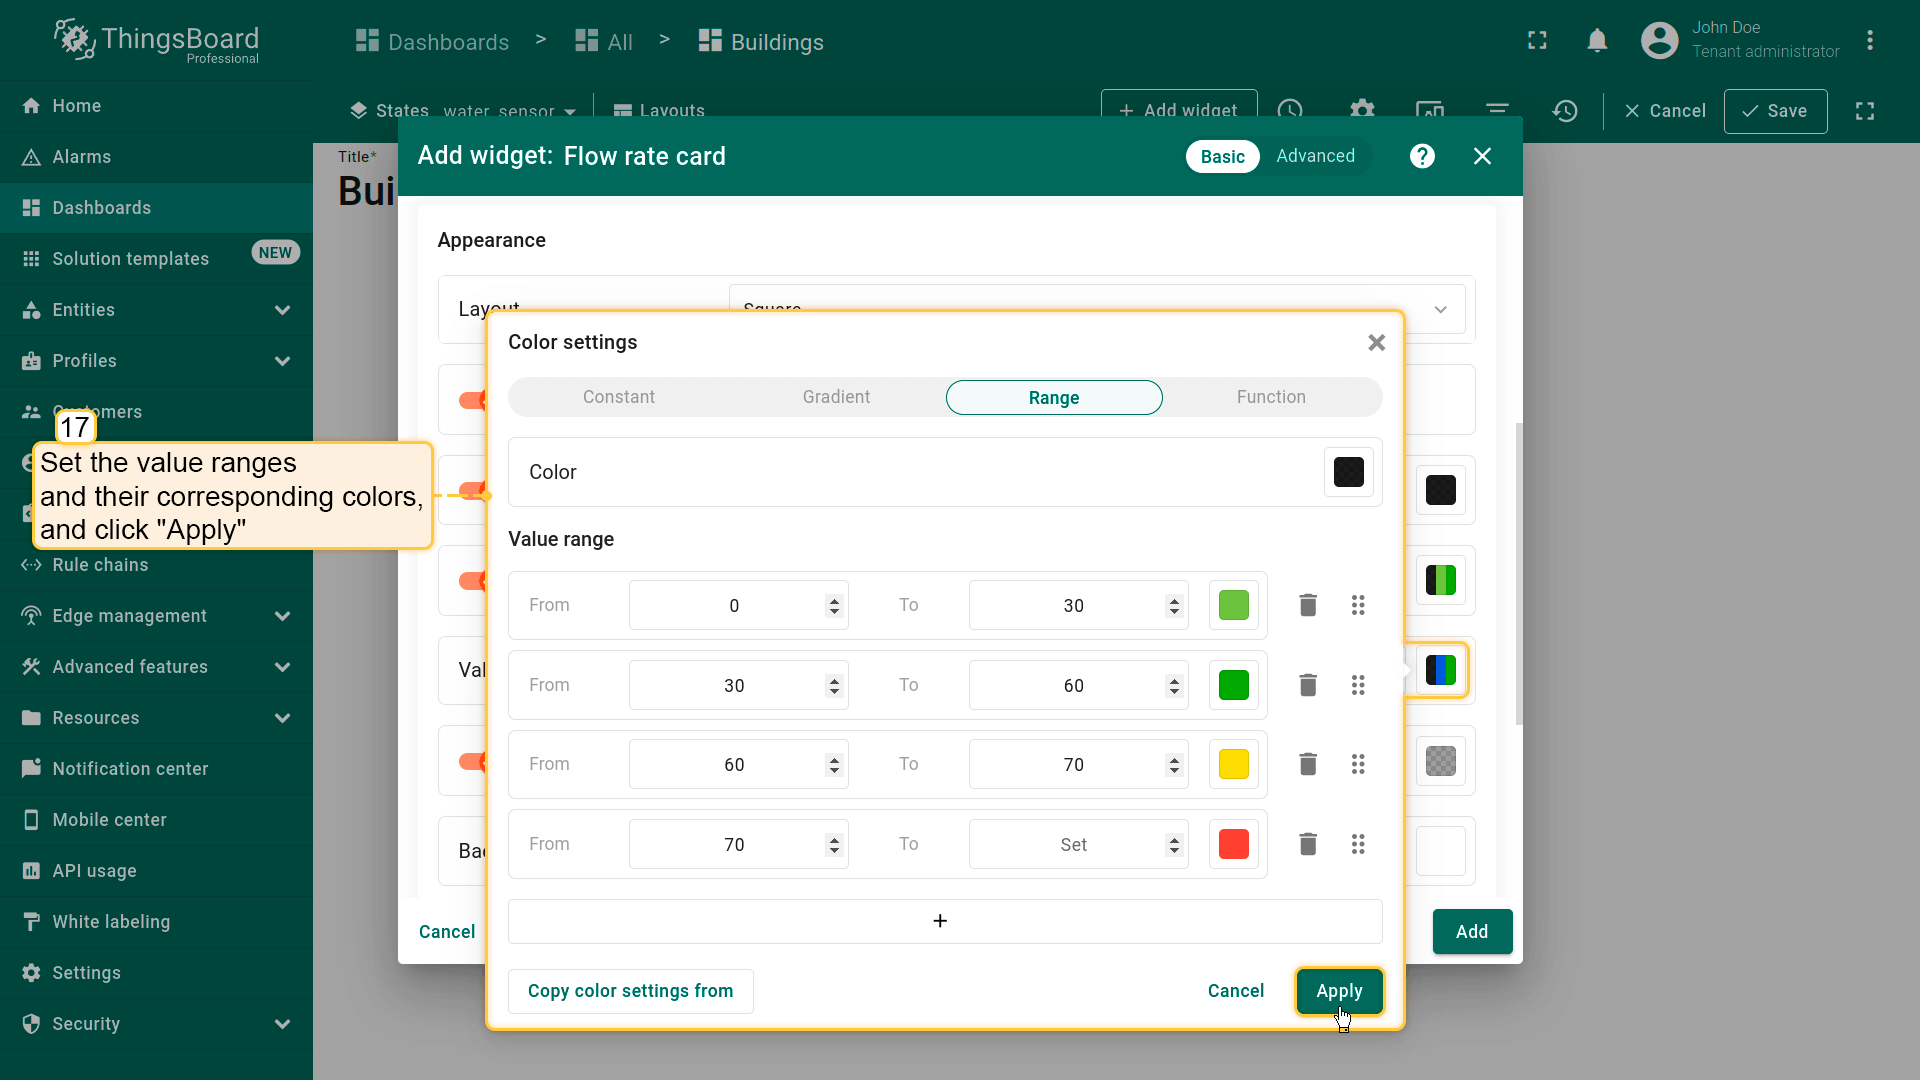
- 按截图所示设置取值范围及对应颜色。然后点击「Apply」;
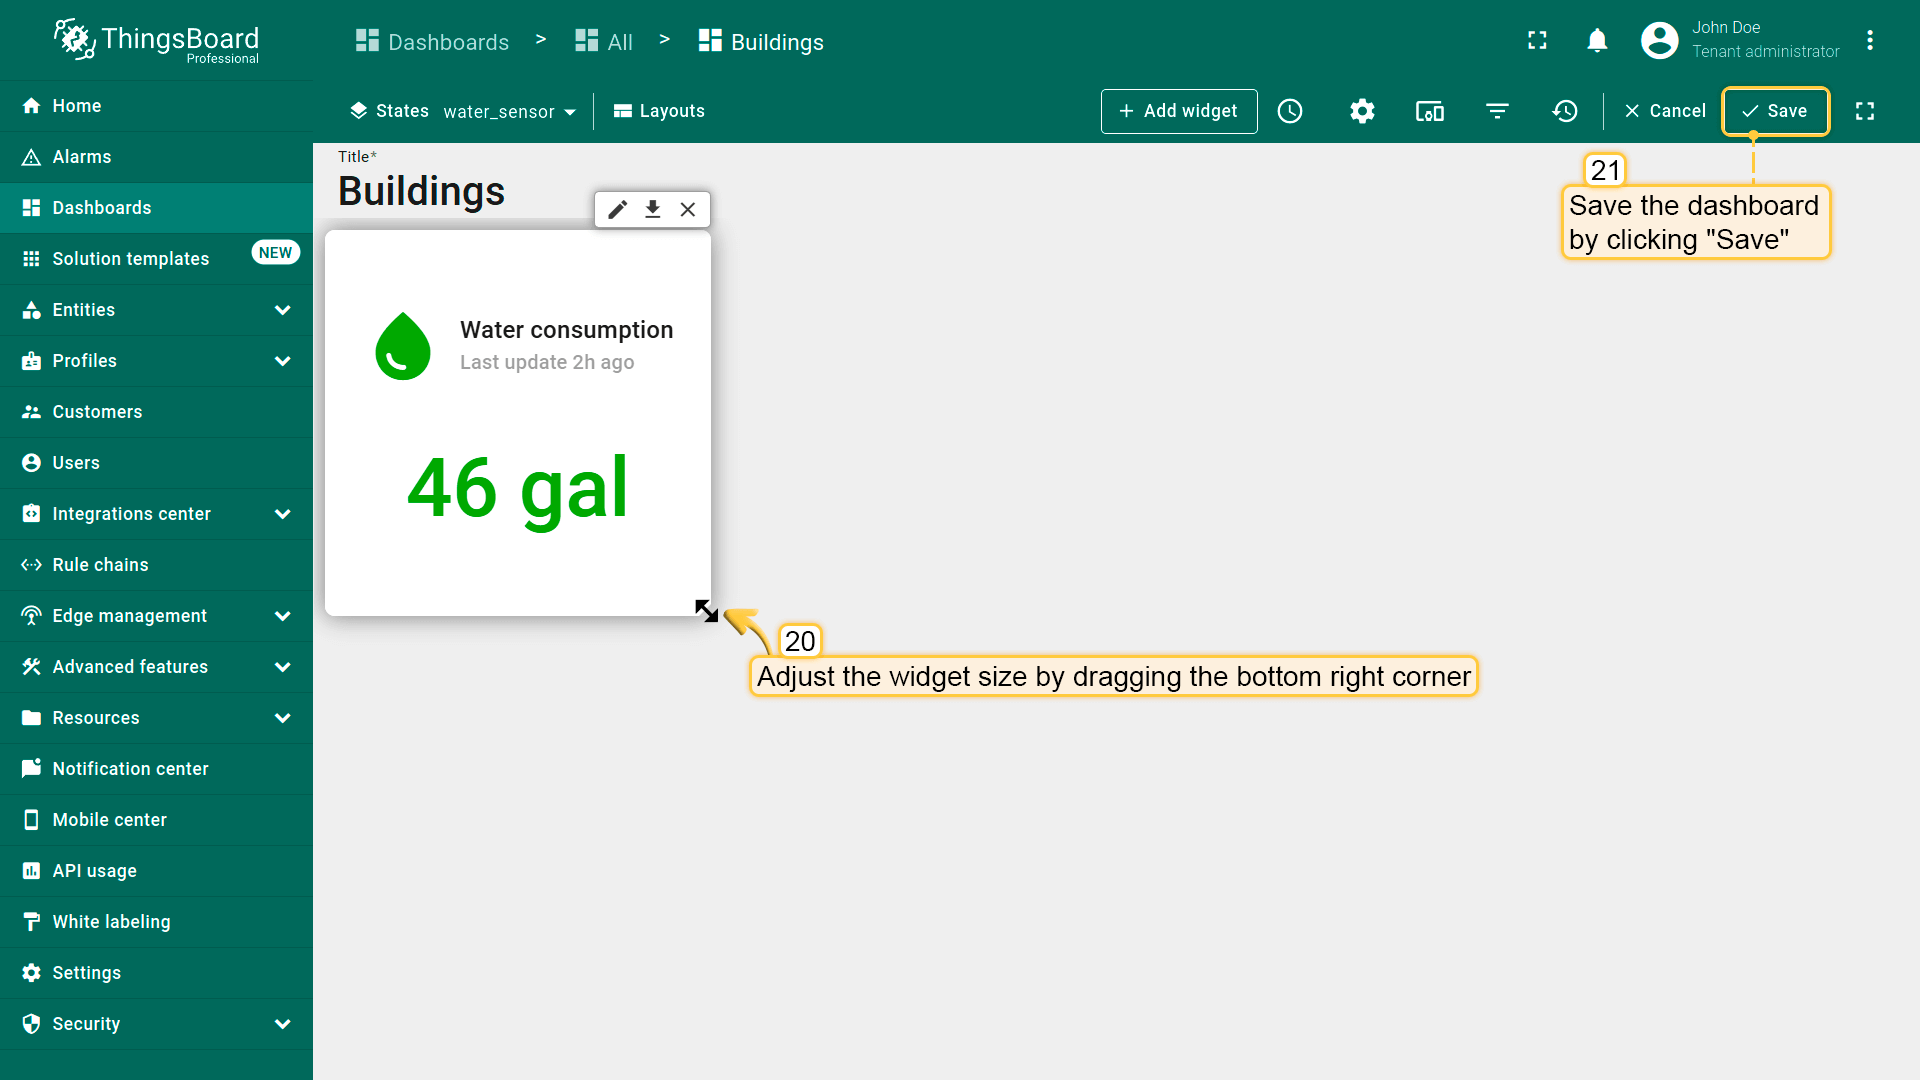
- 清空「Card border radius」值。点击「Add」;
- 已添加显示仪表板时间窗口指定时间段内总用水量的部件。按需调整部件大小并保存仪表板。

Water consumption chart
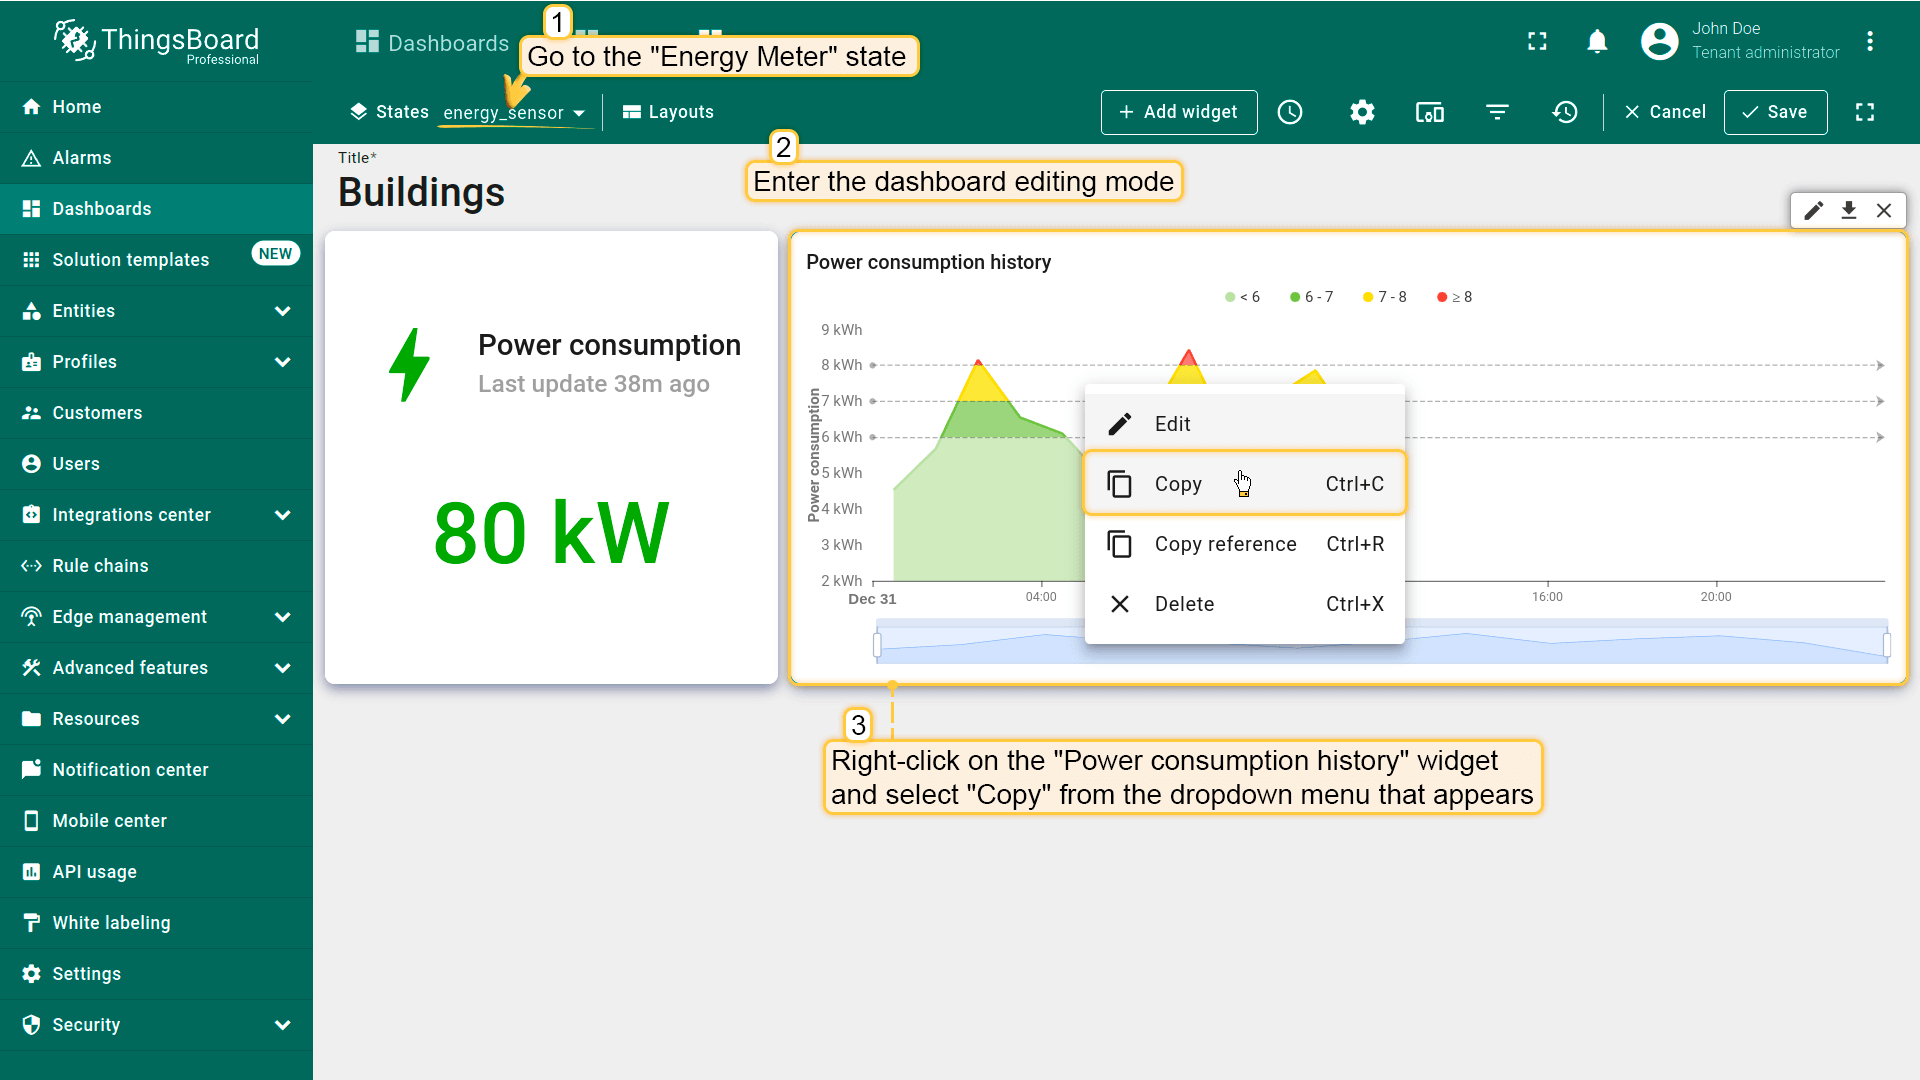
Now we need to add a widget to visualize historical data on water consumption. Previously, we added a similar widget for tracking power consumption. Let's copy the “Power consumption history” widget, paste it into the water_sensor state, and change the data source to display water consumption.
- 进入「Energy Meter」状态,进入仪表板编辑模式。右键点击「Power consumption history」部件,从下拉菜单中选择「Copy」;
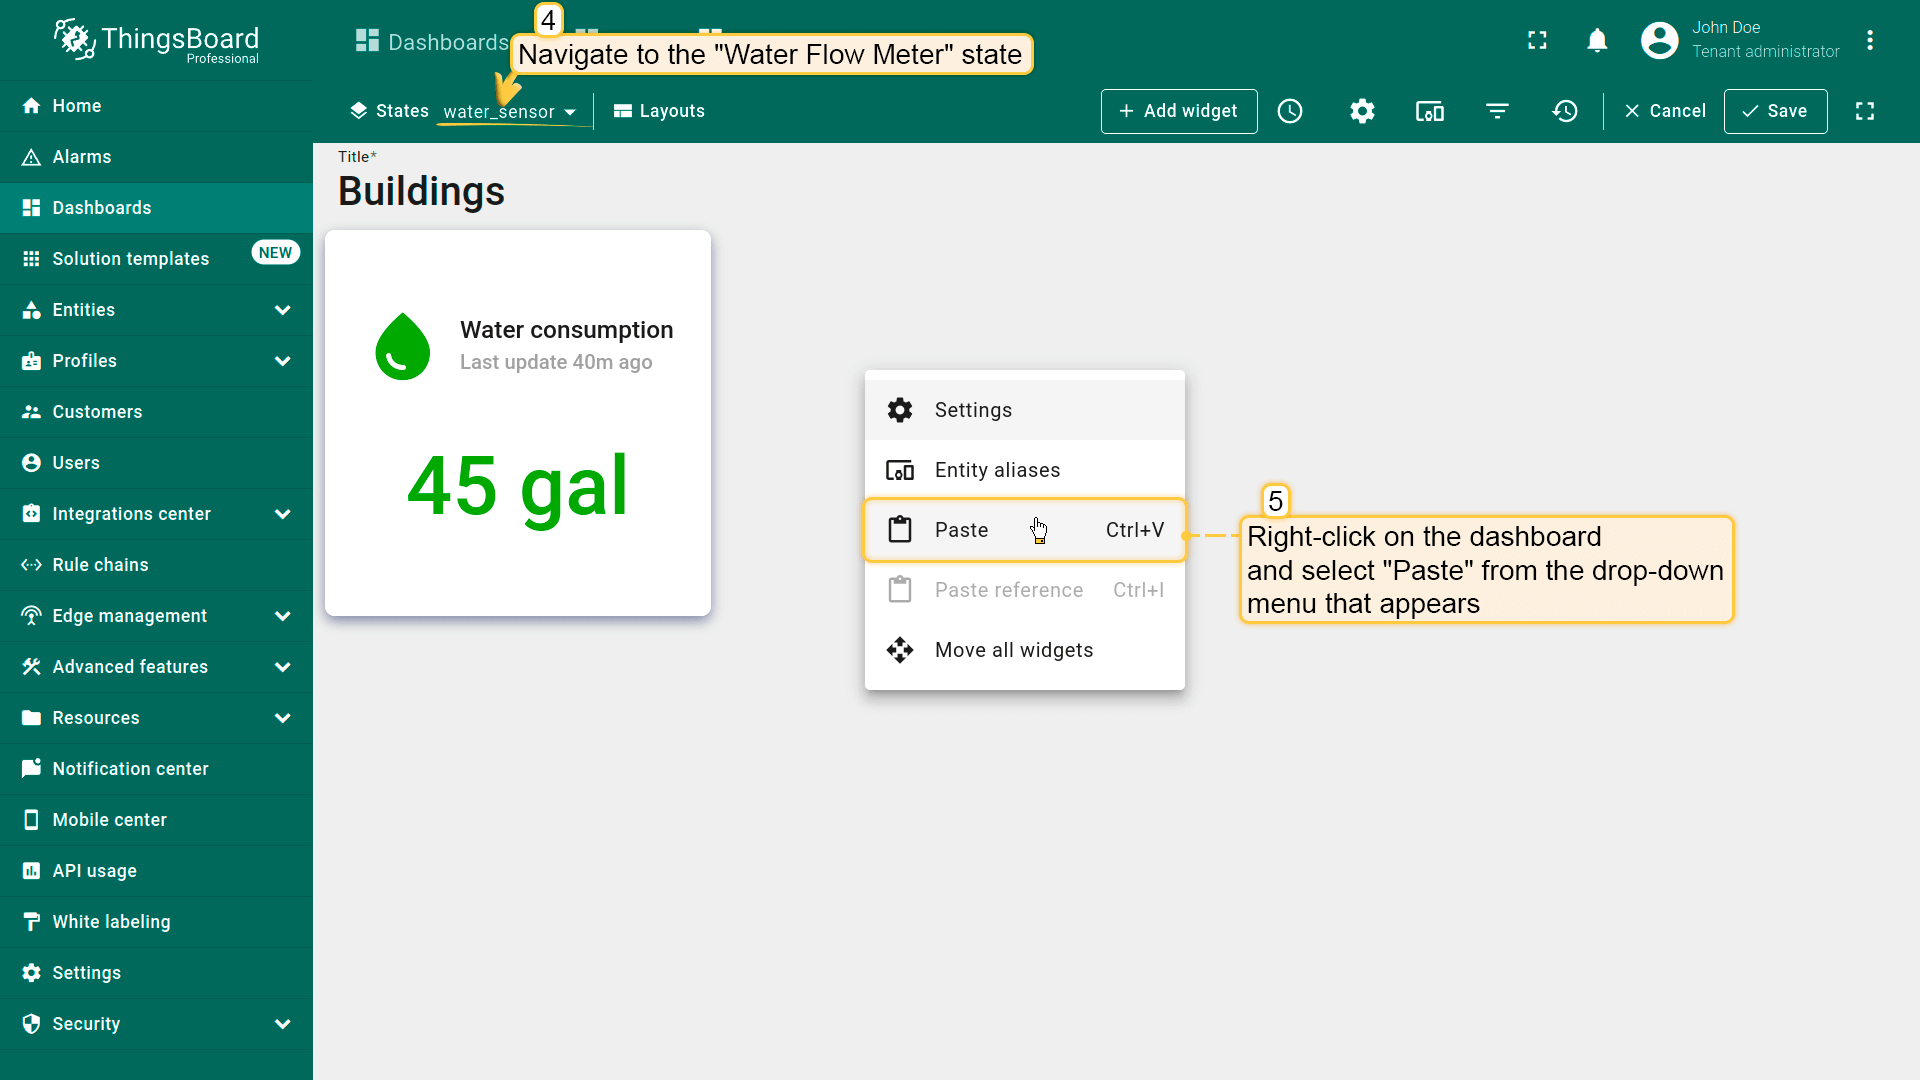
- 进入「Water Flow Meter」状态。在仪表板上右键点击,选择「Paste」以粘贴复制的部件;
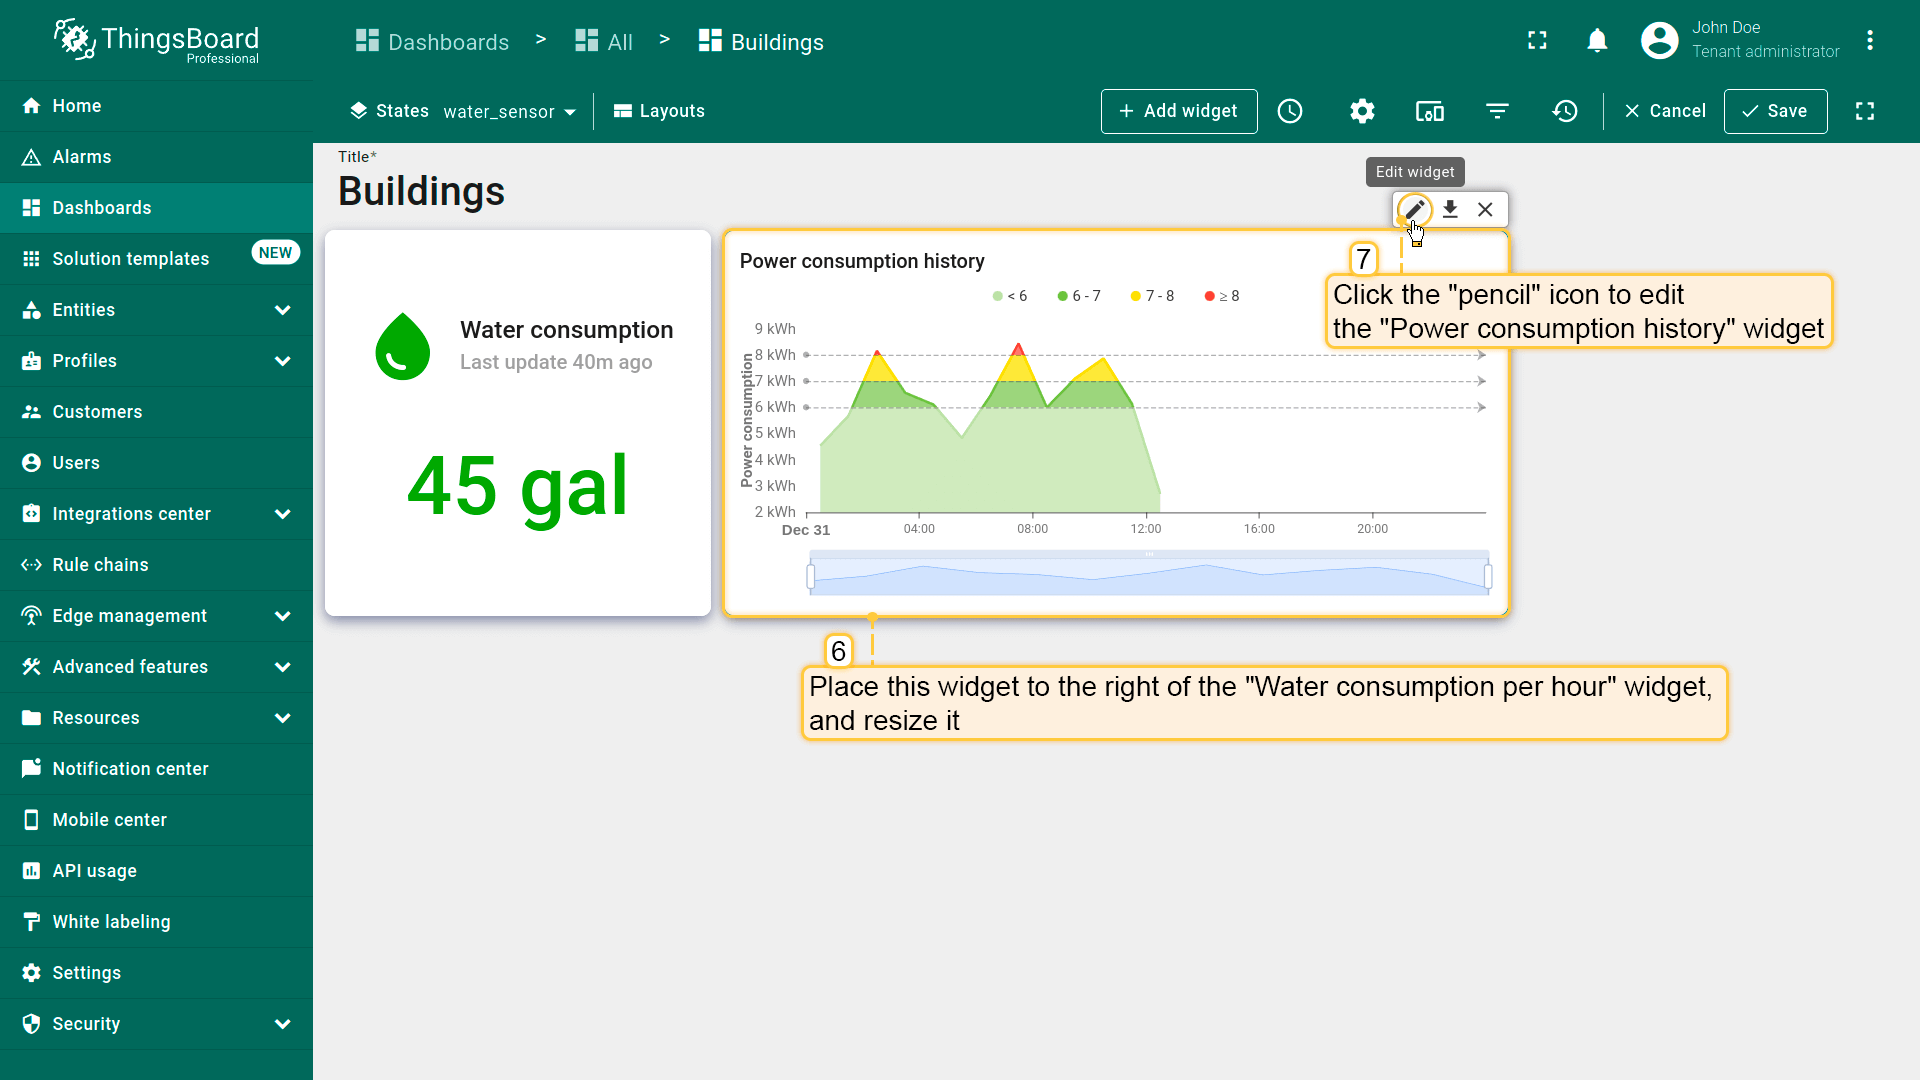
- 将此部件放在「Water consumption」部件右侧并调整大小。点击「铅笔」图标进入「Power consumption history」部件设置;
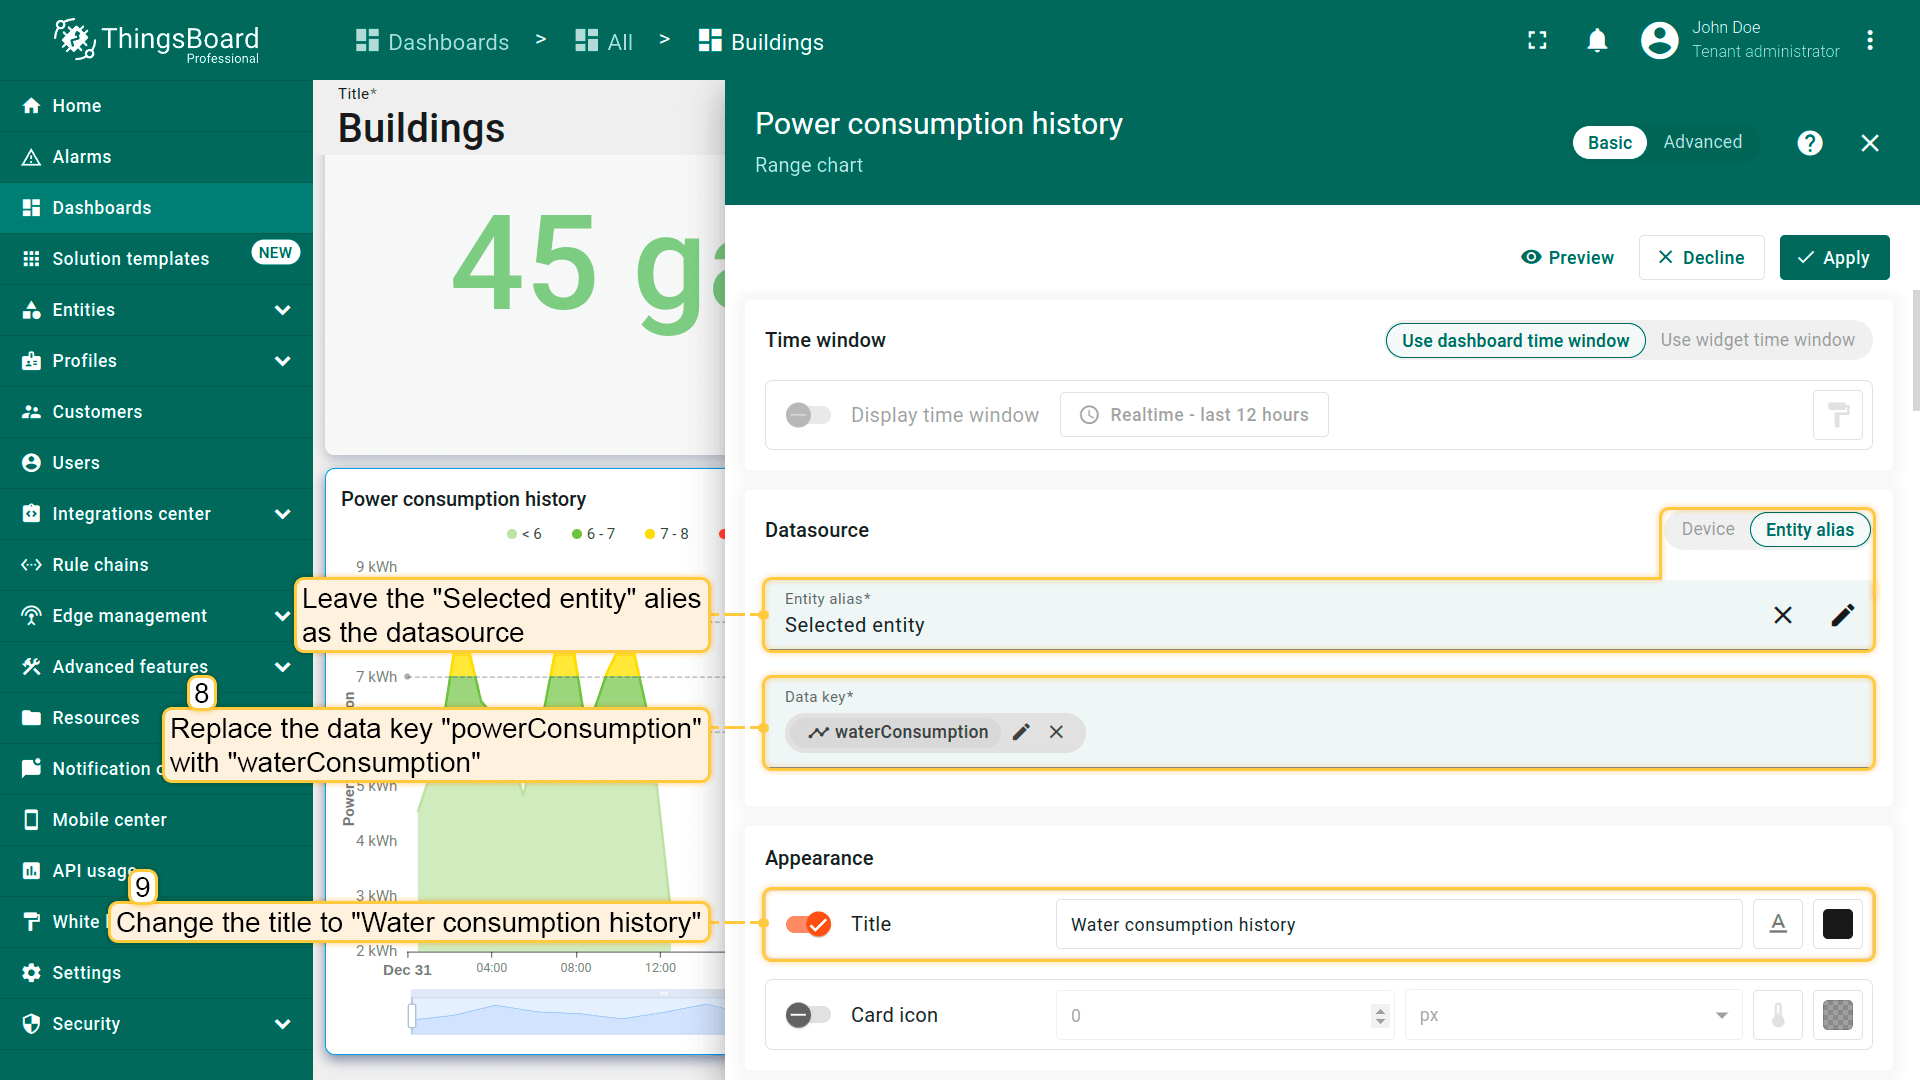
- 保留「Selected entity」别名为数据源。将数据键「powerConsumption」替换为「waterConsumption」。将标题改为「Water consumption history」;
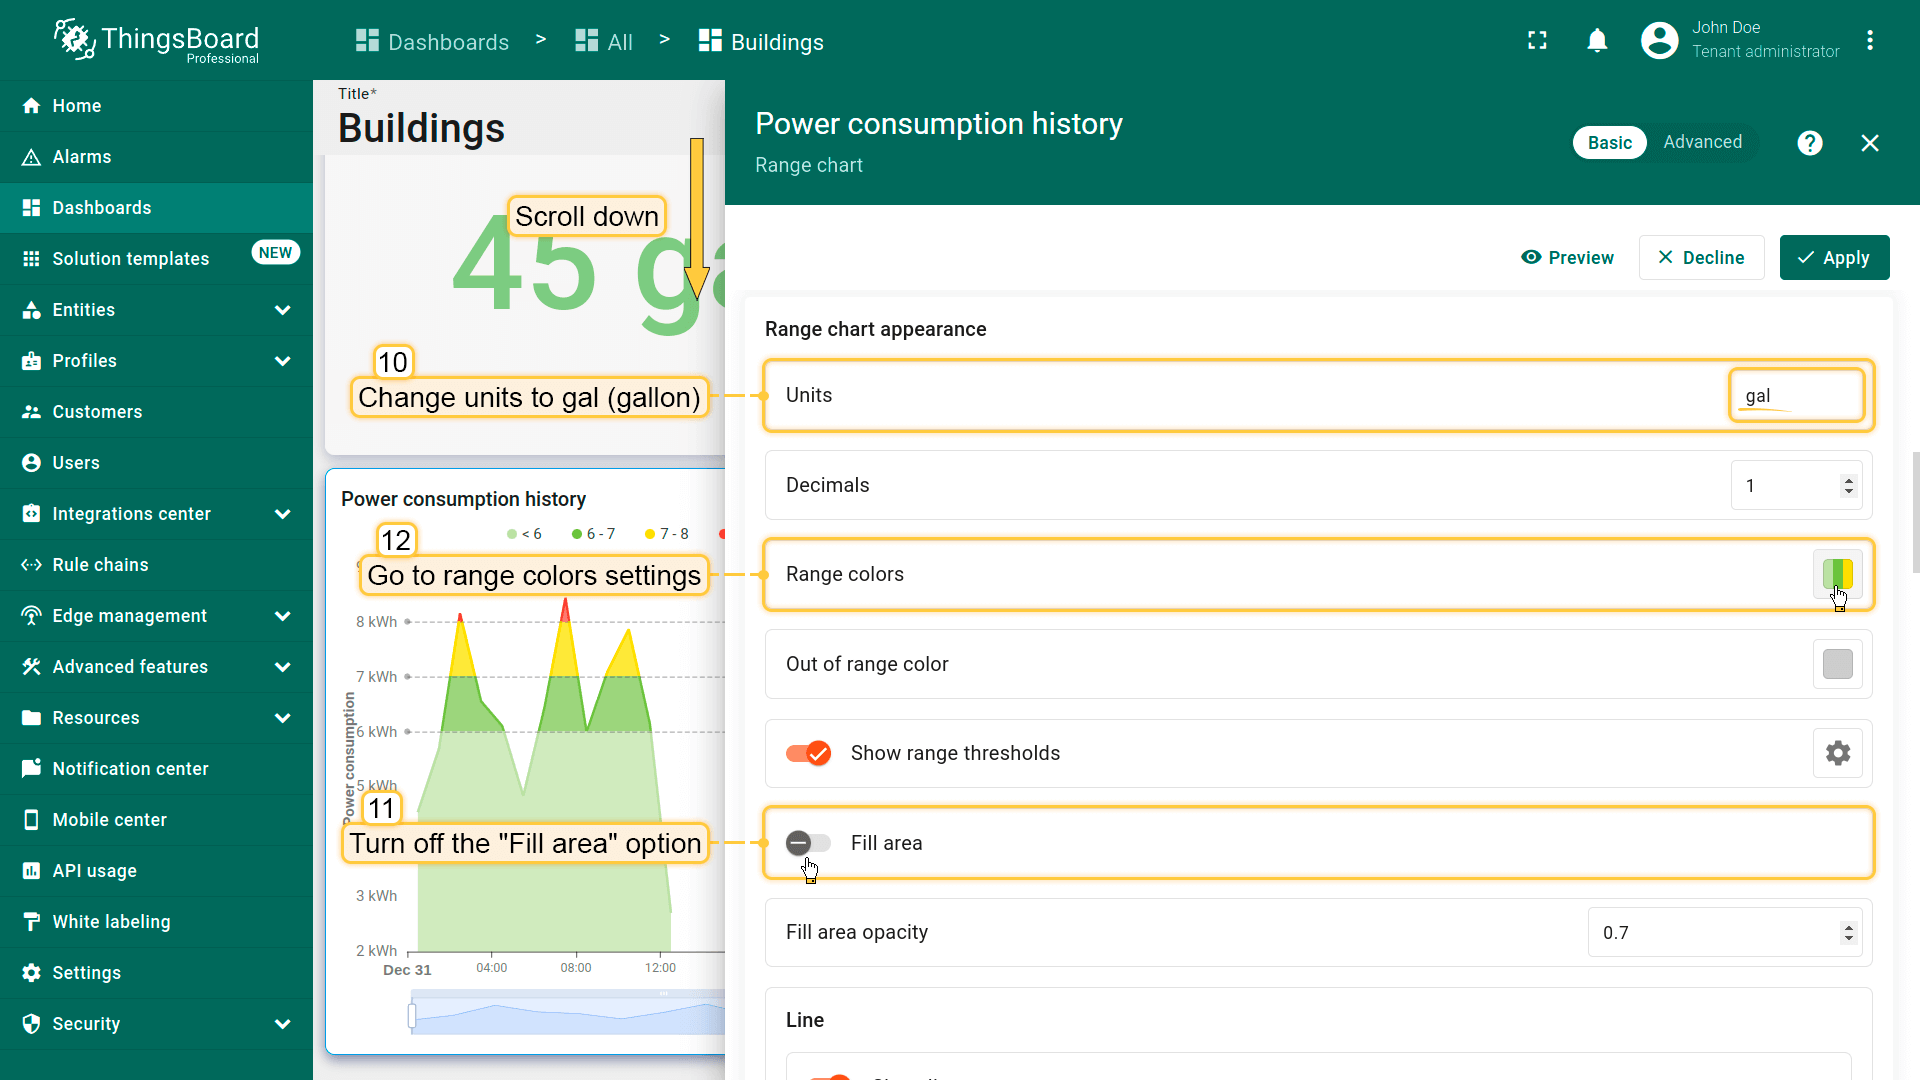
- 将单位改为 gal(gallon)。关闭「Fill area」选项。进入范围颜色设置;
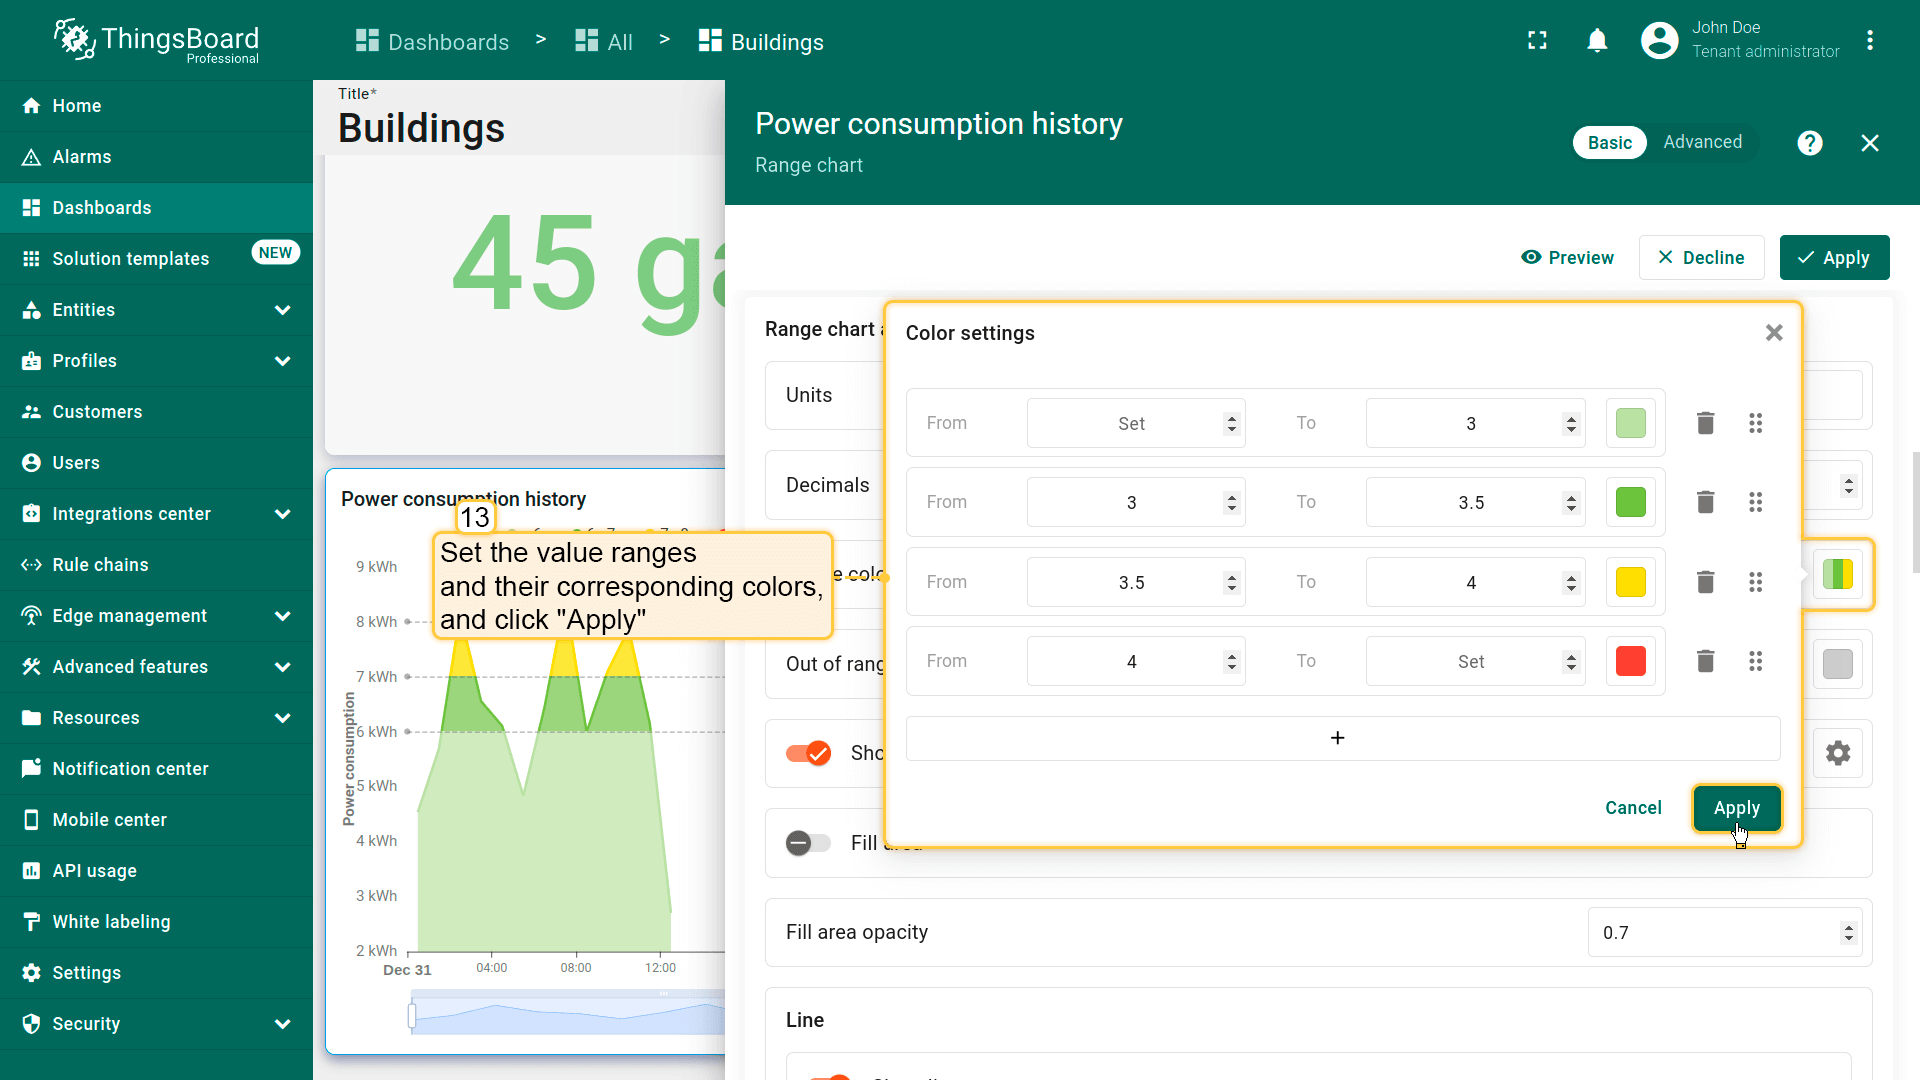
- 按截图所示设置取值范围及对应颜色。然后点击「Apply」;
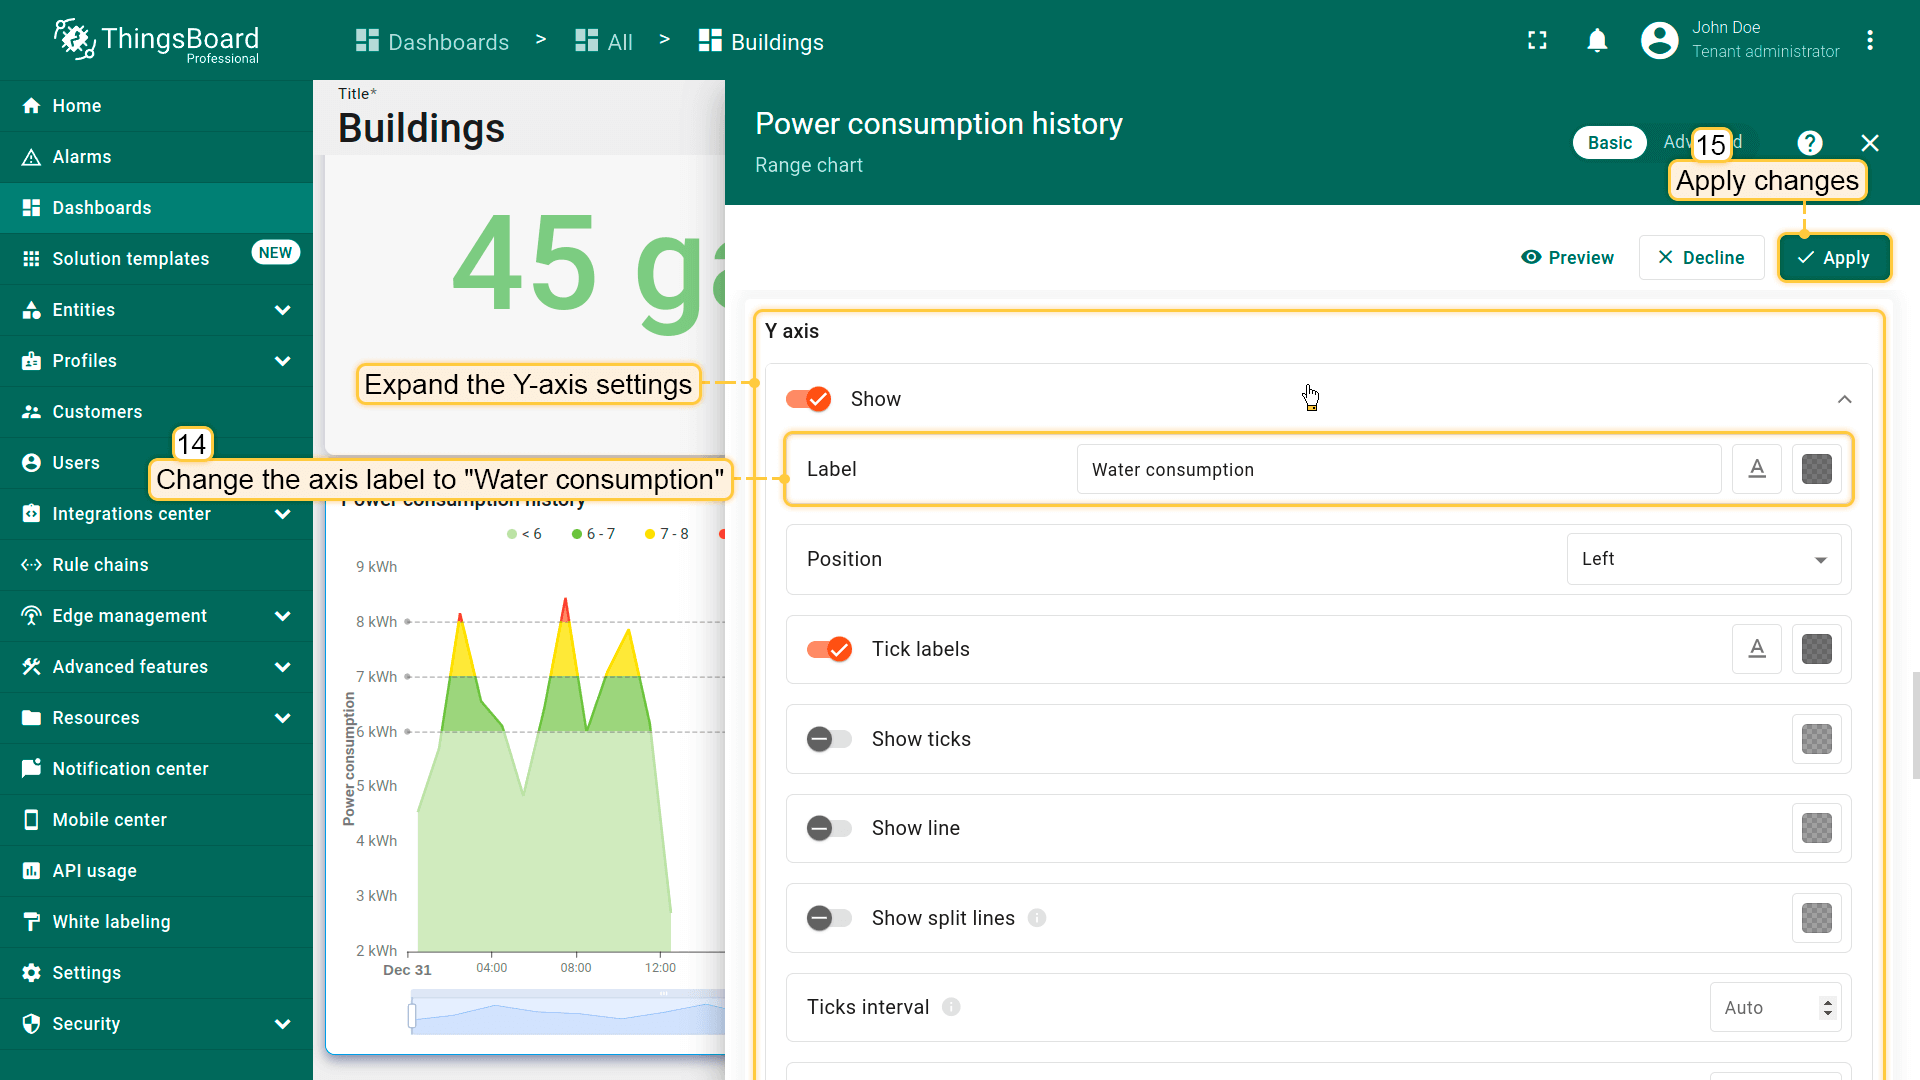
- 展开 Y 轴设置。将轴标签改为「Water consumption」。点击「Apply」保存更改;
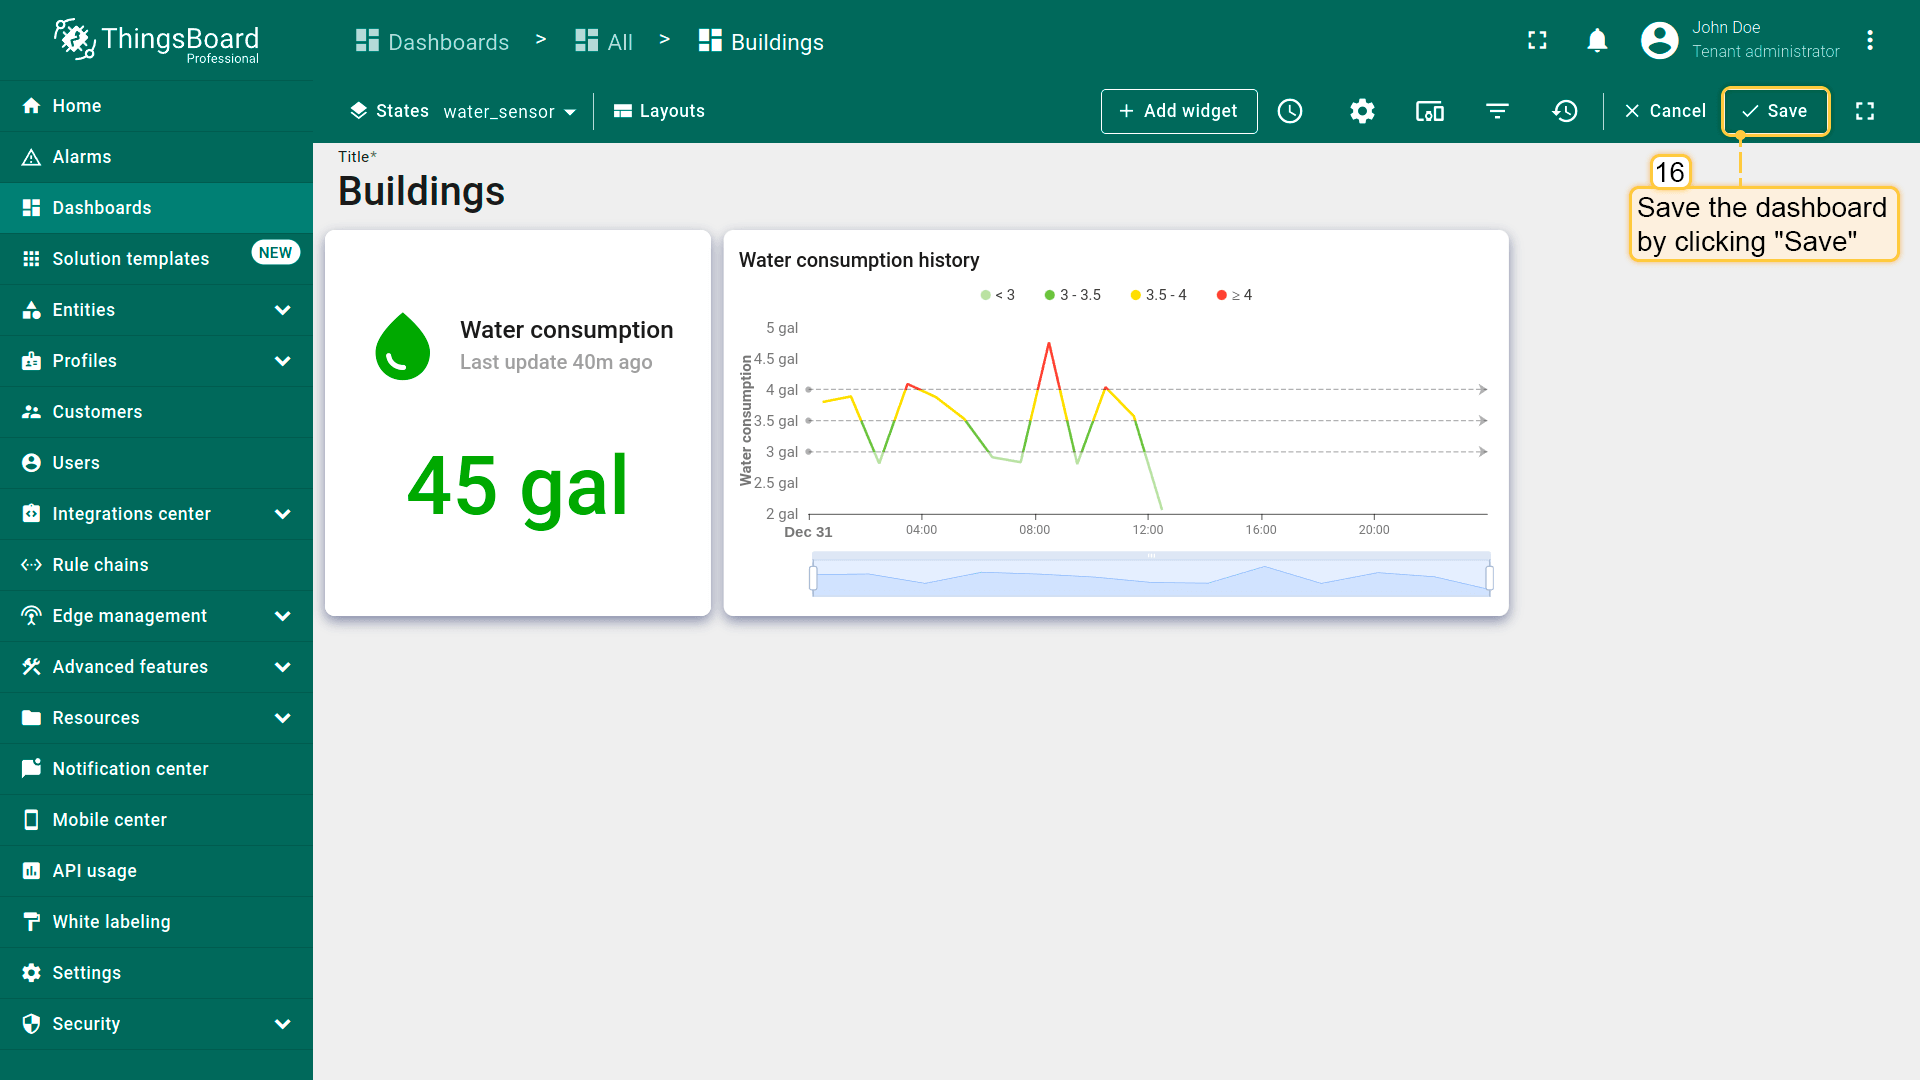
- 已添加「Water consumption history」部件。保存仪表板。
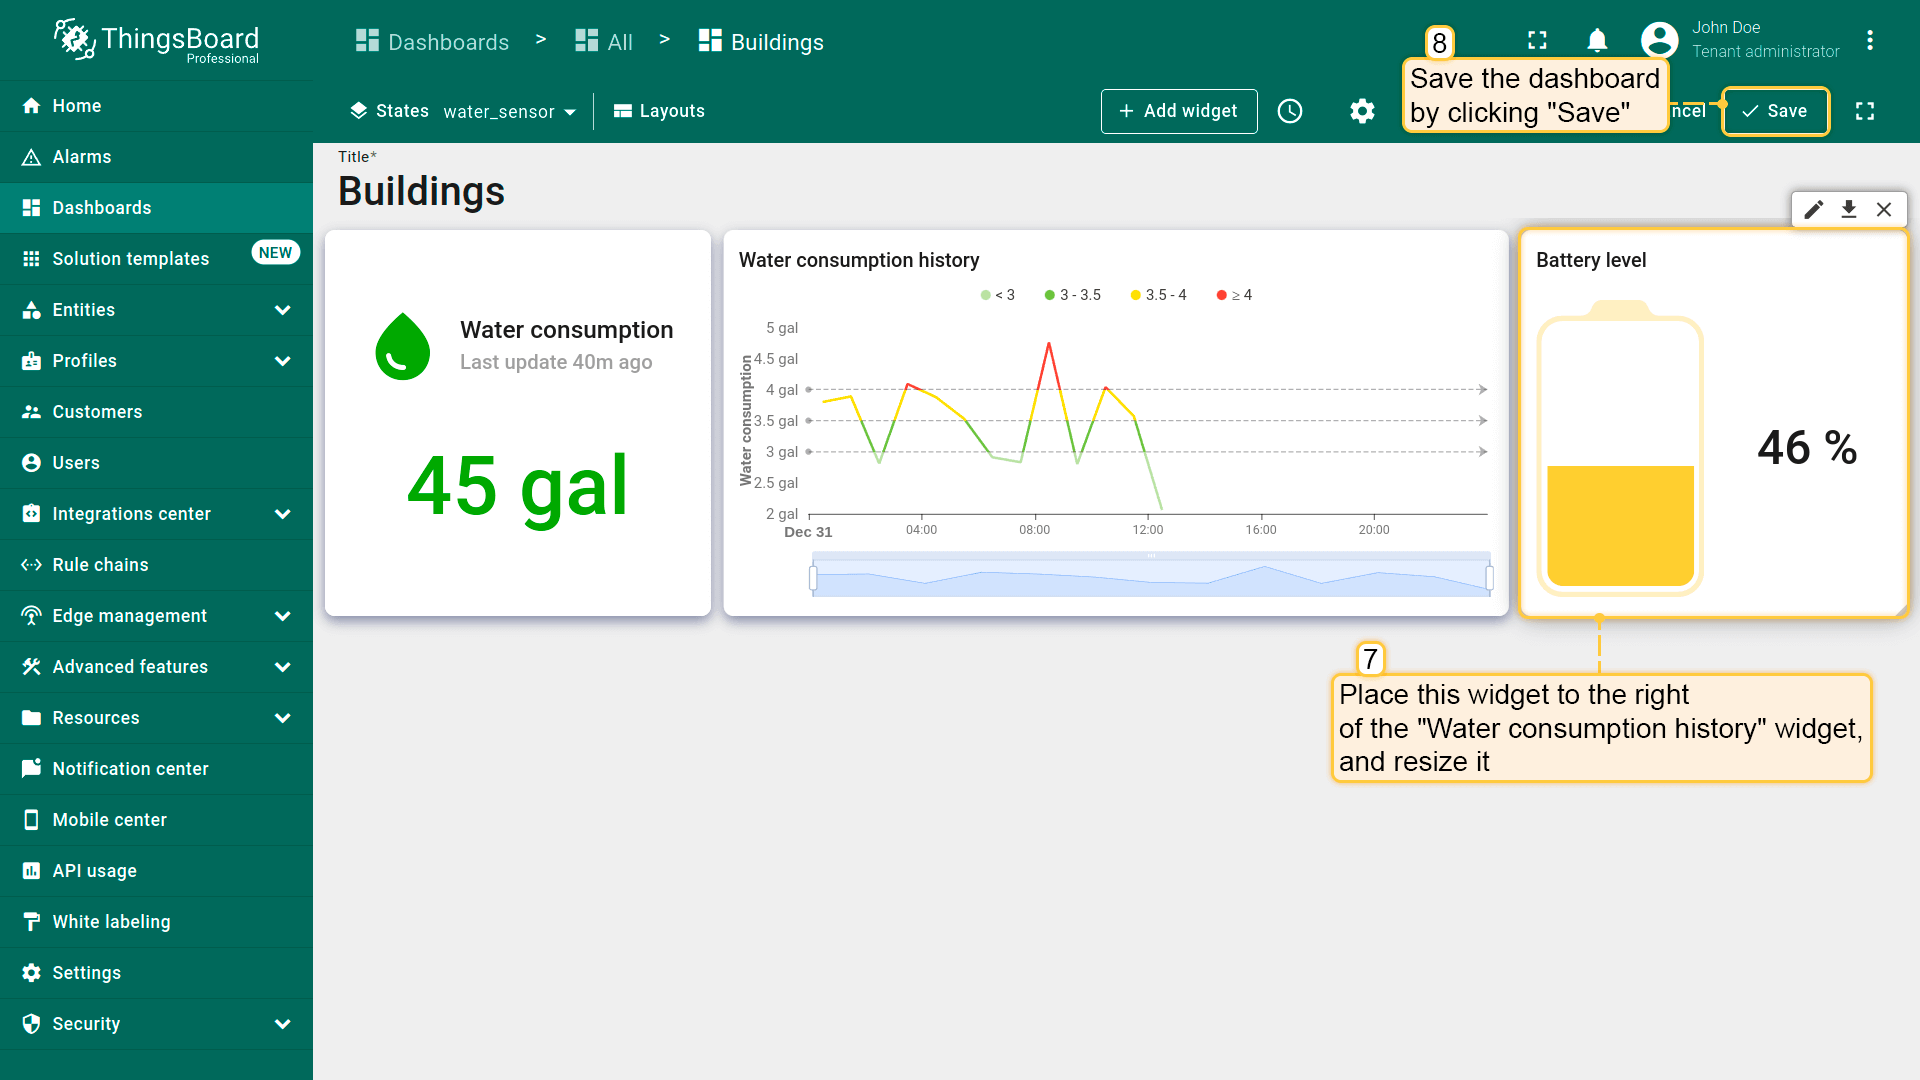
Battery level widget
And lastly in this lesson, we will add the “Battery charge” widget. It will display the battery charge level of the “Water Flow Meter” device.
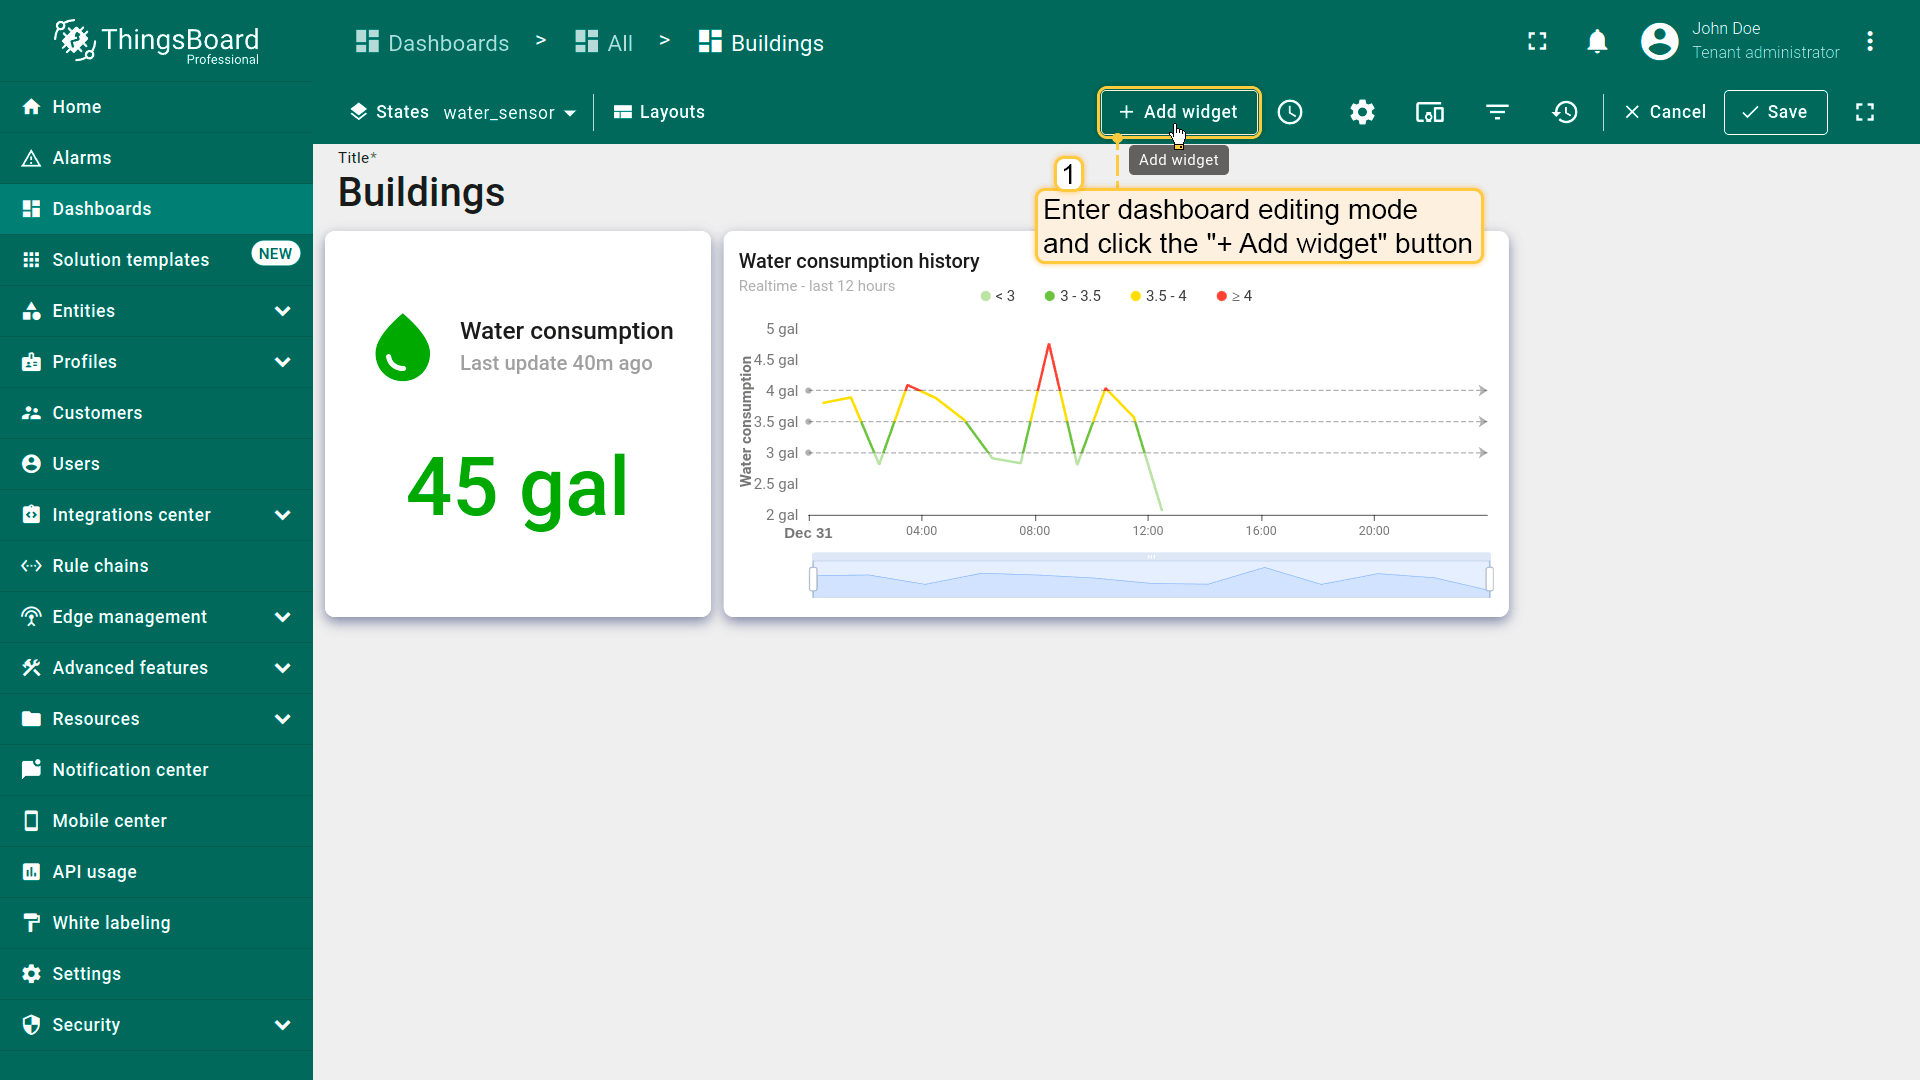
- 在仪表板编辑模式下点击「+ Add widget」按钮;
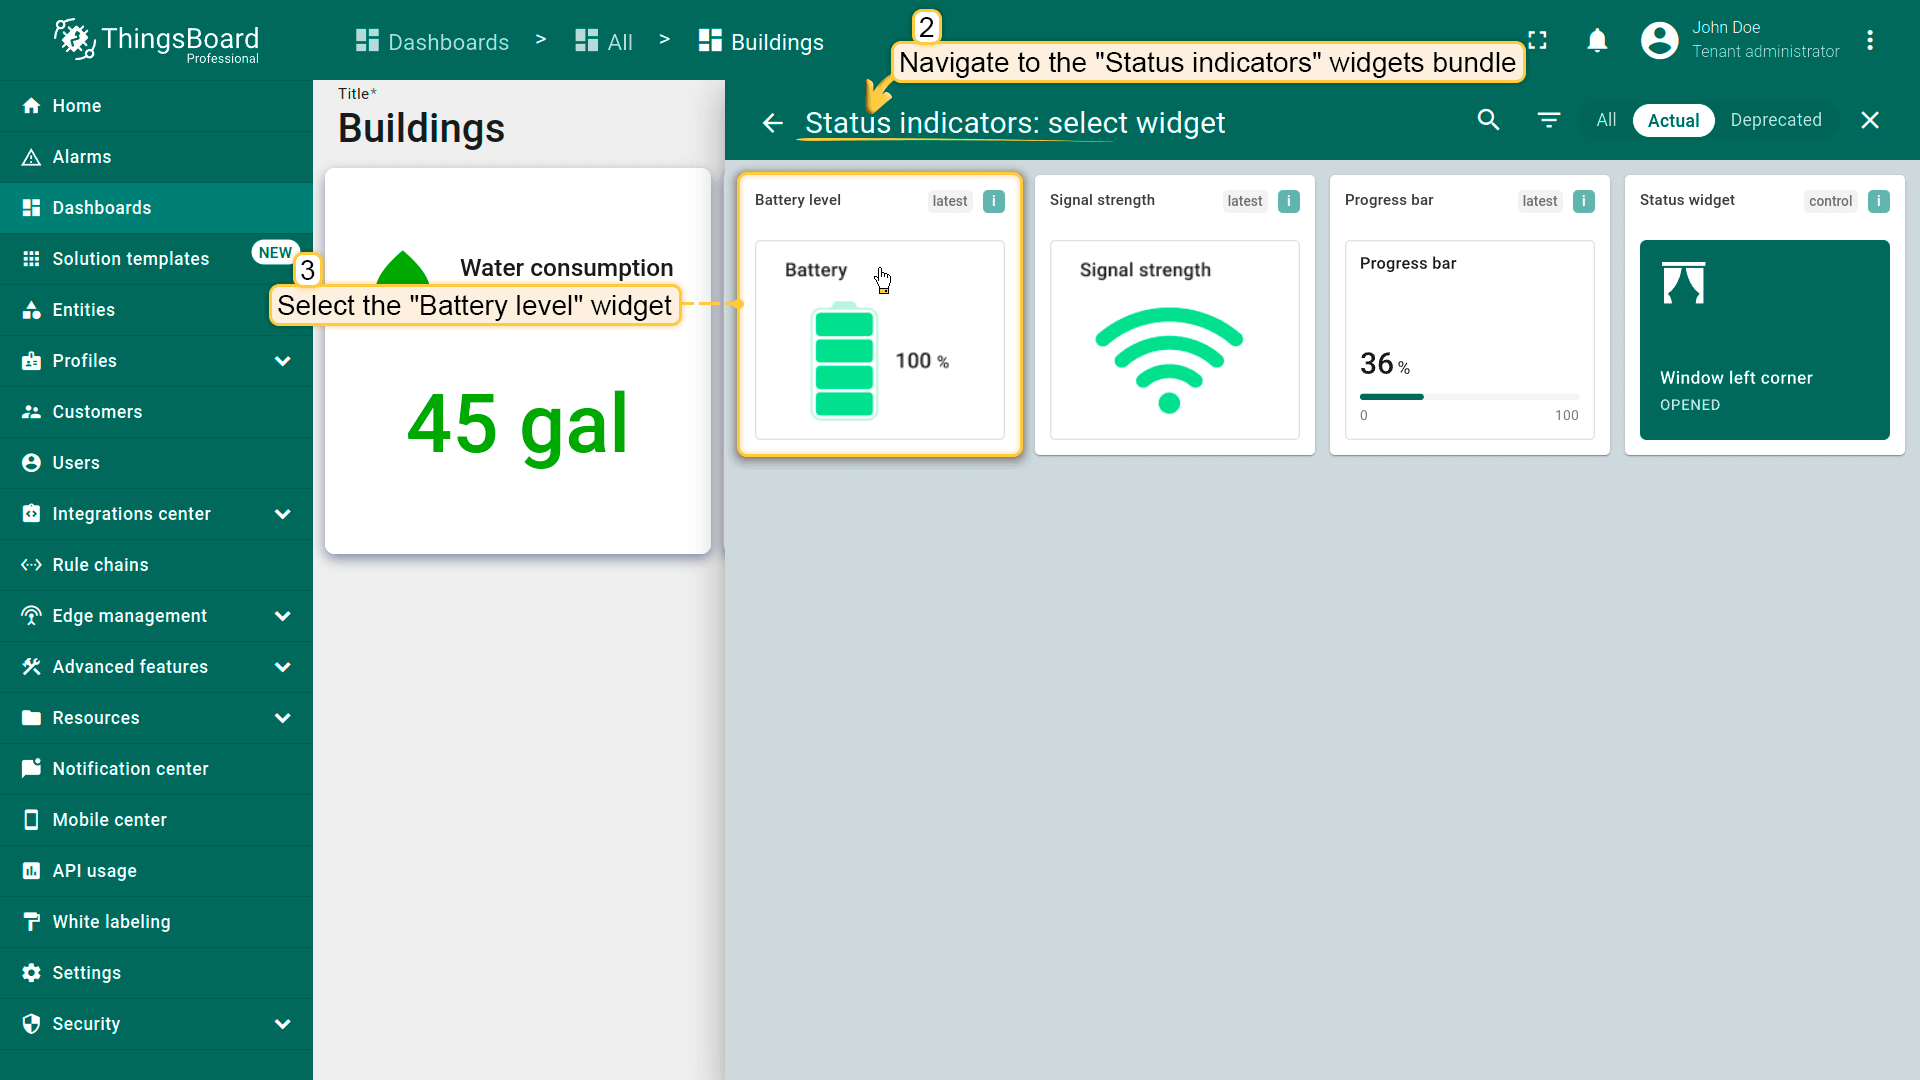
- 选择「Status indicators」部件包中的「Battery level」部件;
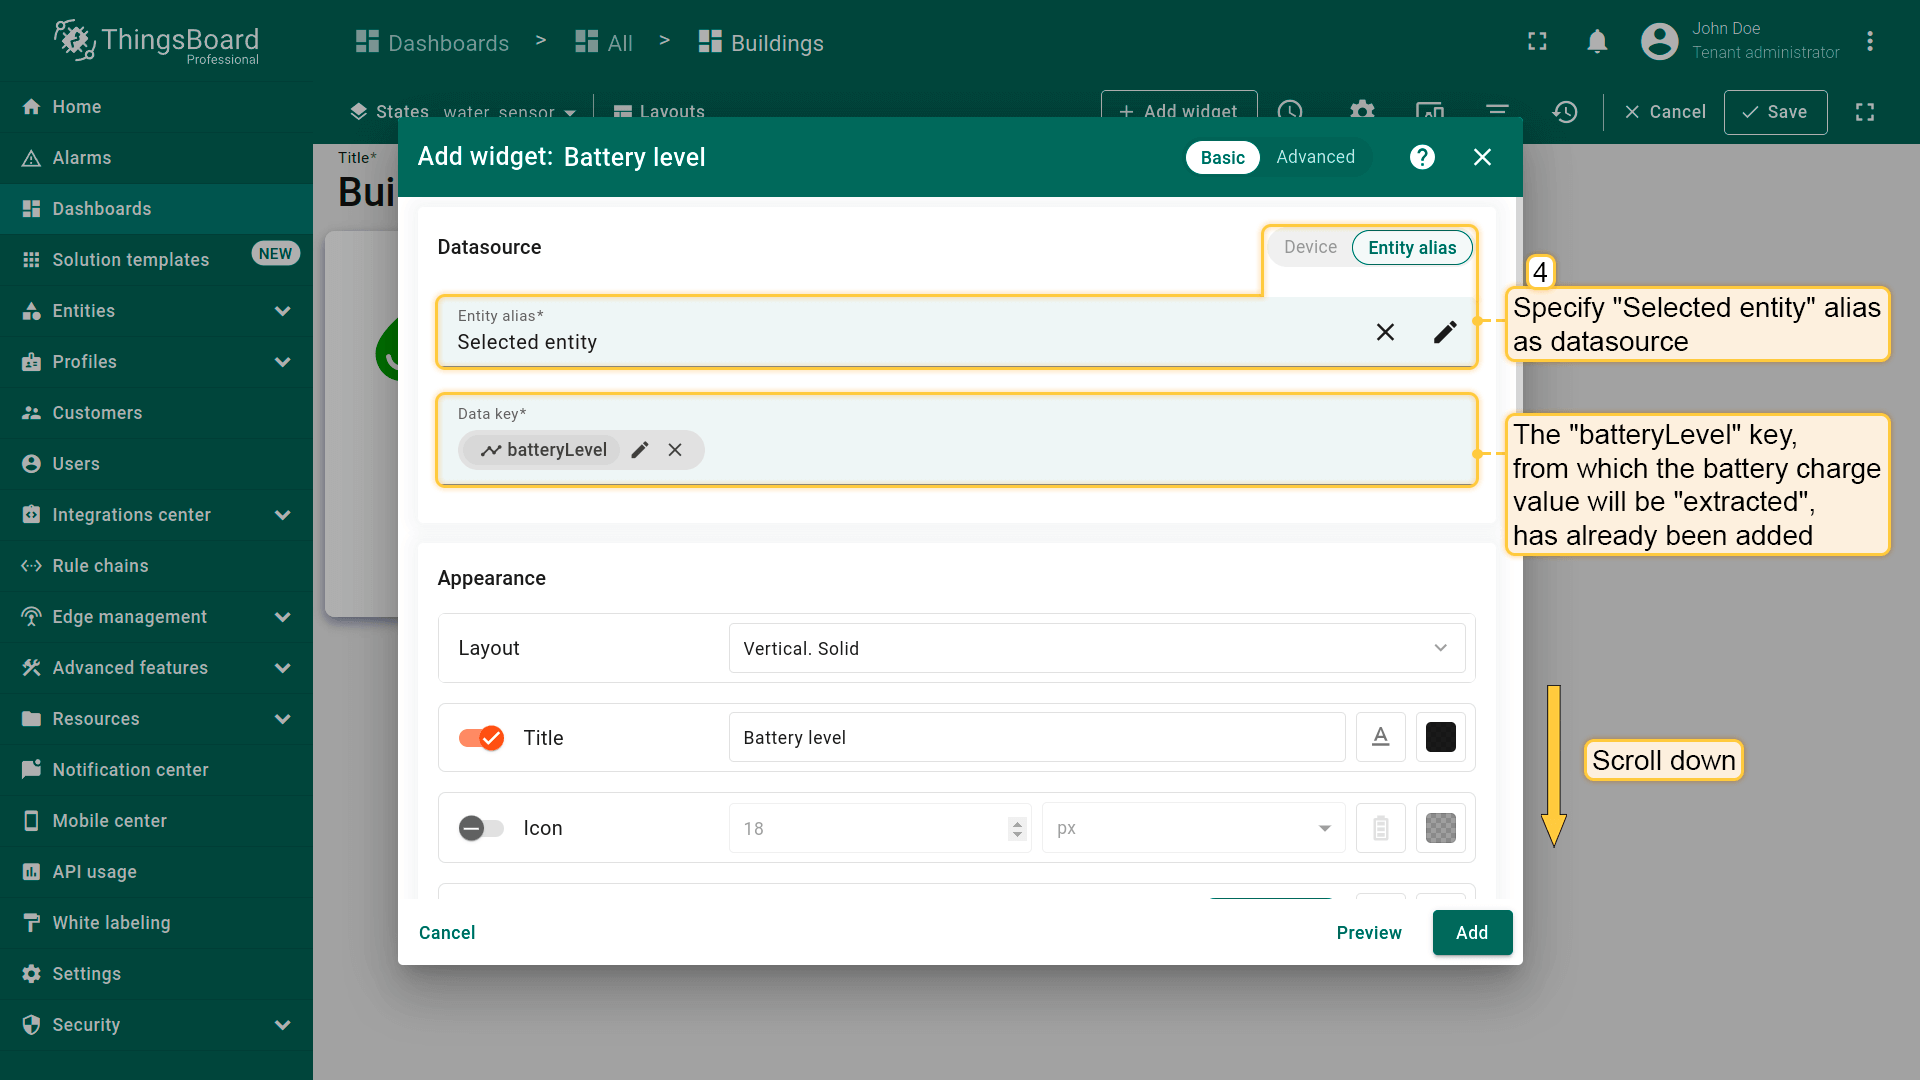
- 将「Selected entity」别名指定为数据源。「batteryLevel」键已指定为数据键;
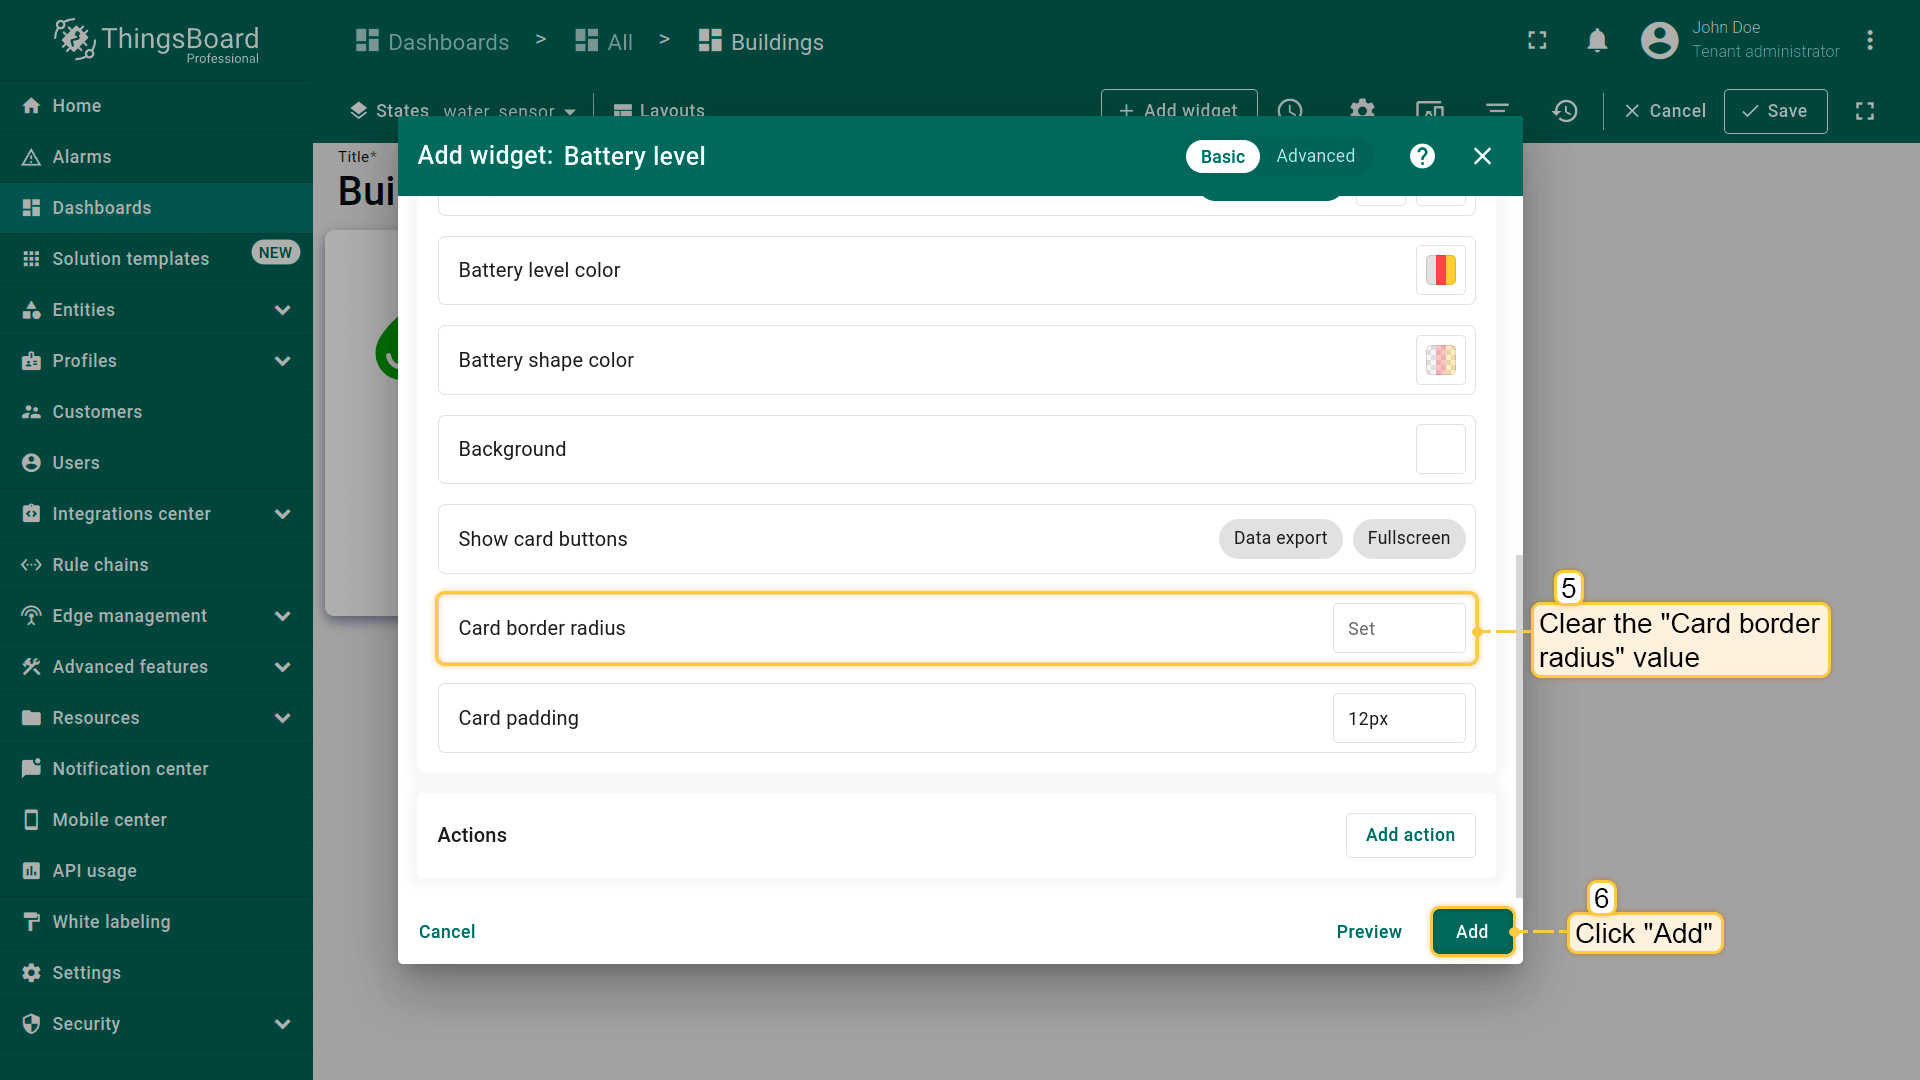
- 清空「Card border radius」值。点击「Add」;
- 将此部件放在「Water consumption history」部件右侧并调整大小。最后保存仪表板。
The state for the “Water Flow Meter” device has been configured. Monitor water consumption for the current day, track historical data on hourly water consumption, and control the battery charge level of the “Water Flow Meter” device.
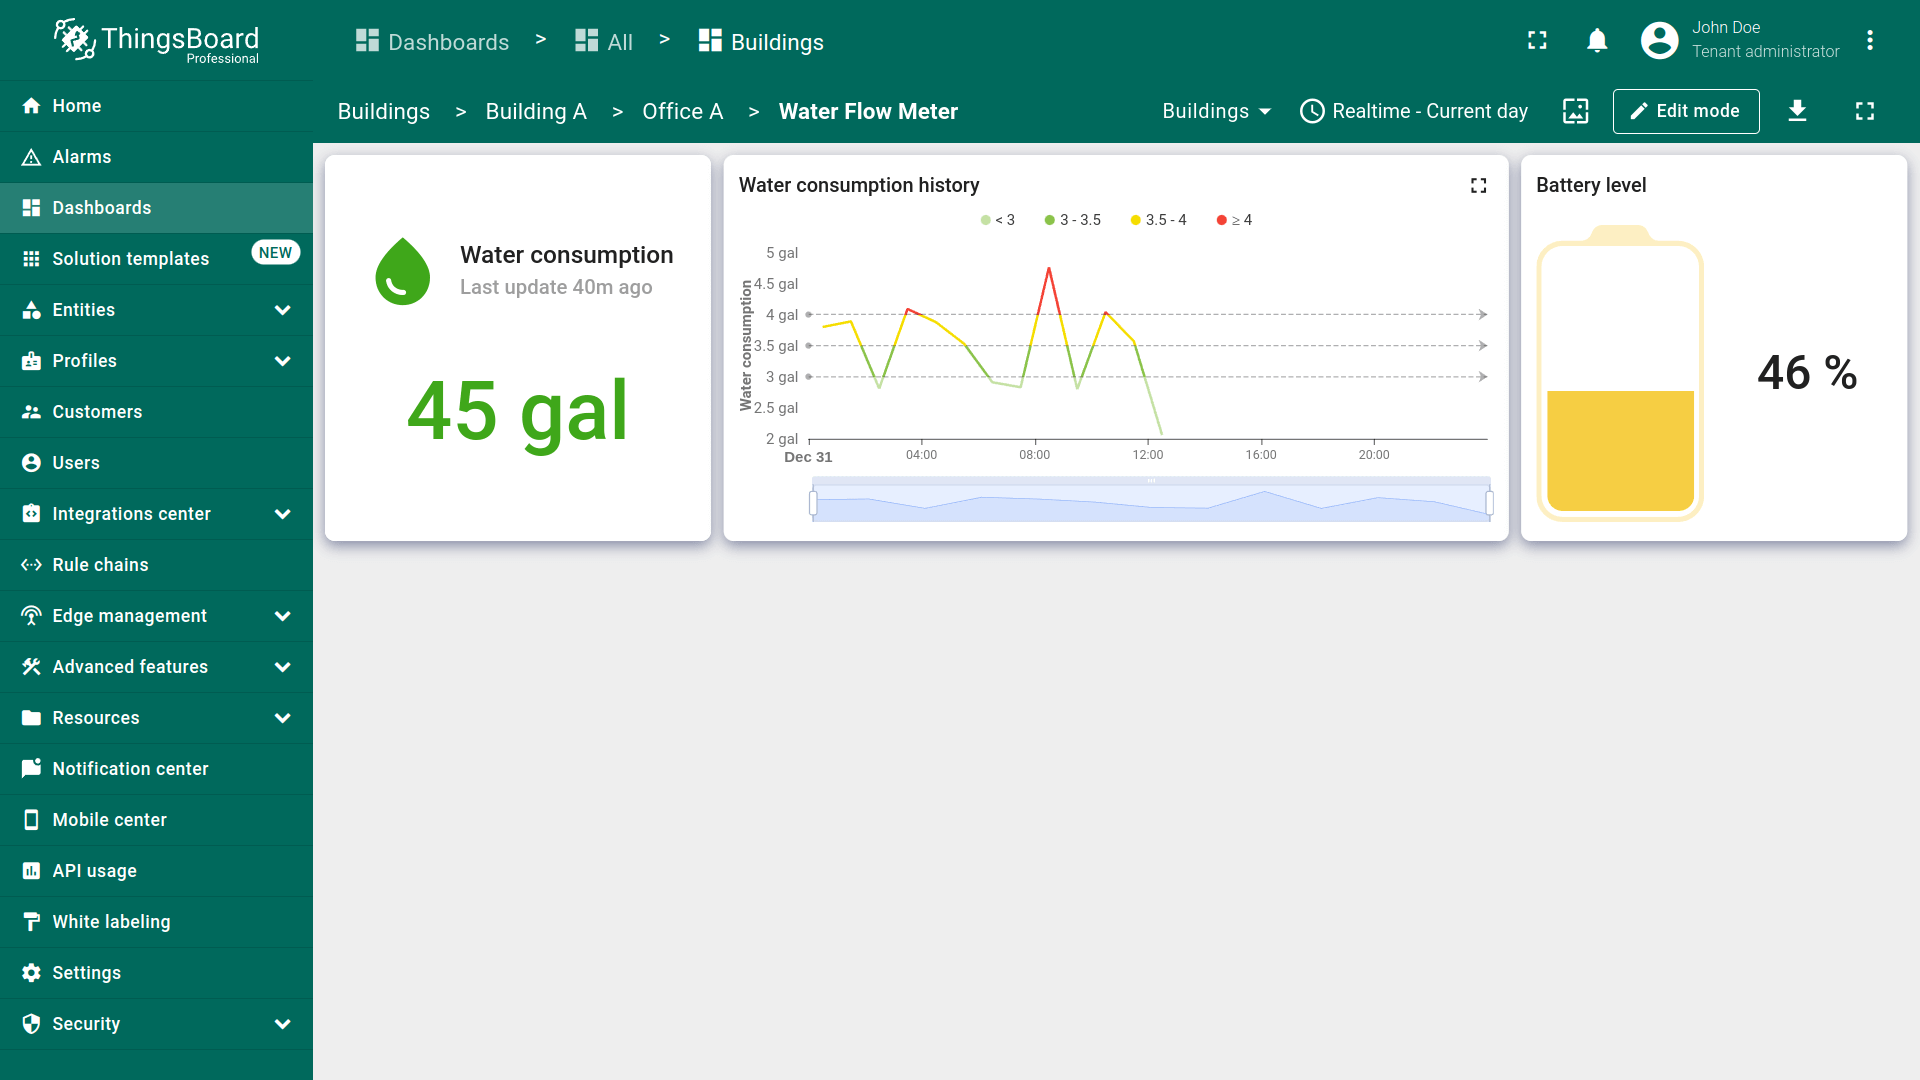
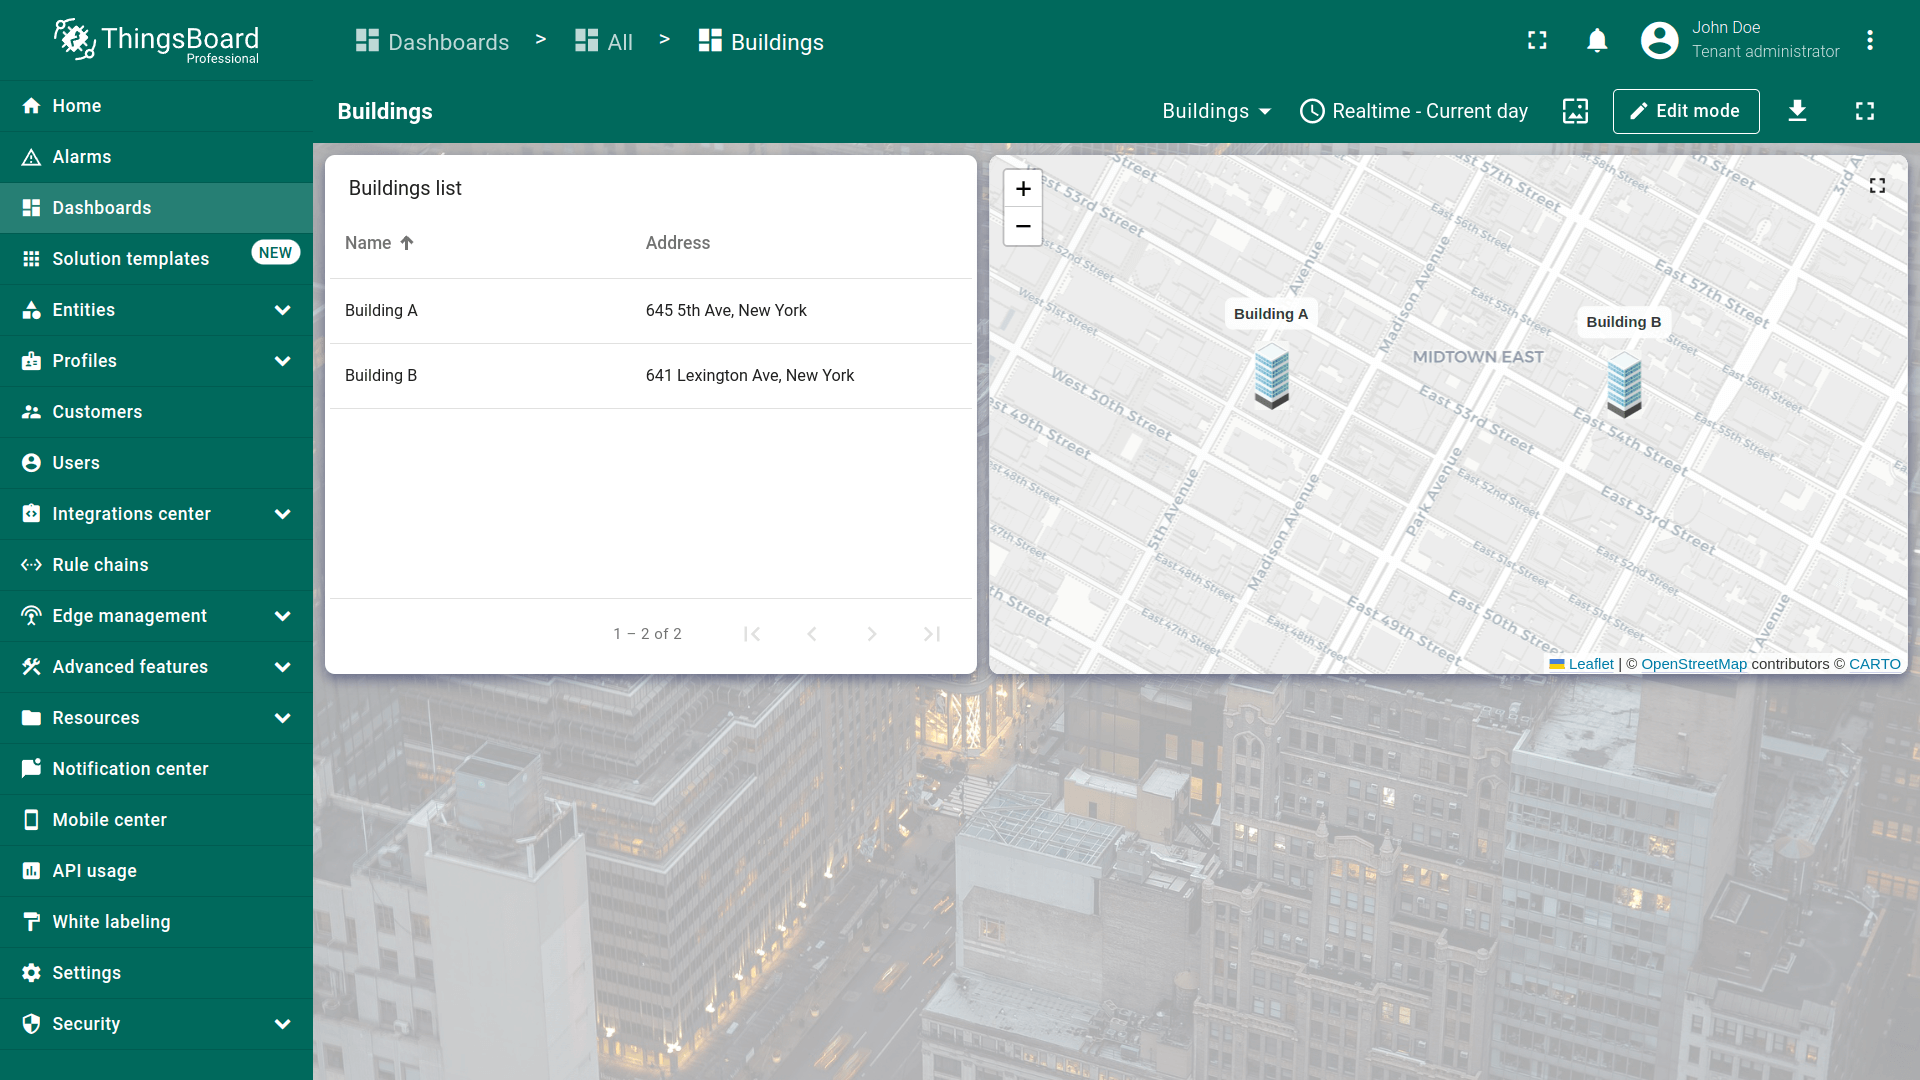
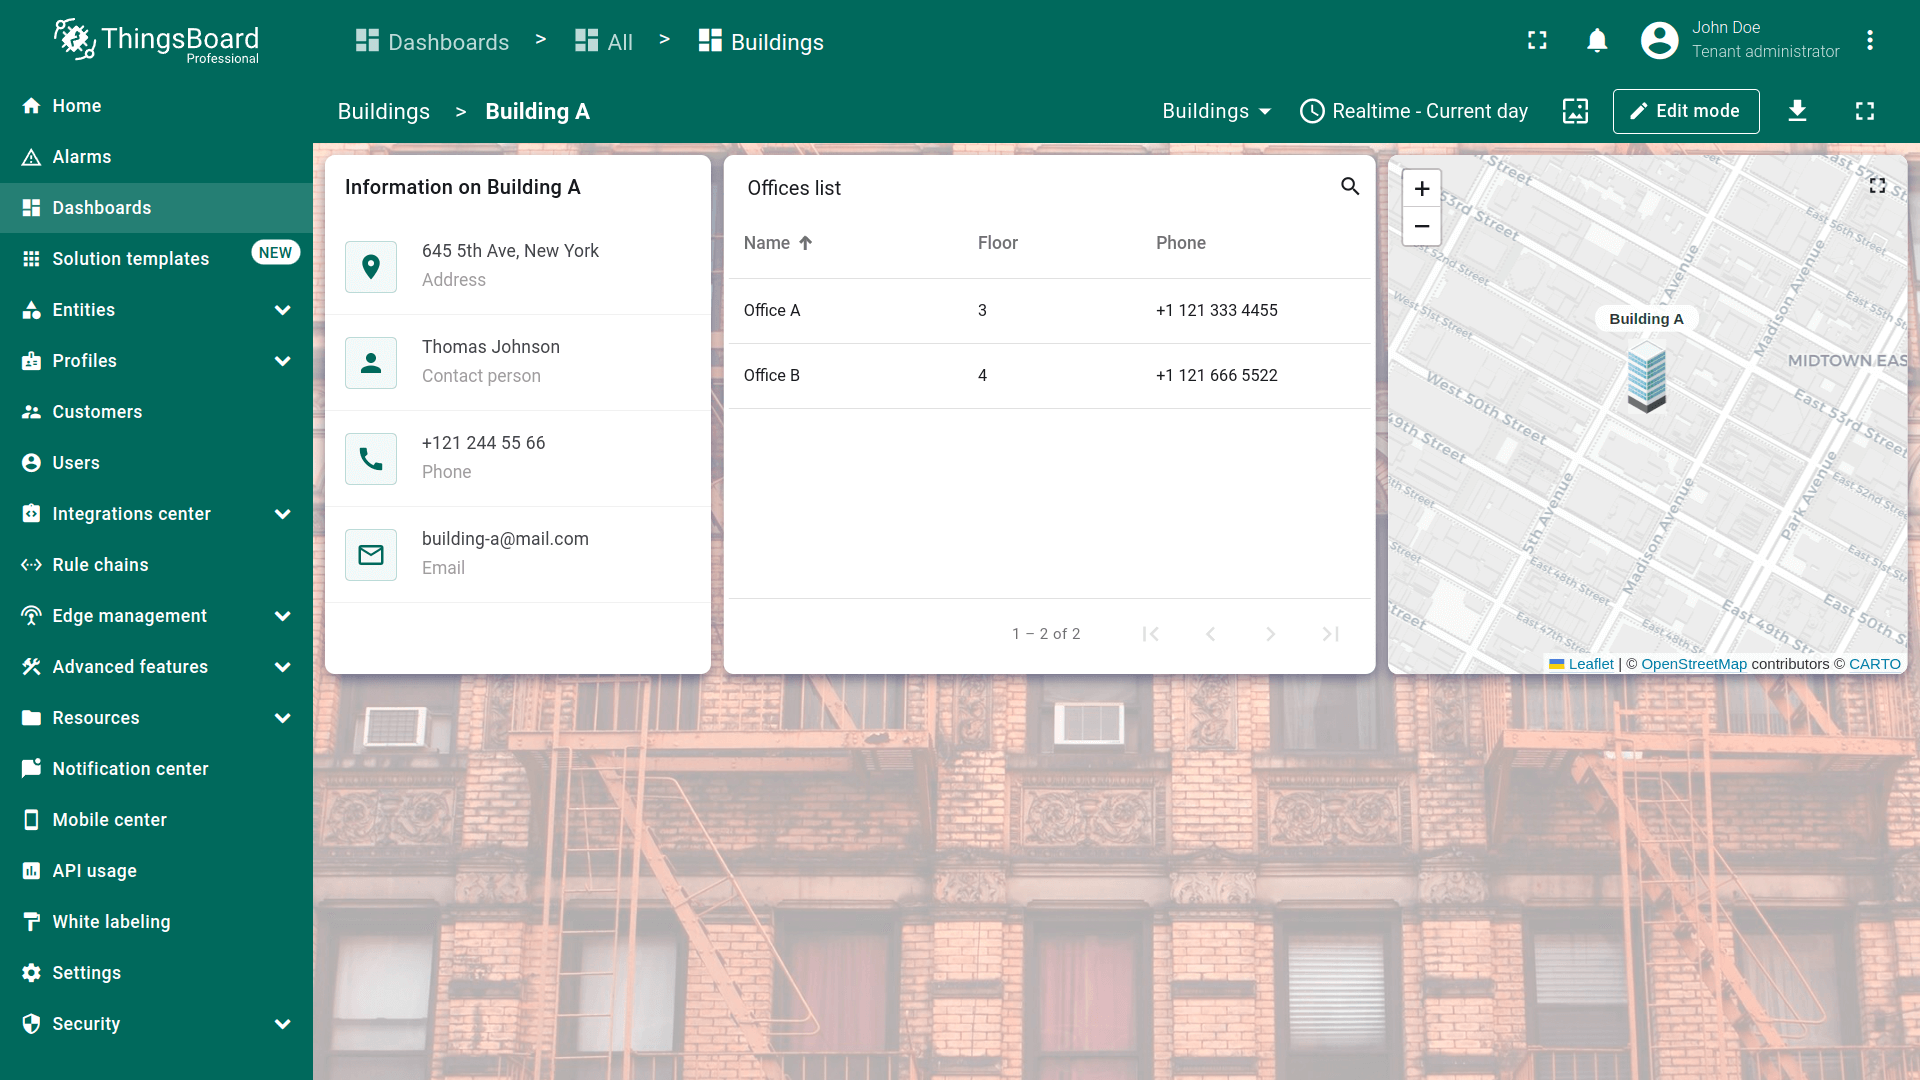
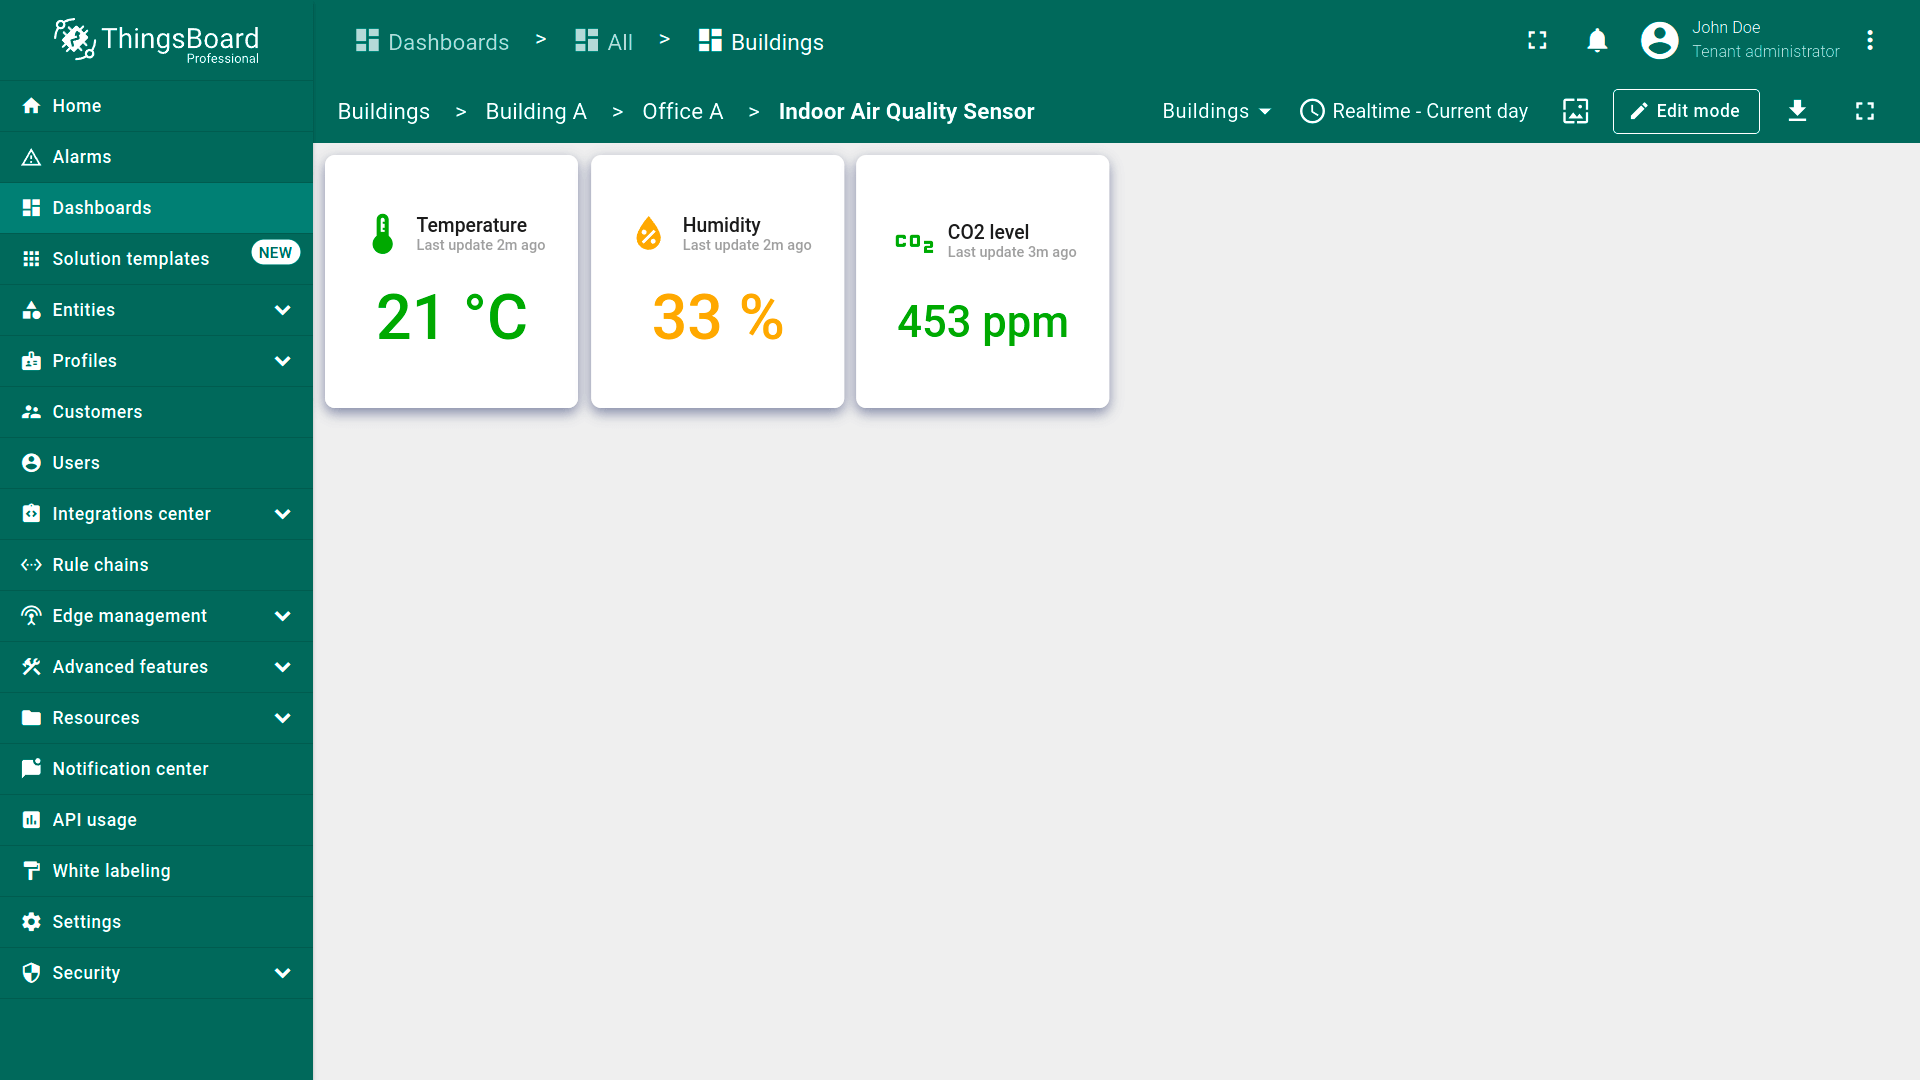
Final view of the dashboard for this lesson
Finally, your dashboard should look like this:
Next step
In the next lesson, you will learn how to configure notification rules, add the “Alarms table” widget, and manage alarm notifications. If you're ready to proceed, click the button below.