- 开始前
- Adding entities and establishing relationships between them
- Adding dashboard
- OpenStreet Map widget
- Adding Buildings list widget
- Customize the appearance of the dashboard
- Final view of the dashboard for this lesson
- Next step
在继续本指南前,建议先完成 Getting Started 指南,熟悉ThingsBoard设备和dashboards,以便更好地理解下文概念。
假设您有多栋建筑,每栋内有多个办公空间,配有监控水电气用量、CO2、温湿度的设备。 本课为该系列第一步,通过分步教程帮助您创建用于可视化和监控楼宇集成设备数据的多功能dashboard。
完成本系列后,您将能够:
- 在地图部件上展示建筑;
- 显示办公空间列表及每个的详细信息;
- 显示所选办公室内的设备列表,并在平面图上展示其布局;
- 为每台设备开发专属面板,展示实时与历史数据;
- 与客户共享dashboard。
为简化,我们将聚焦Building A的一间办公室,配备智能设备监控能耗与环境条件。
从基础开始:添加新实体、建立相互关系,并在OpenStreet Map与Entities table部件中展示建筑。 完成本指南后,您的dashboard将类似如下:
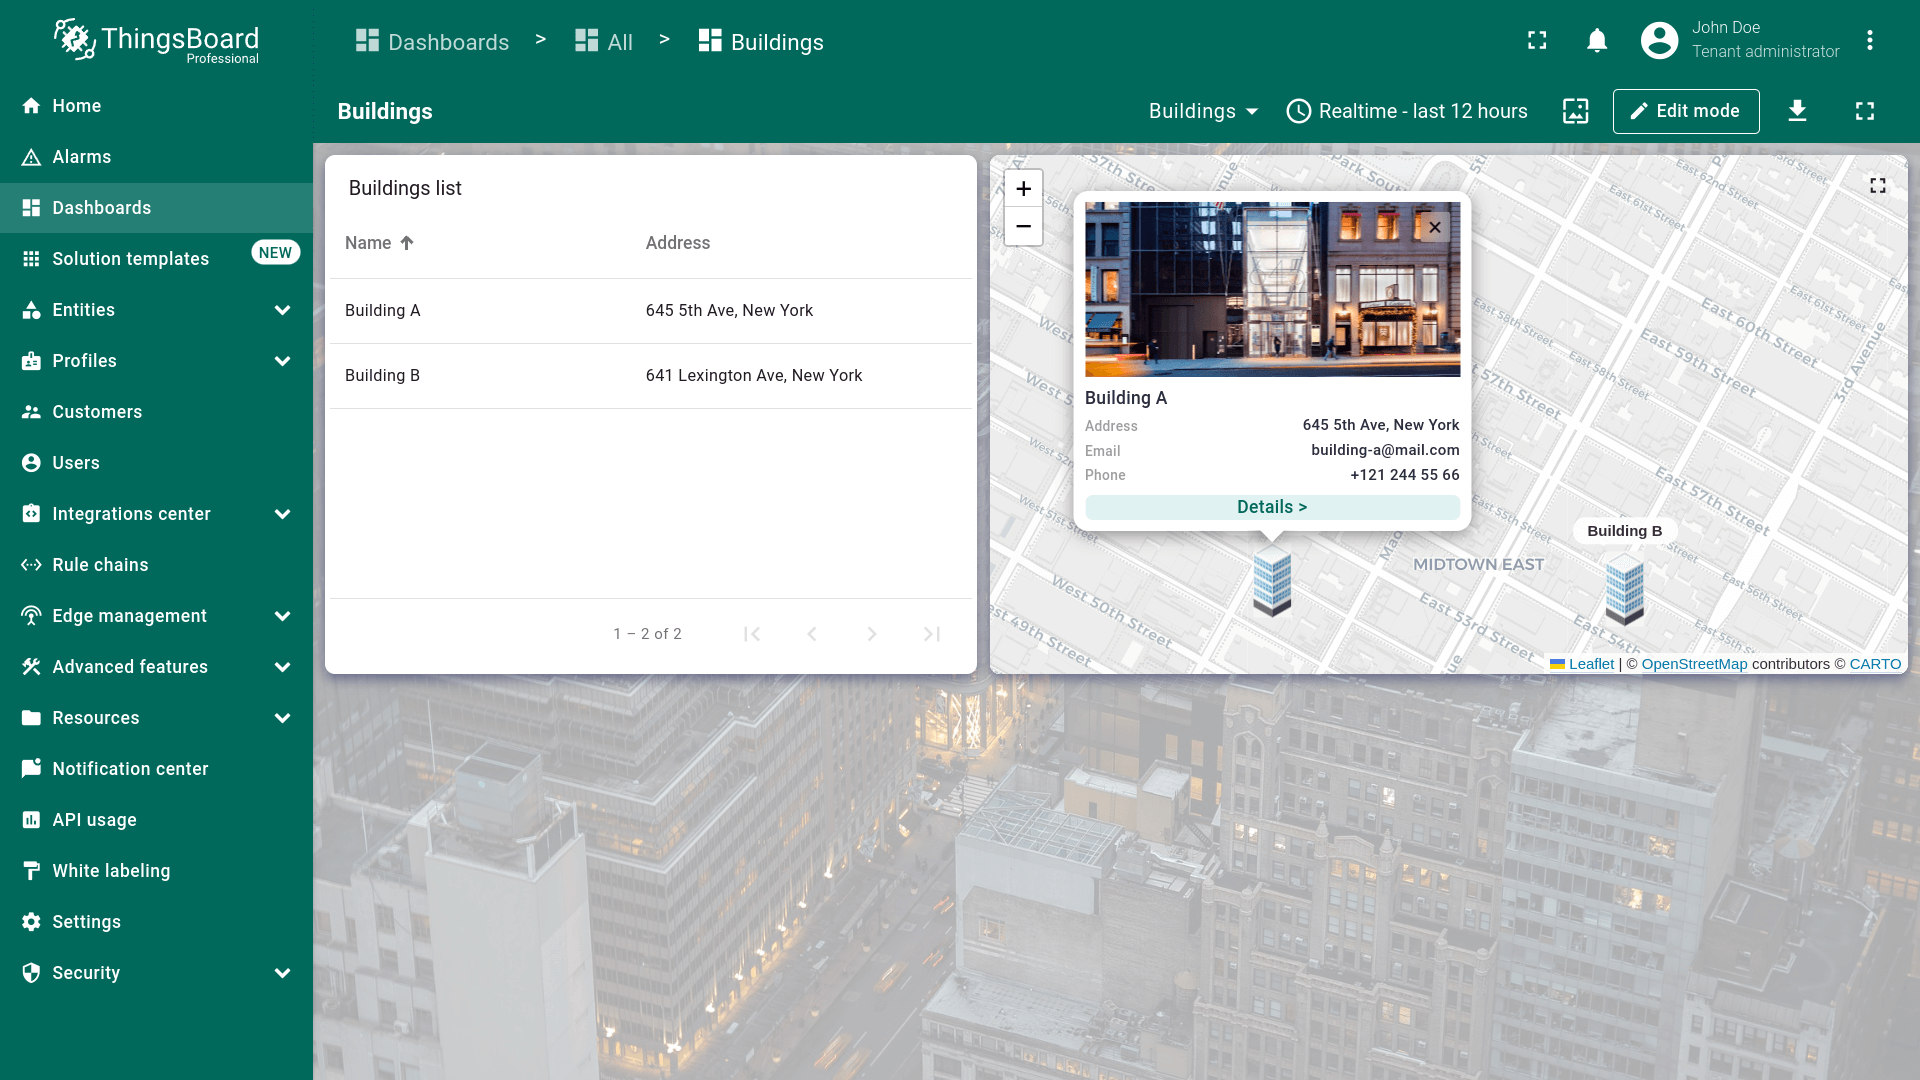
开始前
只需一个 ThingsBoard Cloud 账号。可注册账号,无需信用卡,永久免费。
Adding entities and establishing relationships between them
在添加和配置dashboard前,需先添加若干实体,即assets和devices。 Assets代表建筑和办公室,devices代表传感器。
Adding assets
Assets 为可与其它assets和devices关联的抽象IoT实体。
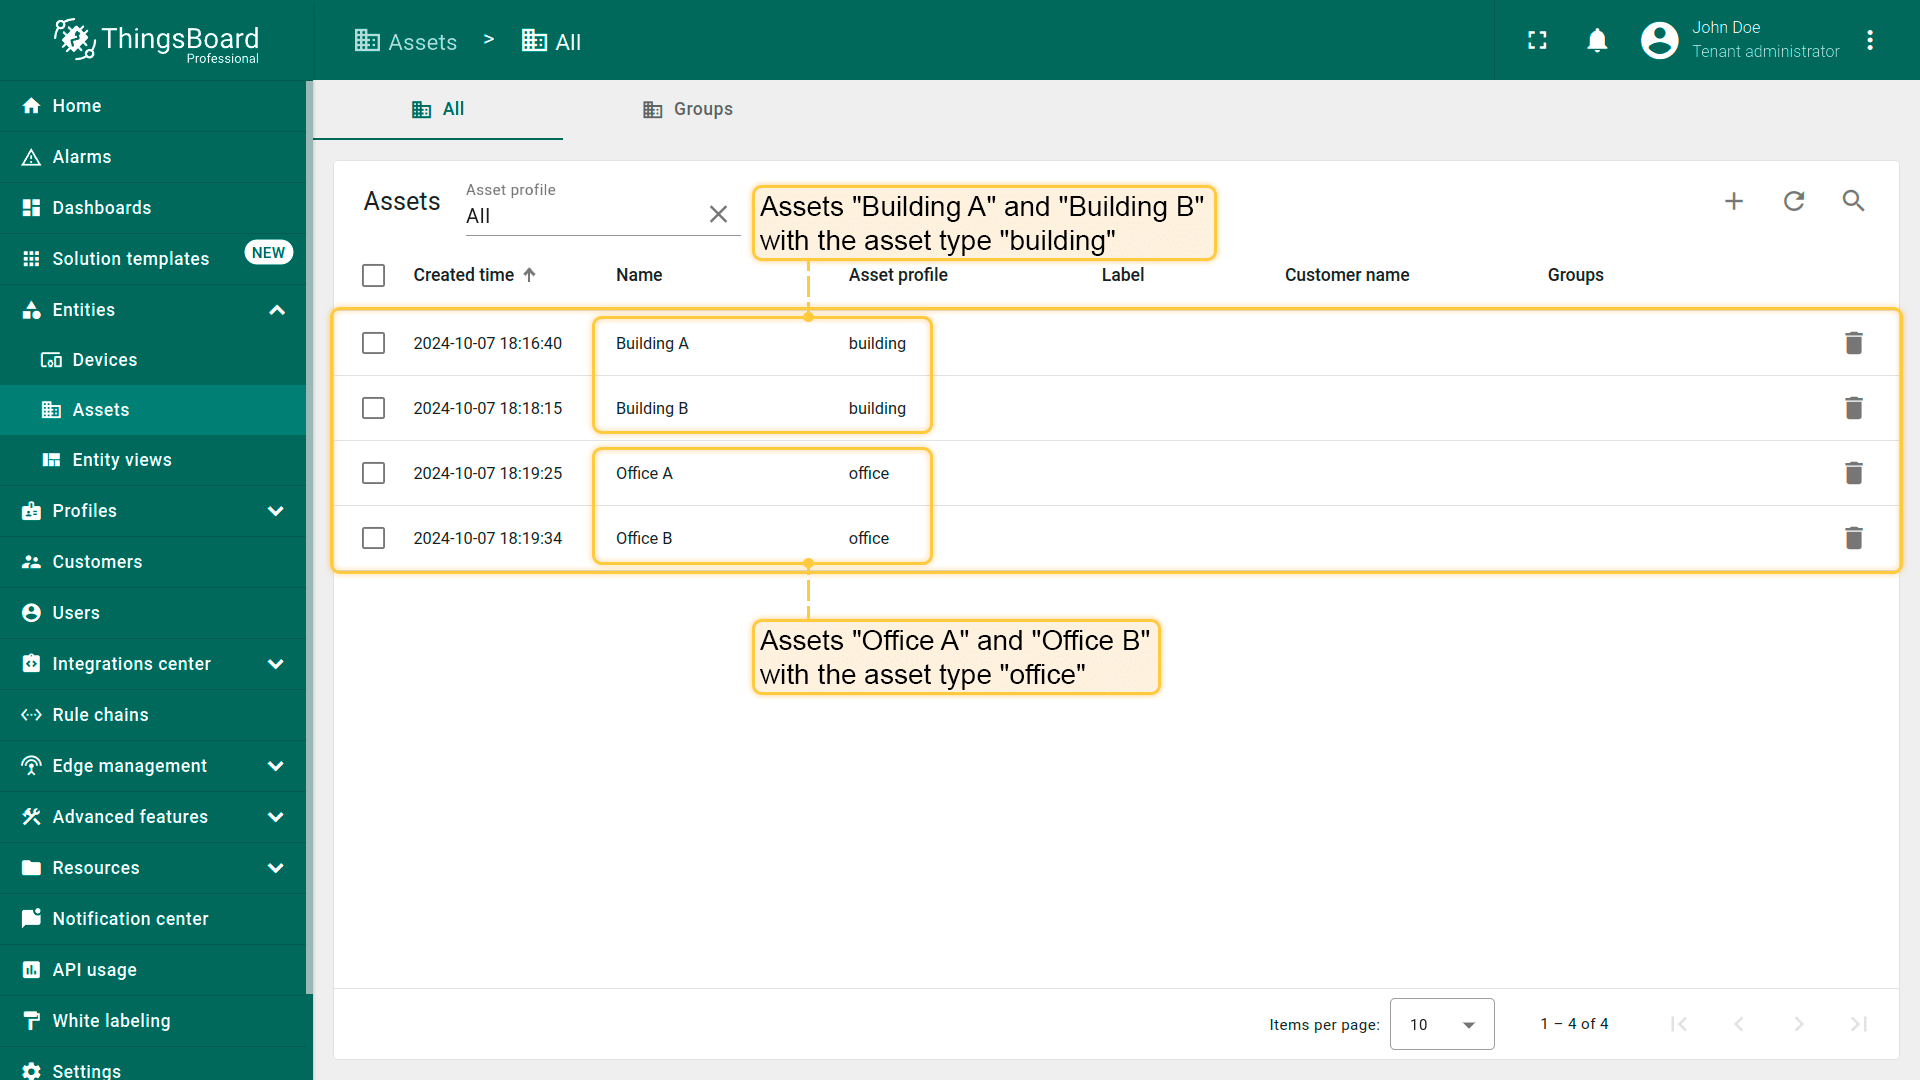
本教程中,我们将创建两个代表建筑的assets:Building A 与 Building B,以及两个代表办公空间的assets:Office A 与 Office B。 开始操作。
- 以 Tenant Administrator 登录ThingsBoard;
- 进入侧边栏 “Entities” 下的 “Assets” 页面。默认会进入 “All” 设备组,我们先在此组添加assets;
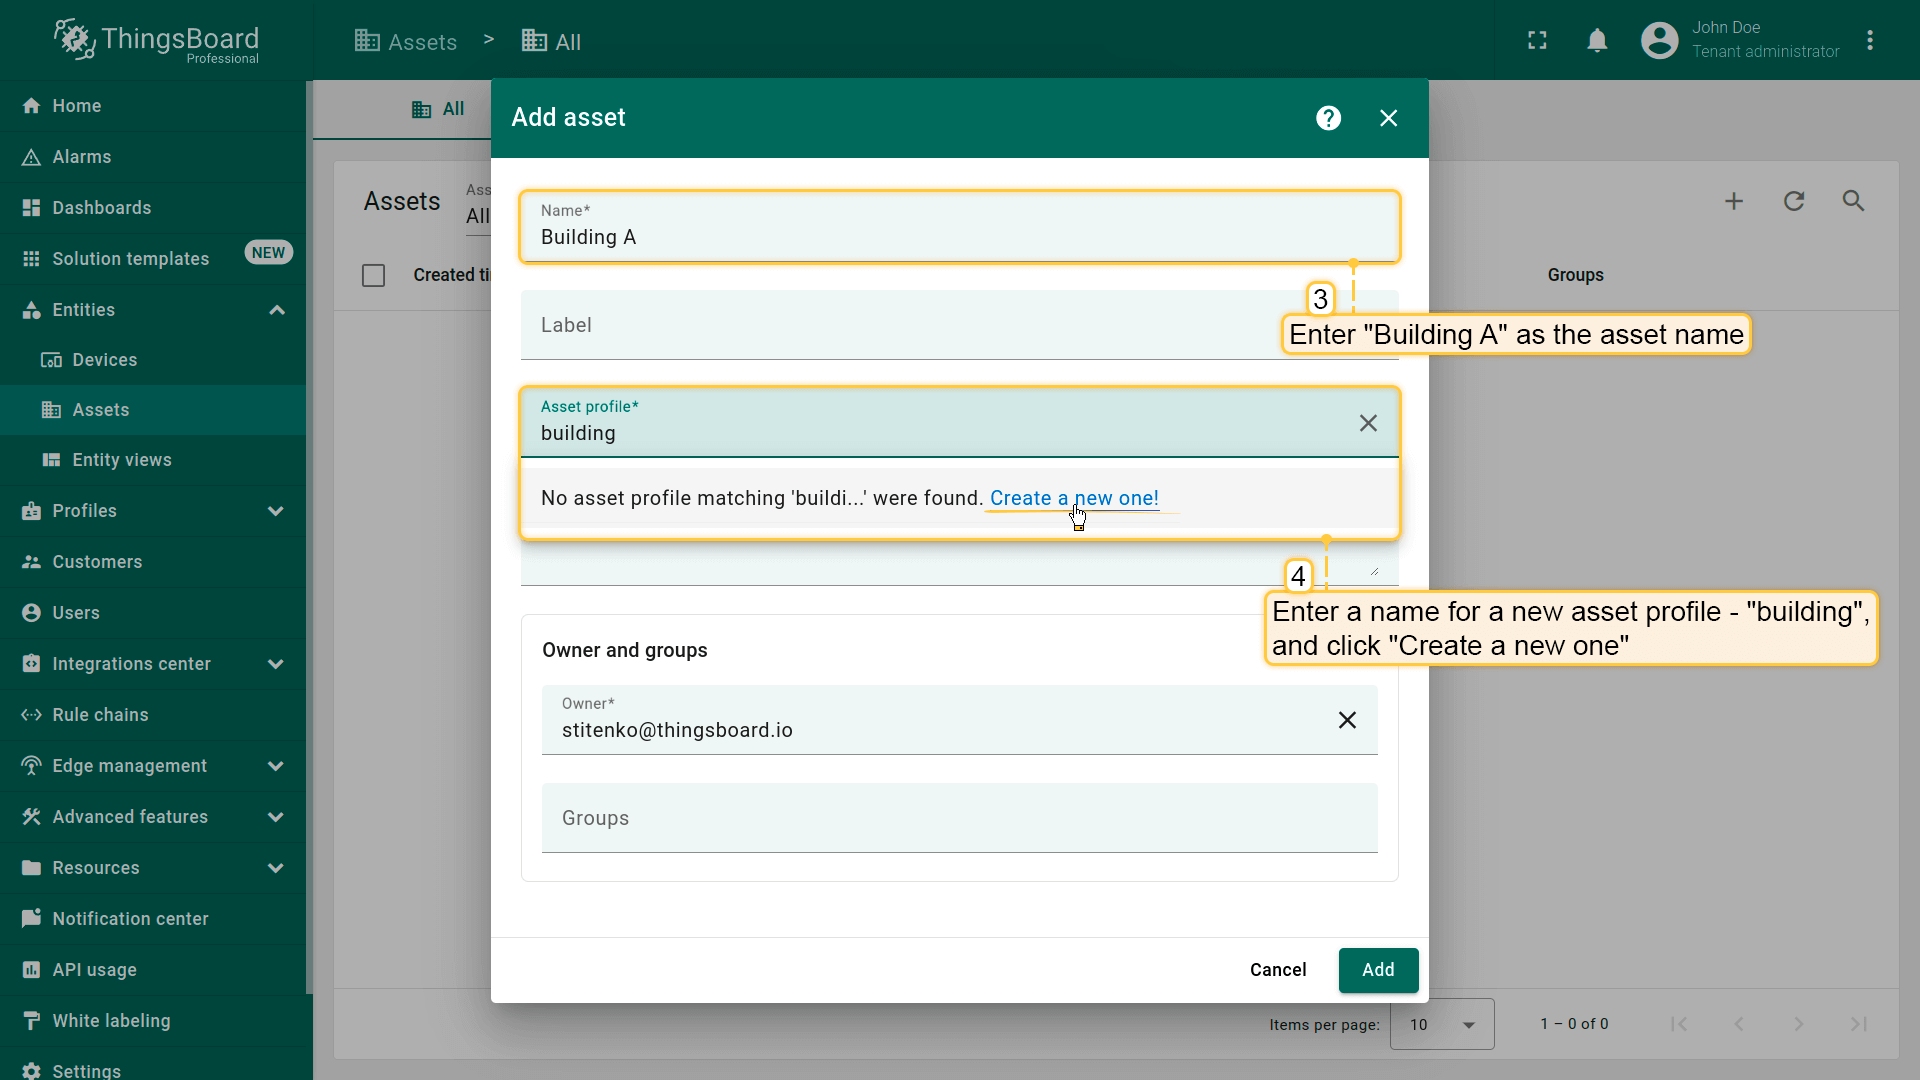
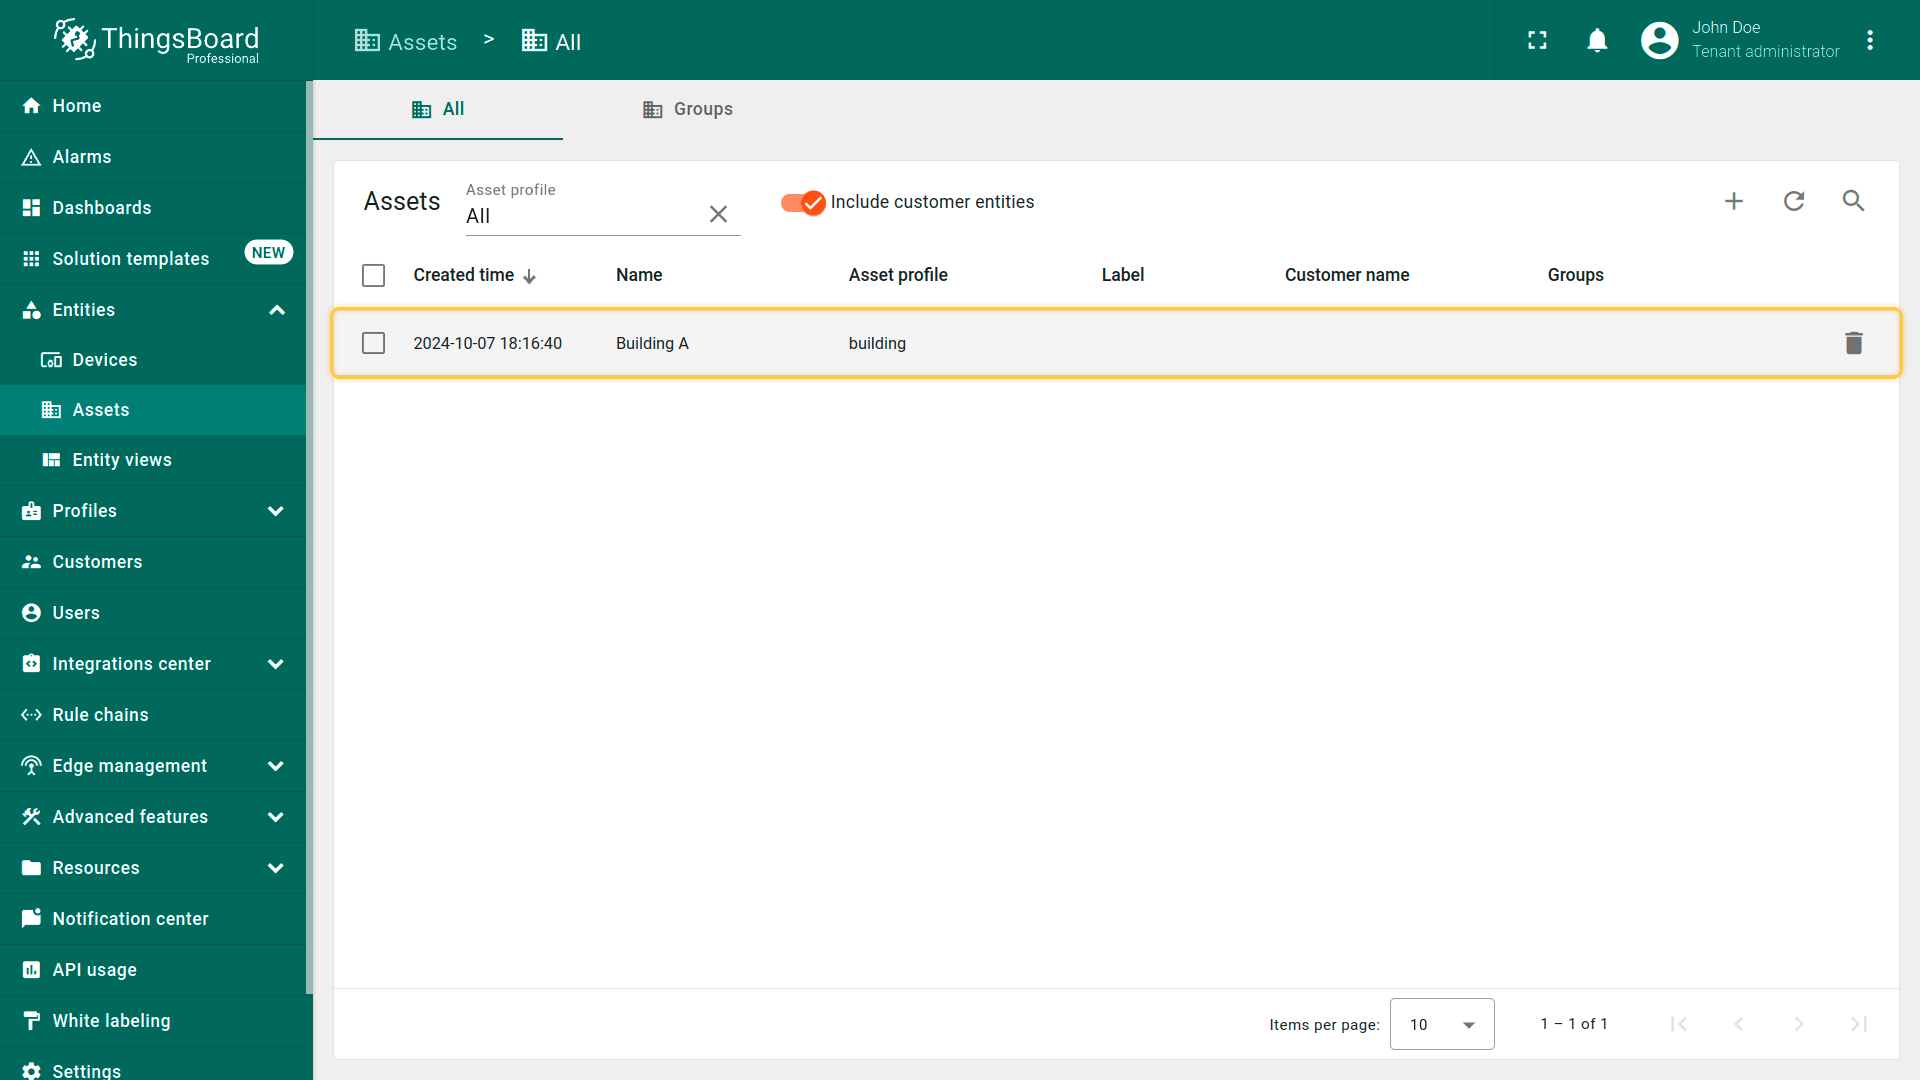
- 点击表格右上角 “plus” 图标,在下拉菜单中选择 “Add new asset” 开始添加第一个asset;
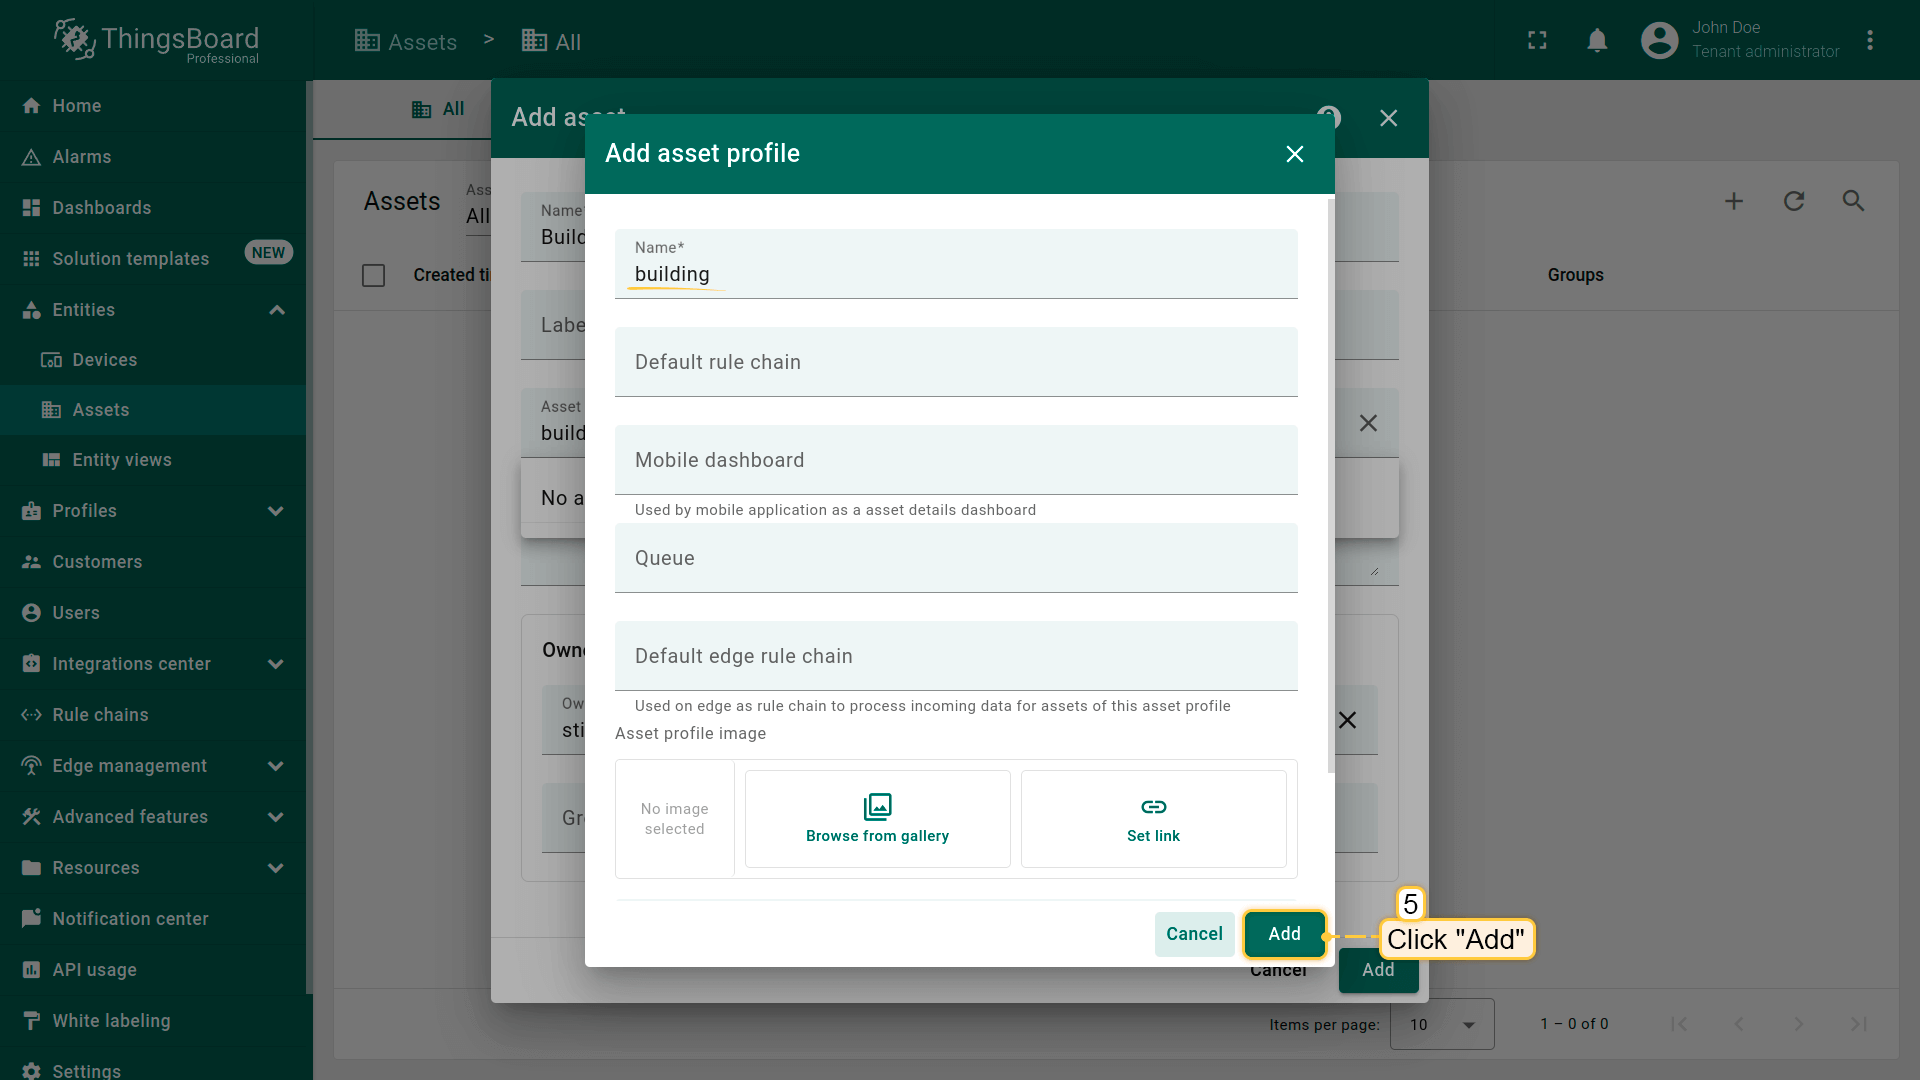
- 在asset名称字段输入 “Building A”。在 “Asset profile” 区域输入 “building”,点击 “Create a new one!” 为该asset新建profile;
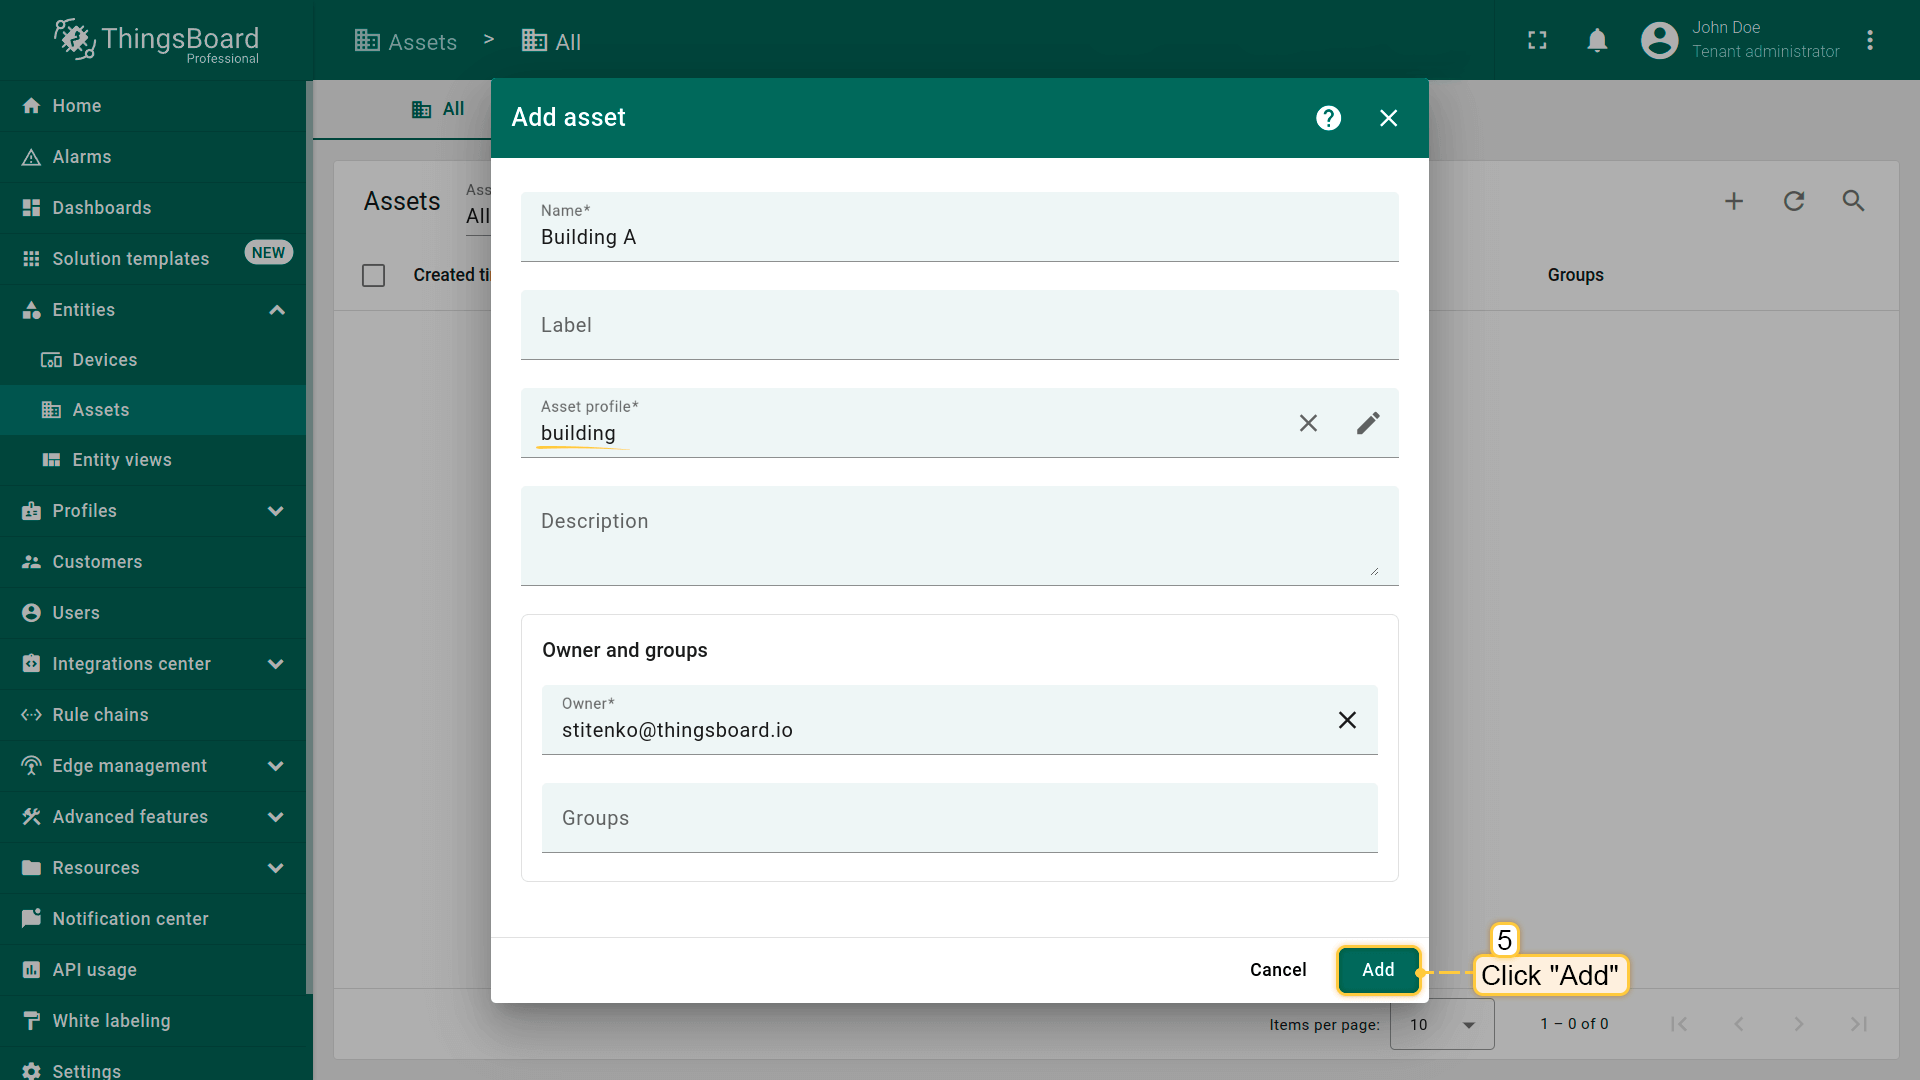
- 点击 “Add” 确认asset profile创建;
- 再点击 “Add” 完成asset添加。
恭喜,您已添加第一个asset。

同样添加asset “Building B”。再添加asset type为 “office” 的 “Office A” 和 “Office B”。
Adding devices
Devices 是采集环境数据并上传到ThingsBoard,同时响应Remote Procedure Call (RPC) 命令的基础IoT对象。
可像assets一样手动添加devices。ThingsBoard也支持通过CSV对devices(和assets)进行 bulk provisioning,批量添加实体时非常方便。
本教程需添加四台设备:Indoor Air Quality Sensor、Energy Meter、Water Flow Meter、IAQ Sensor。后续将用模拟器模拟这些设备向ThingsBoard发送telemetry。 开始操作:
- 创建CSV文件或 下载预置文件,每行对应创建一台带指定参数的设备:
| Name | Type | Label |
|---|---|---|
| SD-001 | air-sensor | Indoor Air Quality Sensor |
| EM-002 | energy-sensor | Energy Meter |
| WM-003 | water-sensor | Water Flow Meter |
| AM-307 | air-sensor | IAQ Sensor |
CSV文件应类似如下:
1
2
3
4
5
name,type,label
SD-001,air-sensor,Indoor Air Quality Sensor
EM-002,energy-sensor,Energy Meter
WM-003,water-sensor,Water Flow Meter
AM-307,air-sensor,IAQ Sensor
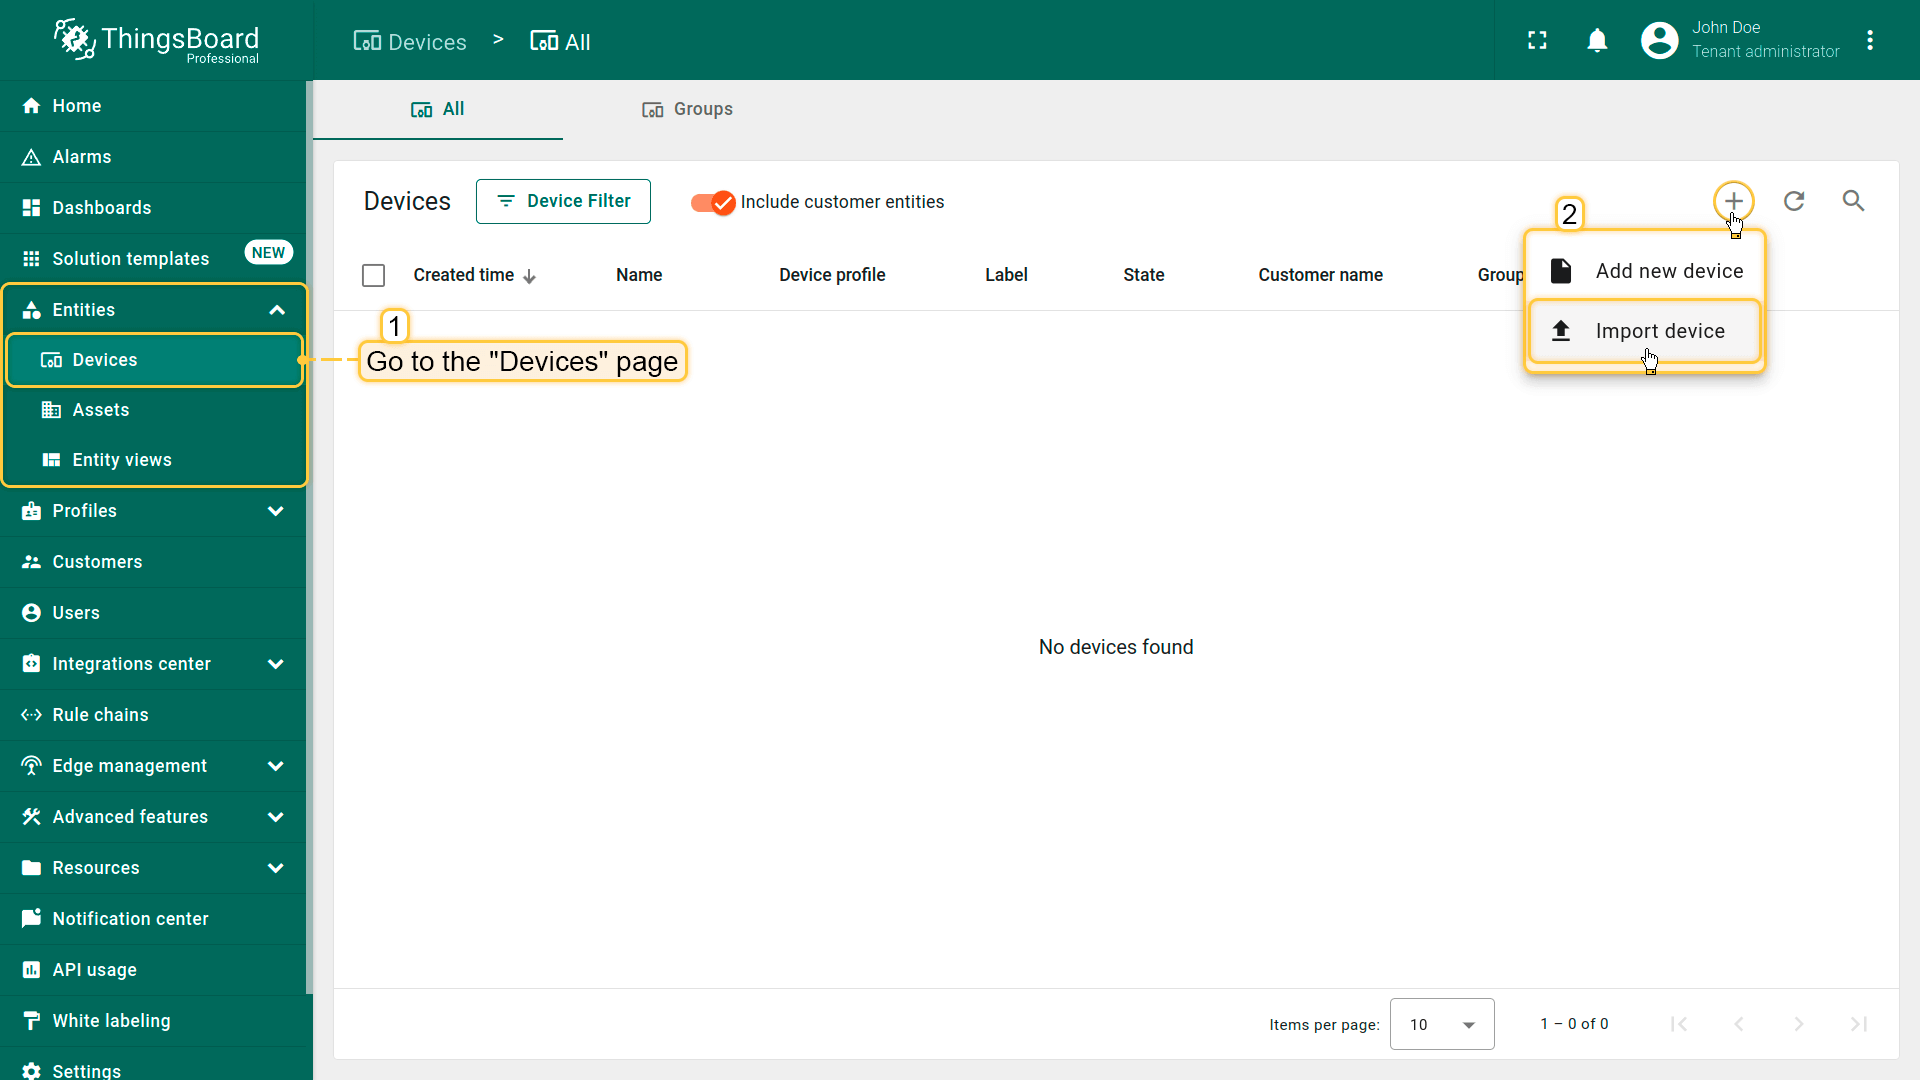
- 进入侧边栏 “Entities” 下的 “Devices” 页面。默认会进入 “All” 设备组;
- 点击表格右上角 “plus” 图标,在下拉菜单中选择 “Import device”;
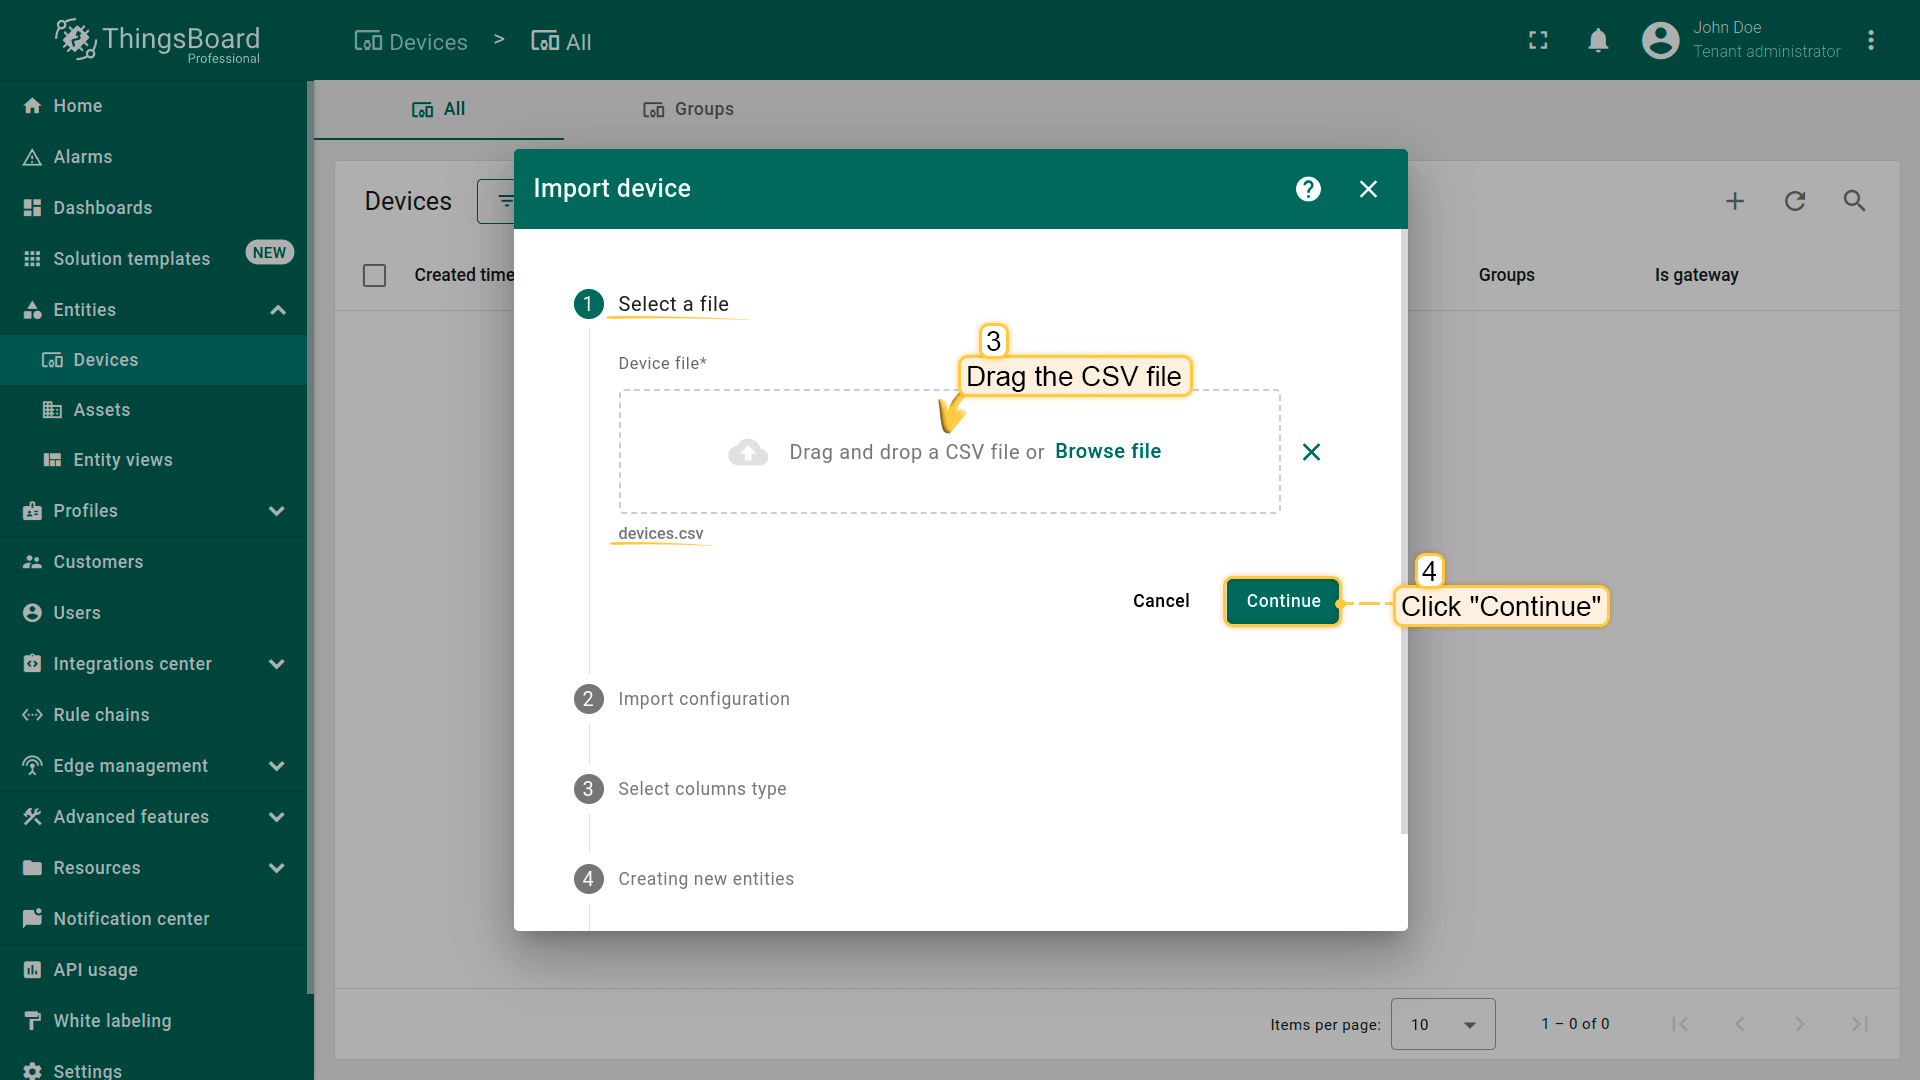
- 将CSV文件拖入导入窗口,点击 “Continue”;
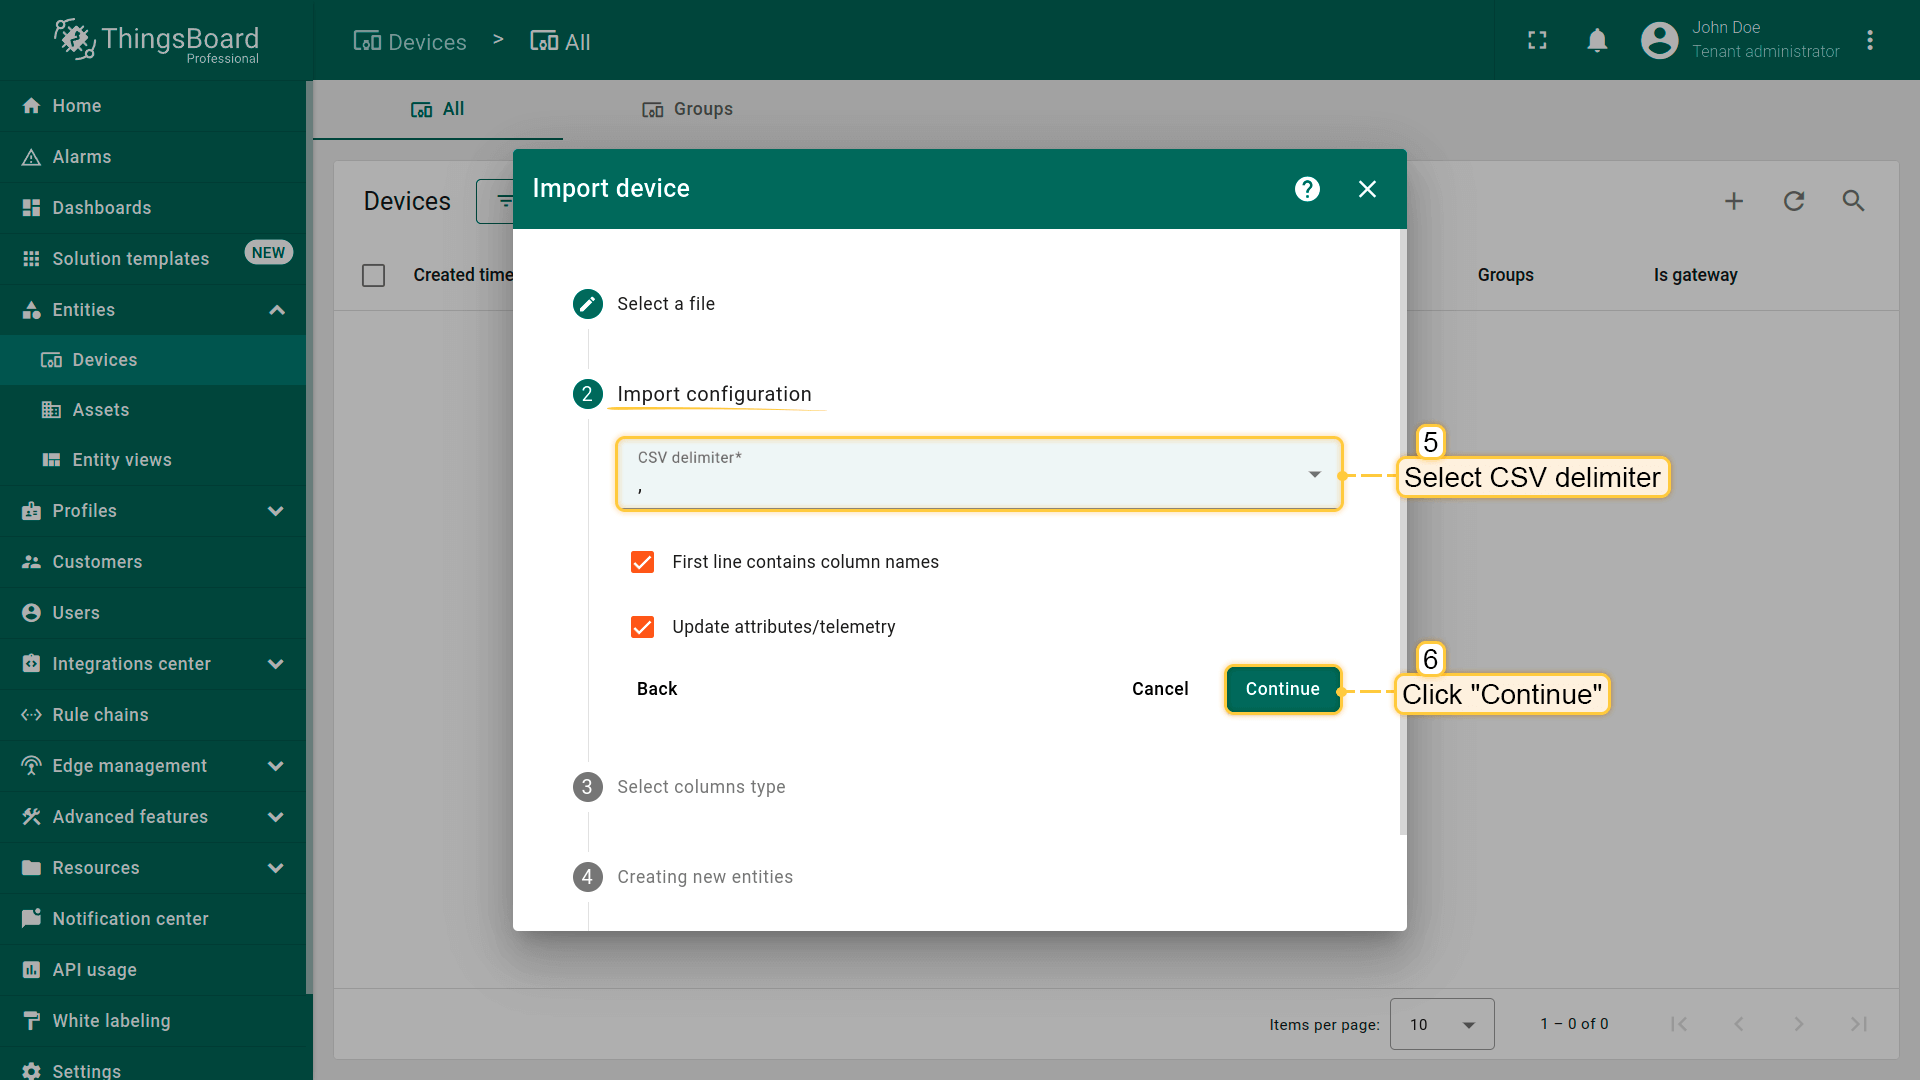
- 选择CSV分隔符,点击 “Continue”;
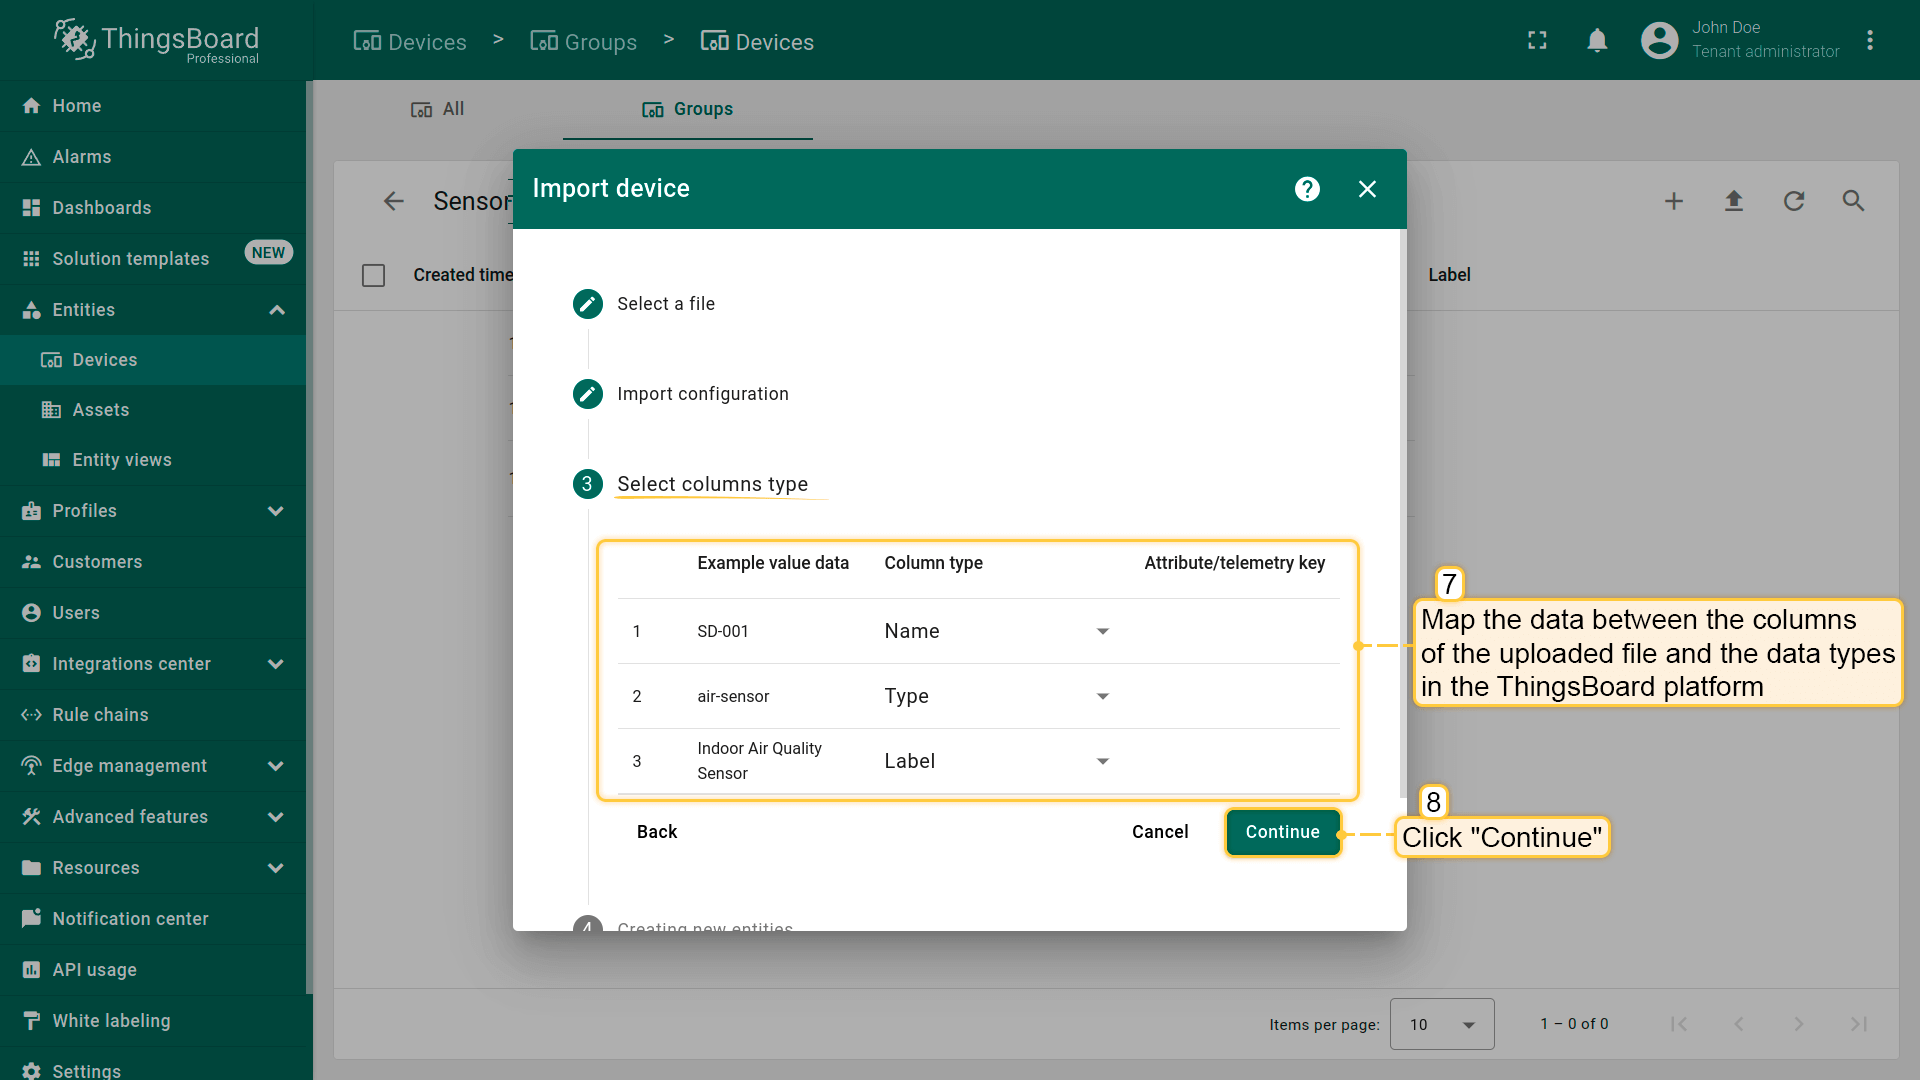
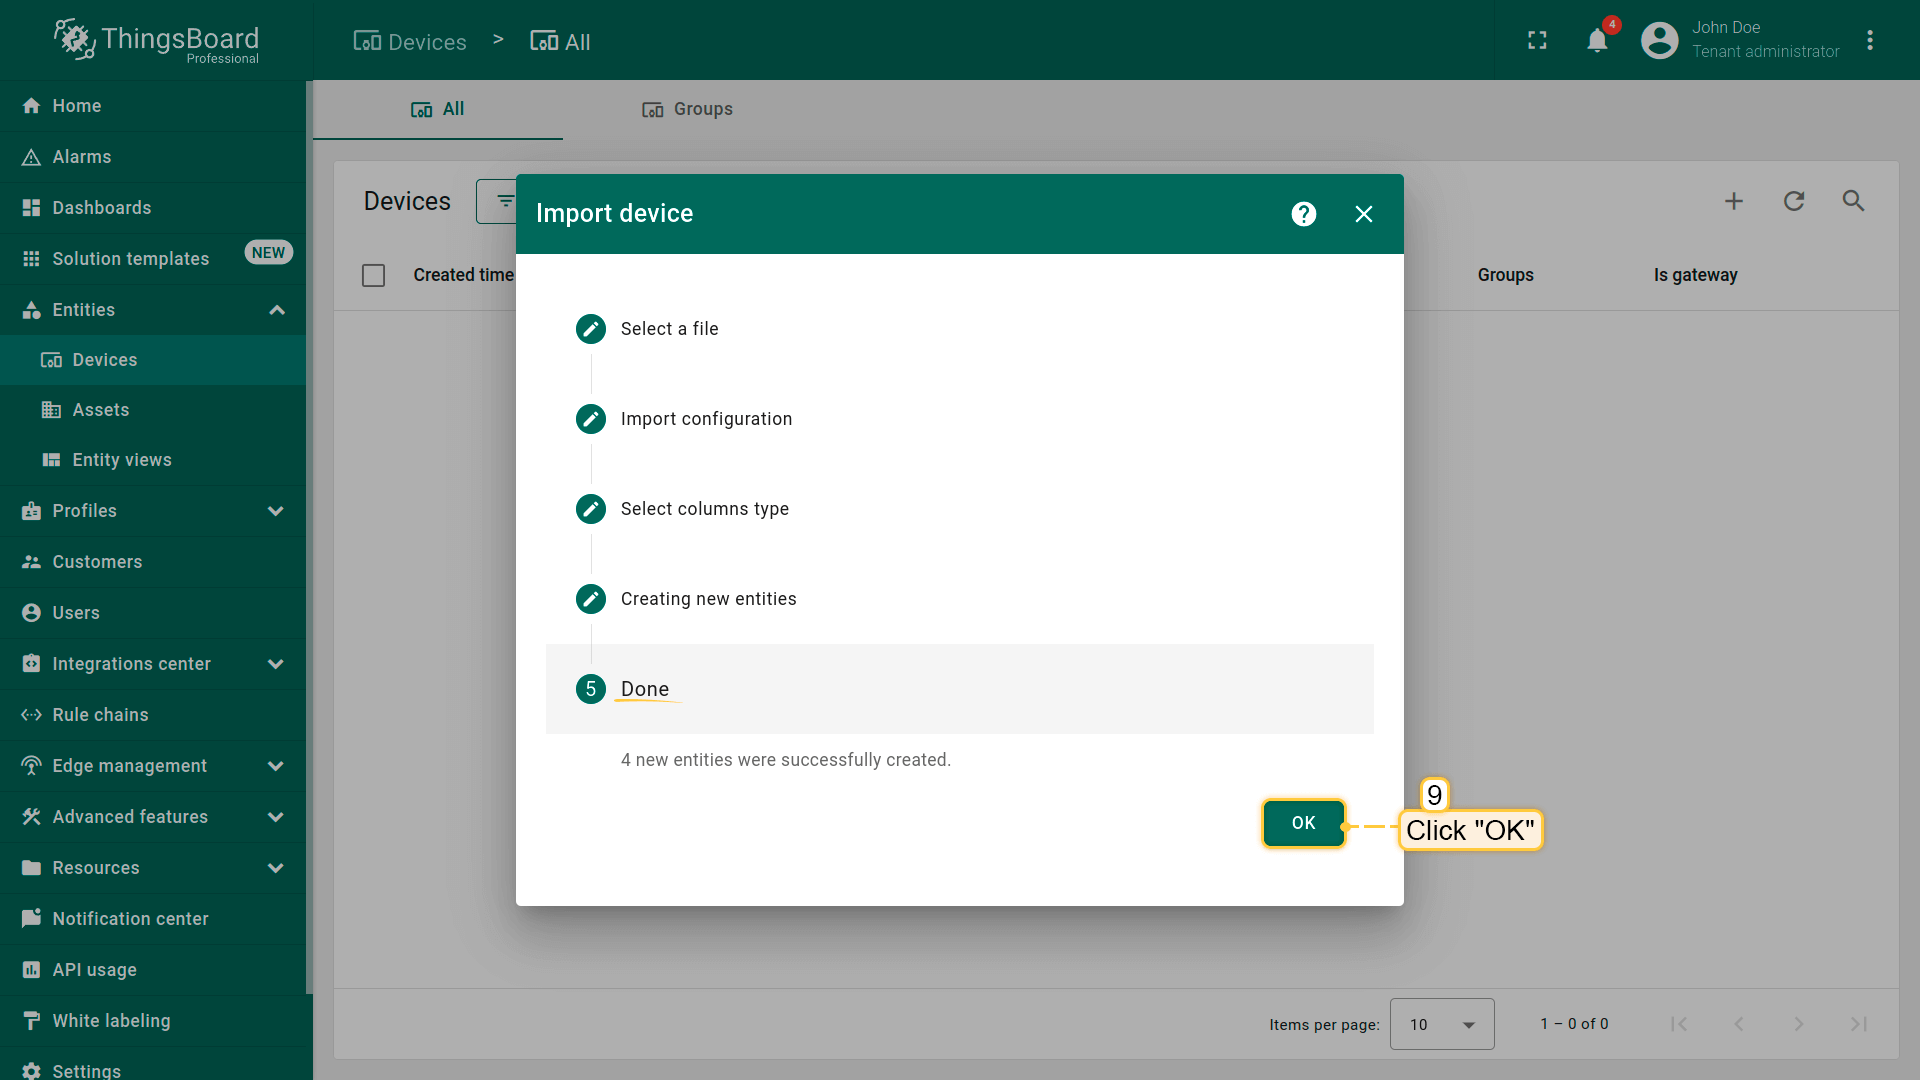
- 将上传文件列与ThingsBoard数据类型映射,点击 “Continue”,再点击 “OK”。
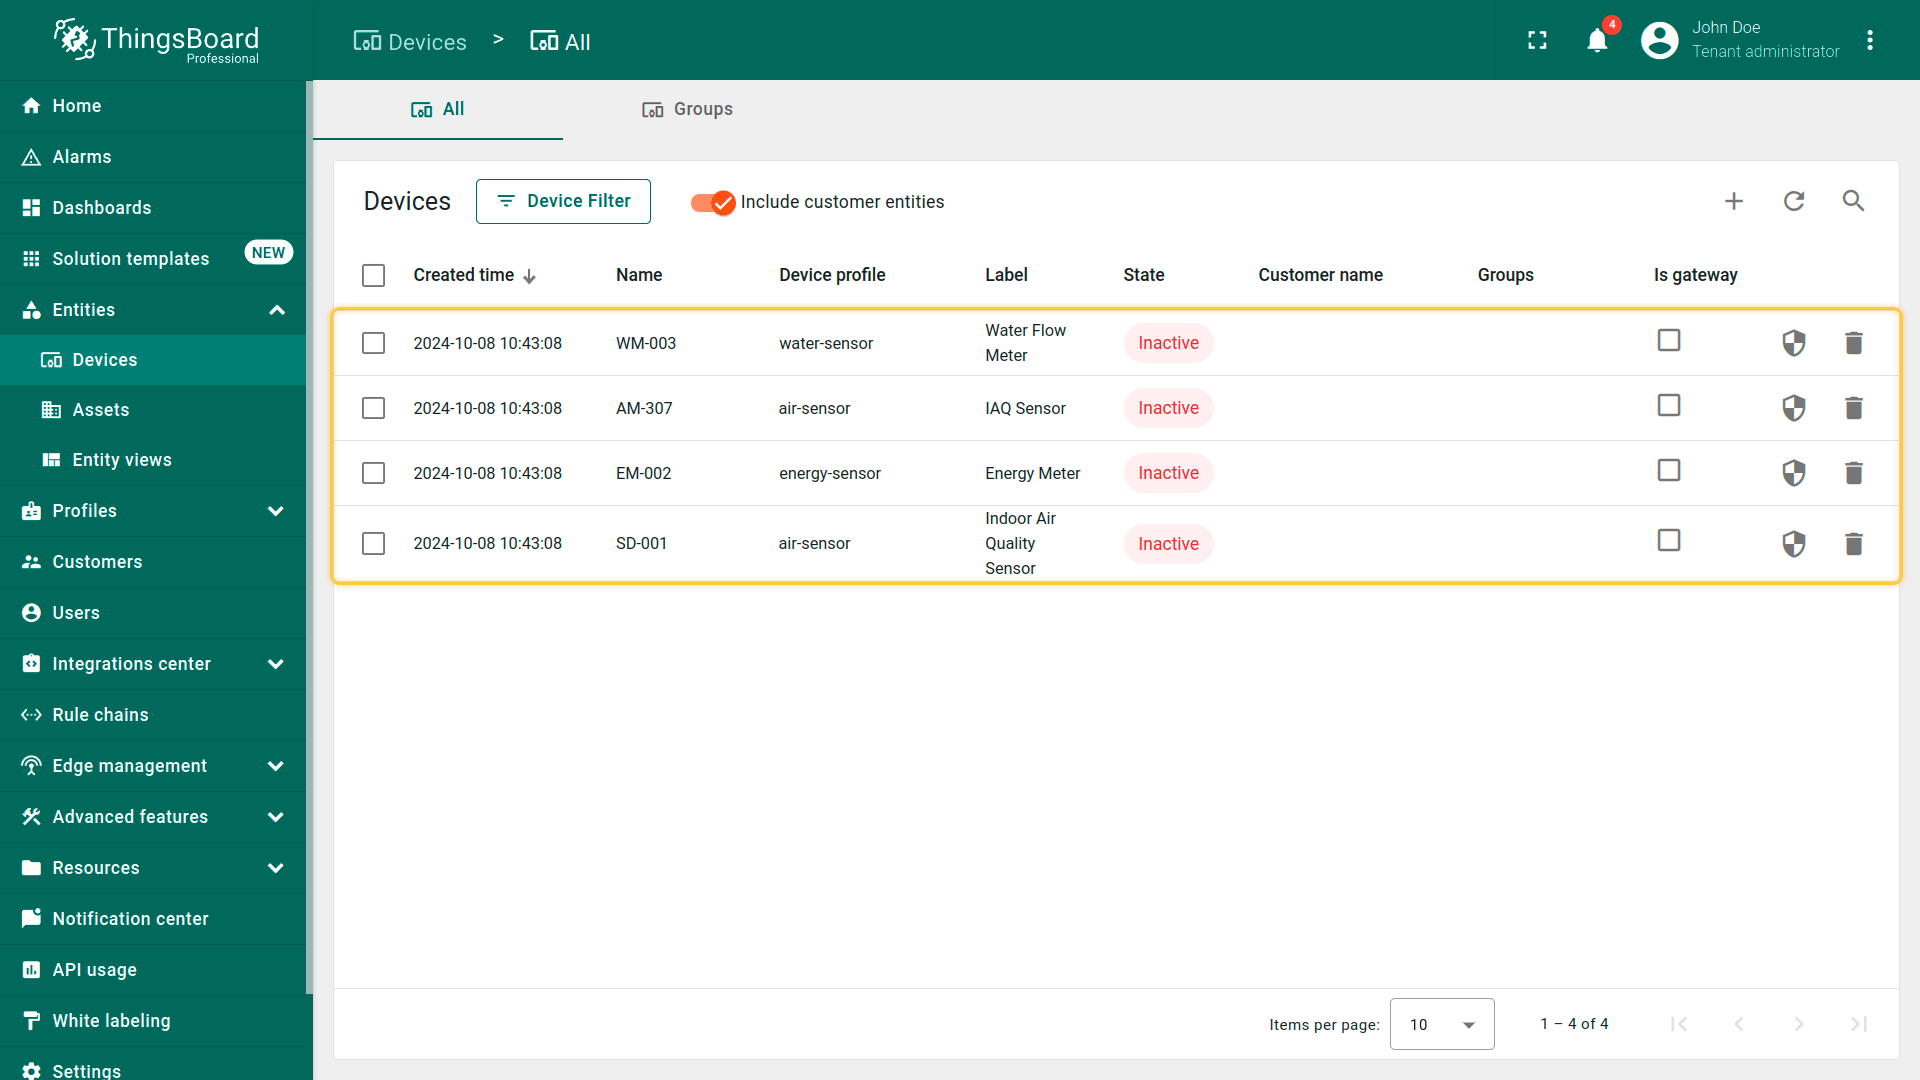
应成功创建四台新设备:”SD-001”(Indoor Air Quality Sensor)、”EM-002”(Energy Meter)、”WM-003”(Water Flow Meter)、”AM-307”(IAQ Sensor)。
Adding relations between entities
Relations 为一个实体与一个或多个实体间的有向连接。 为确保Office A和Office B仅与Building A关联,我们建立它们之间的关系。按以下步骤操作:
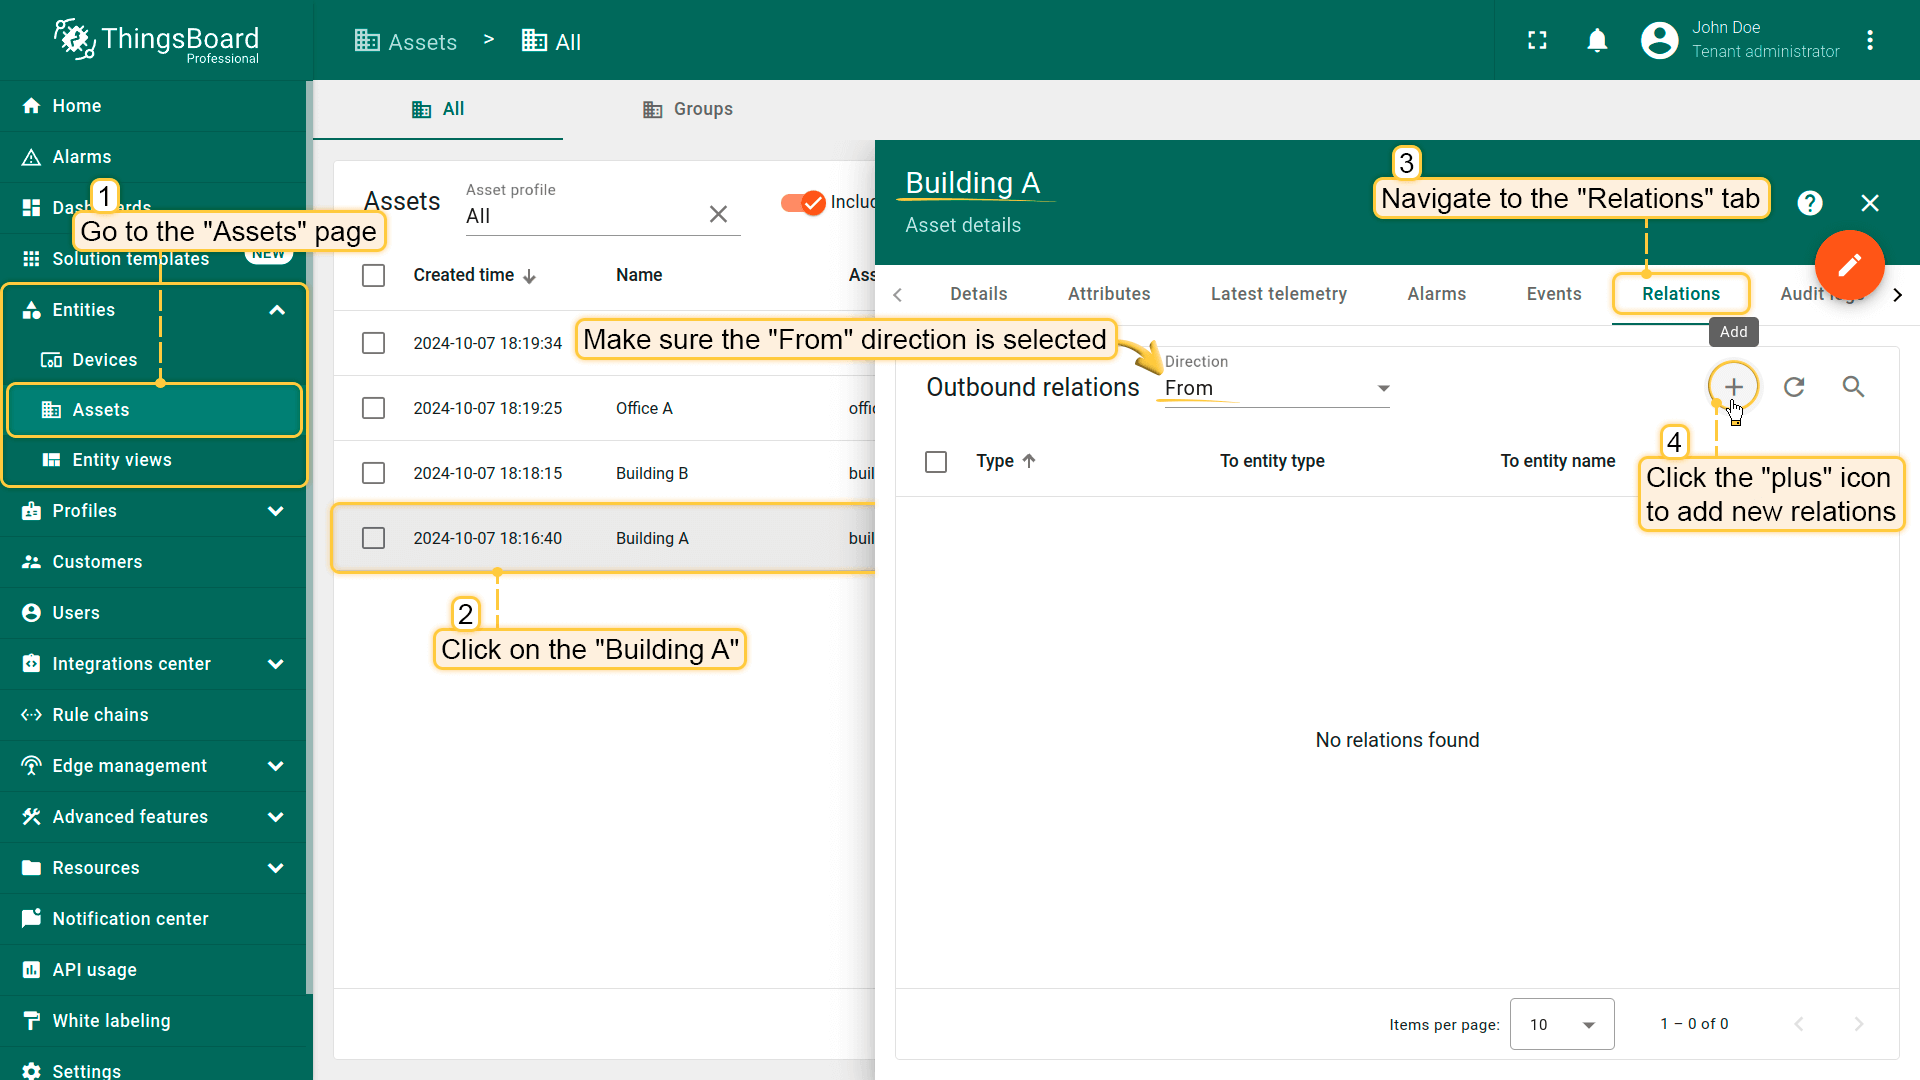
- 回到 “Assets” 页面,点击 “Building A” 打开详情。进入 “Relations” 选项卡,确认方向为 “From”,点击 “plus” 添加新relation;
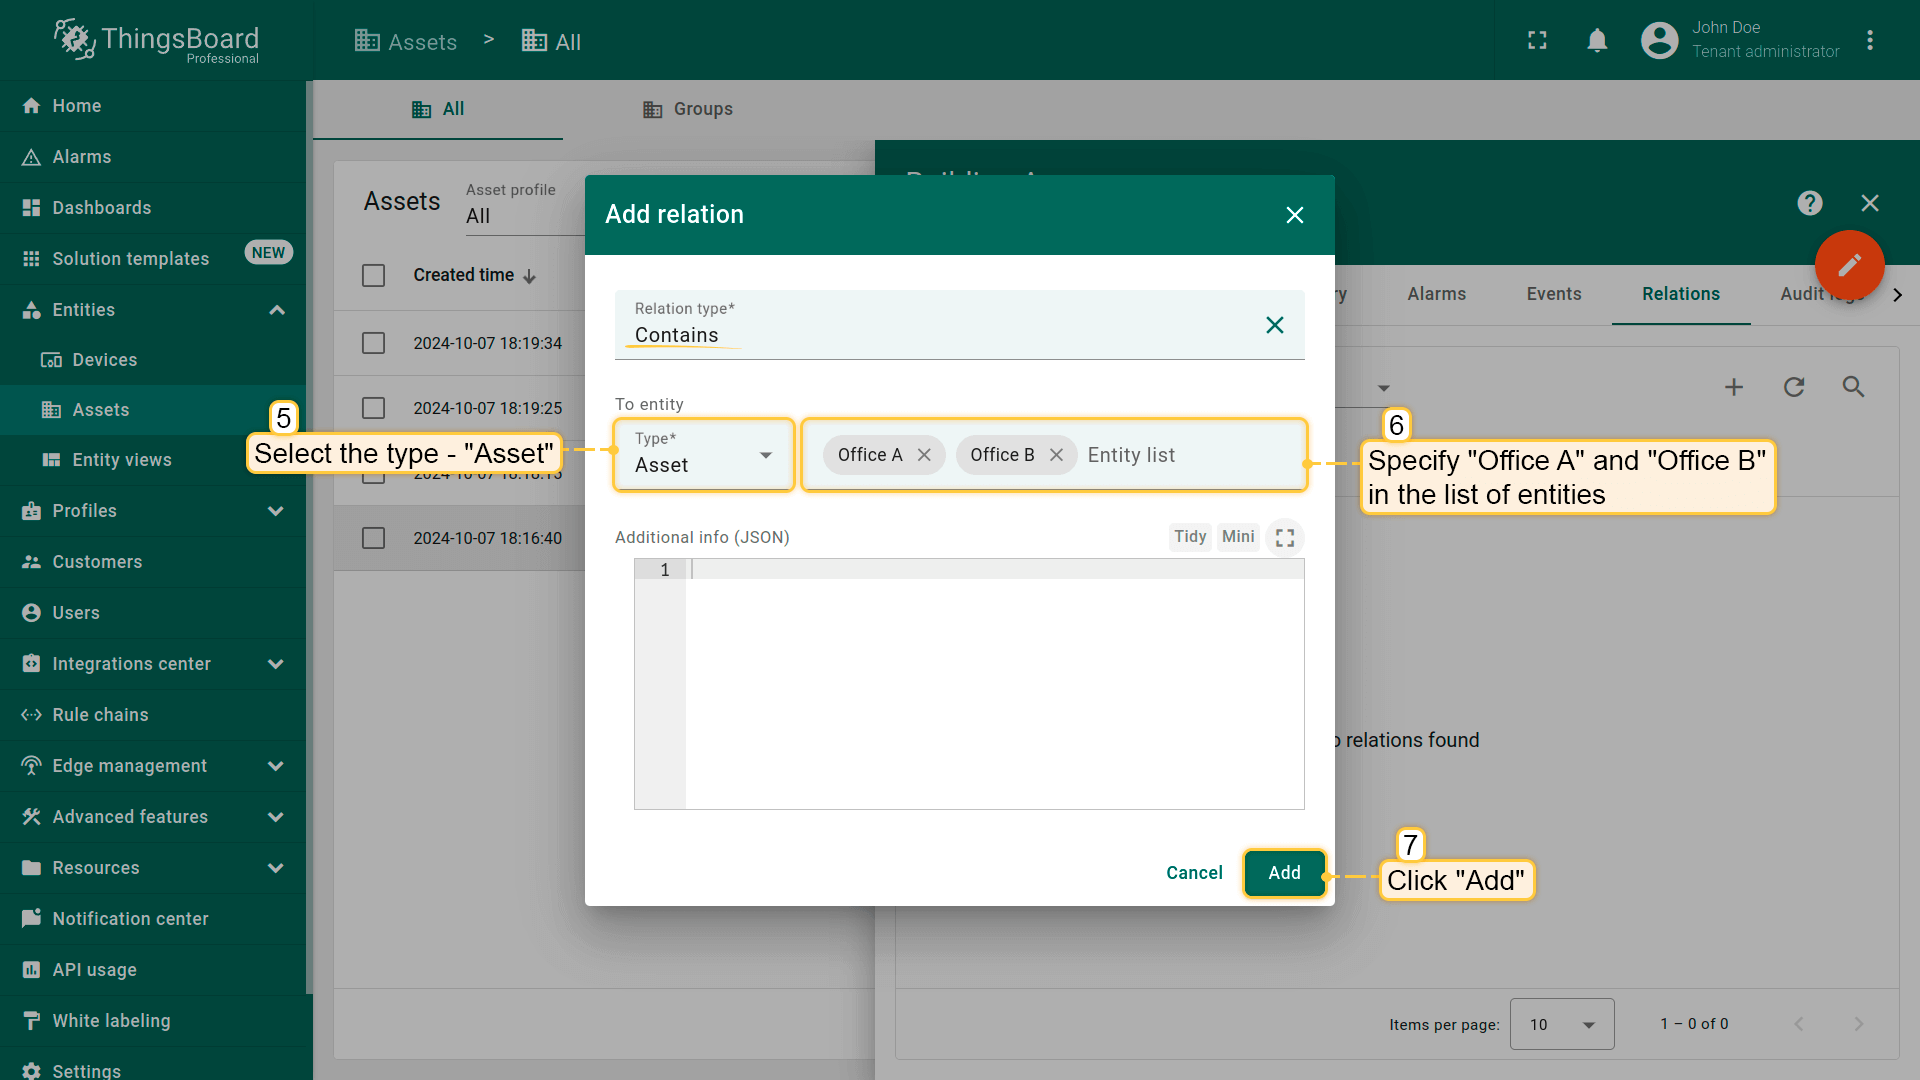
- 选择type “Assets”,在实体列表中指定 “Office A” 和 “Office B”。点击 “Add”。
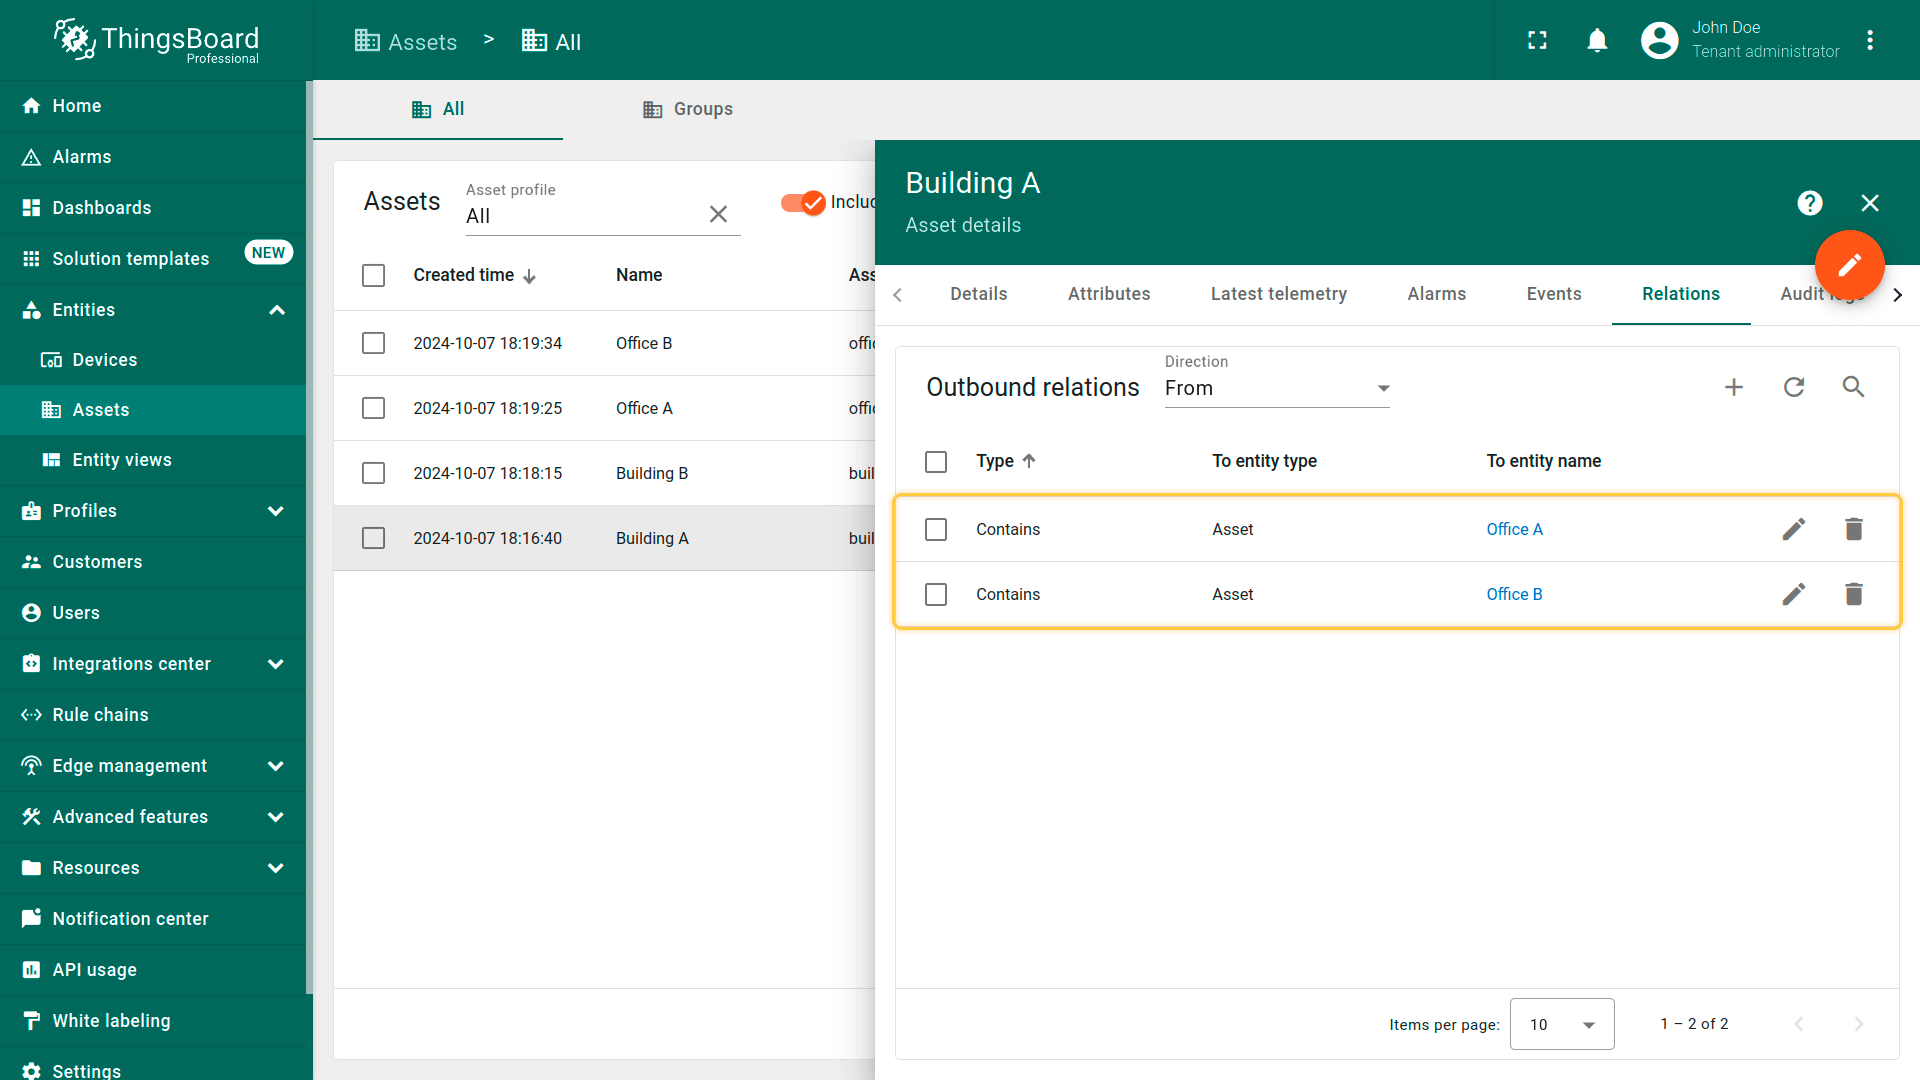
Office A和Office B现已仅与Building A关联。
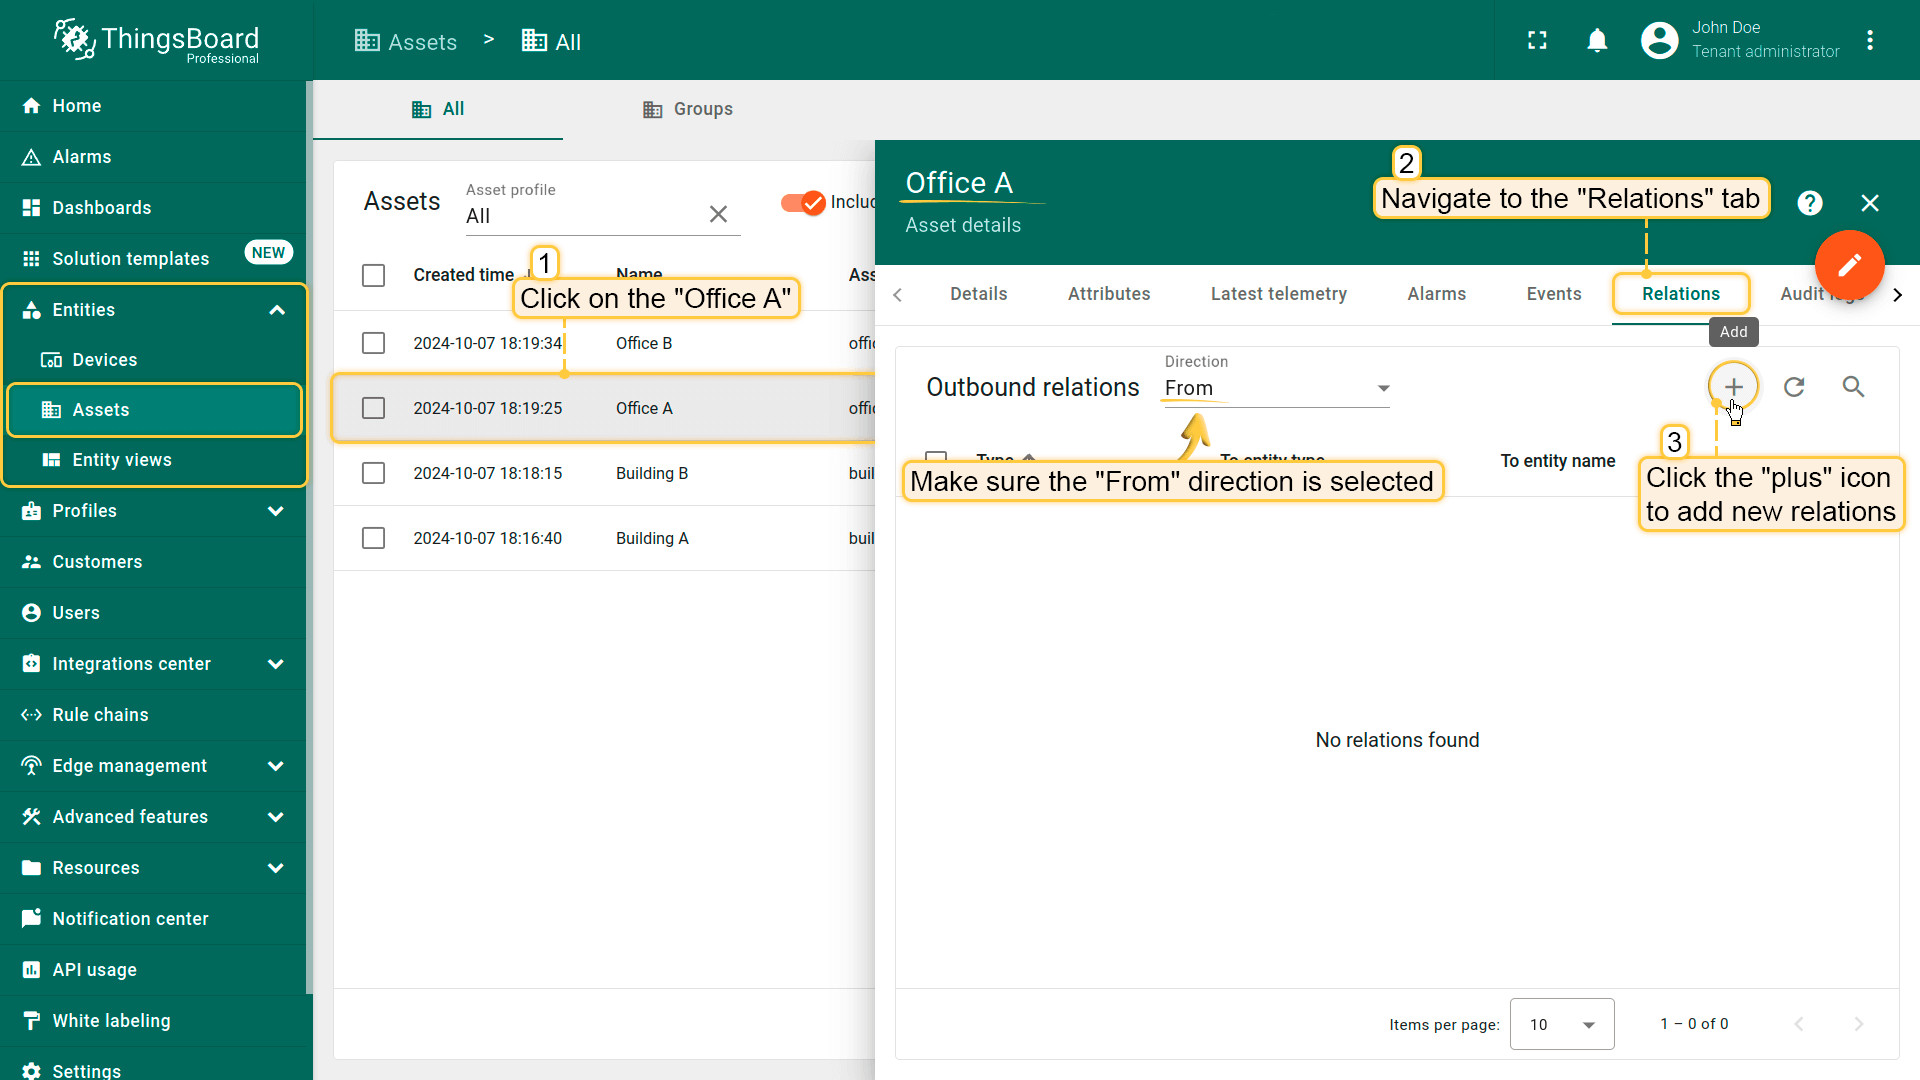
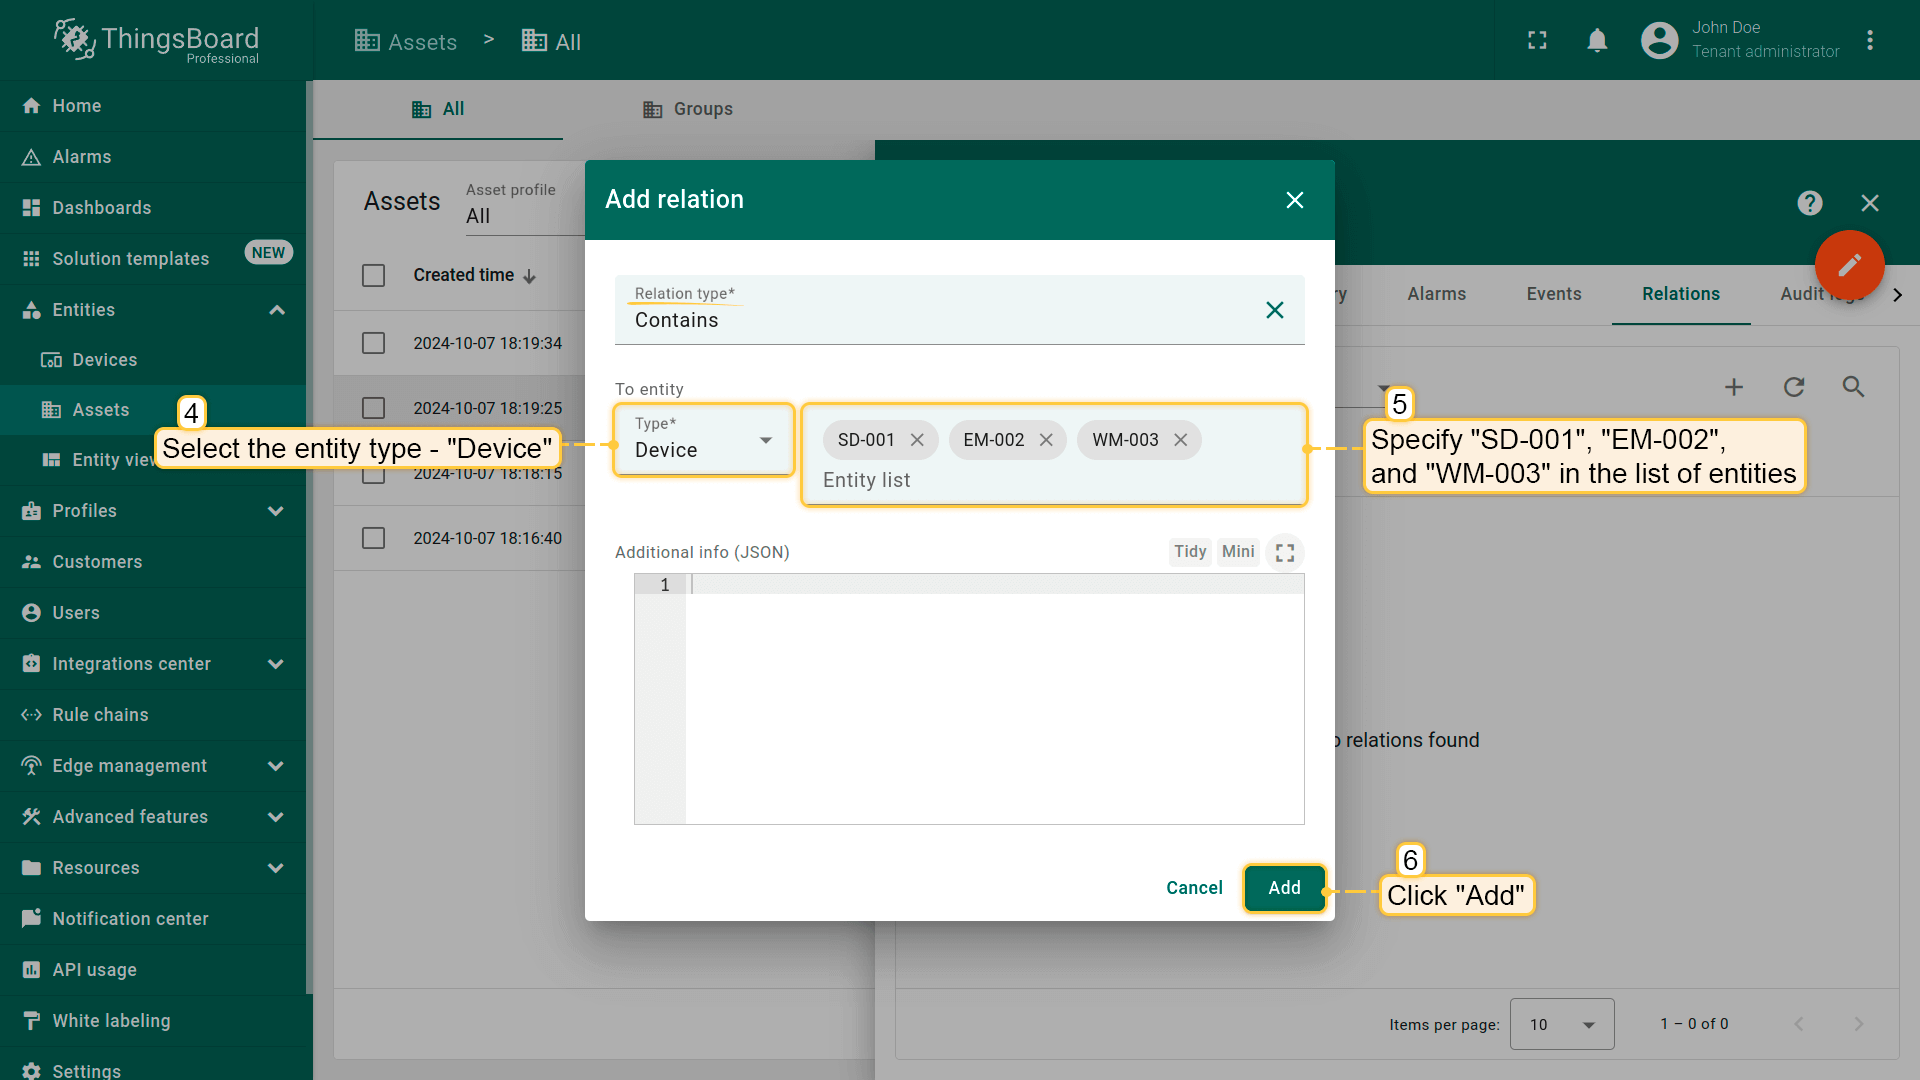
现在为设备 “SD-001”(Indoor Air Quality Sensor)、”EM-002”(Energy Meter)、”WM-003”(Water Flow Meter)与Office A建立relations:
- 点击 “Office A”,进入 “Relations” 选项卡。确认方向为 “From”,点击 “plus”;
- 选择type “Device”,在实体列表中指定 “SD-001”、”EM-002” 和 “WM-003”。点击 “Add”。
指定设备现已与 “Office A” asset建立relation。

同样,建立 “AM-307”(IAQ Sensor)设备与 “Office B” asset的关系。

Adding dashboard
dashboard 不仅是用于以便利格式展示数据的空间。 创建结构清晰、视觉效果良好的dashboard对高效监控与管理assets和devices至关重要。
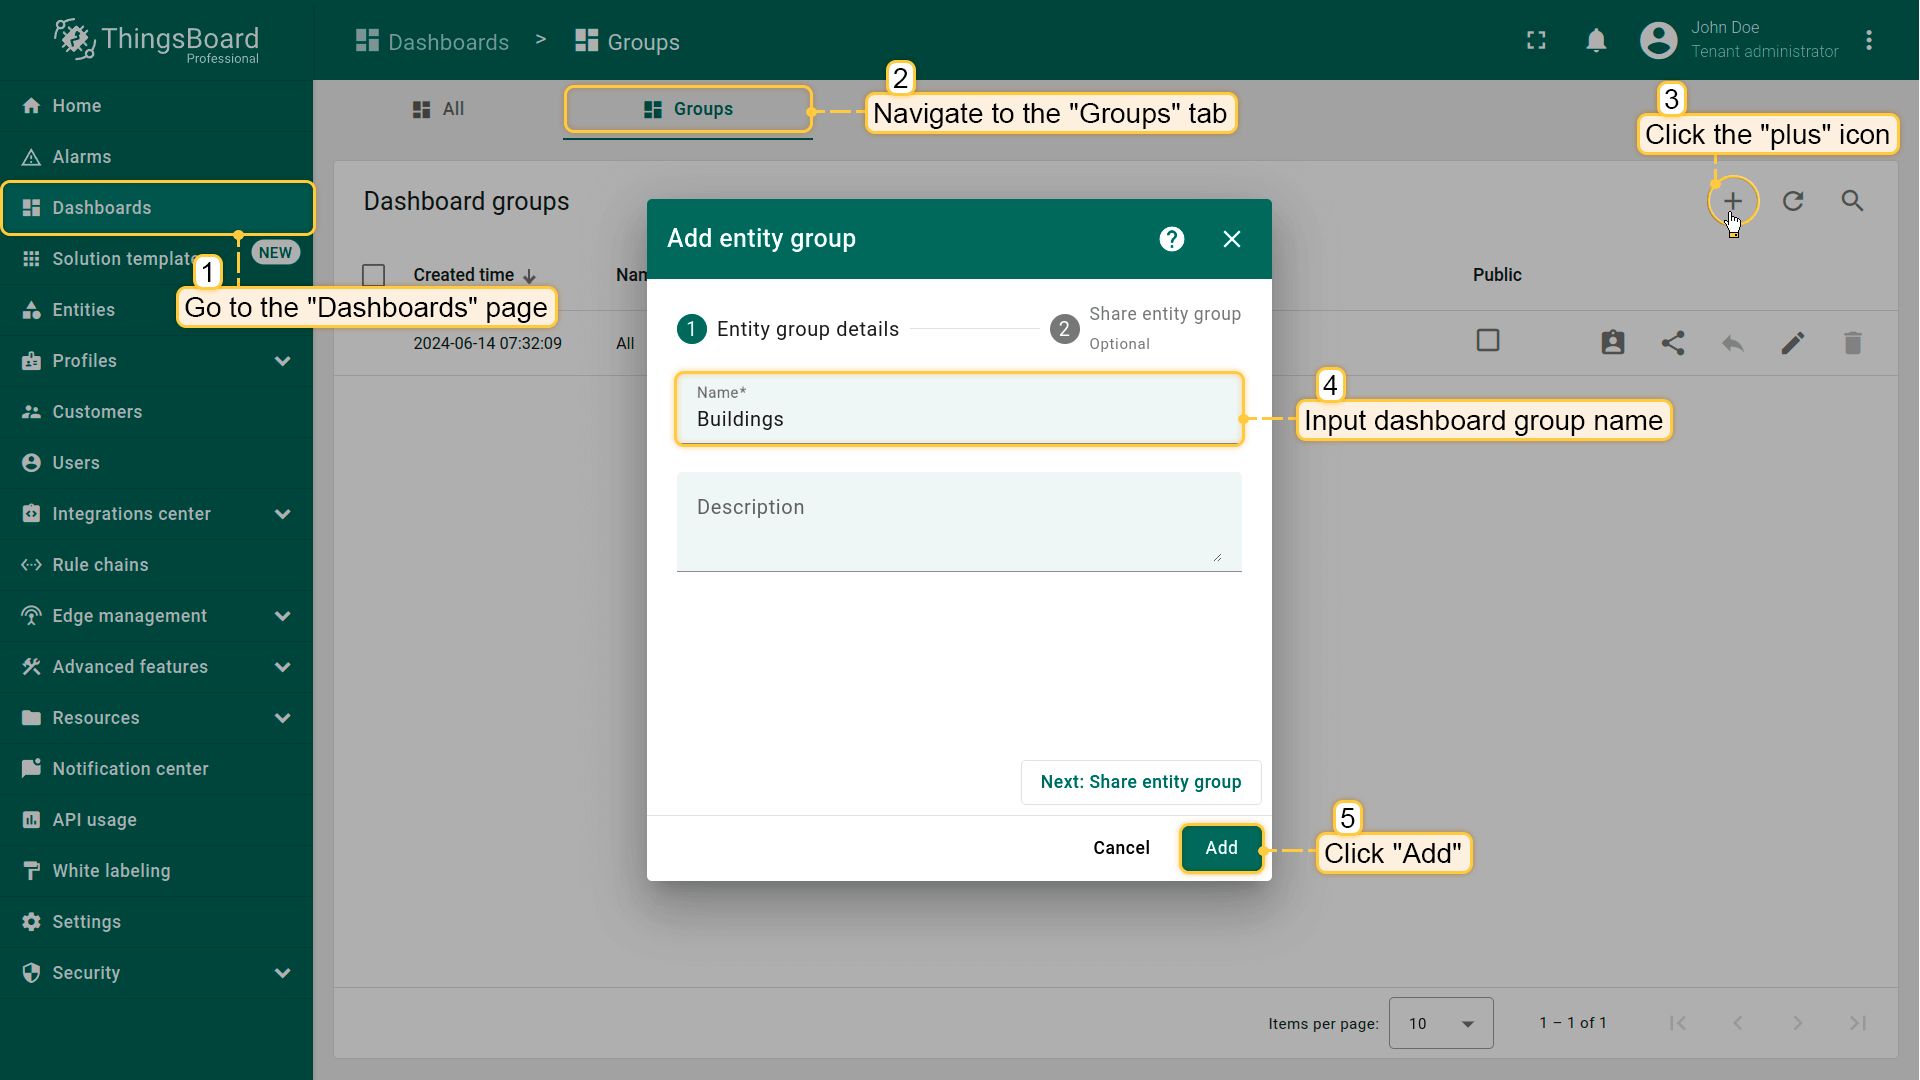
添加dashboard以开始在其上可视化assets和devices。我们将为dashboard单独建组:
- 进入 “Dashboards” 页面,切换到 “Groups” 选项卡。点击 “plus” 创建新dashboard组,命名为 “Buildings”,点击 “Add”;
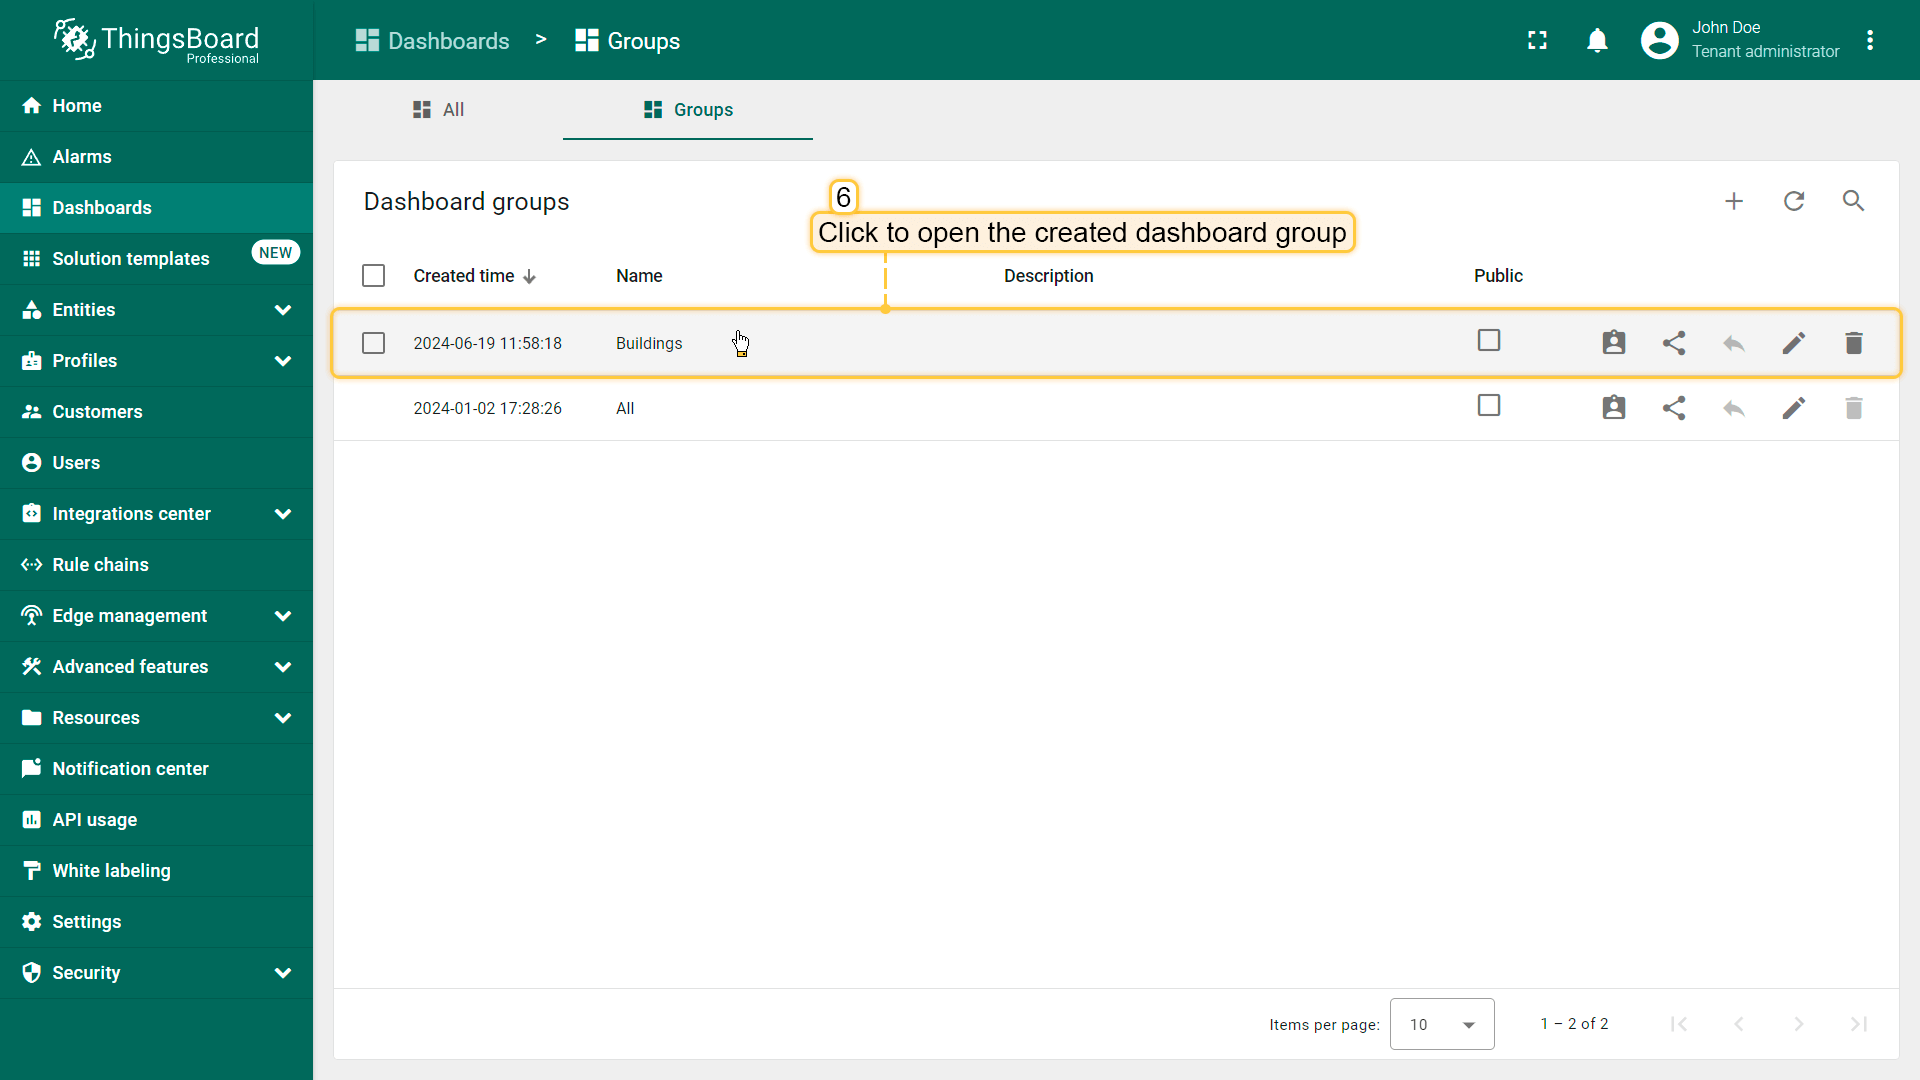
- 打开新建的dashboard组;
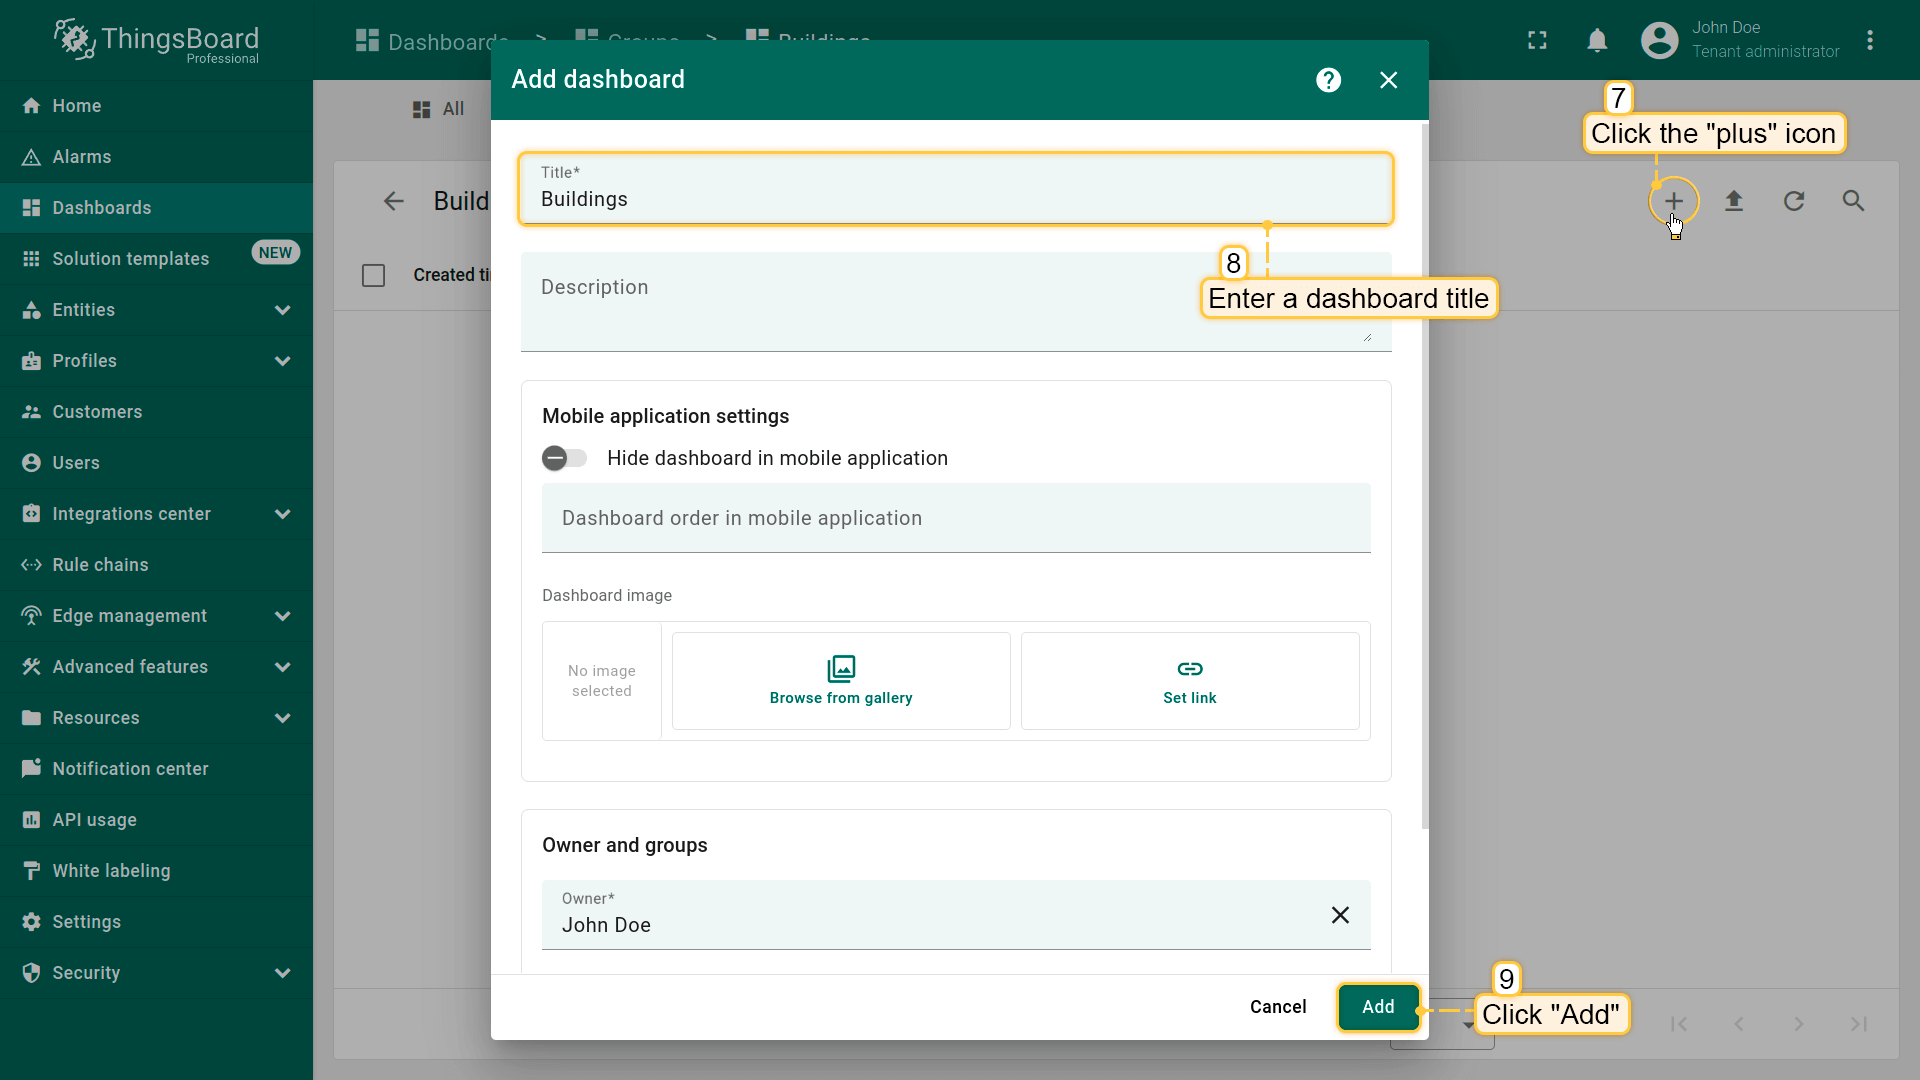
- 点击屏幕右上角 “plus” 添加新dashboard;
- 输入dashboard标题 “Buildings”,点击 “Add”;
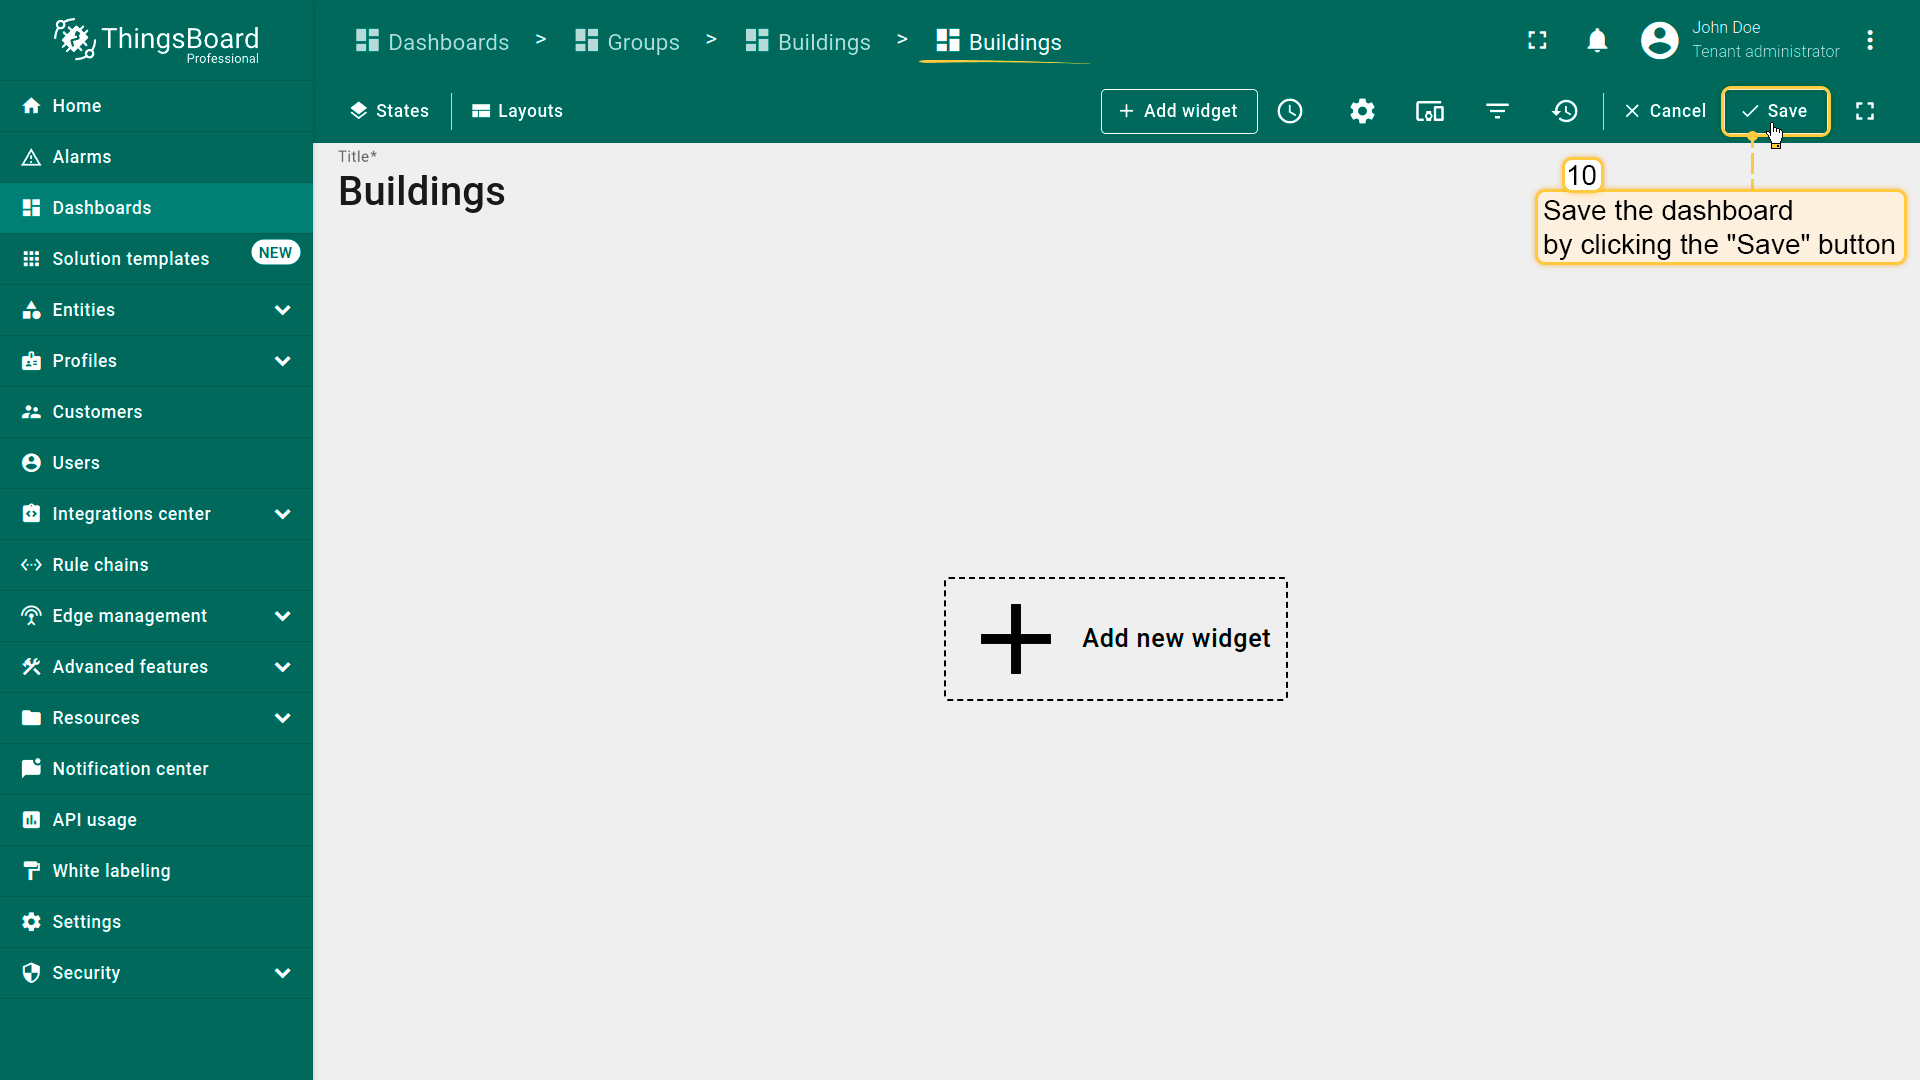
- 点击屏幕右上角 “Save” 保存dashboard。
首个dashboard已成功添加,添加后会自动打开。点击页面右上角 “Save” 保存。
OpenStreet Map widget
接下来添加第一个 widget —— OpenStreet Map,用于在地图上展示Building A和Building B。 要在地图上显示建筑,需将其坐标(纬度和经度)设为attributes。
此外将配置部件:点击建筑标记时显示建筑一般信息,包括地址、邮箱、电话和图片。 这些信息也将作为attributes添加。
先从准备着手——添加建筑图片和attributes。
Upload building images
建筑图片需上传至 Image gallery,作为集中存储和管理图片的仓库。 将用于地图部件的tooltip。可使用本指南中的 Building A 与 Building B 图片,或上传自己的图片。
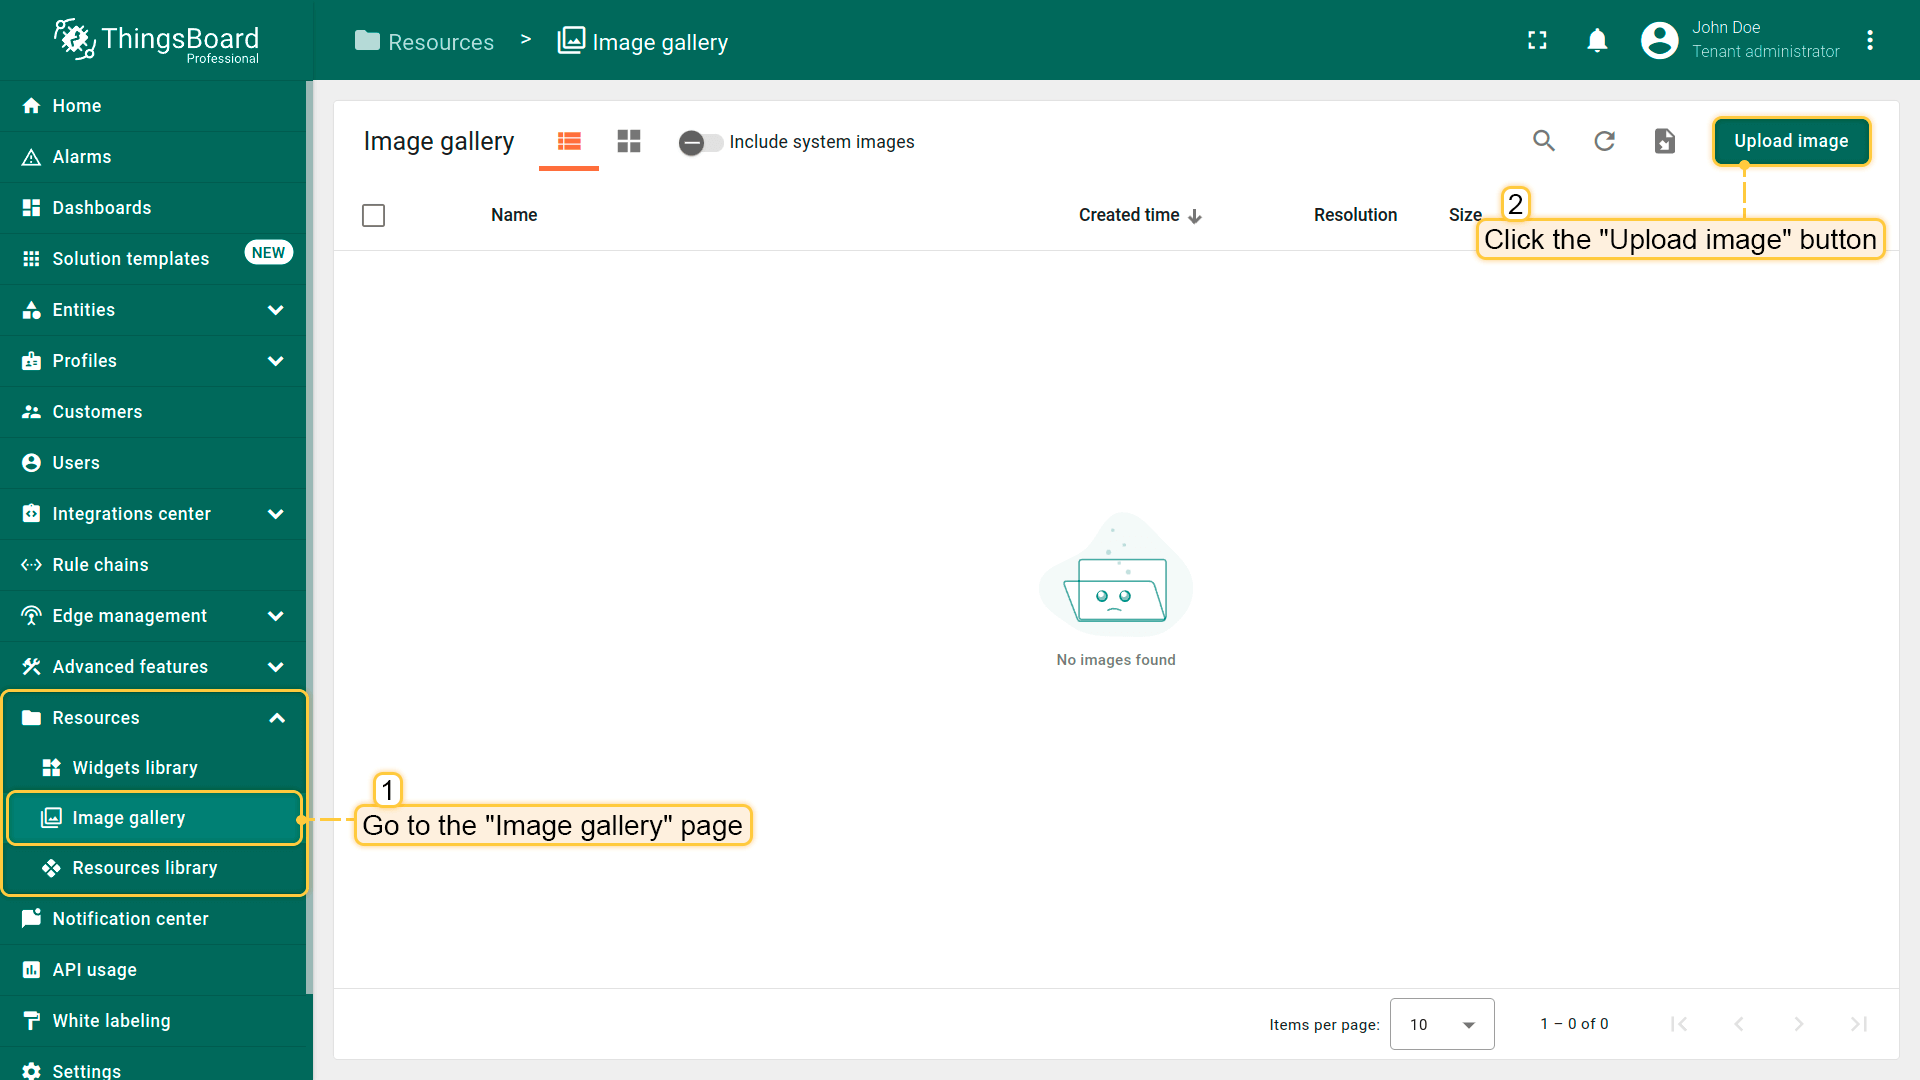
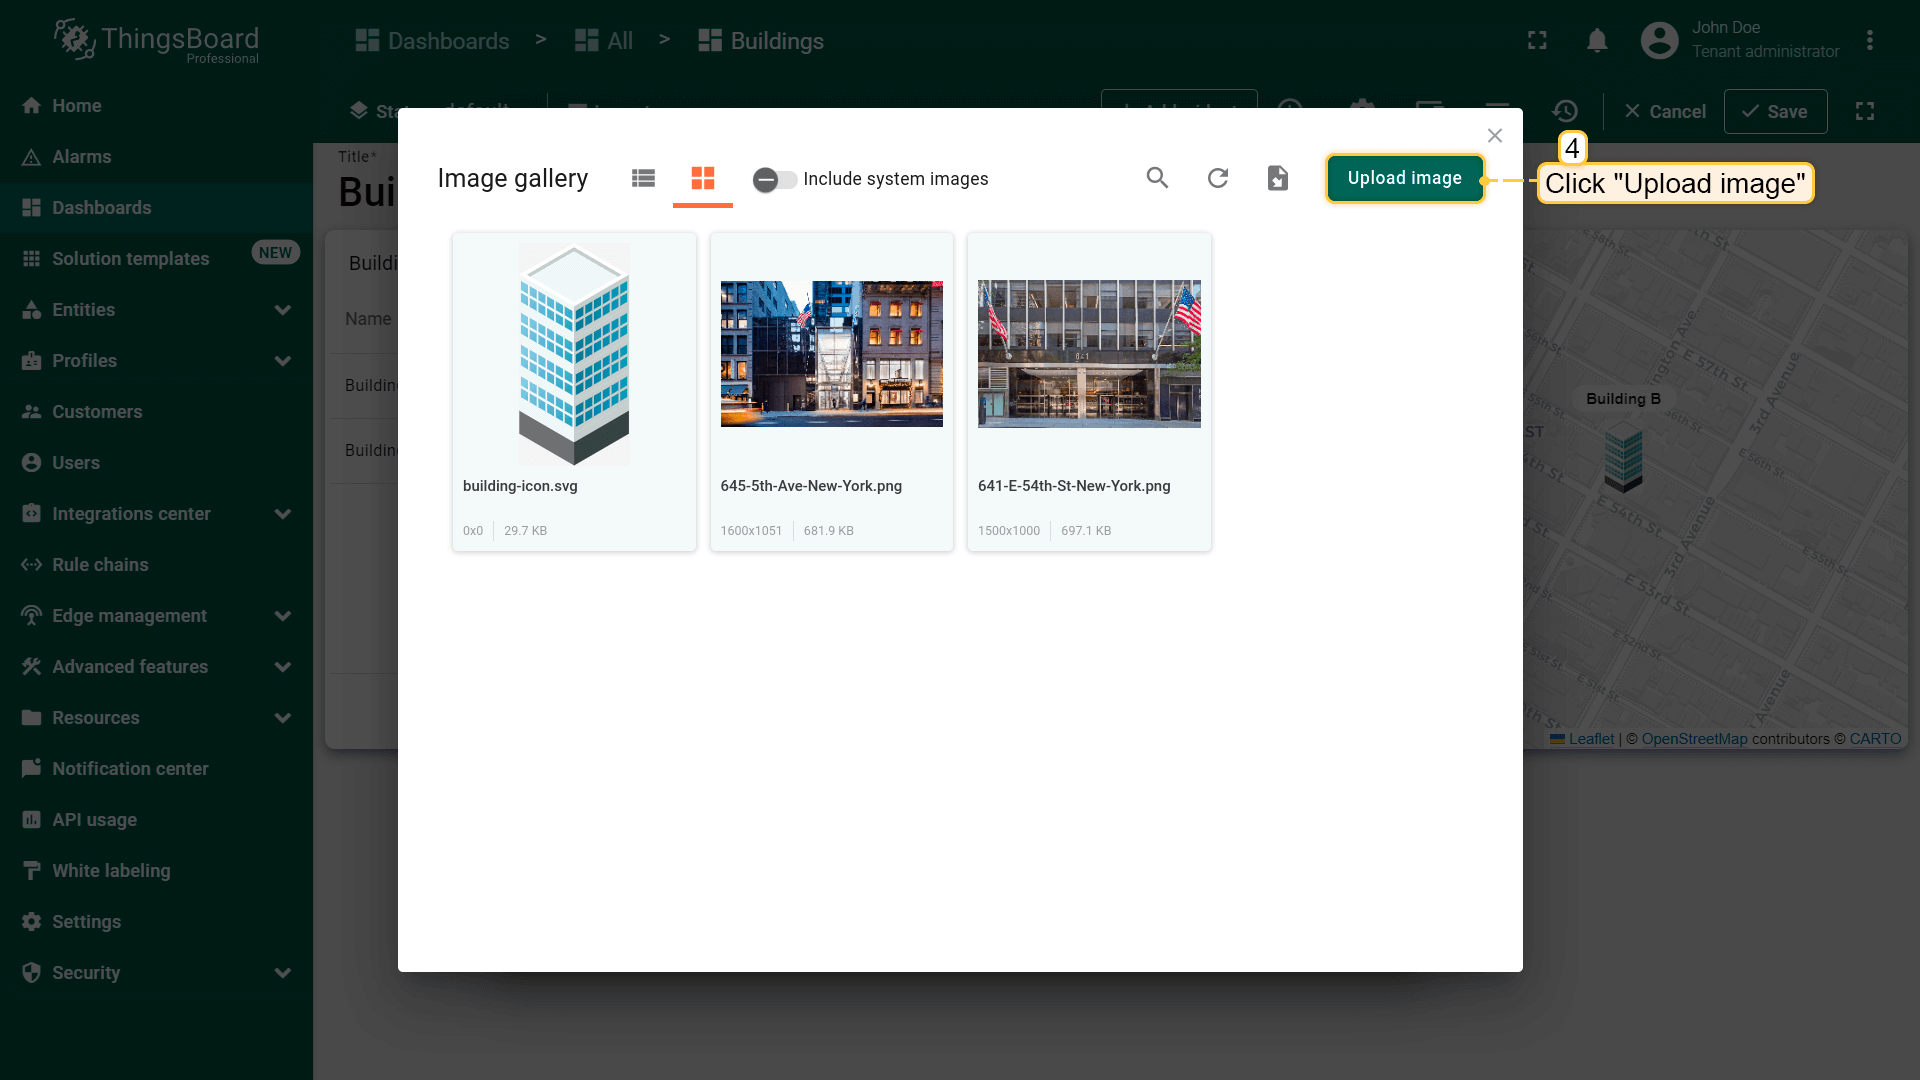
- Go to the "Image gallery" page in the "Resources" section. To upload a new image, click the "Upload image" button in the top-right corner of the screen;
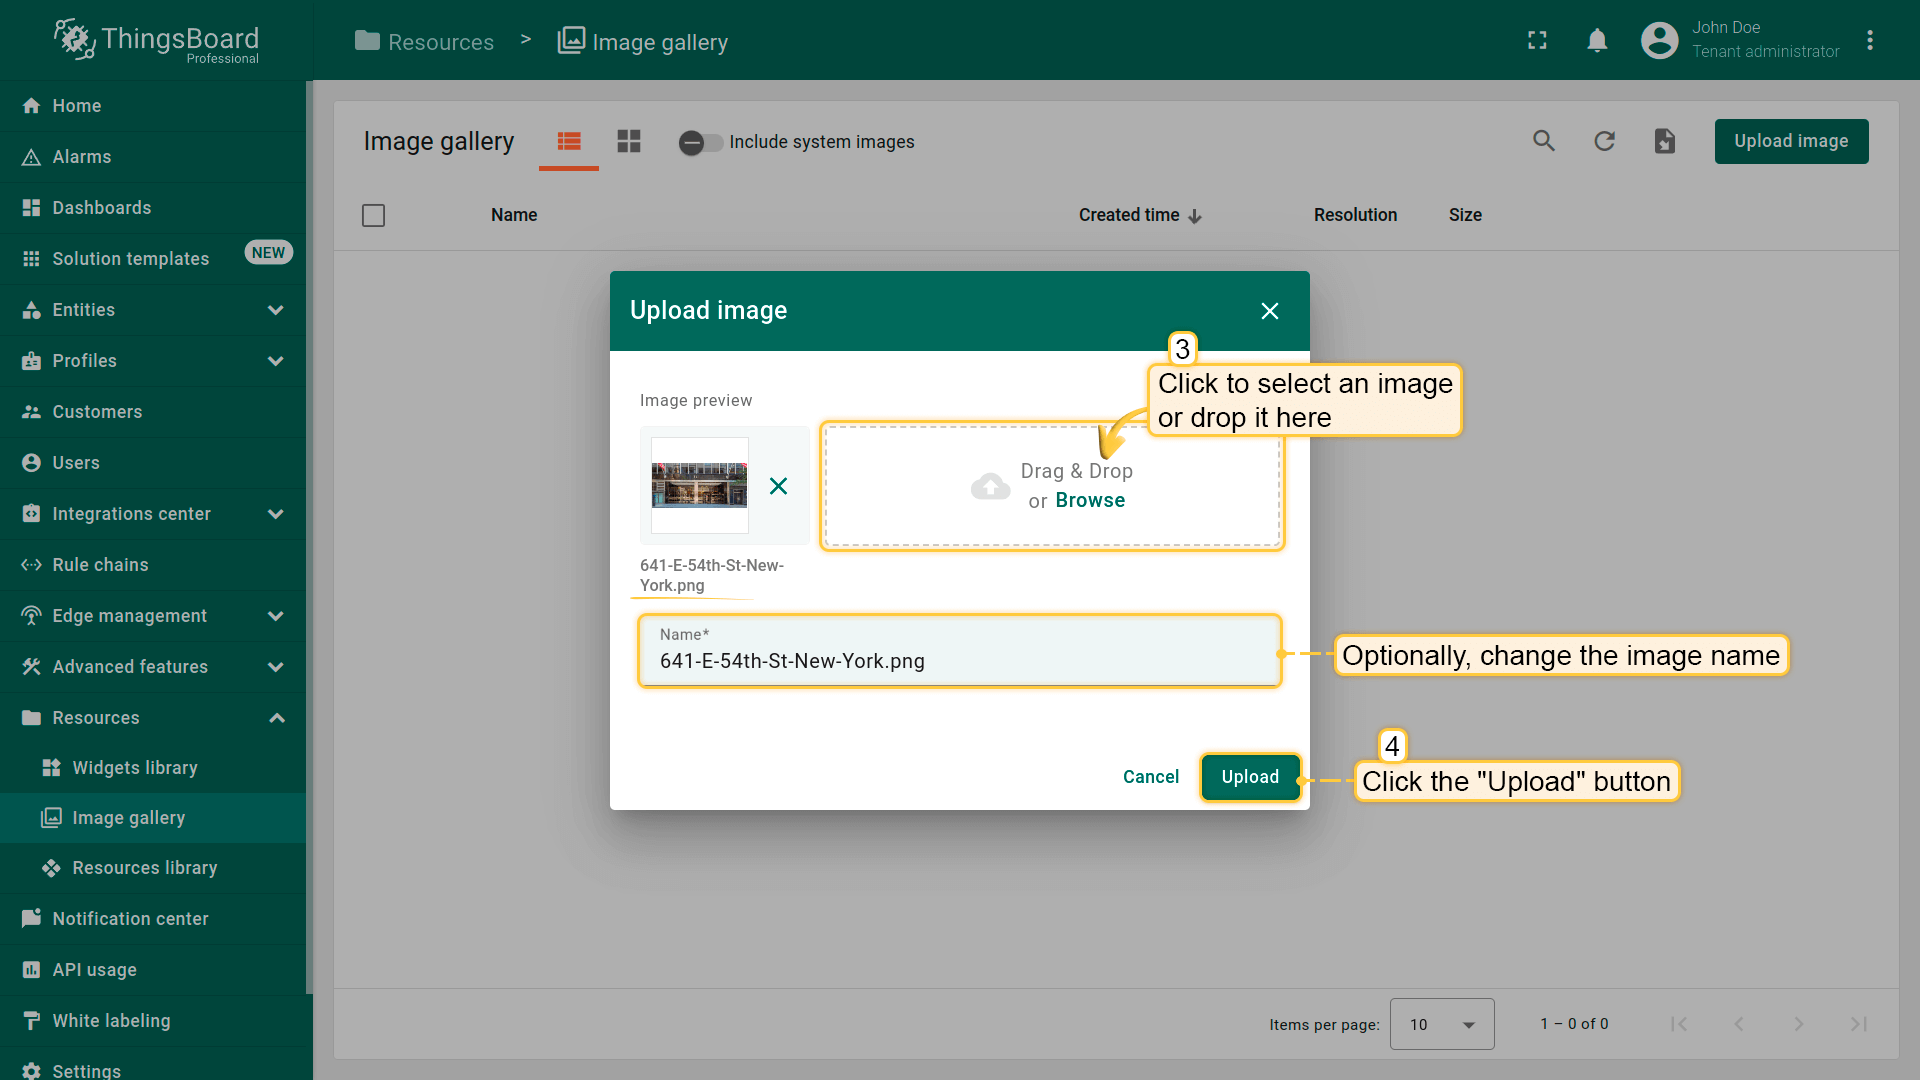
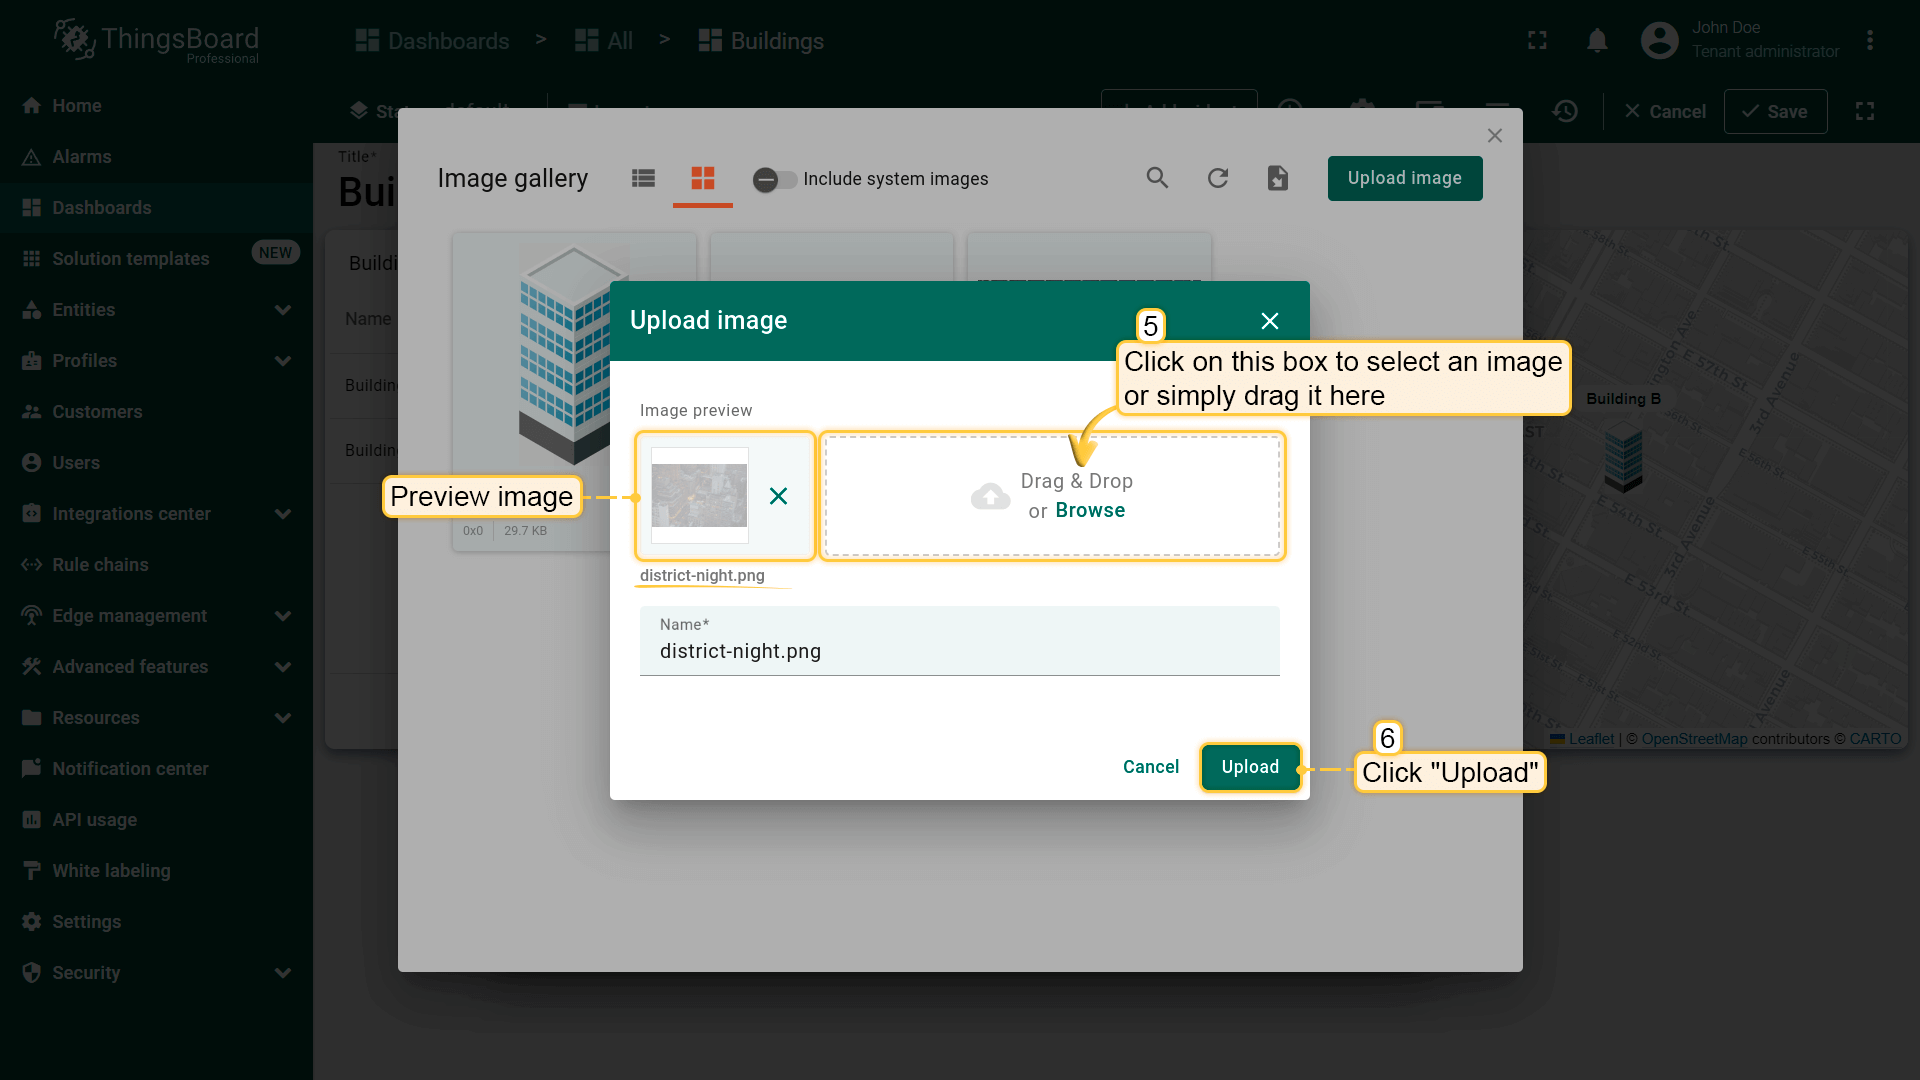
- Select an image for Building A or simply drag it to the "Upload image" window and click "Upload" button;
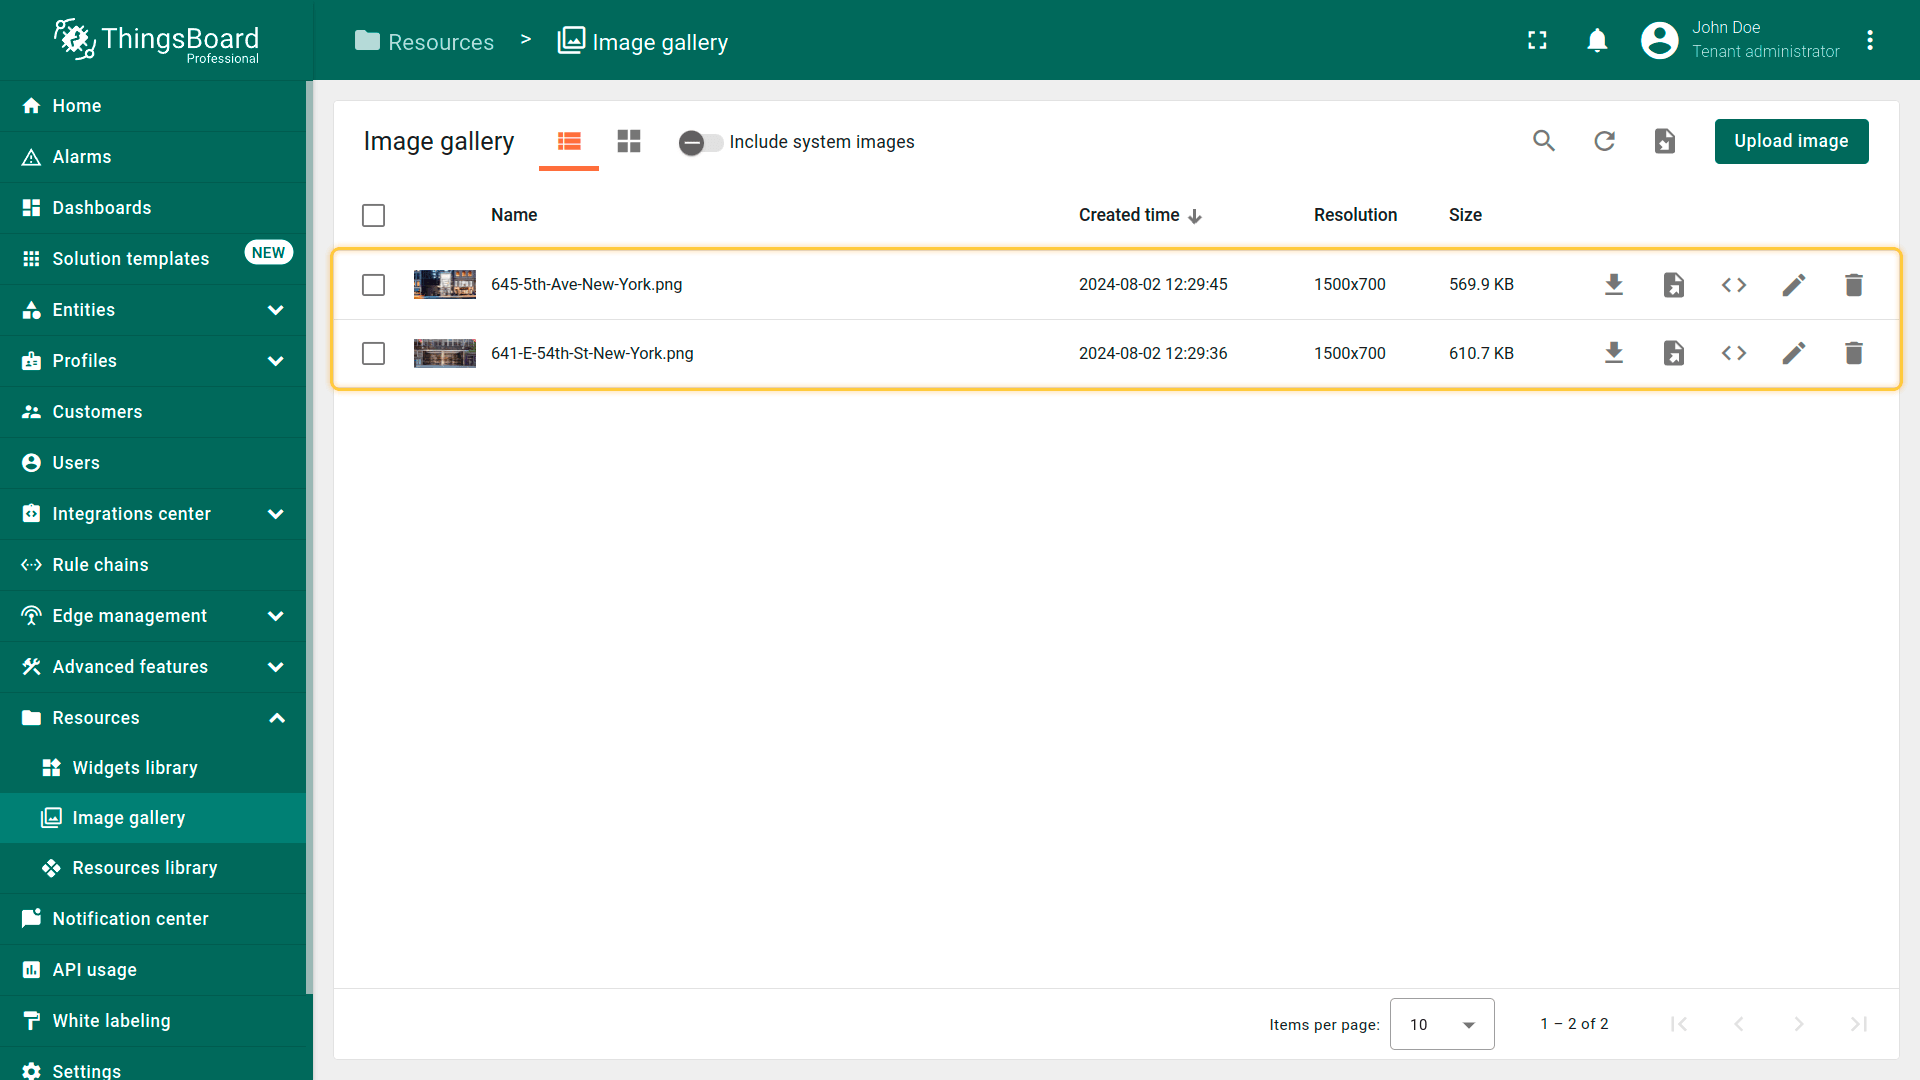
- The image for Building A has been uploaded. Similarly, upload the image for Building B.
获取并保存这些图片的链接,以便在建筑attributes中使用:
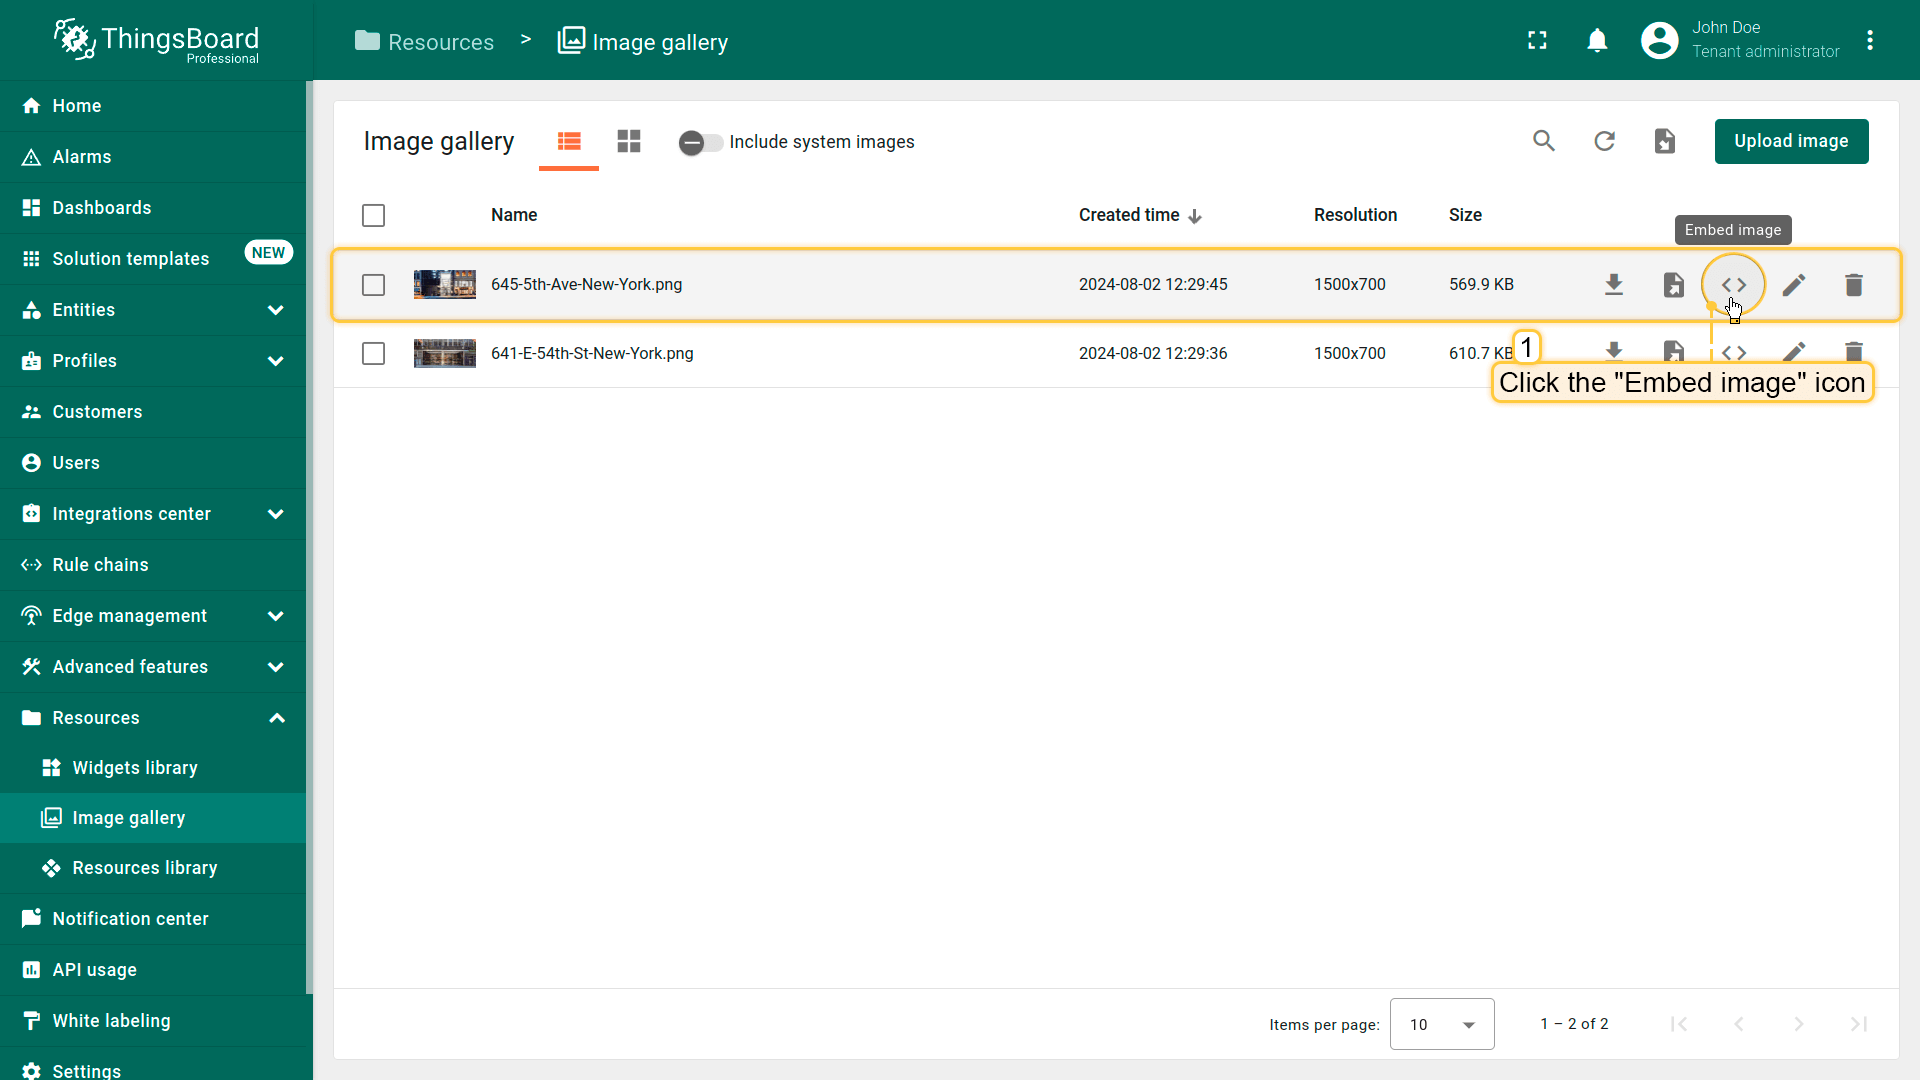
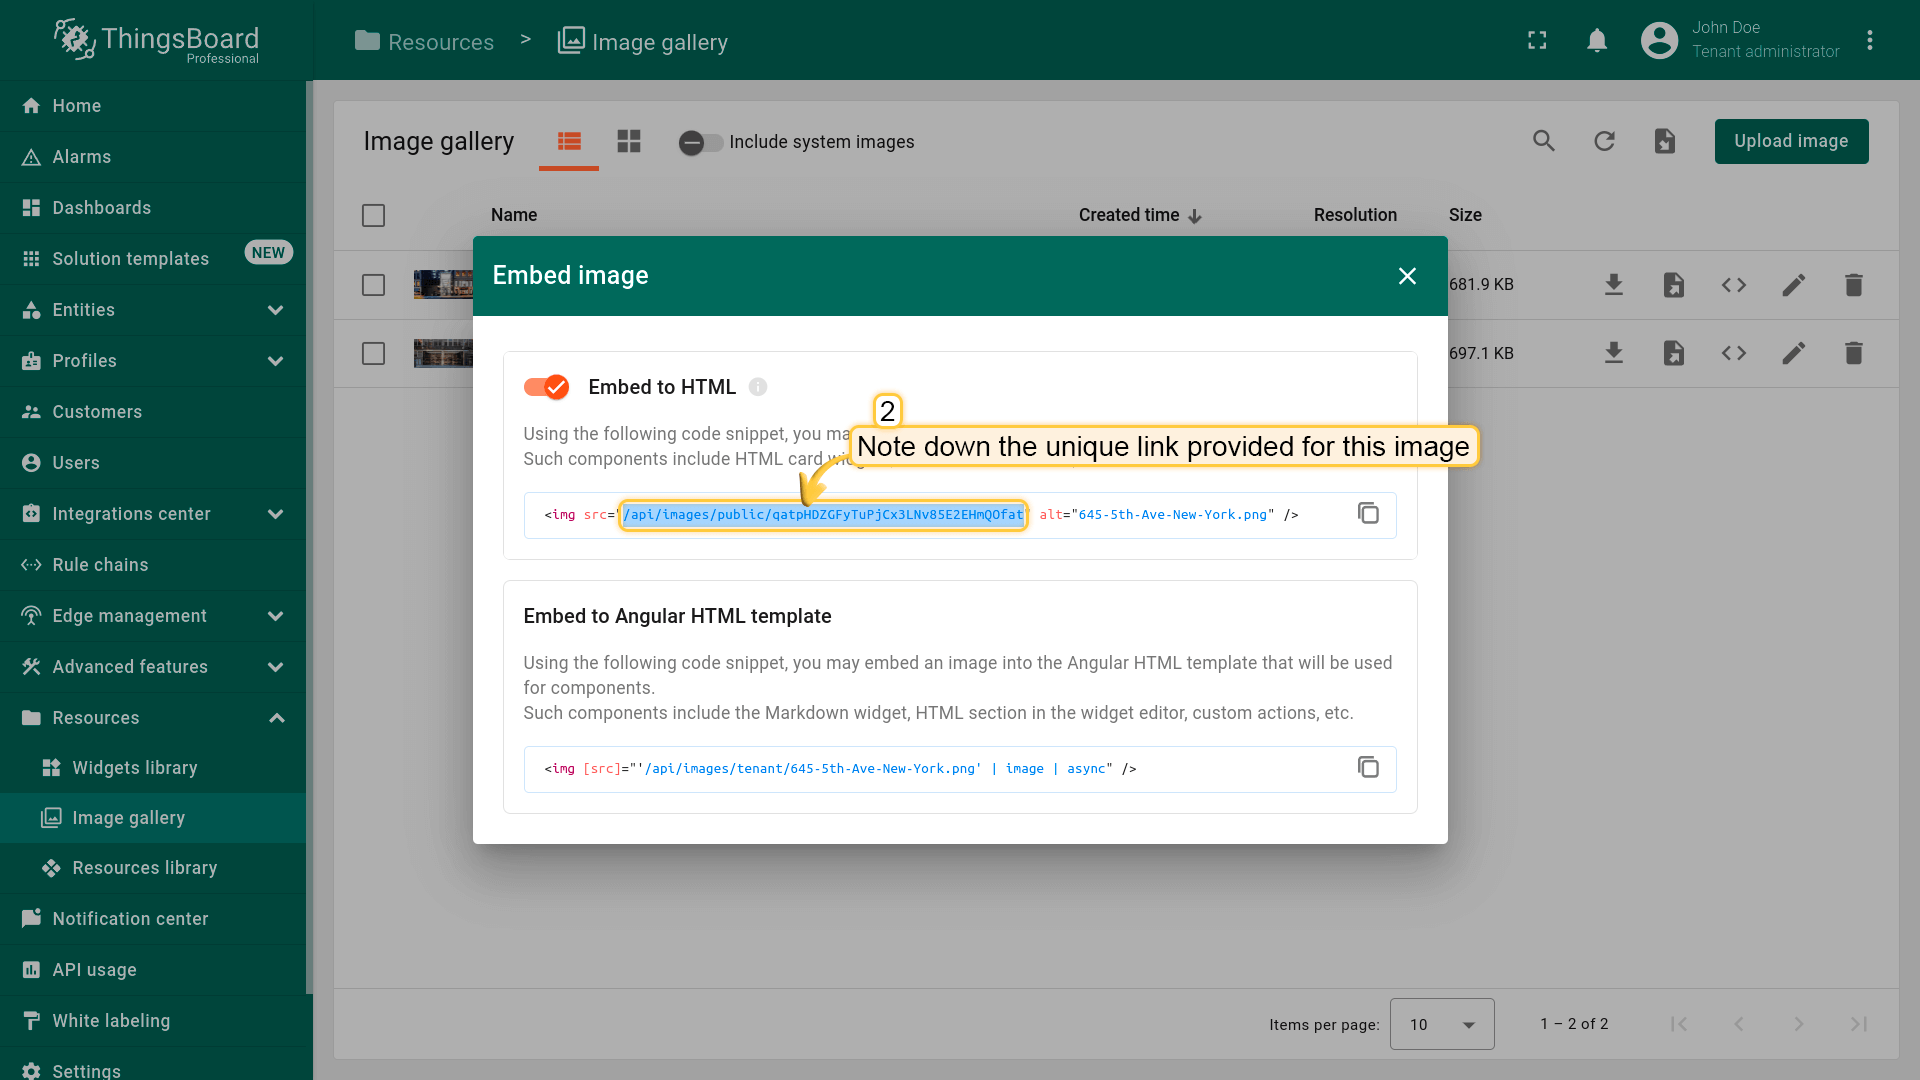
- After uploading, click the "Embed image" icon next to each building's image;
- Note down the unique links provided for these images. These will be used later in the buildings' attributes.
Adding the necessary attributes
接下来添加所需的attributes:
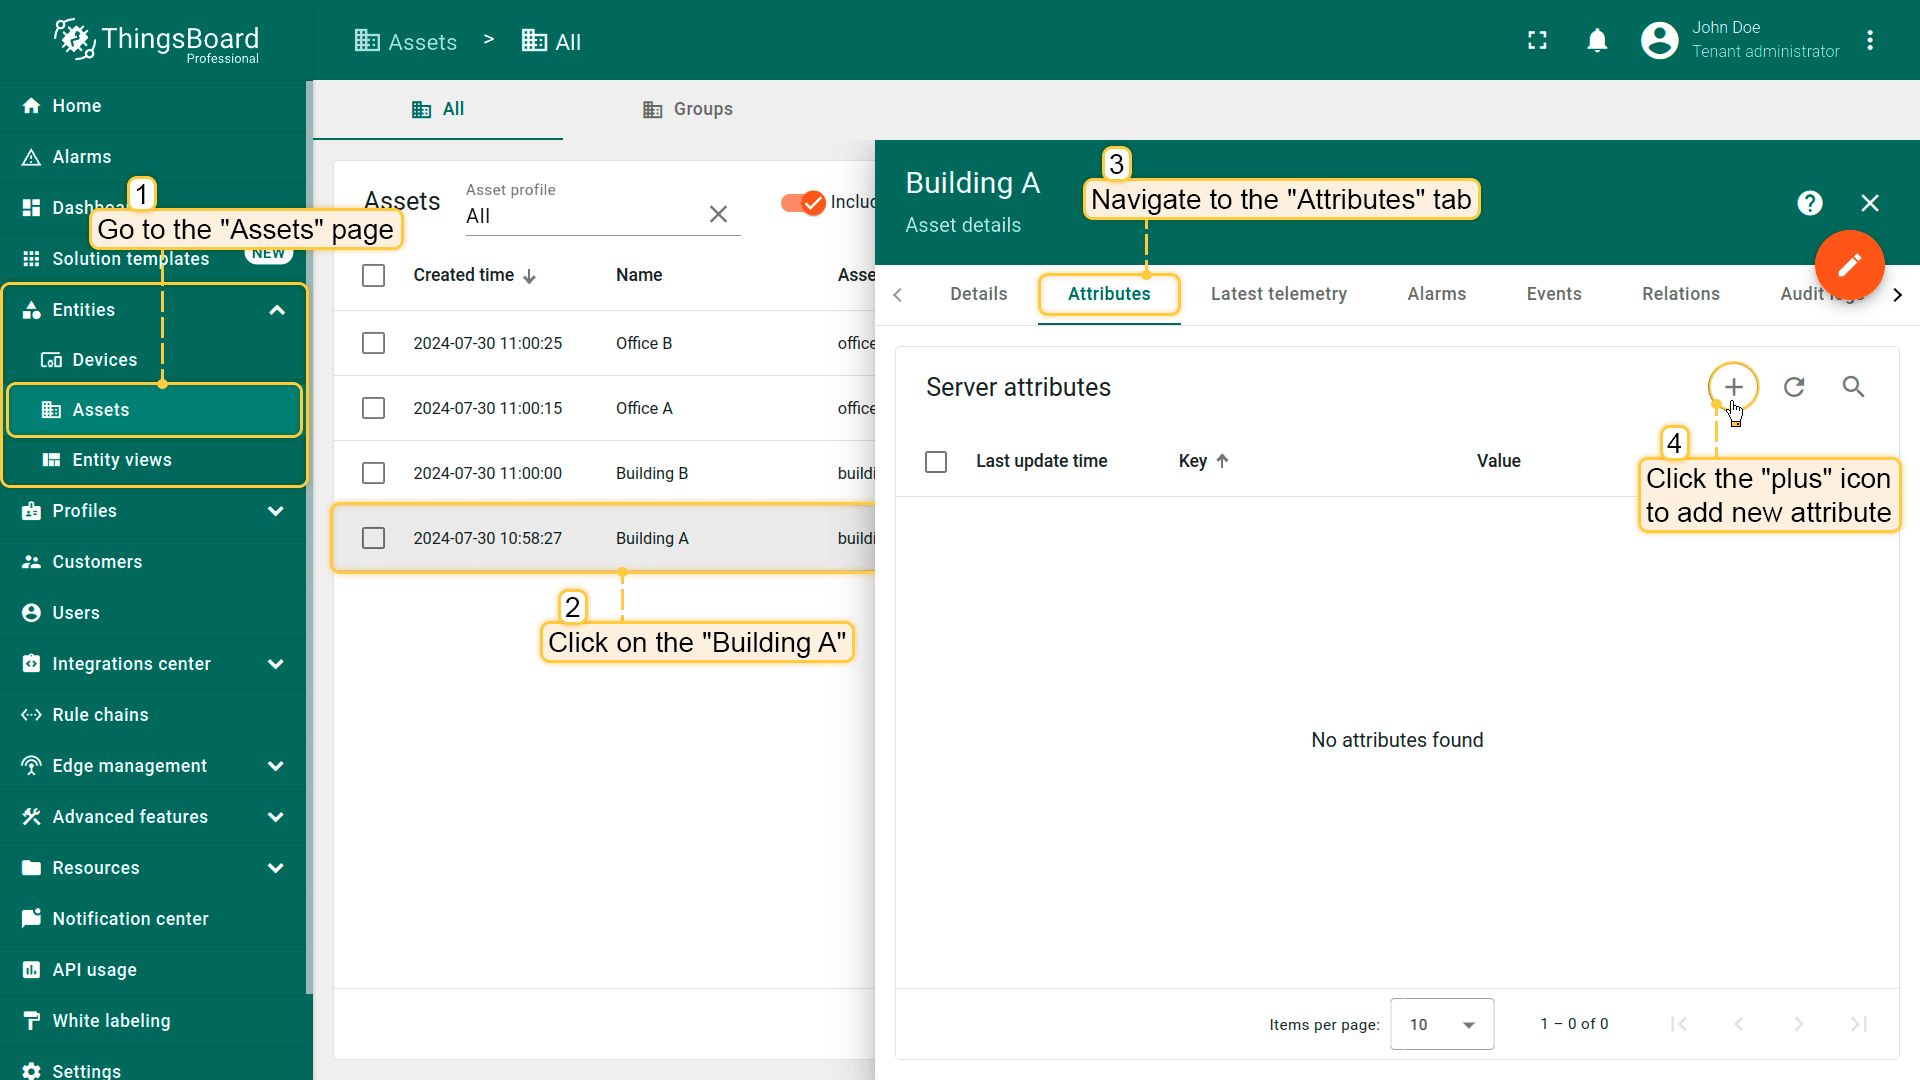
- Go to the "Assets" page and click on the "Building A" to open its details window. Navigate to the "Attributes" tab and click the "plus" icon to add new attribute;
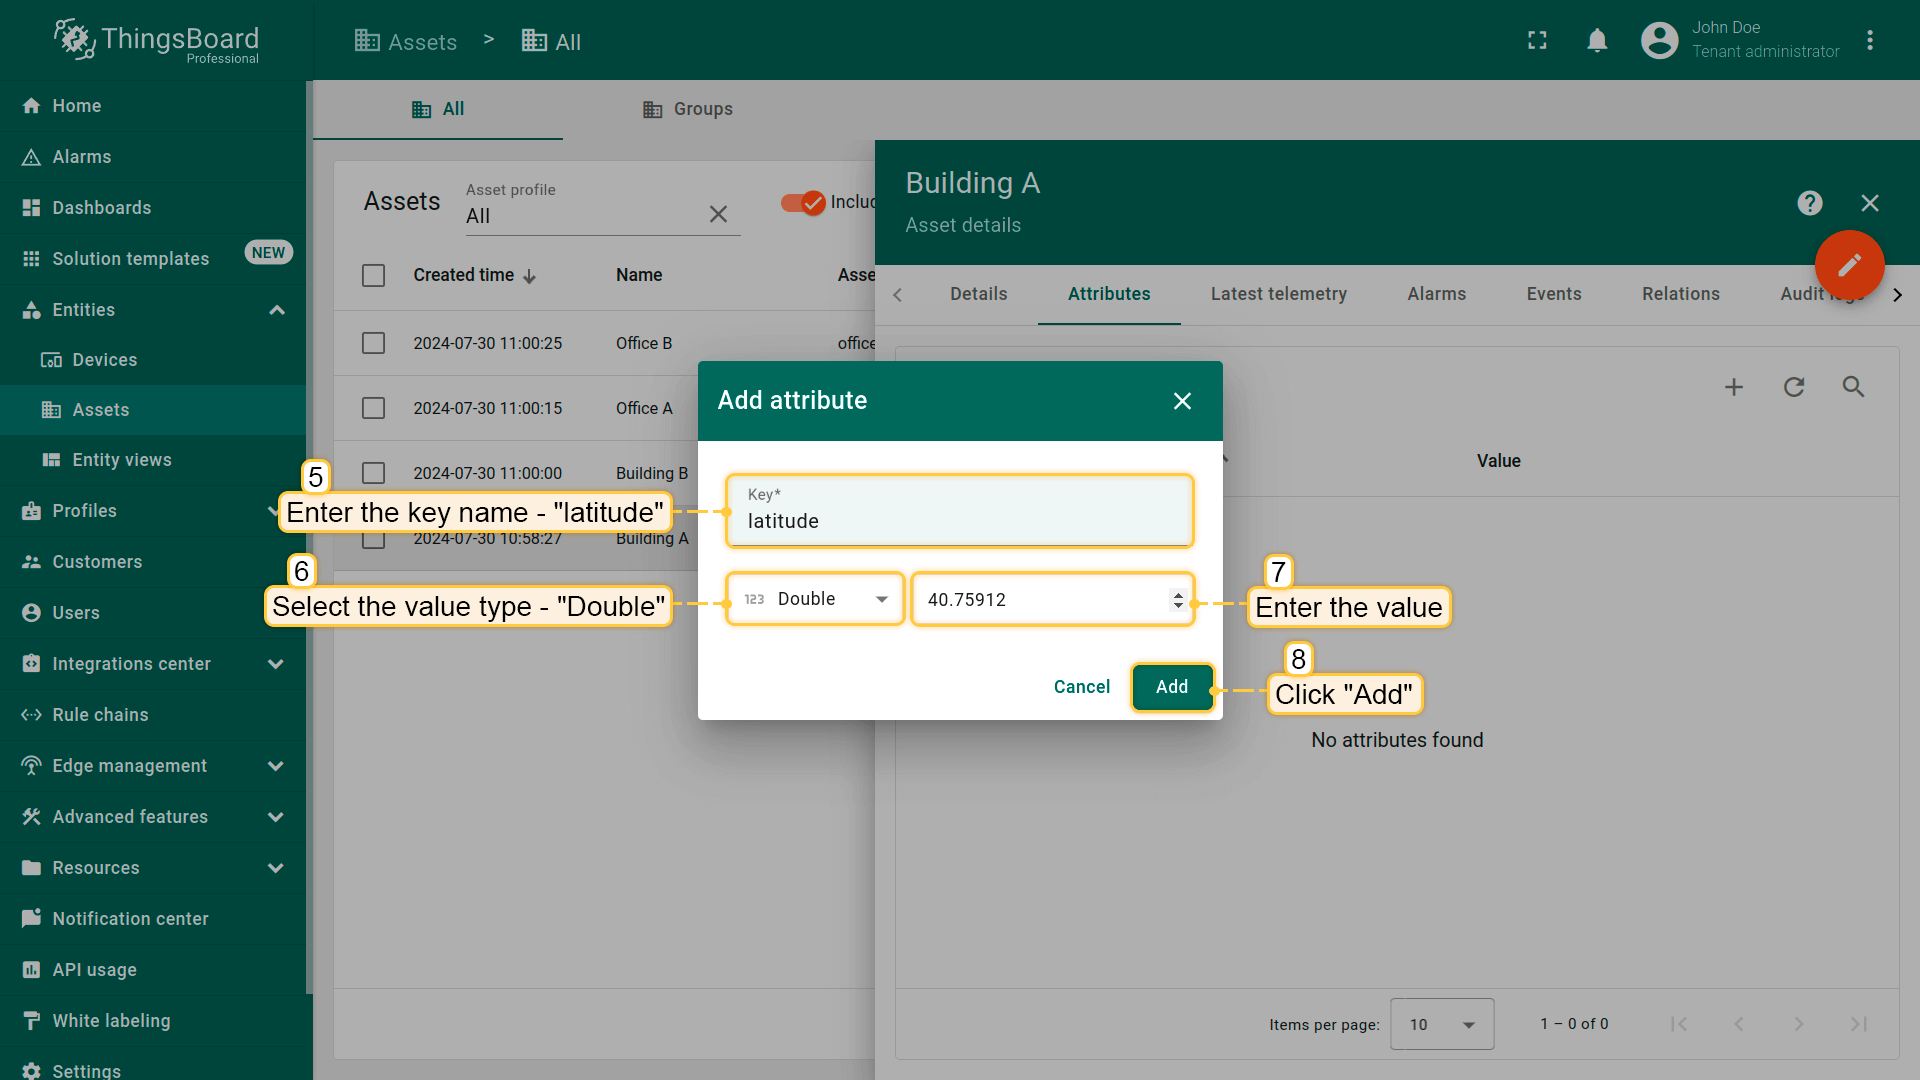
- We'll start with the coordinates for Building A: enter "latitude" as the key name, select "Double" as the value type, and input the latitude coordinates. Click "Add";
- Click the "plus" icon again to add another attribute. Enter "longitude" as the key name, select the "Double" as the value type, and input the building's longitude coordinates. Click "Add";

本示例中buildings使用的坐标:
| Building | latitude | longitude |
|---|---|---|
| Building A | 40.75912 | -73.97600 |
| Building B | 40.75901 | -73.96997 |
同样添加以下attributes:”address“、”email“、”phone“、“contactPerson” 和 “buildingImage“,取值见下表。这些attributes使用value type “String”。


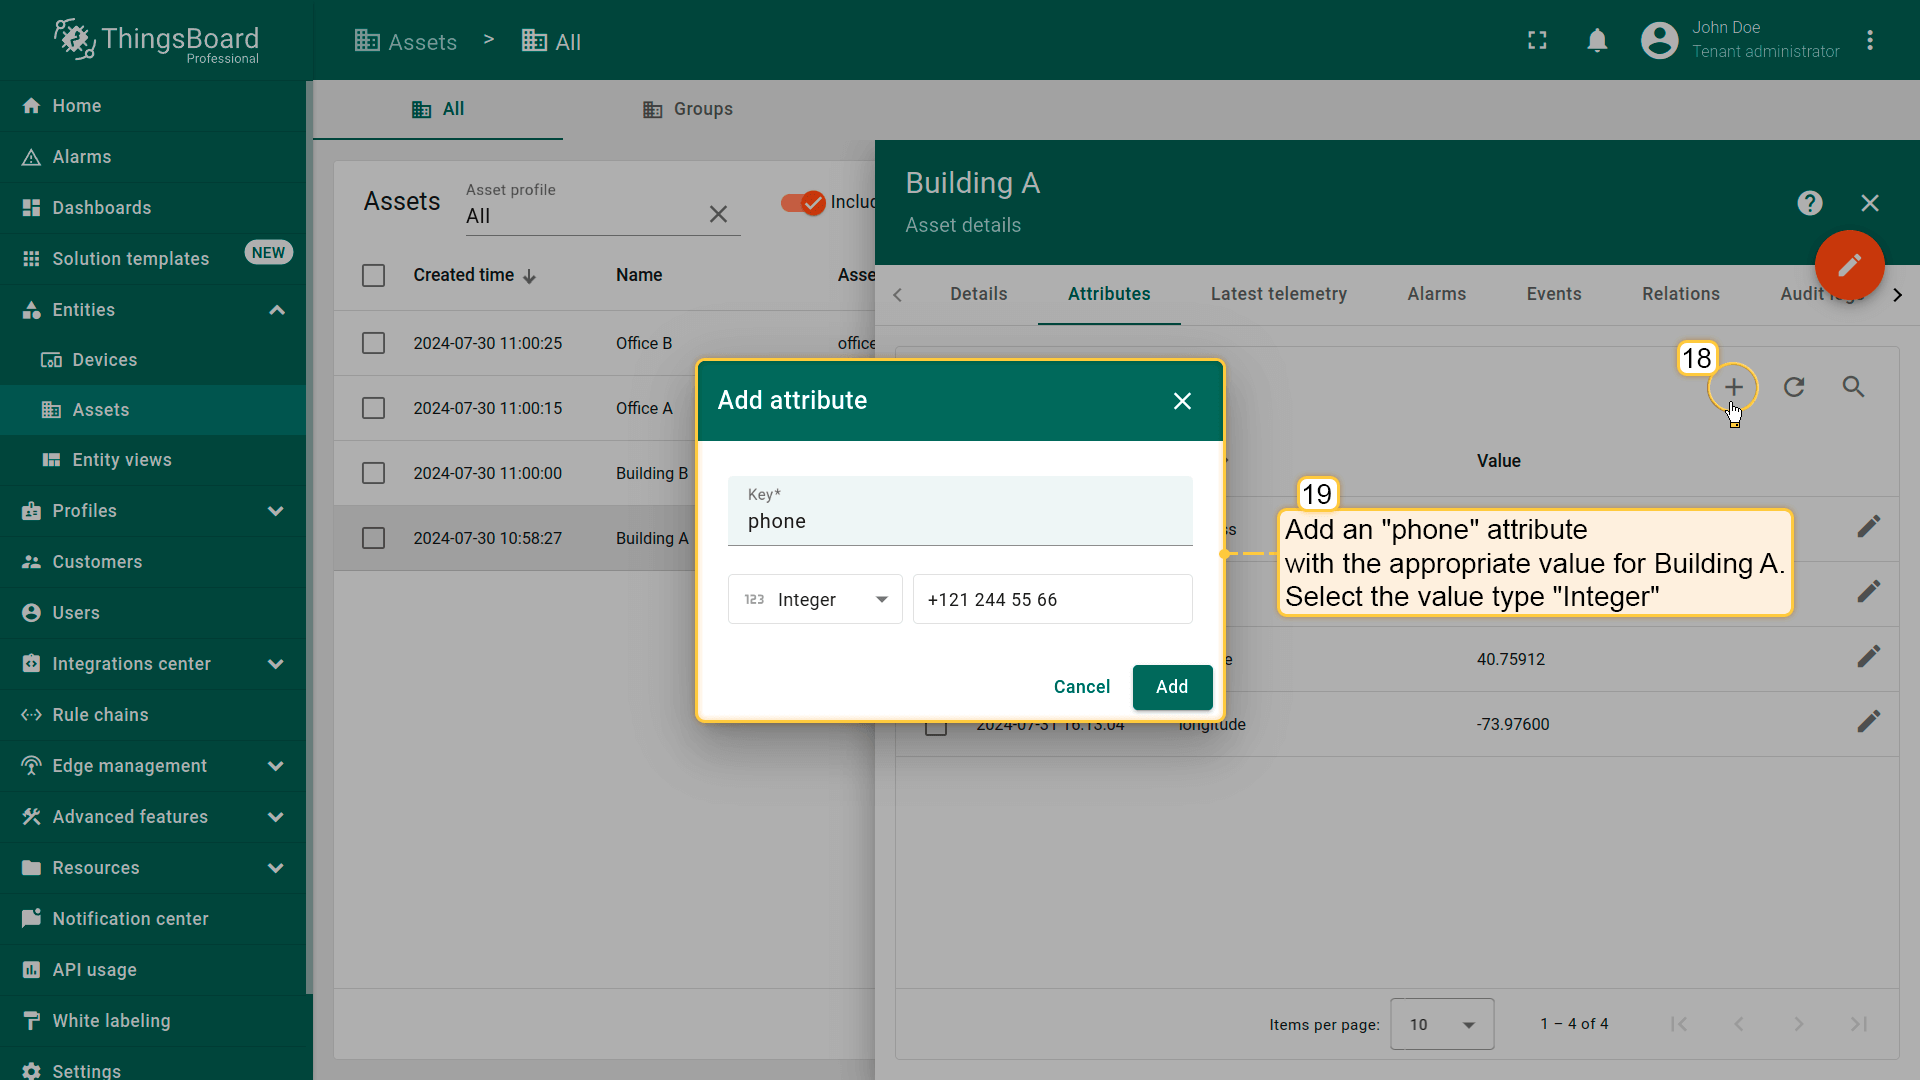

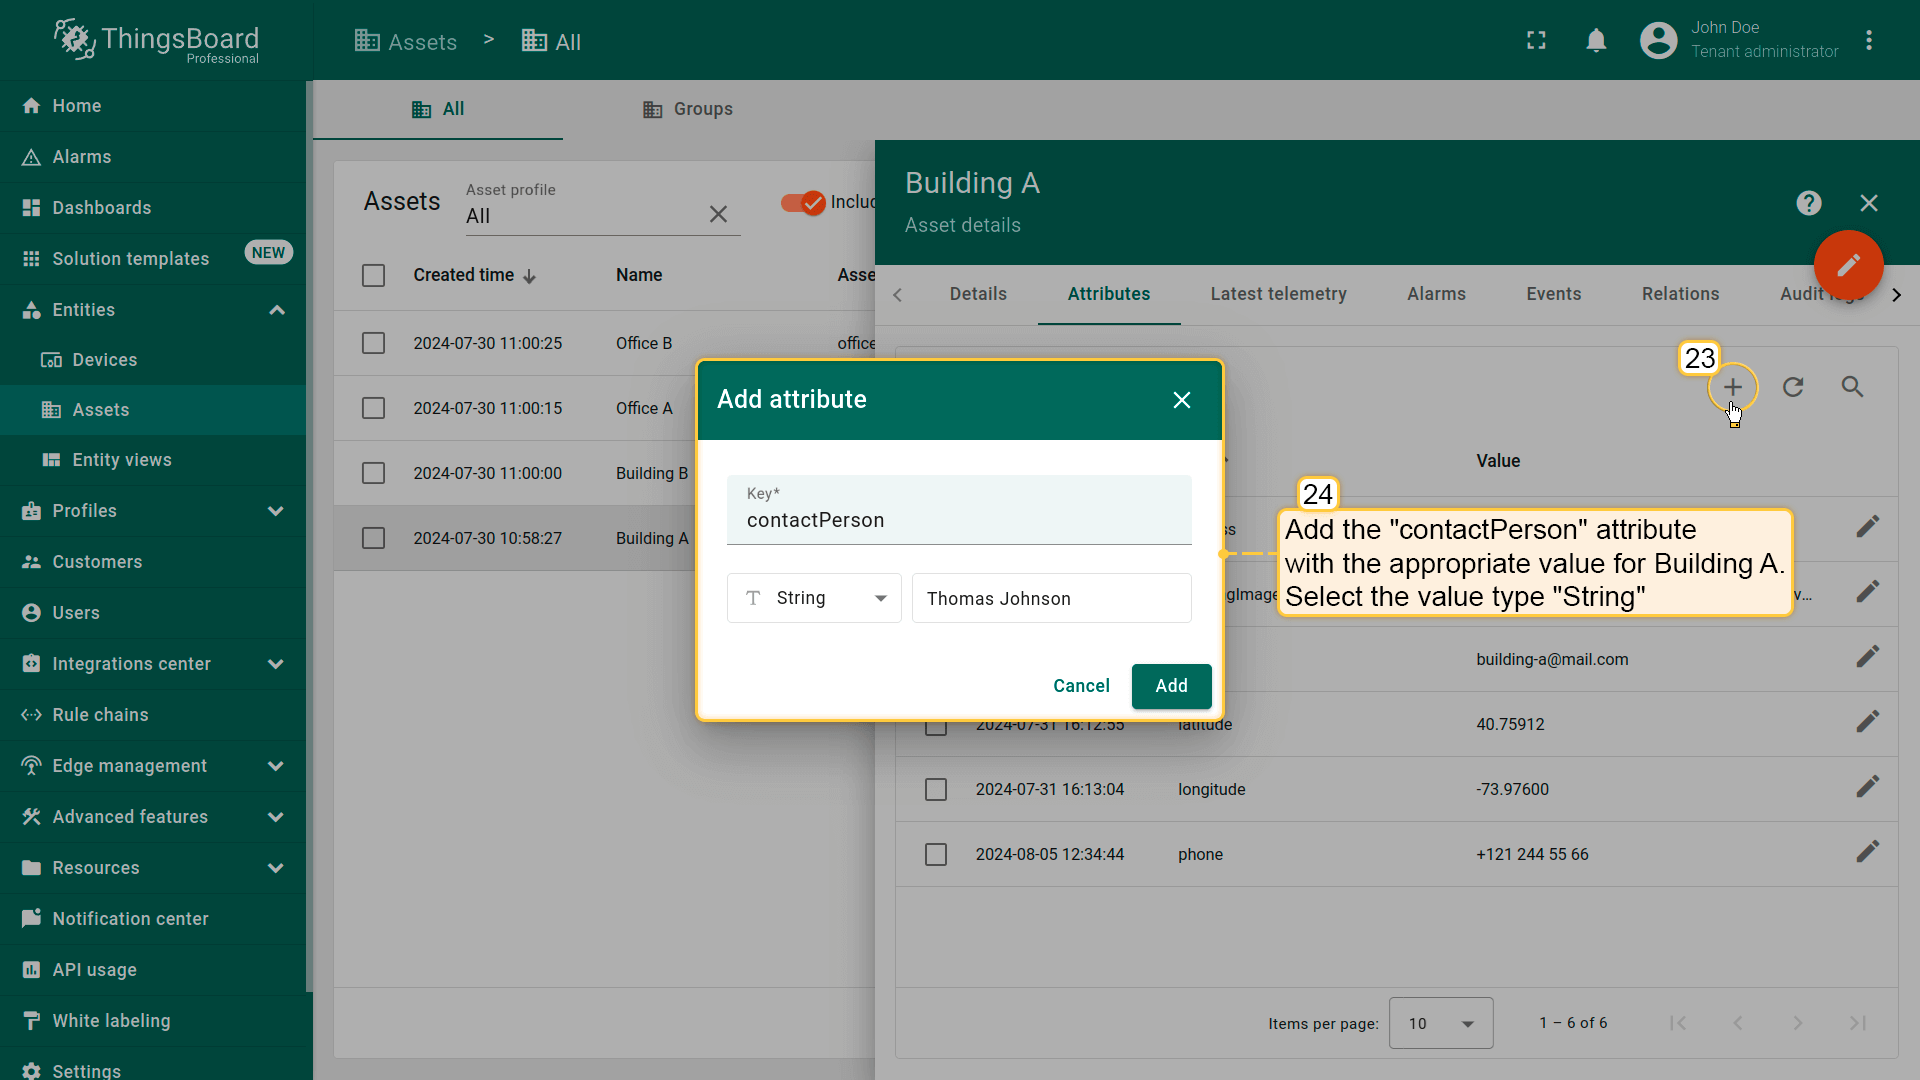
本示例中buildings的信息:
| Building | Address | Phone | Contact person | Building image | |
|---|---|---|---|---|---|
| Building A | 645 5th Ave, New York | building-a@mail.com | +121 244 55 66 | Thomas Johnson | Use the link to the Building A image |
| Building B | 641 Lexington Ave, New York | building-b@mail.com | +121 555 66 77 | Jack Williams | Use the link to the Building B image |
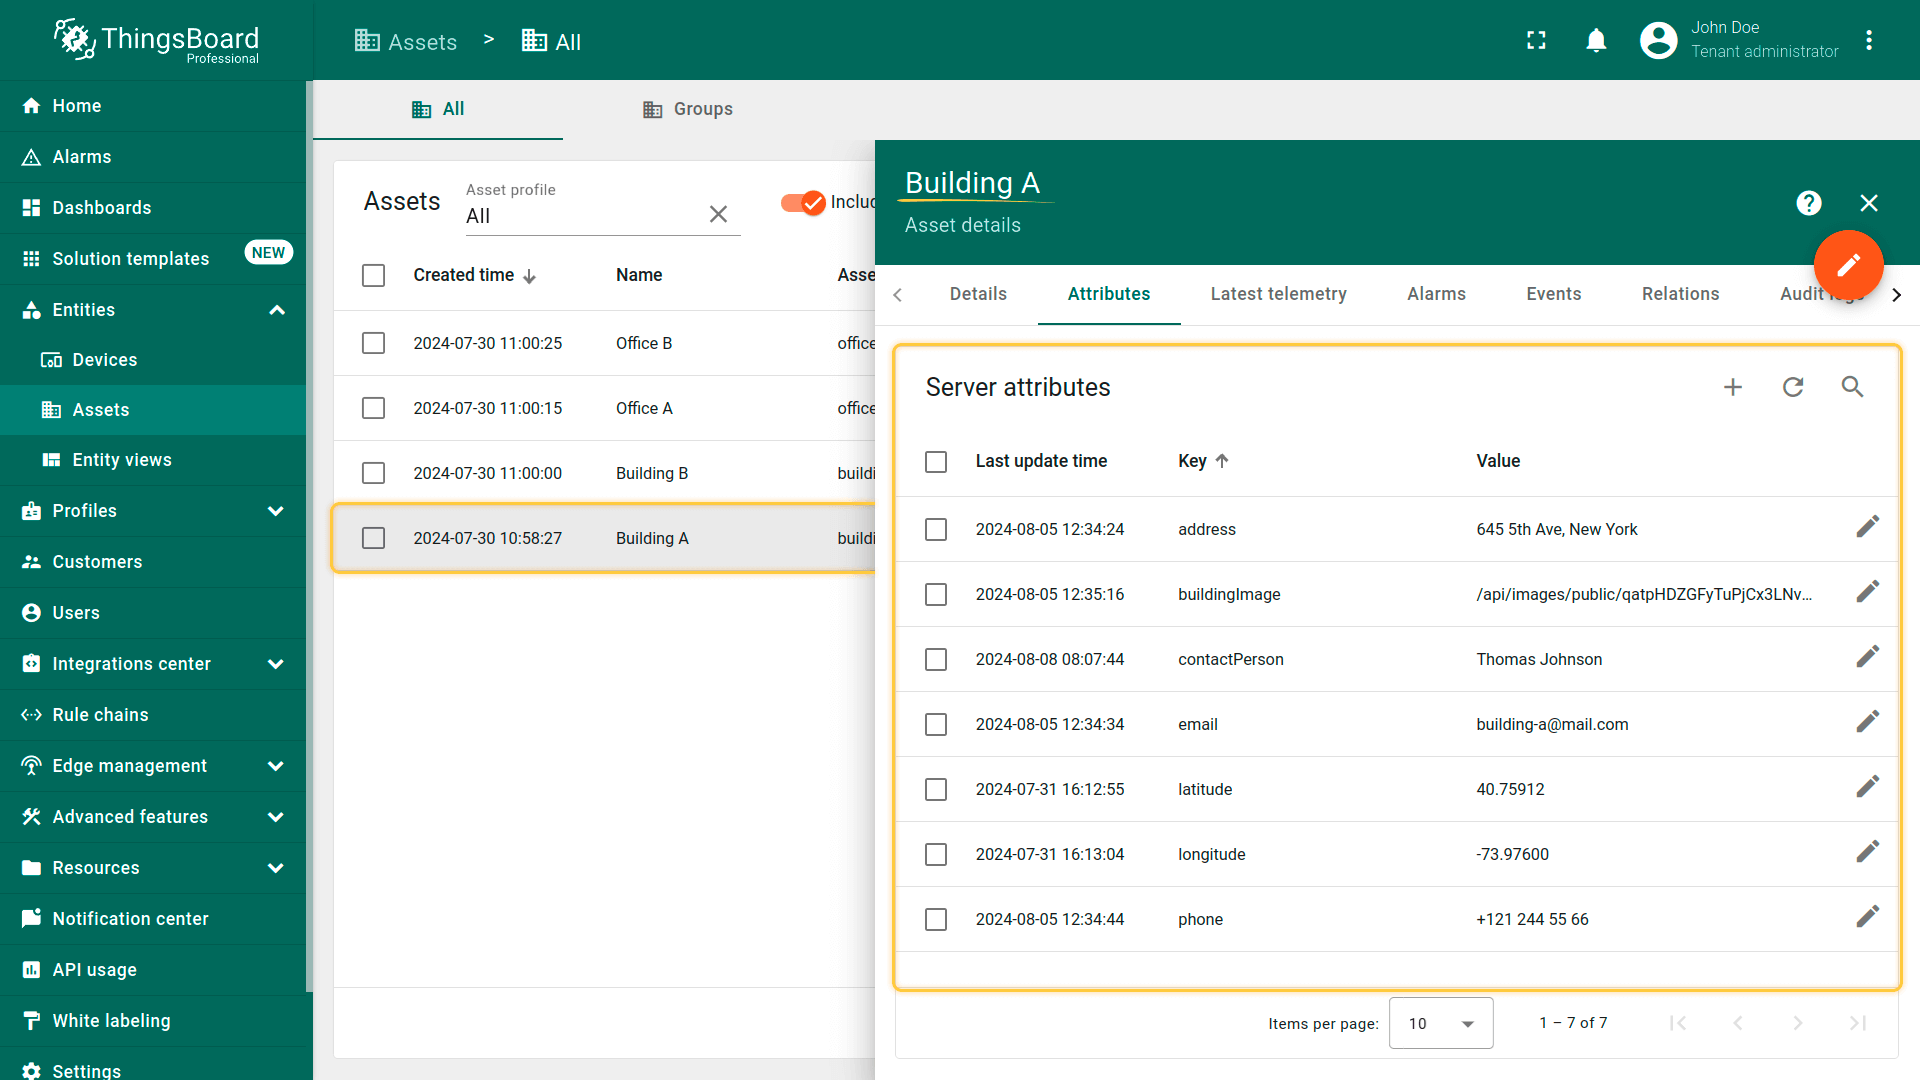
Building A的attributes列表最终应如下:
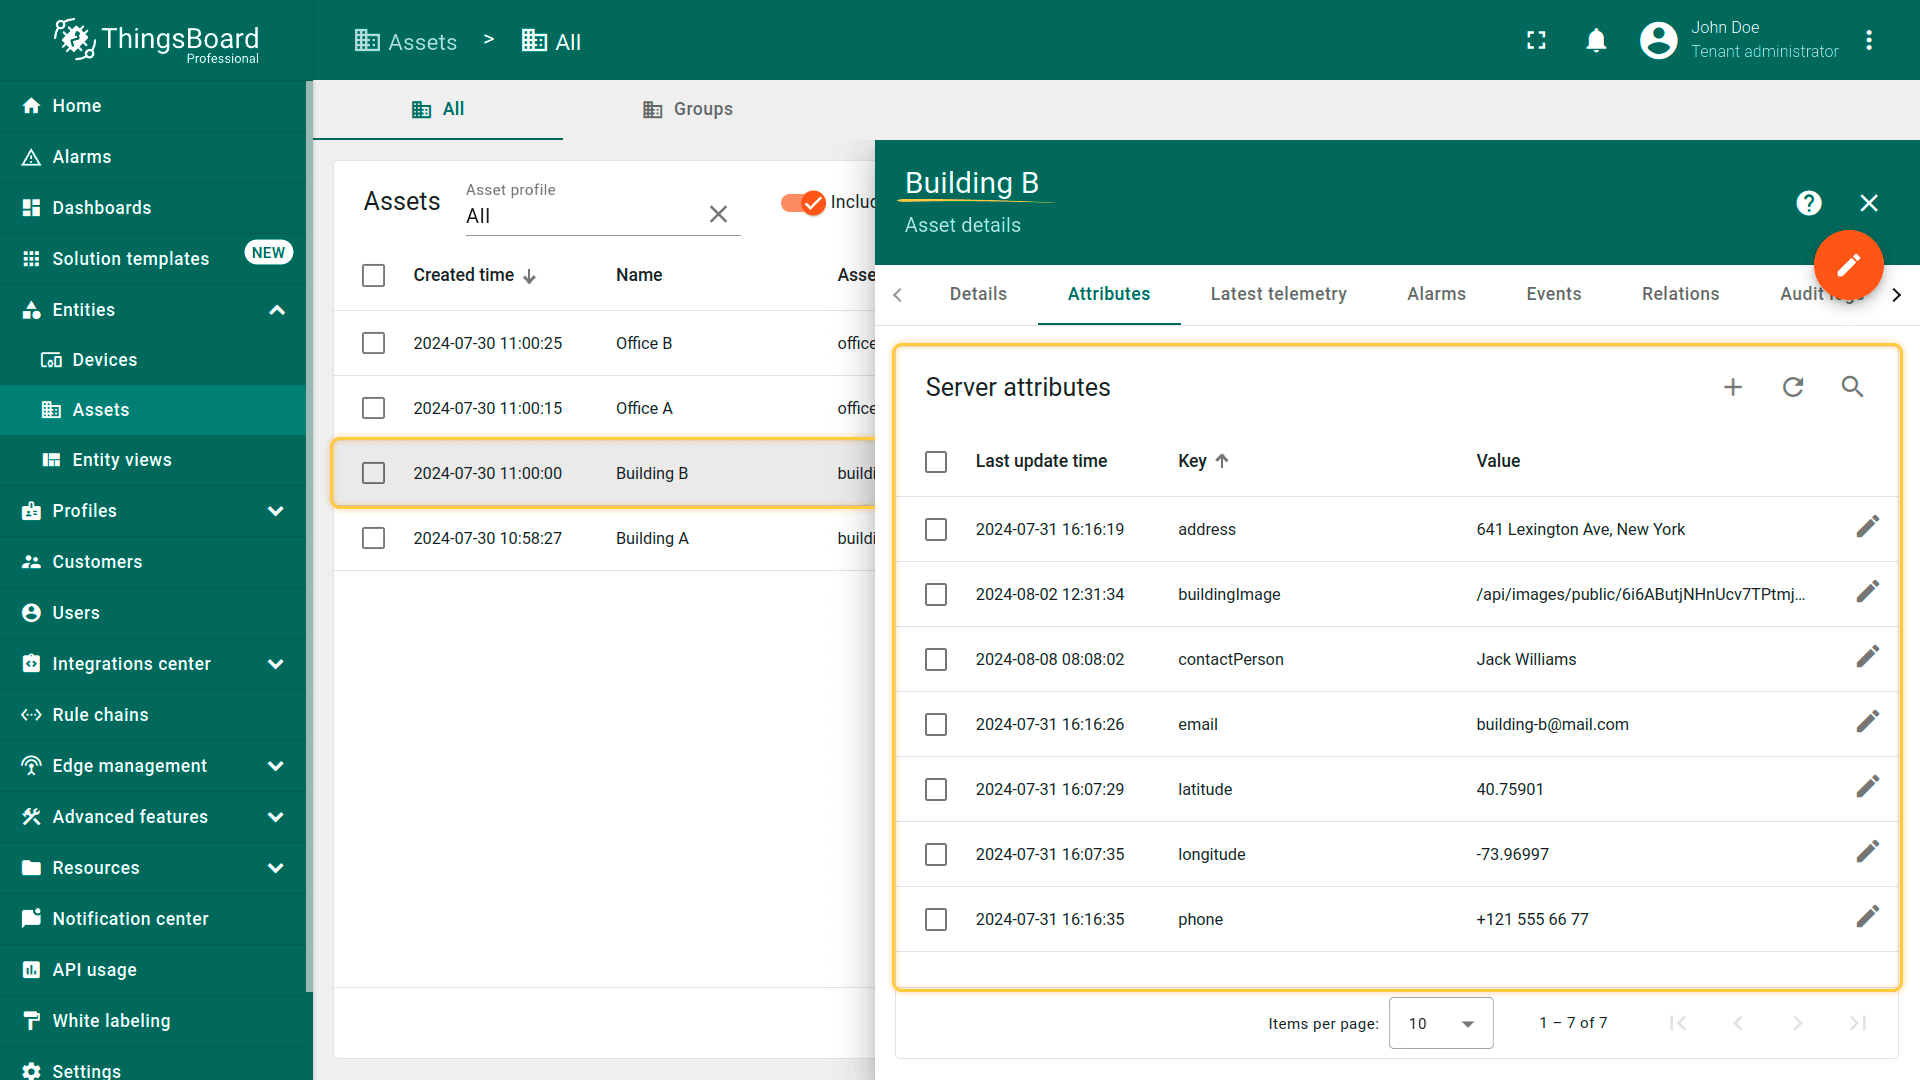
Building B的attributes列表应如下:
Adding OpenStreet Map widget
准备工作已完成,现在可添加 OpenStreet Map 部件:
- 打开已创建的 “Buildings” dashboard;
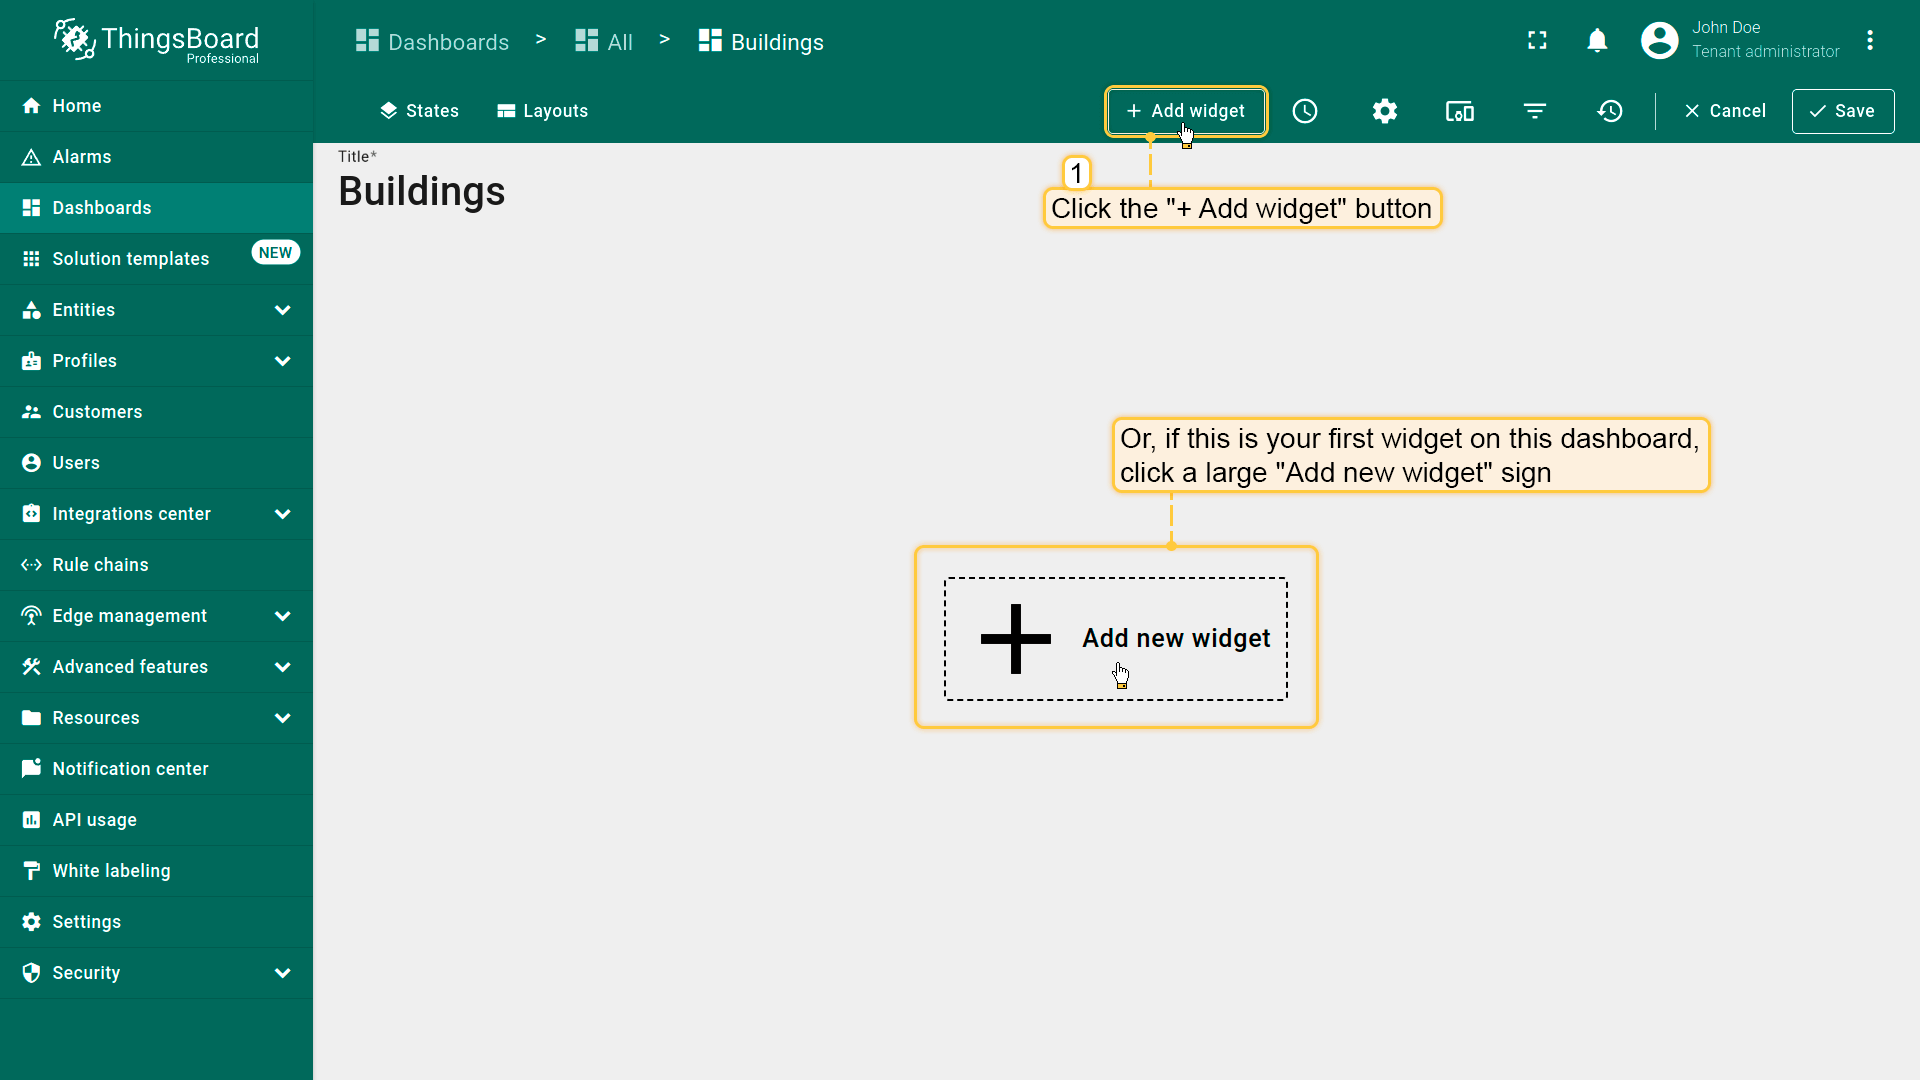
- 点击屏幕顶部的 “Add widget” 或点击中央大图标 “Add new widget”(若为本dashboard第一个部件);
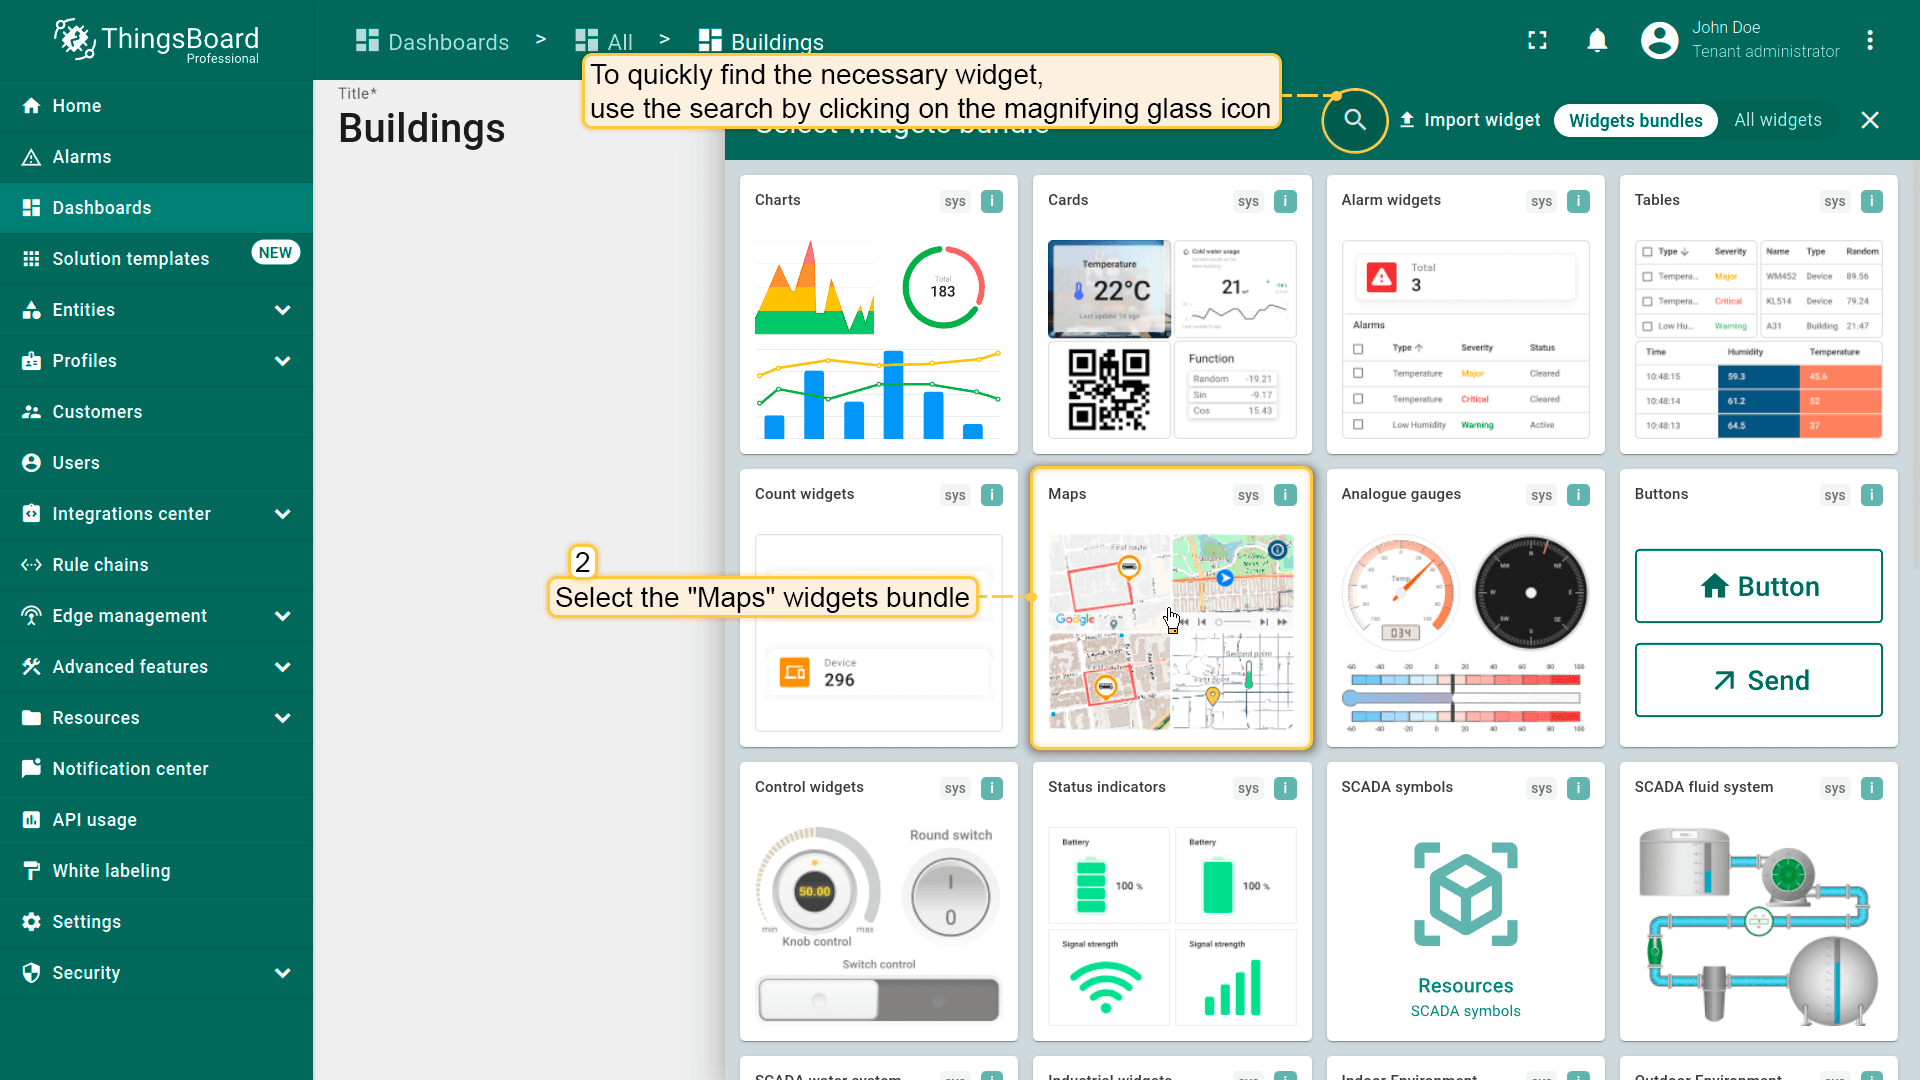
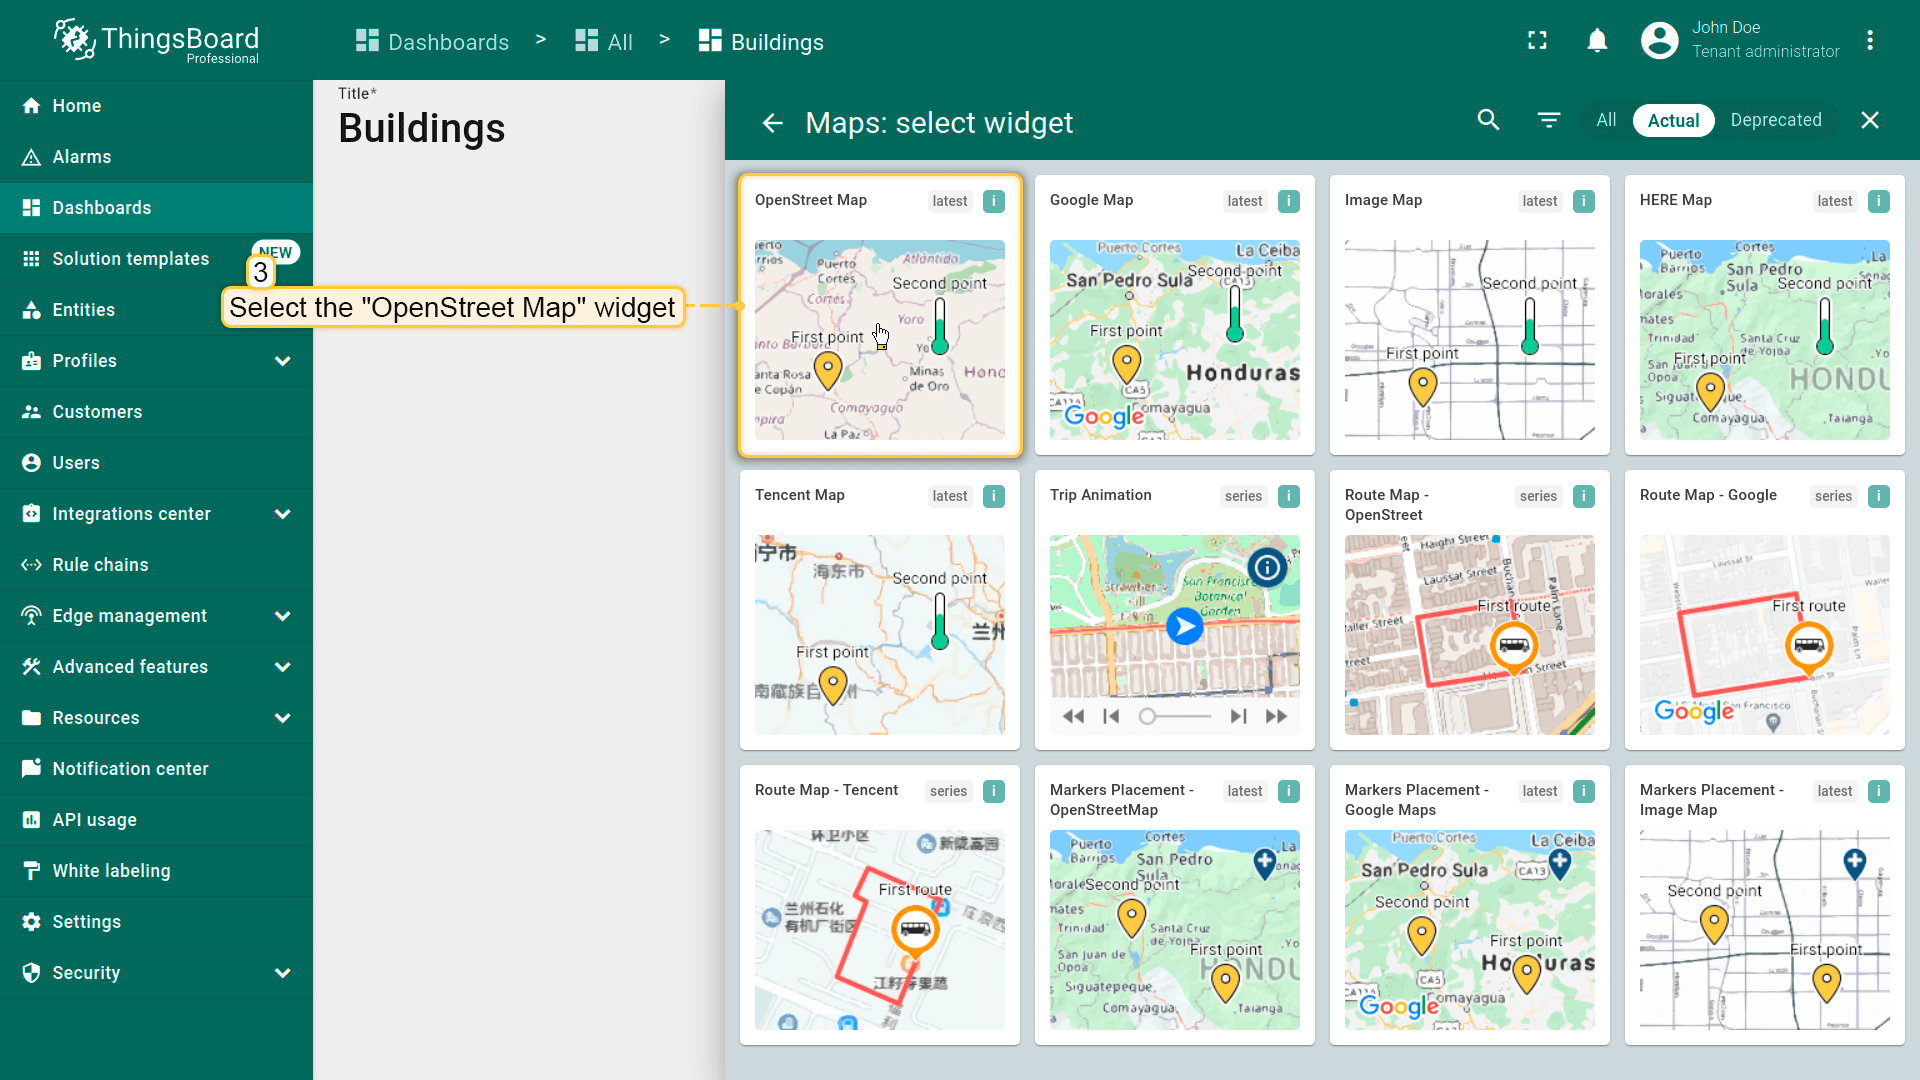
- 在 “Maps” 部件包中找到 “OpenStreet Map” 并点击;
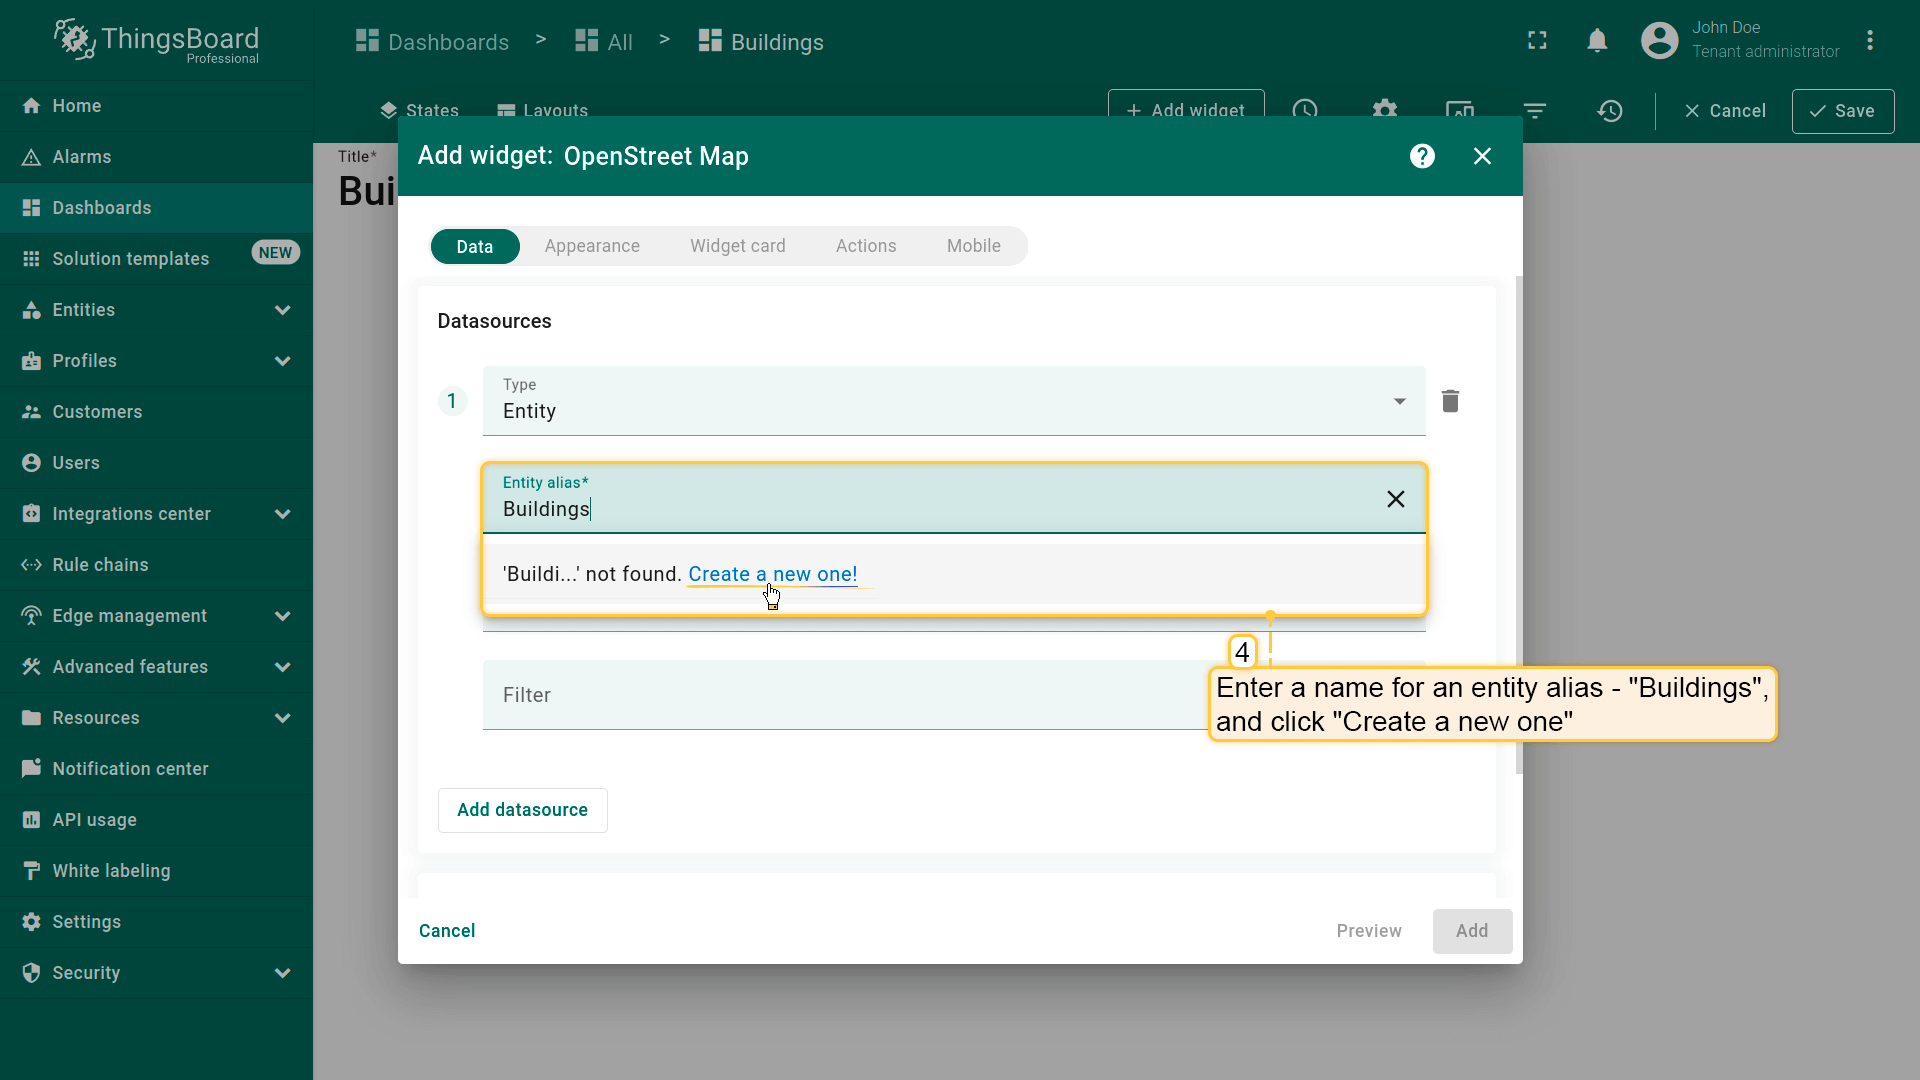
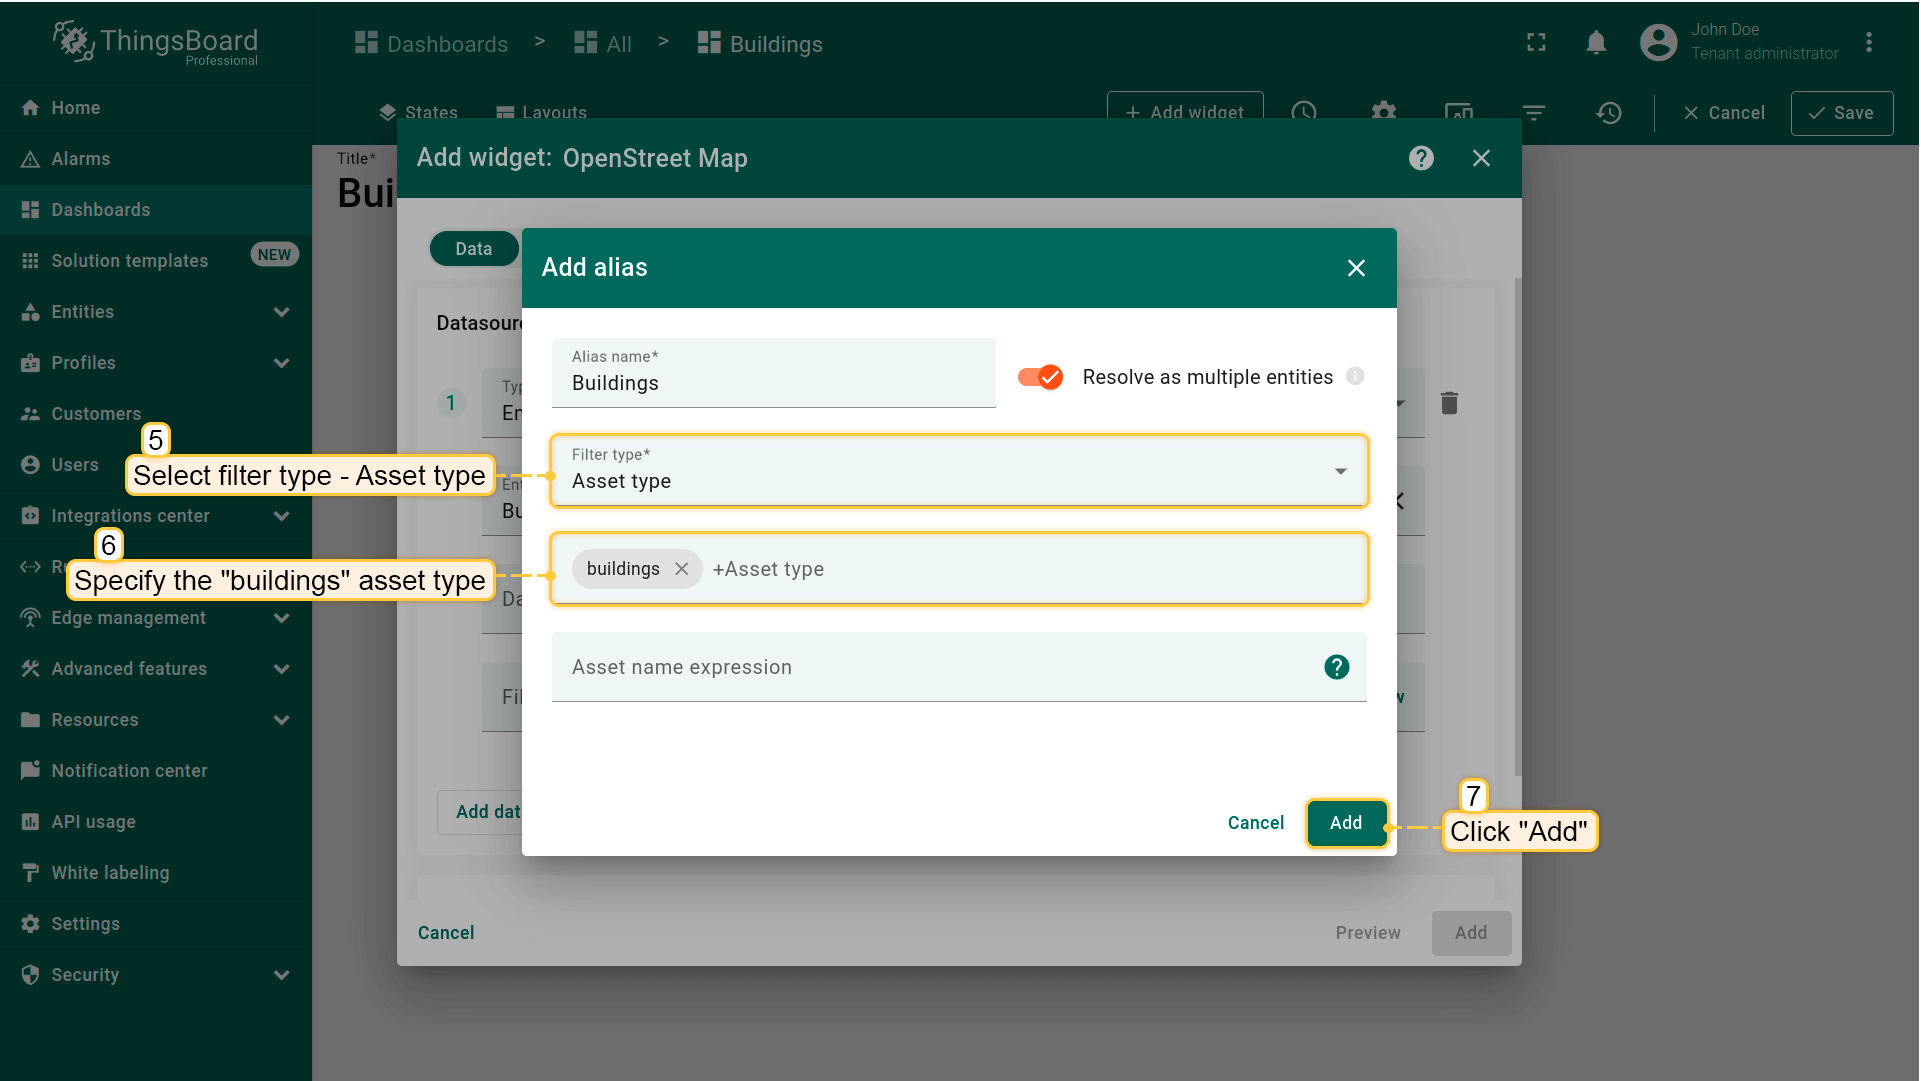
- 需添加 alias 以定义数据来源实体。在 “Alias” 字段输入名称 “Buildings”,点击 “Create a new one”;
- 输入alias名称,选择filter type “Asset type”,指定asset type “building”,点击右下角 “Add”。该alias将在部件中显示所有 “building” 类型的assets;
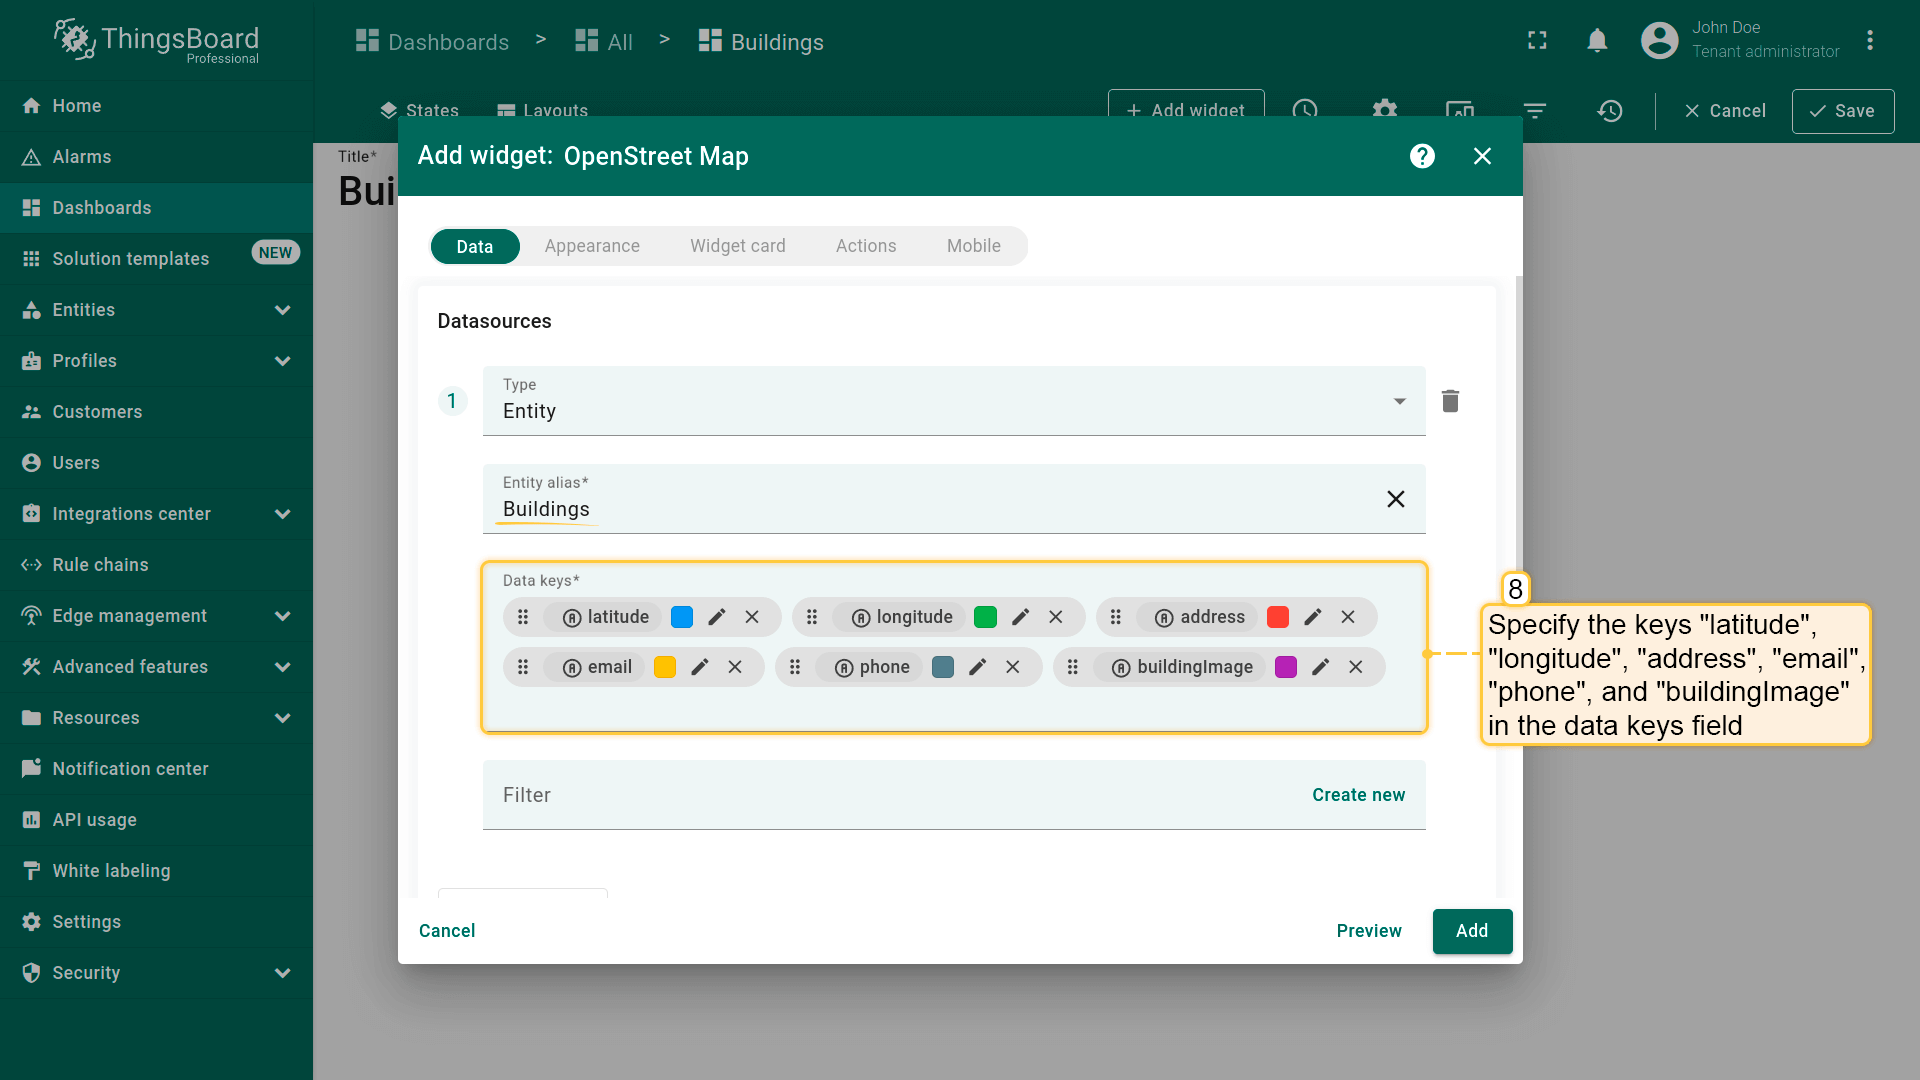
- 添加以下attributes作为data keys:”latitude”、”longitude”、”address”、”email”、”phone”、”buildingImage”。
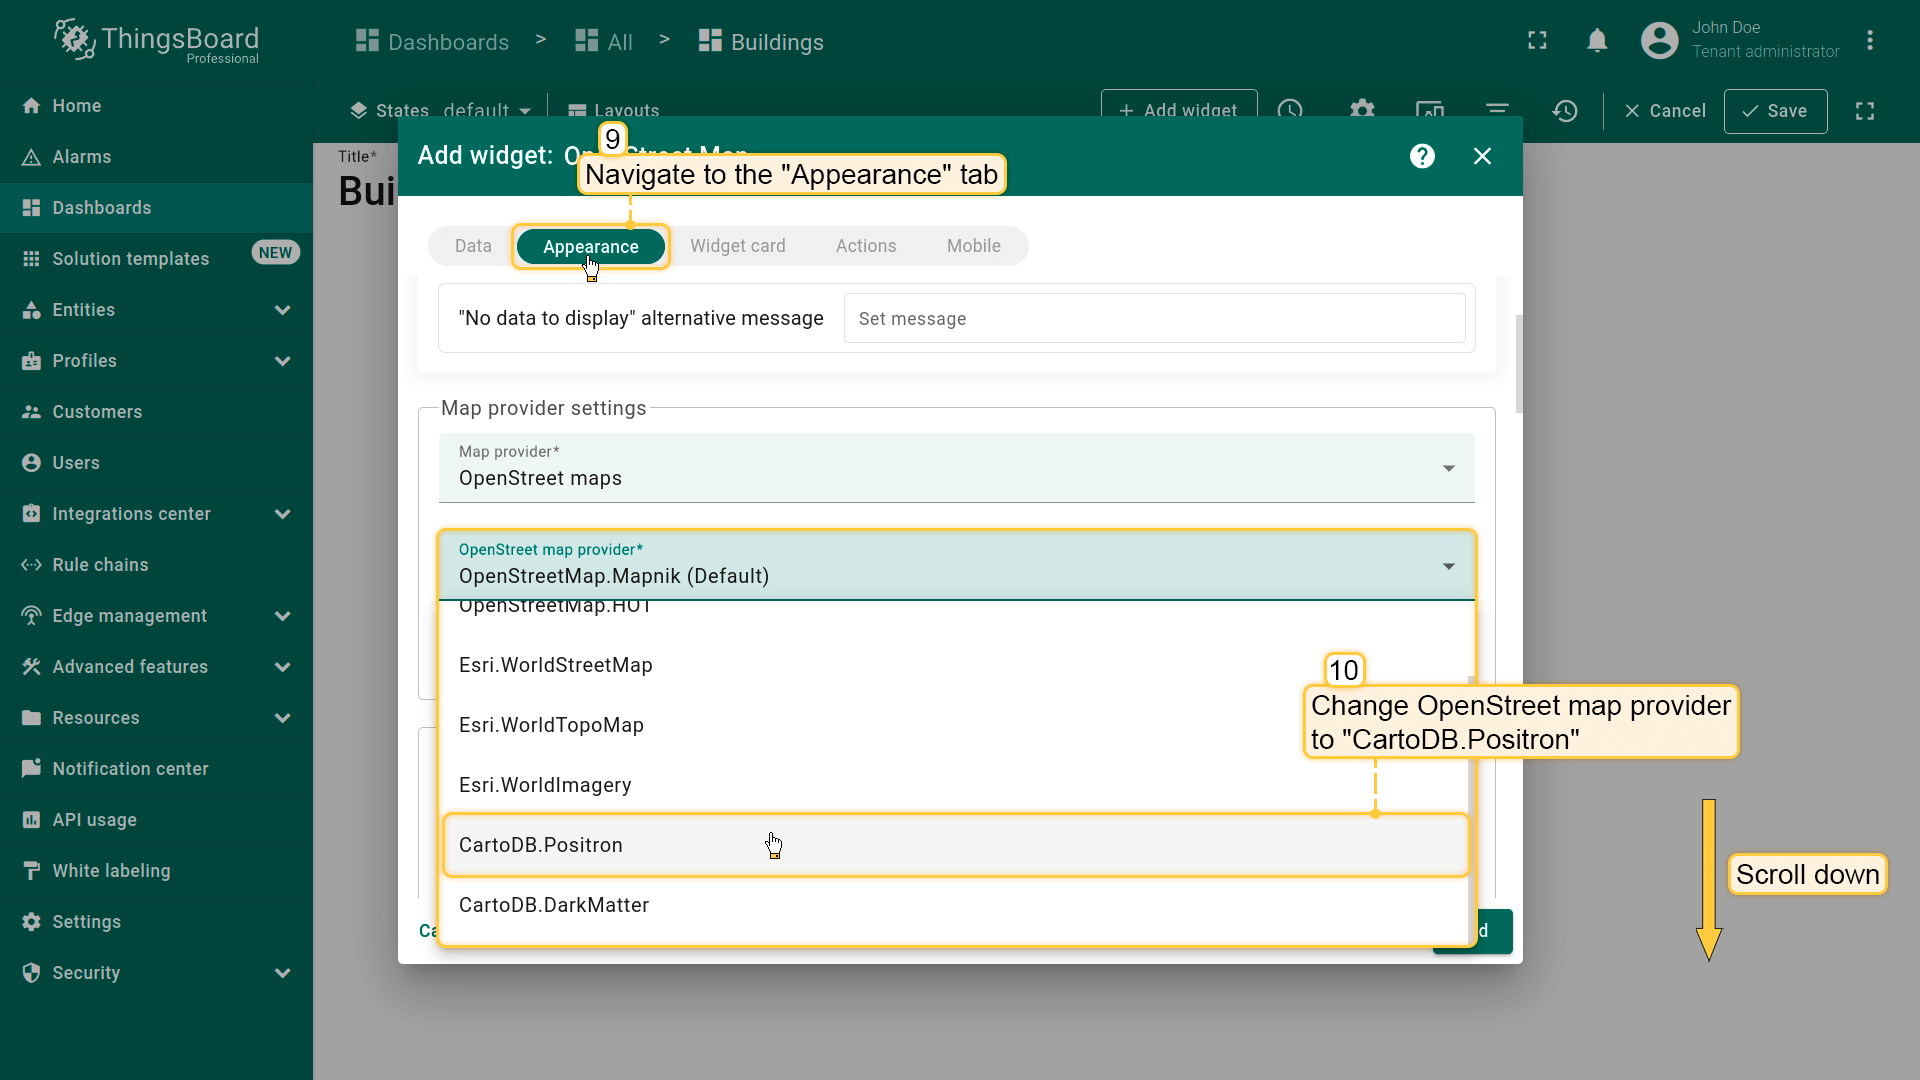
“Appearance” 选项卡:
- 进入 “Appearance” 选项卡,将OpenStreet map provider改为 “CartoDB.Positron”;
-
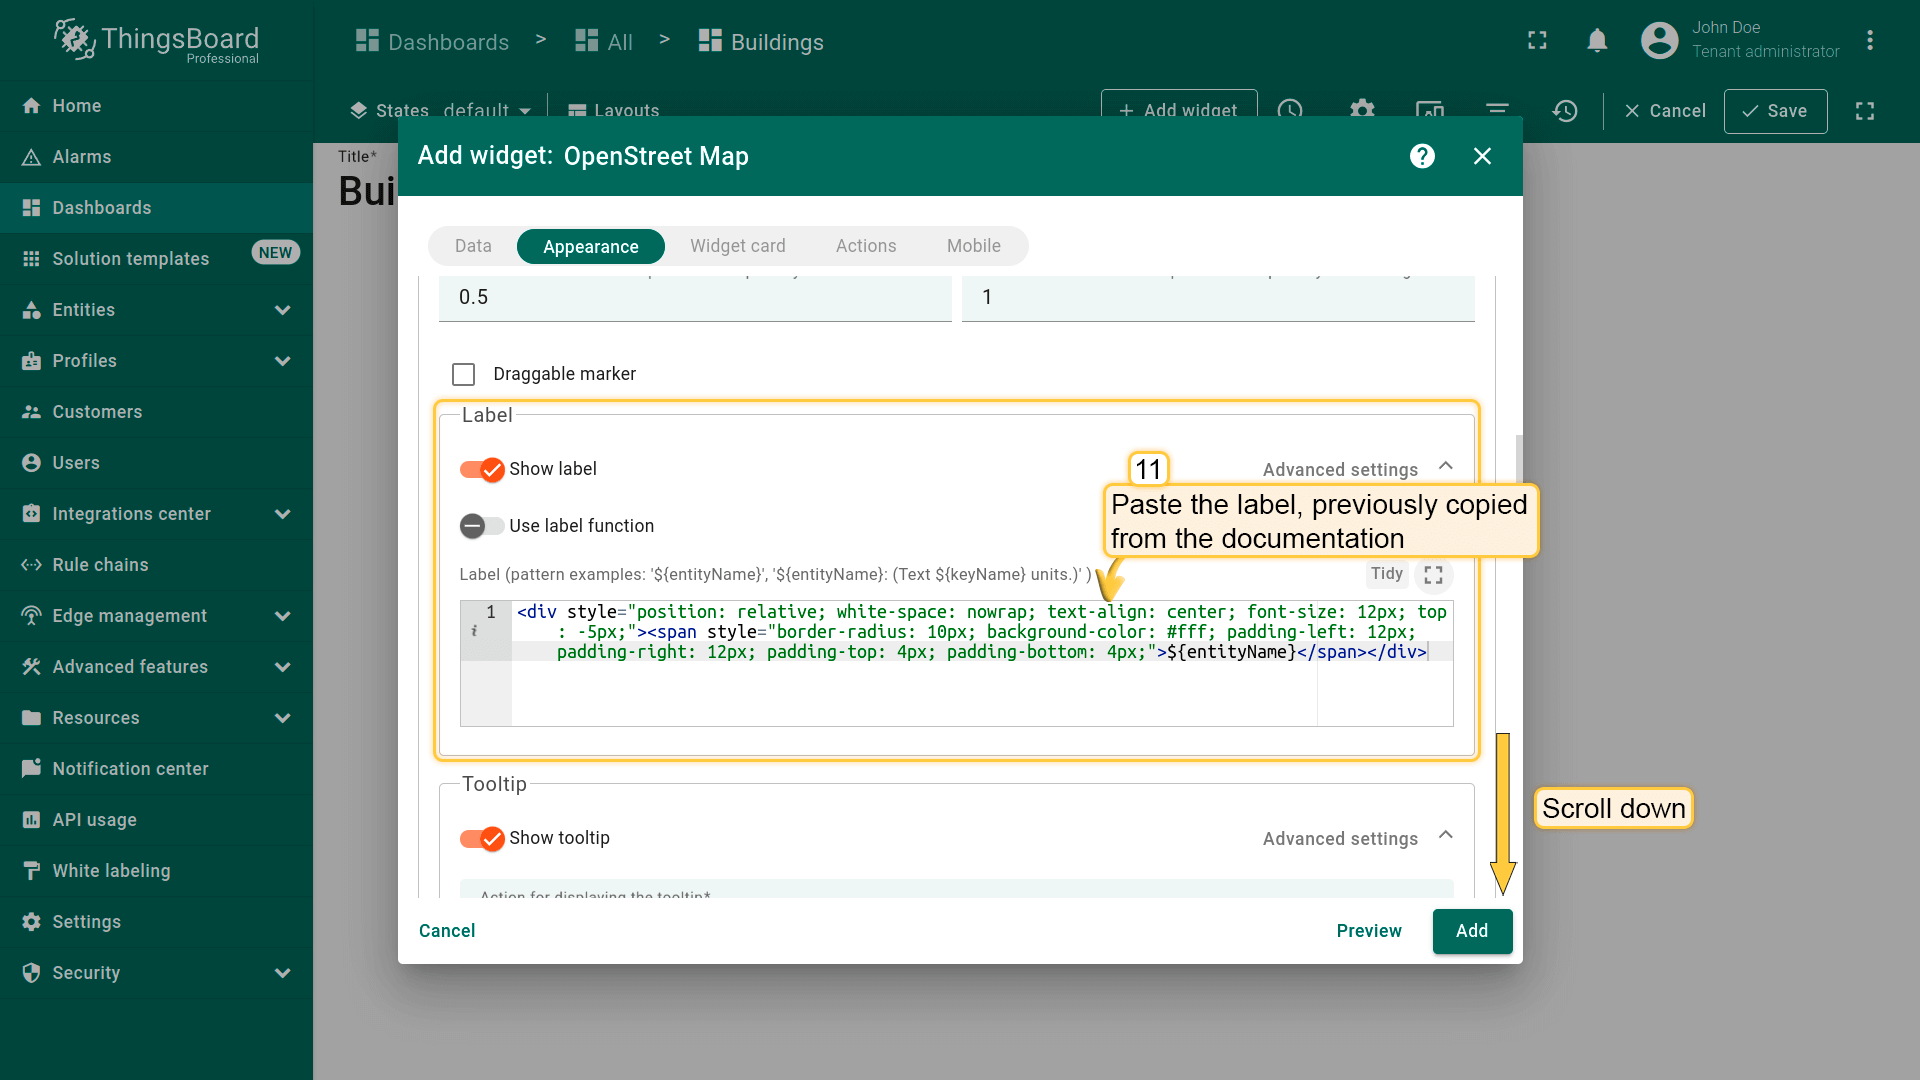
滚动到 “Label” 区域。标签位于标记上方,可显示实体信息,如名称、类型、telemetry等。
从文档中复制并在对应字段添加label,以显示建筑名称并定制tooltip样式;
本示例使用的label:
1
<div style="position: relative; white-space: nowrap; text-align: center; font-size: 12px; top: -5px;"><span style="border-radius: 10px; background-color: #fff; padding-left: 12px; padding-right: 12px; padding-top: 4px; padding-bottom: 4px;">${entityName}</span></div>
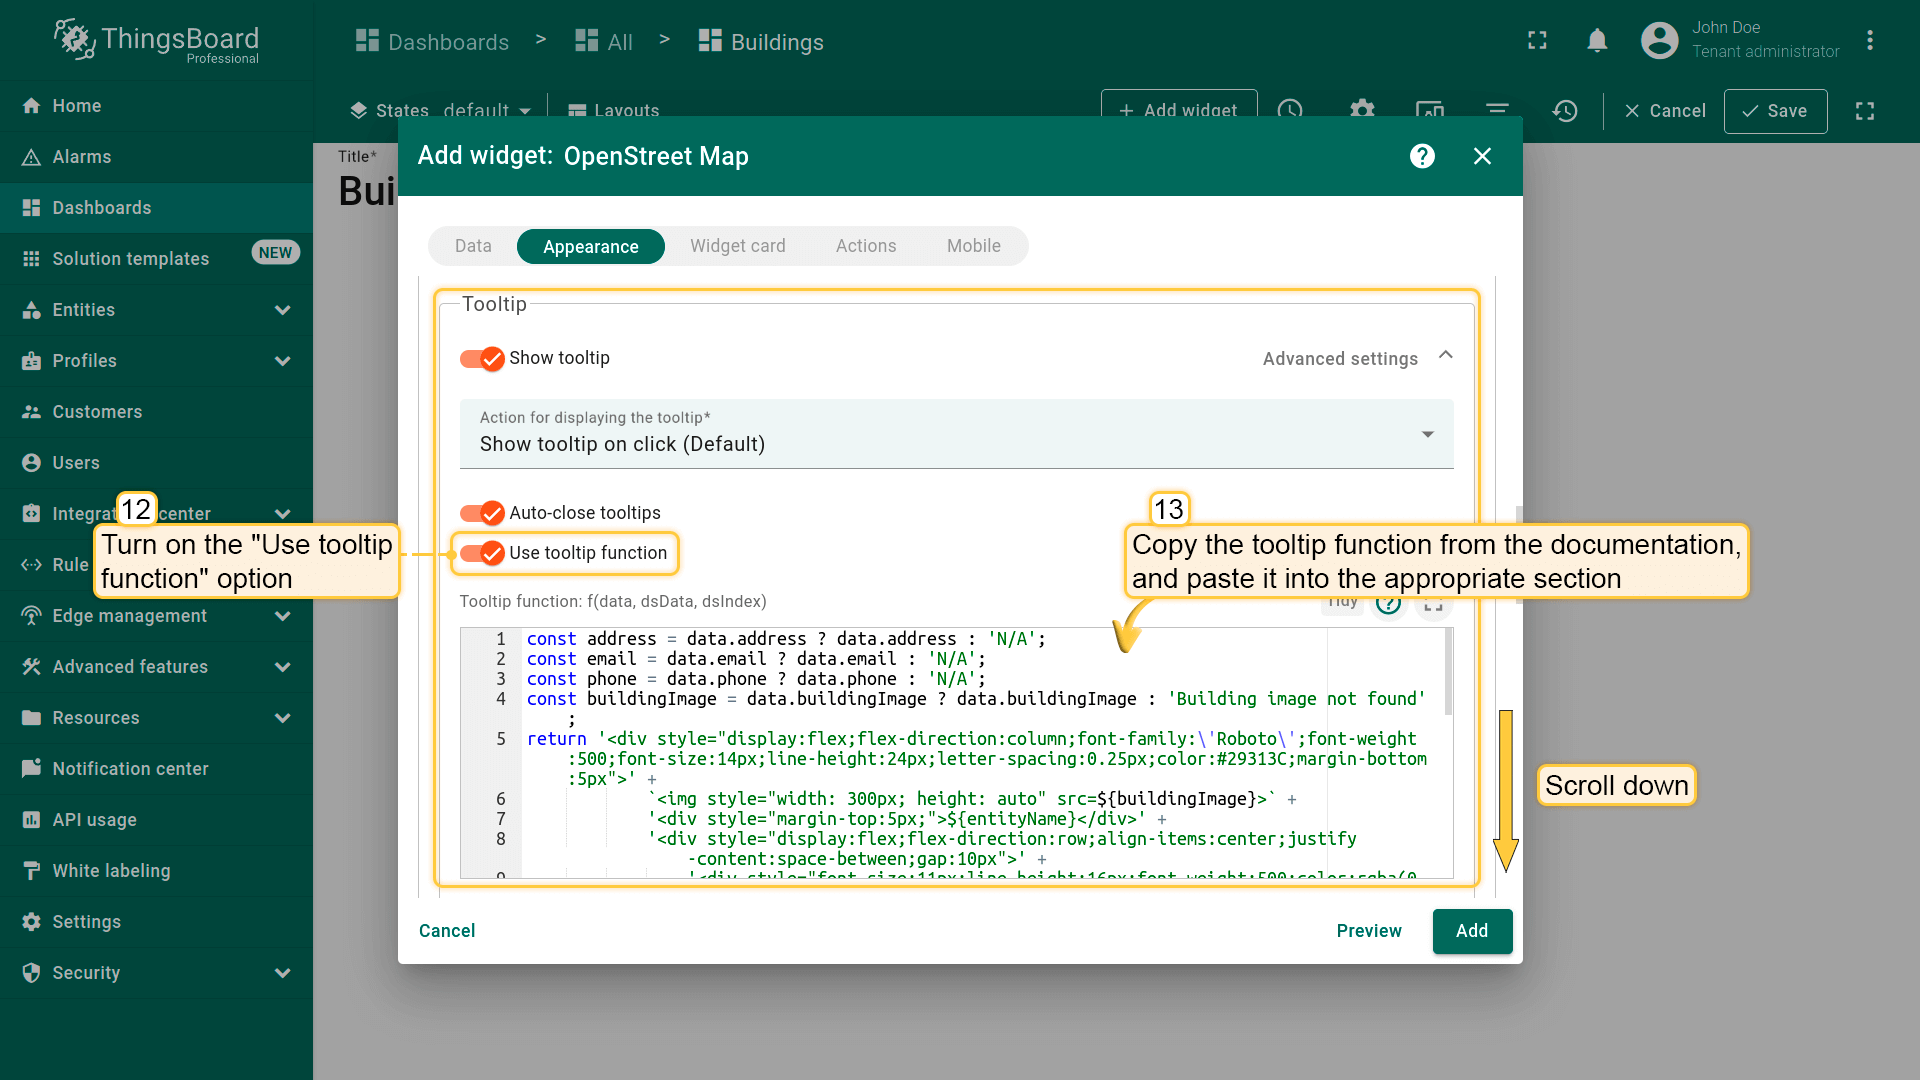
- 向下找到 “Tooltip” 区域。此处配置点击建筑标记时tooltip中显示的内容。
- 开启 “Use tooltip function” 选项;
- 使用文档中的函数以显示所选建筑的图片和联系方式。
本示例使用的tooltip函数:
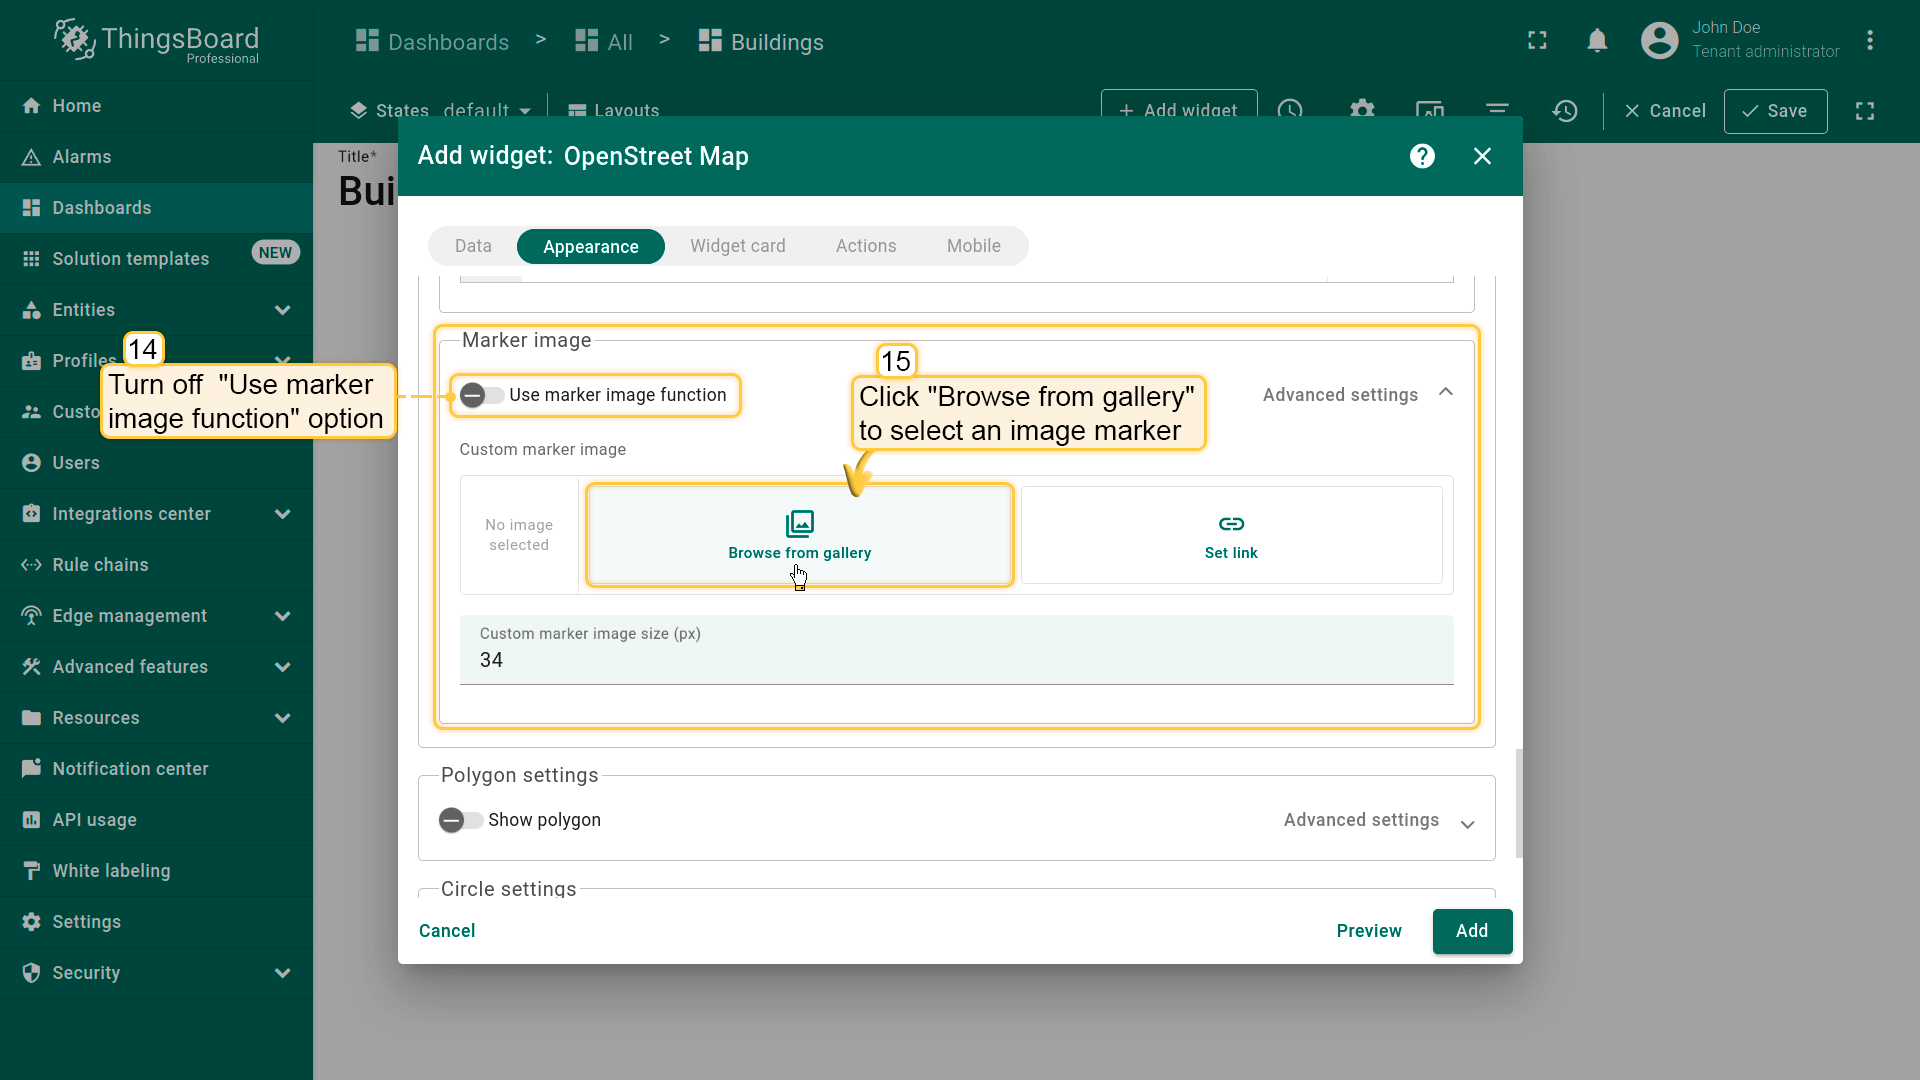
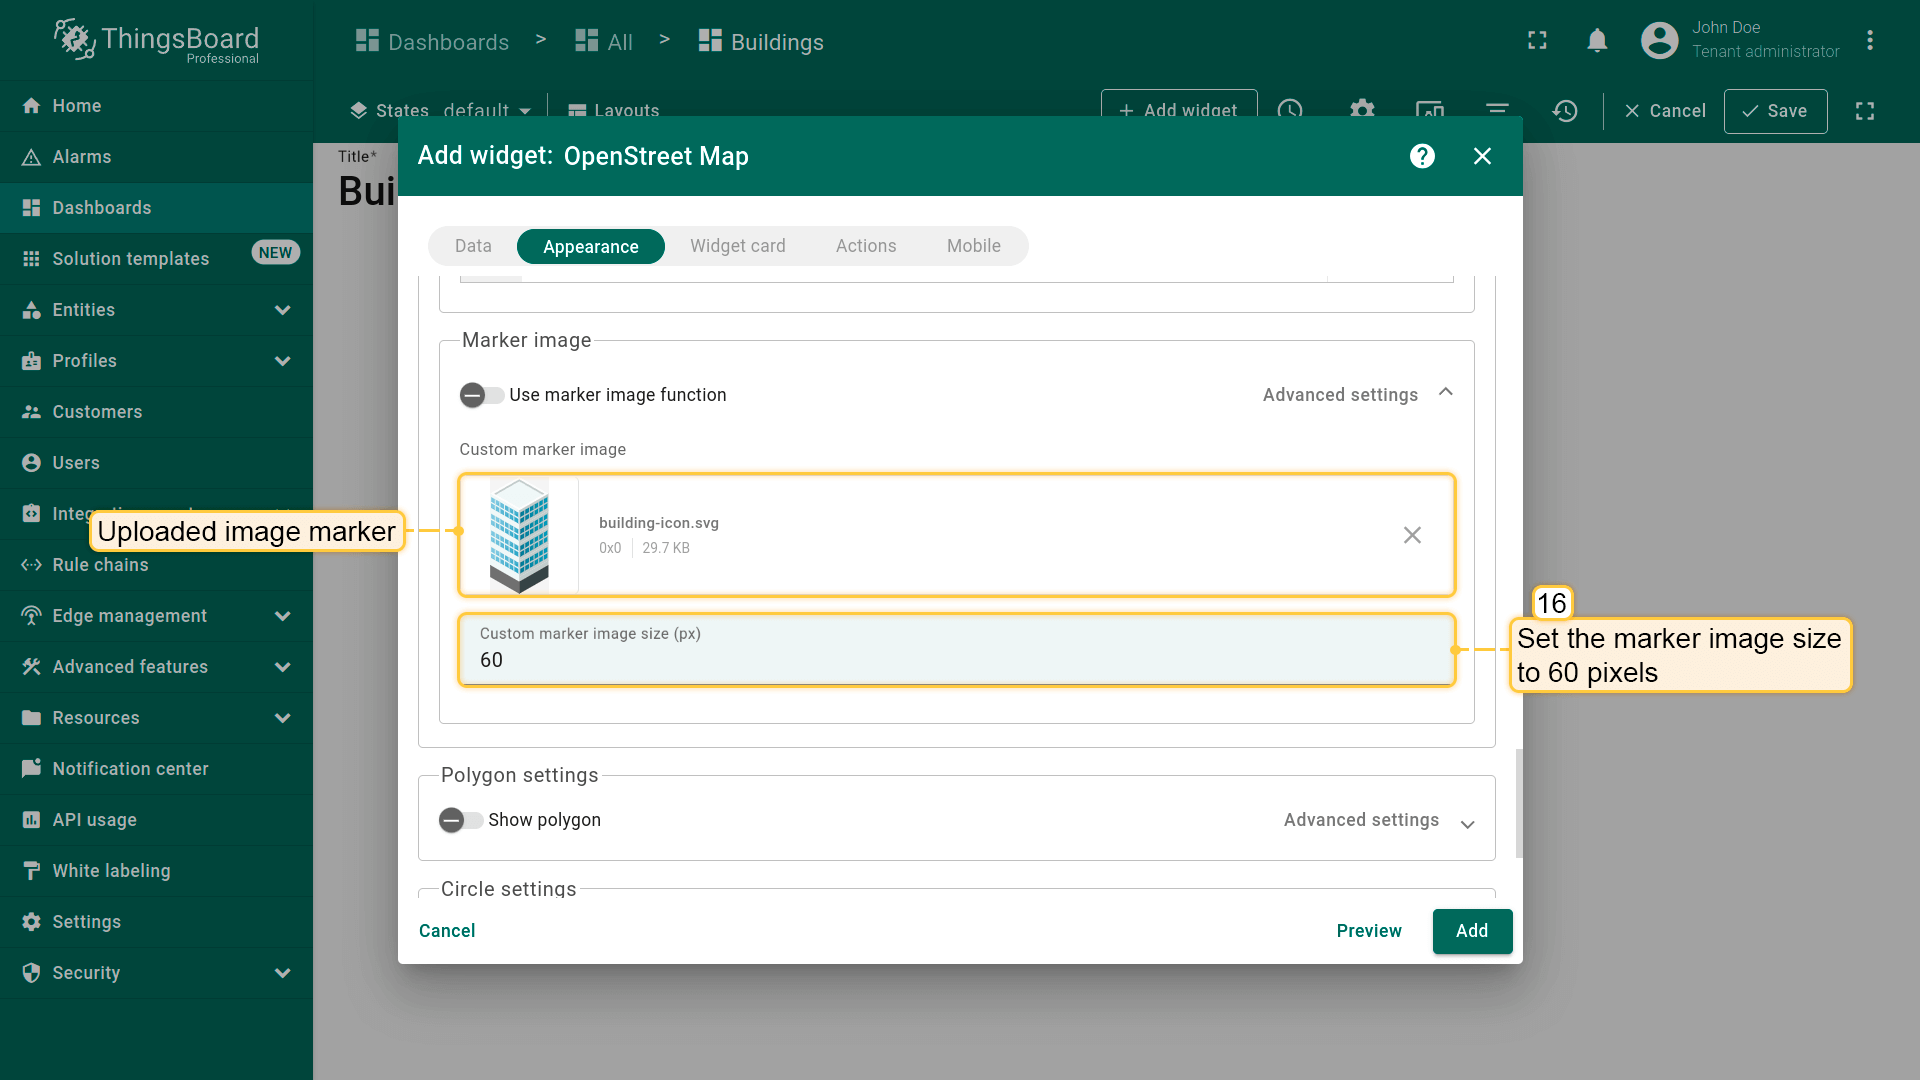
- 在 “Marker image” 区域关闭 “Use marker image function”,添加自定义marker图片。点击 “Browse from gallery” 上传新marker图。使用 提供的自定义marker图 或上传自己的marker图。将marker大小设为60像素;
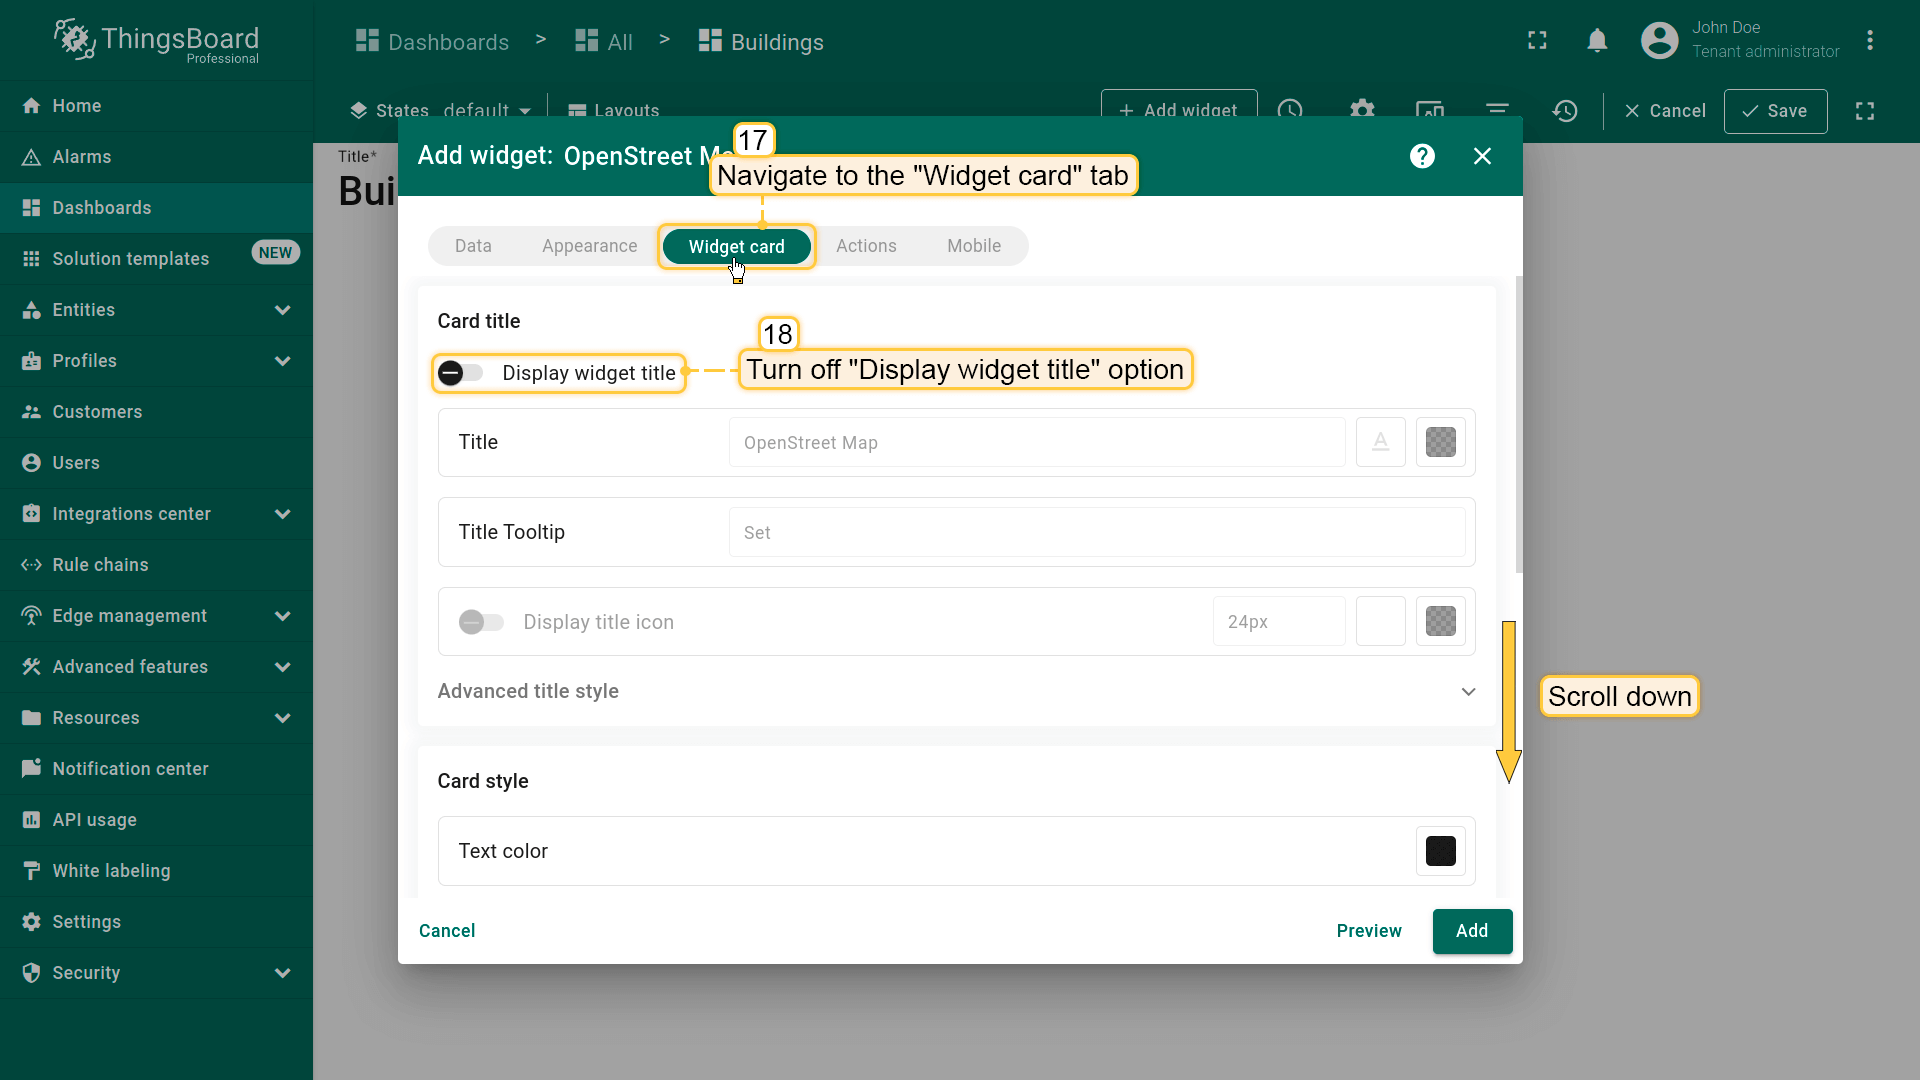
“Widget card” 选项卡:
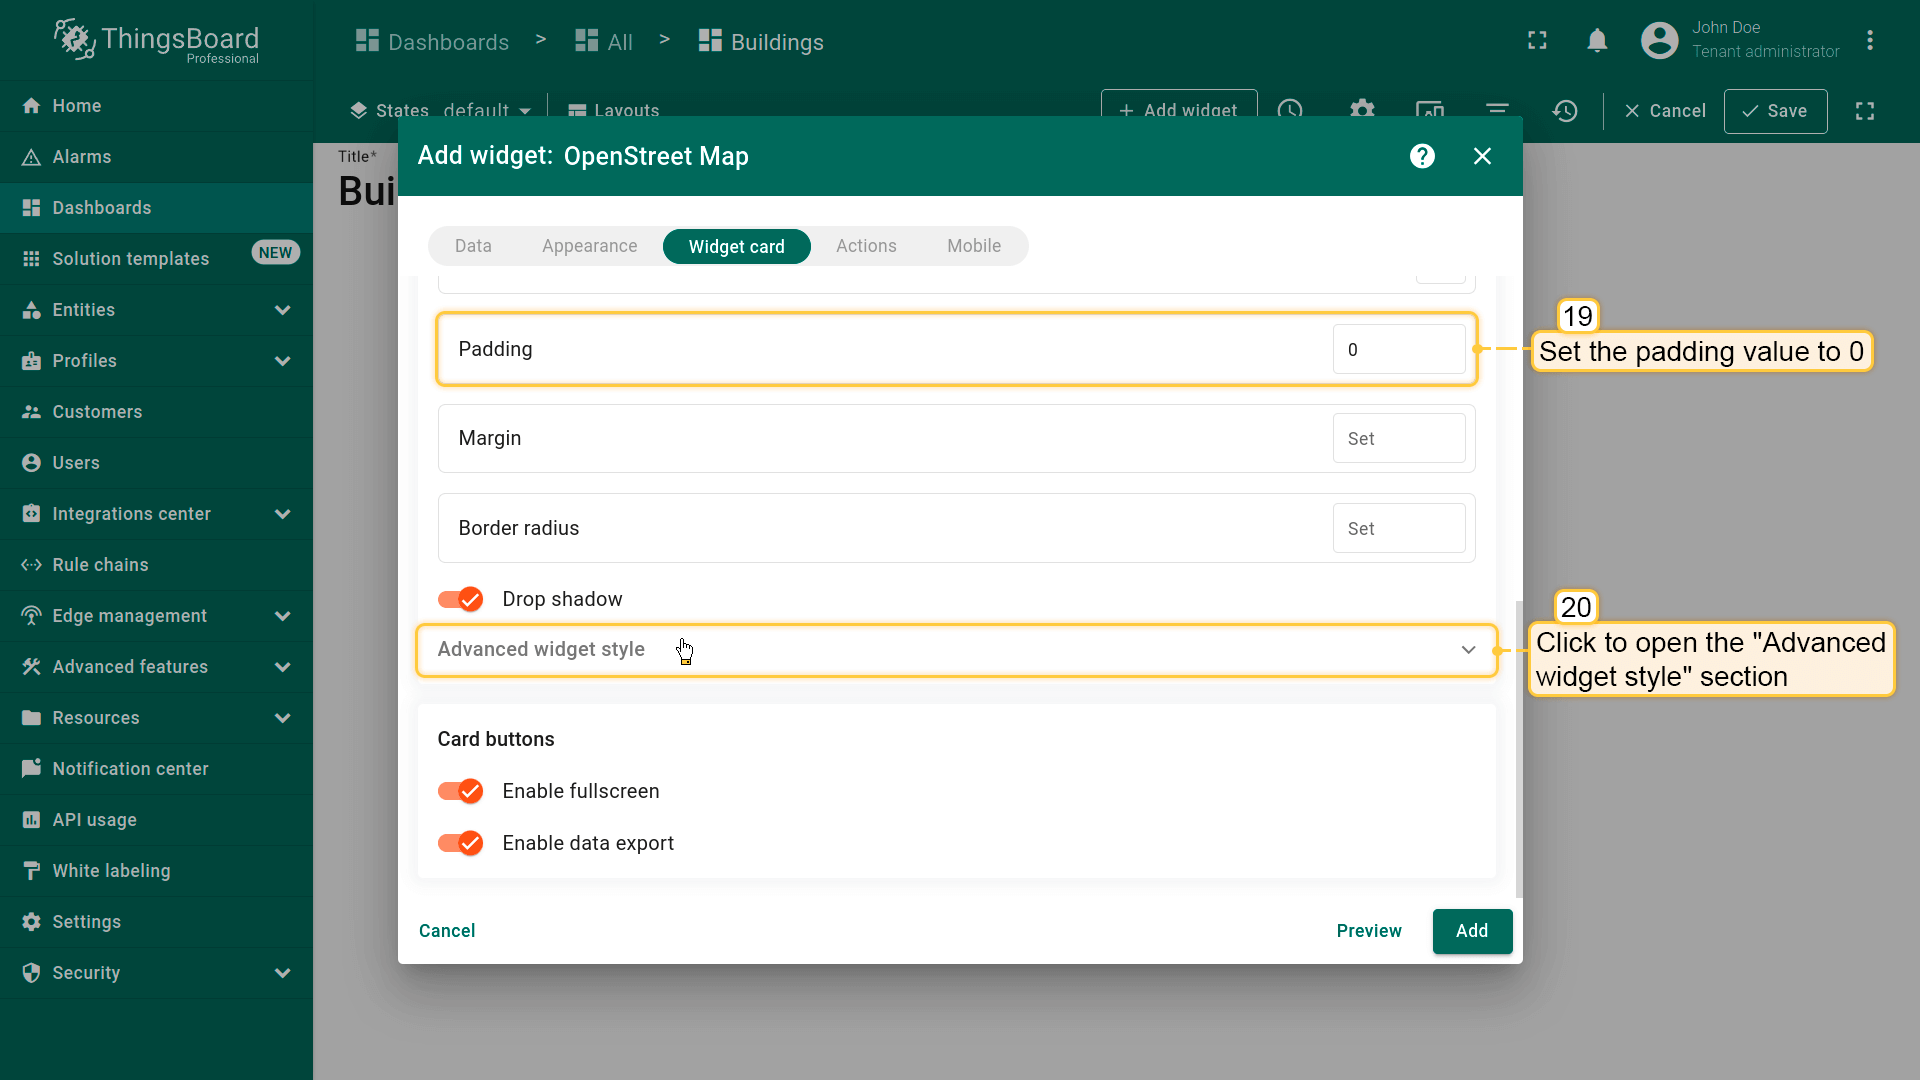
- 进入 “Widget card” 选项卡。关闭 “Display widget title”;
- 将padding设为0;
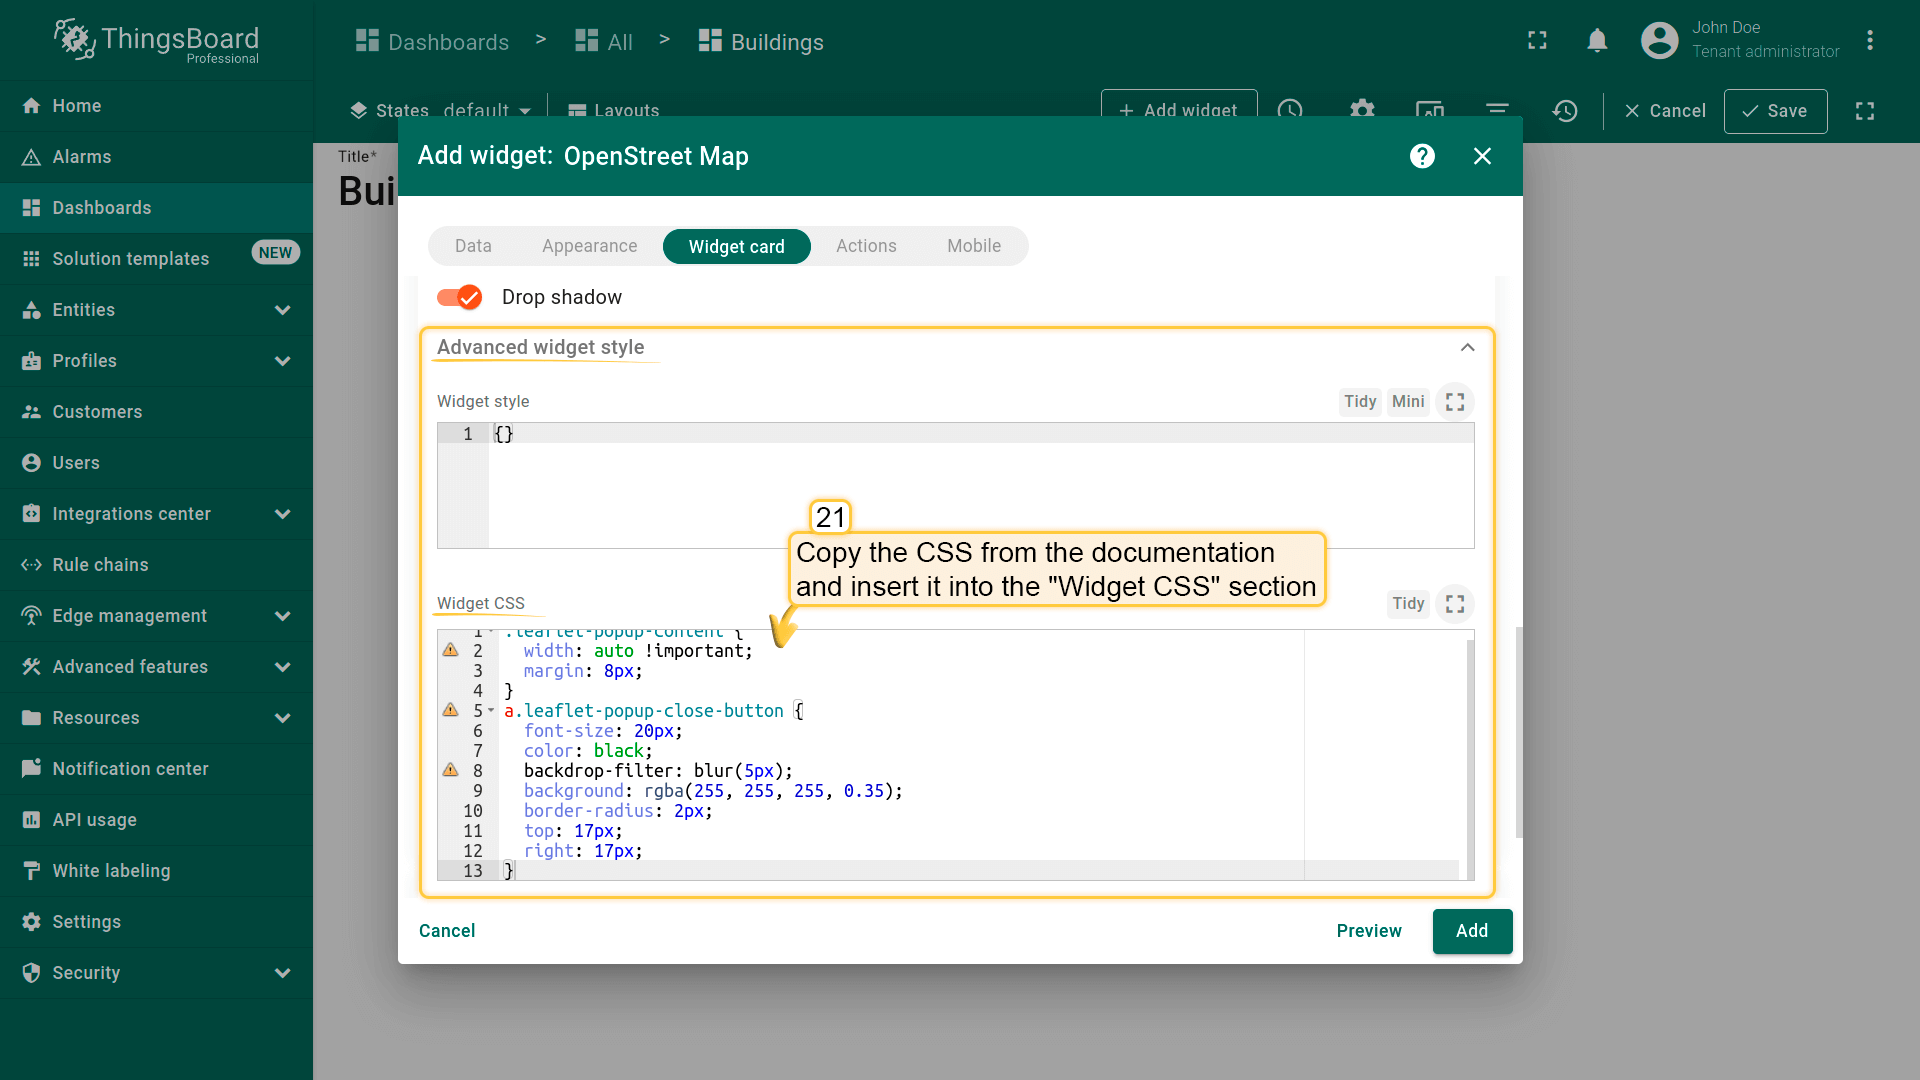
- 打开 “Advanced widget style” 区域。从文档复制CSS粘贴到 “Widget CSS”。此CSS定义tooltip样式;
1
2
3
4
5
6
7
8
9
10
11
12
13
.leaflet-popup-content {
  width: auto !important;
  margin: 8px;
}
a.leaflet-popup-close-button {
  font-size: 20px;
  color: black;
  backdrop-filter: blur(5px);
  background: rgba(255, 255, 255, 0.35);
  border-radius: 2px;
  top: 17px;
  right: 17px;
}
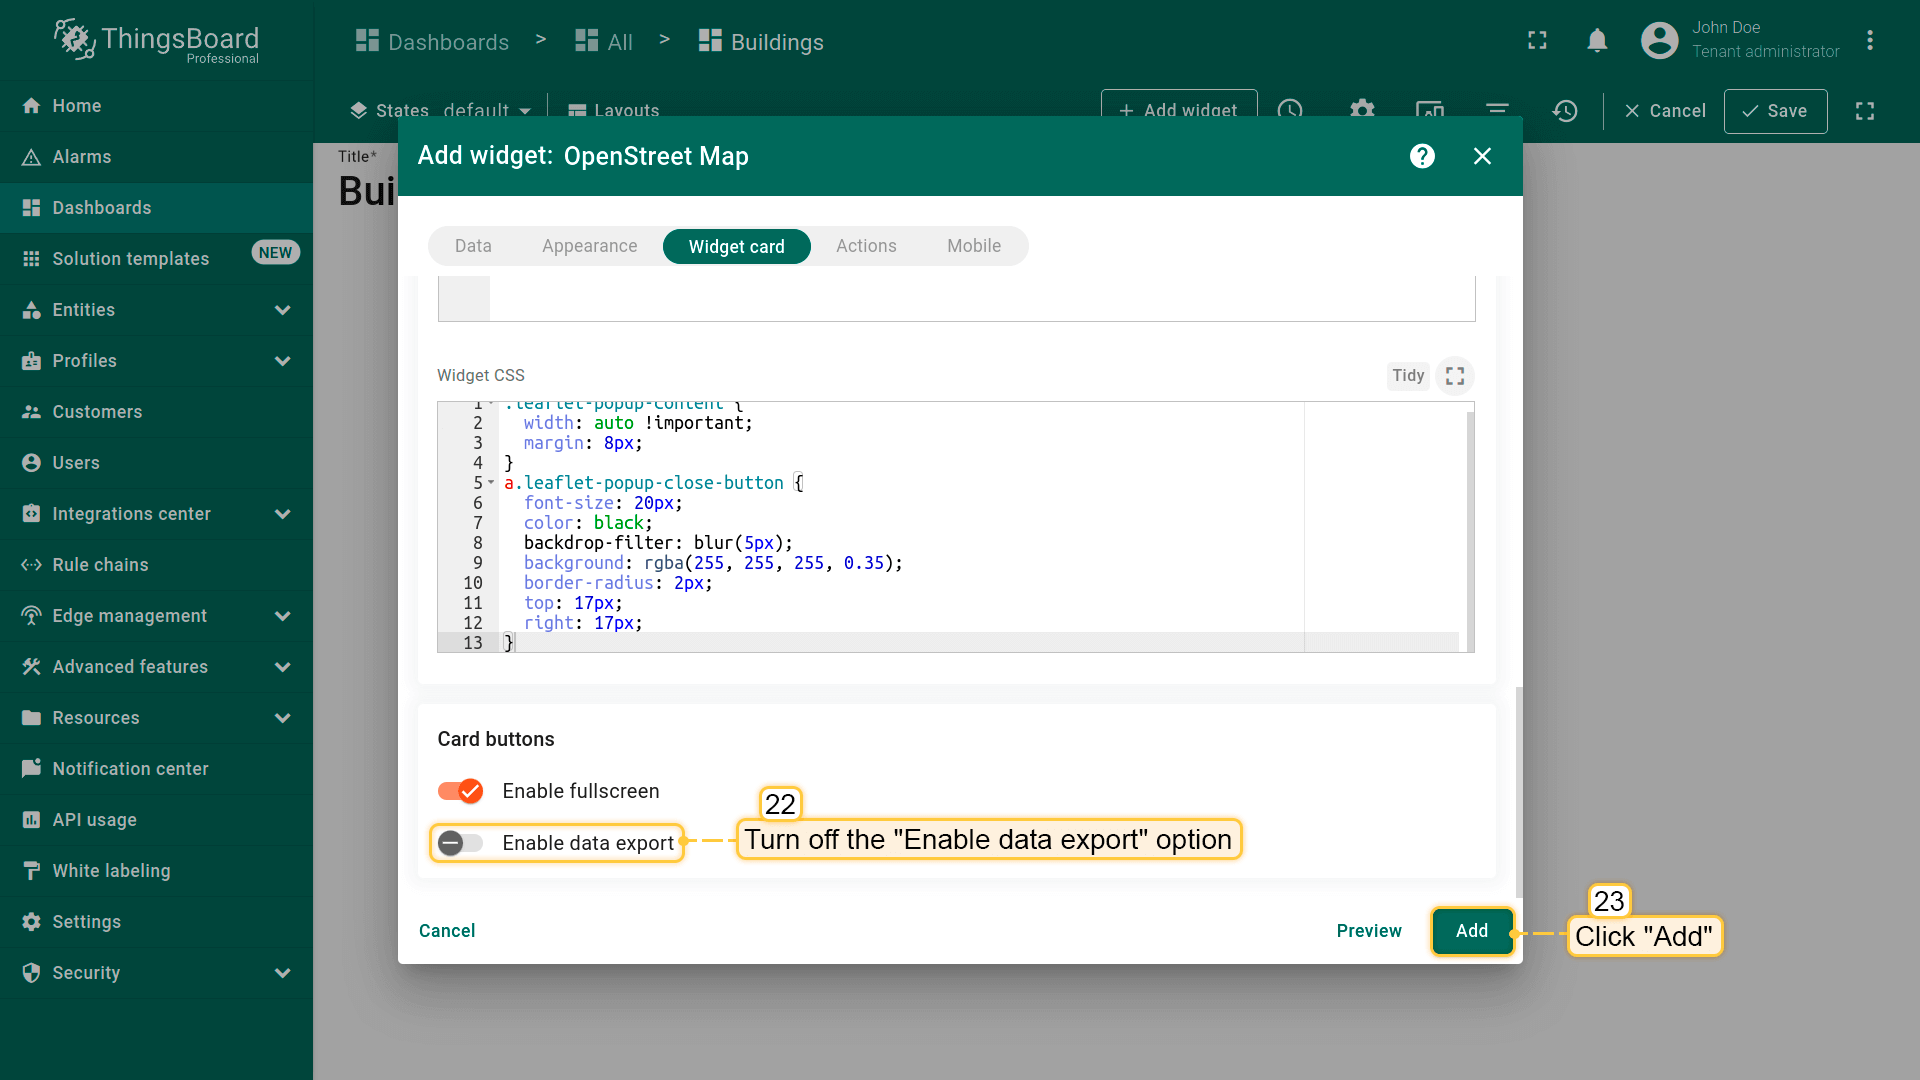
- 关闭 “Enable data export”;
- 点击 “Add” 确认添加部件。
恭喜,第一个部件已添加,可展示两栋建筑。将部件拖到dashboard右上角,拖动角点调整大小。 调整好后,点击右上角 “Save” 保存dashboard。
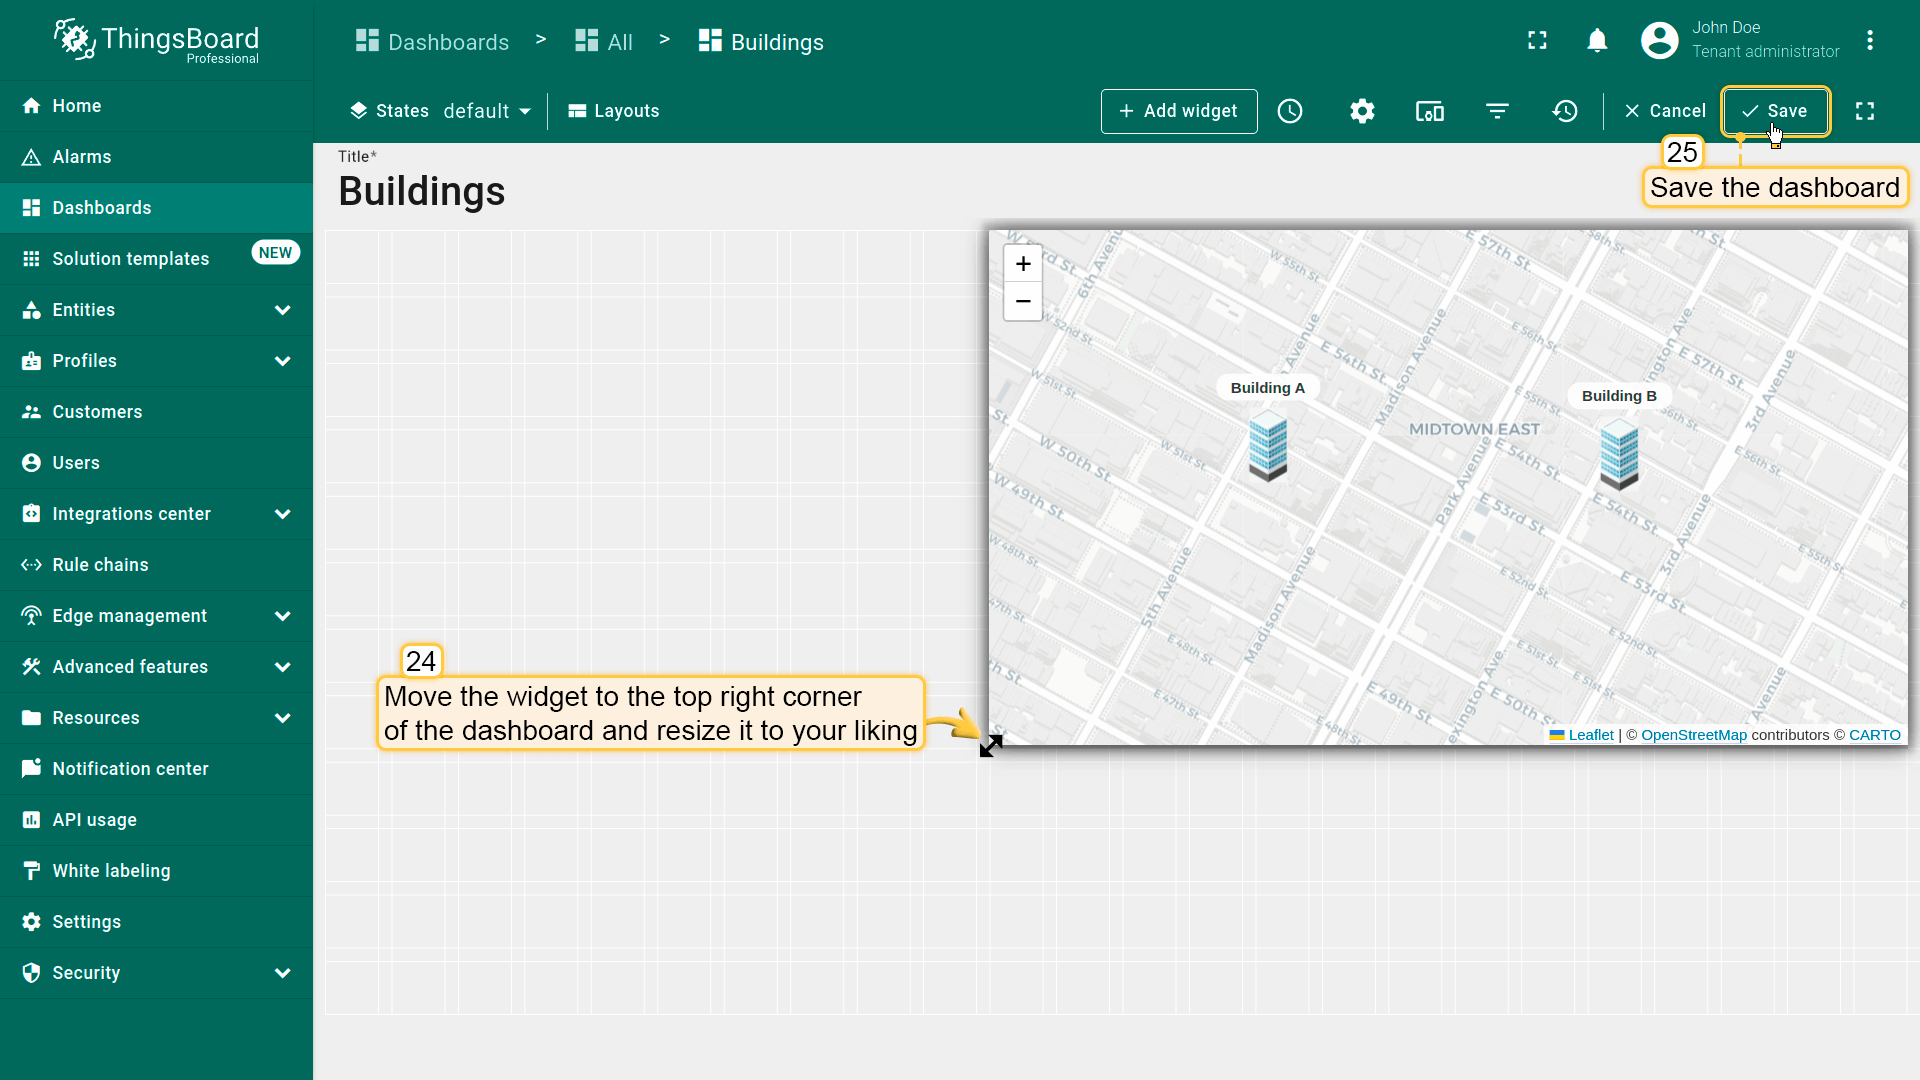
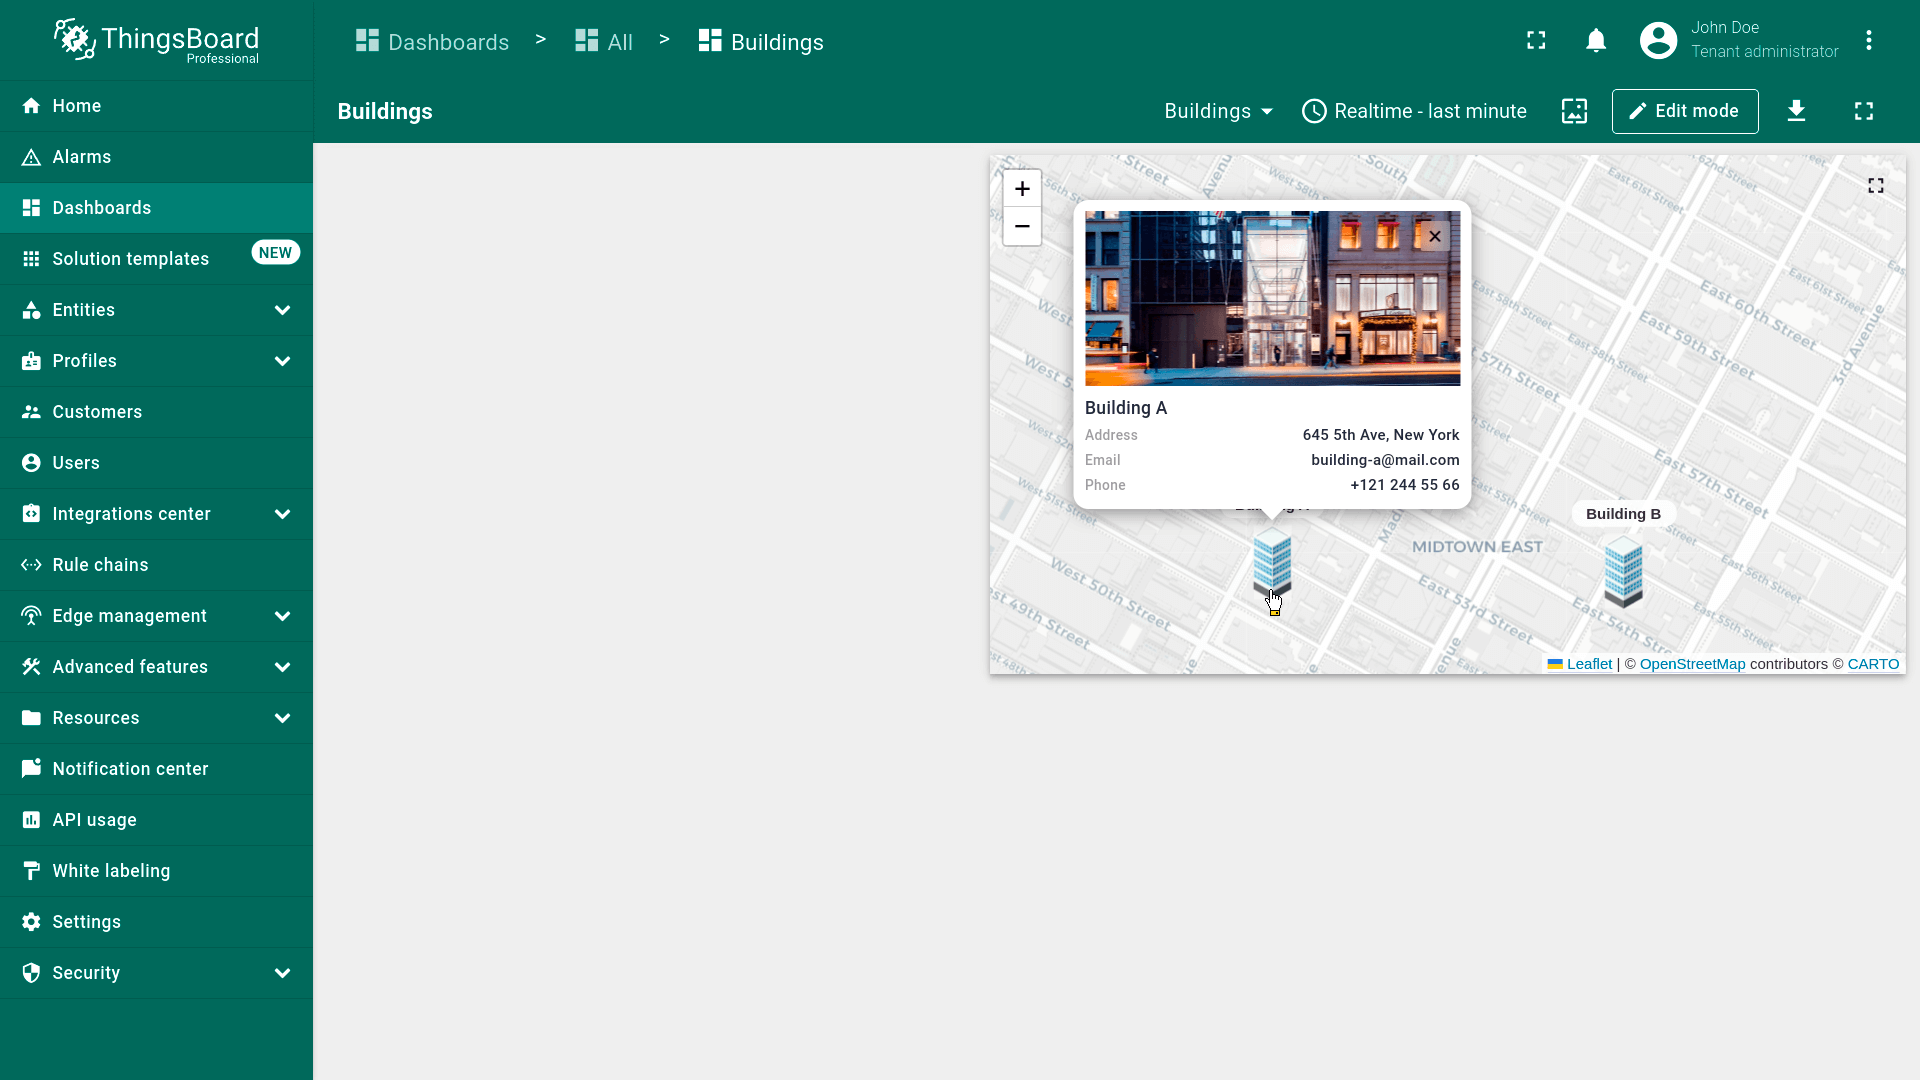
点击任一建筑图片即可在tooltip中显示其信息。
Adding Buildings list widget
已有部件在地图上显示两栋建筑。下面再添加Entities table部件,以列表形式展示建筑。
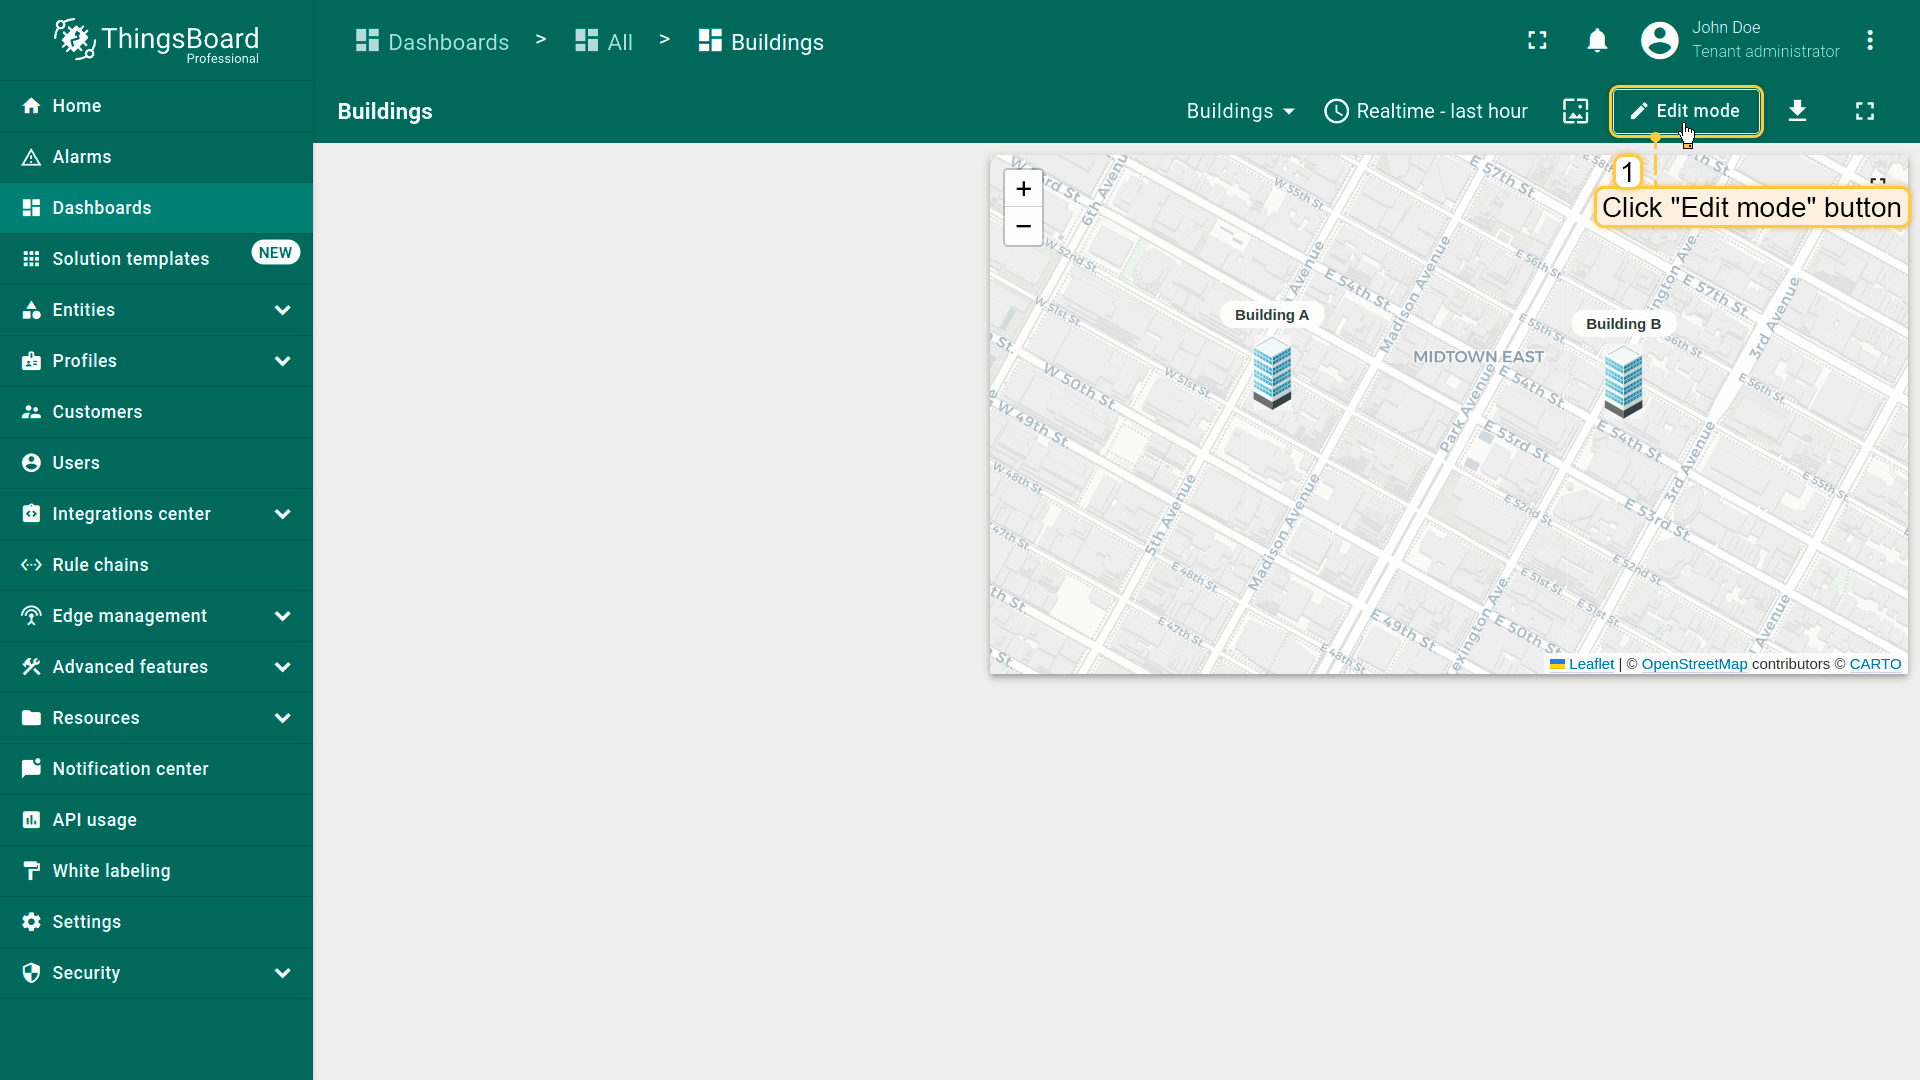
- Switch to dashboard editing mode by clicking the "Edit mode" button on the toolbar on the right;
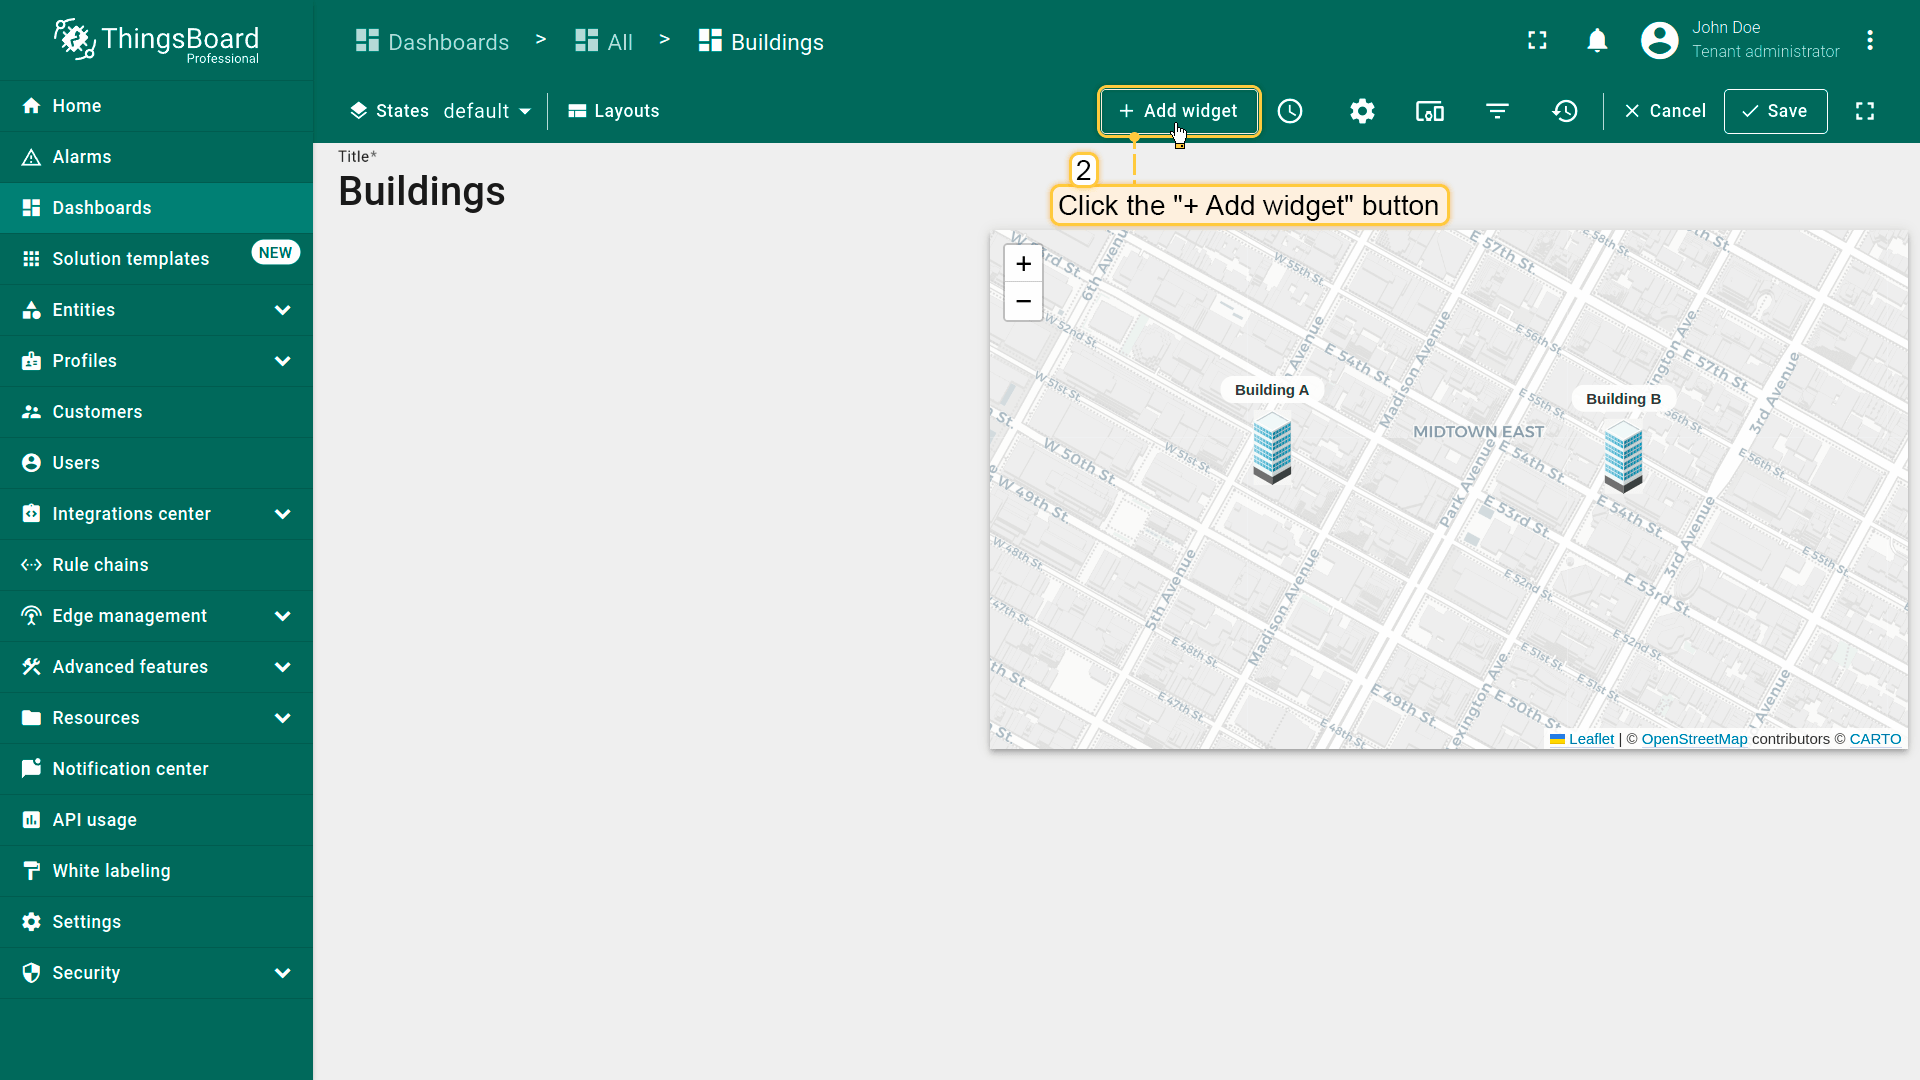
- Click the "Add widget" button at the top of the screen;
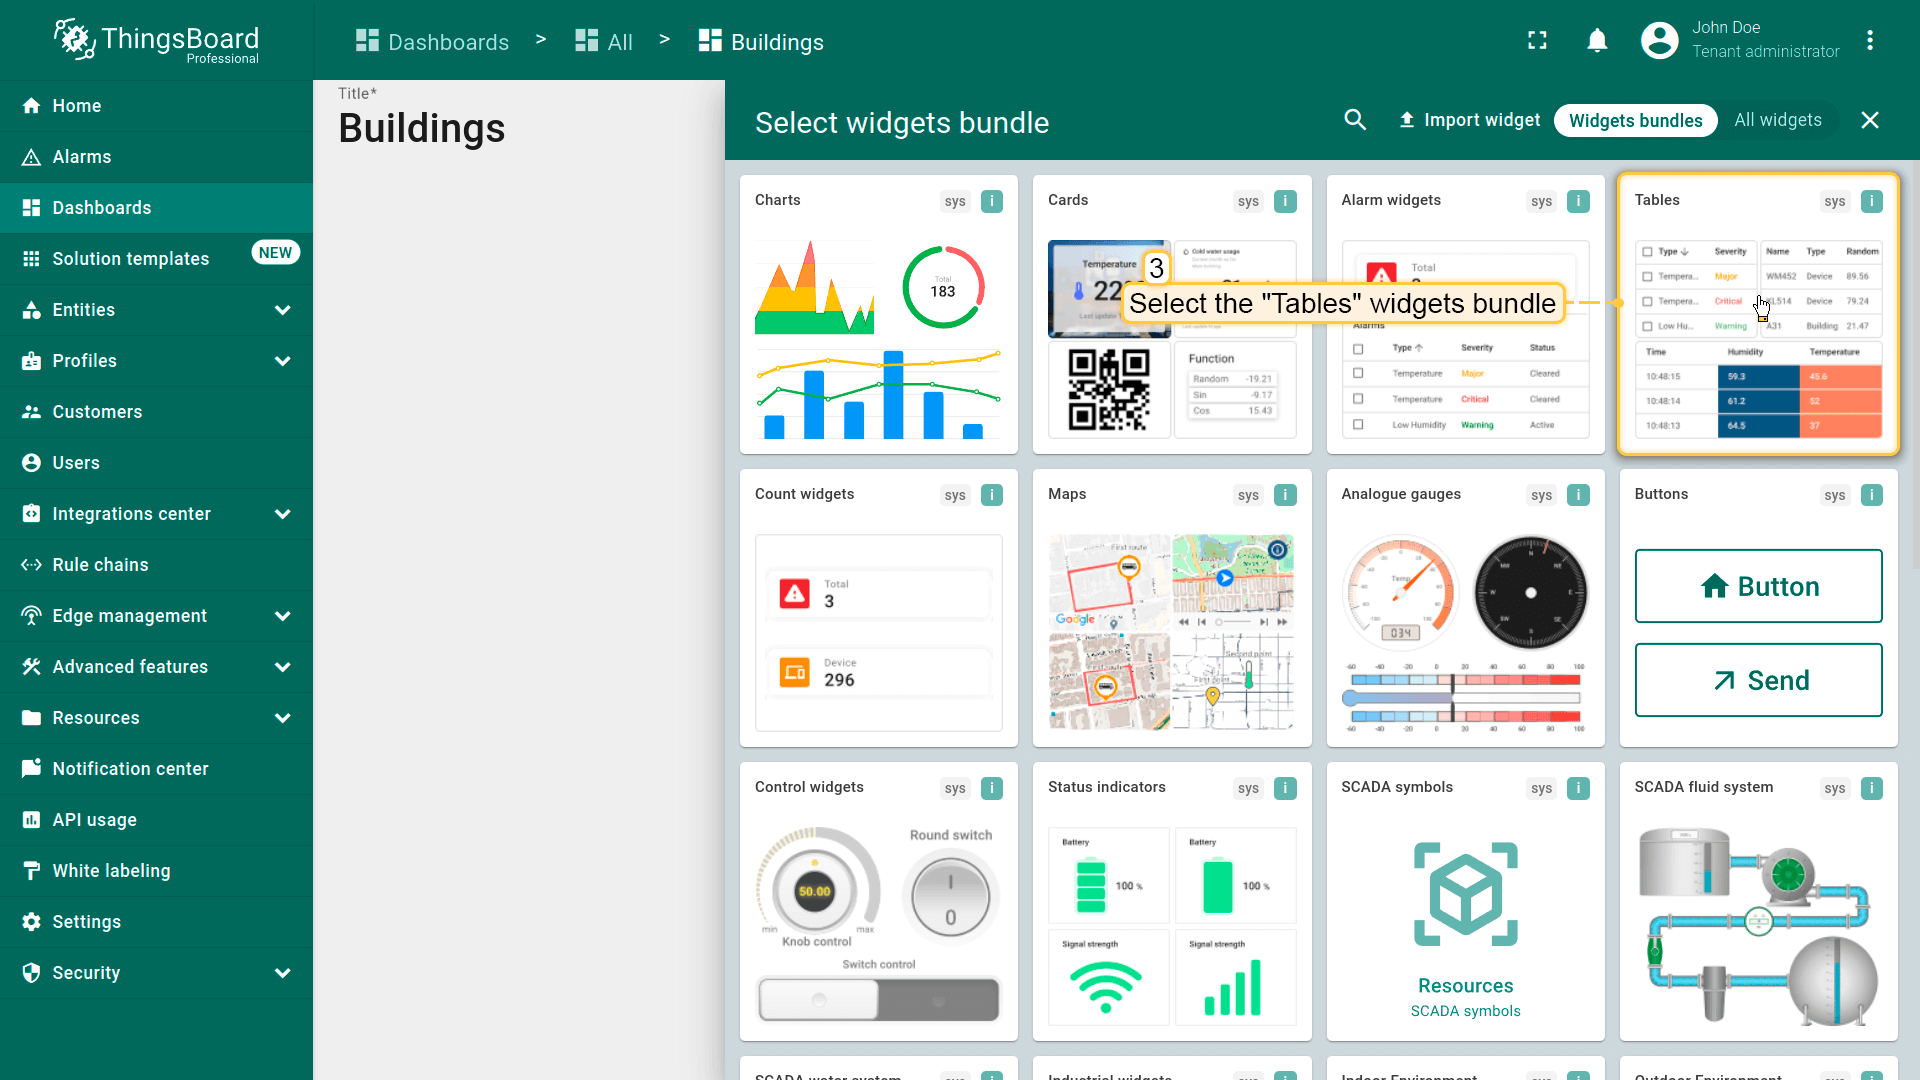
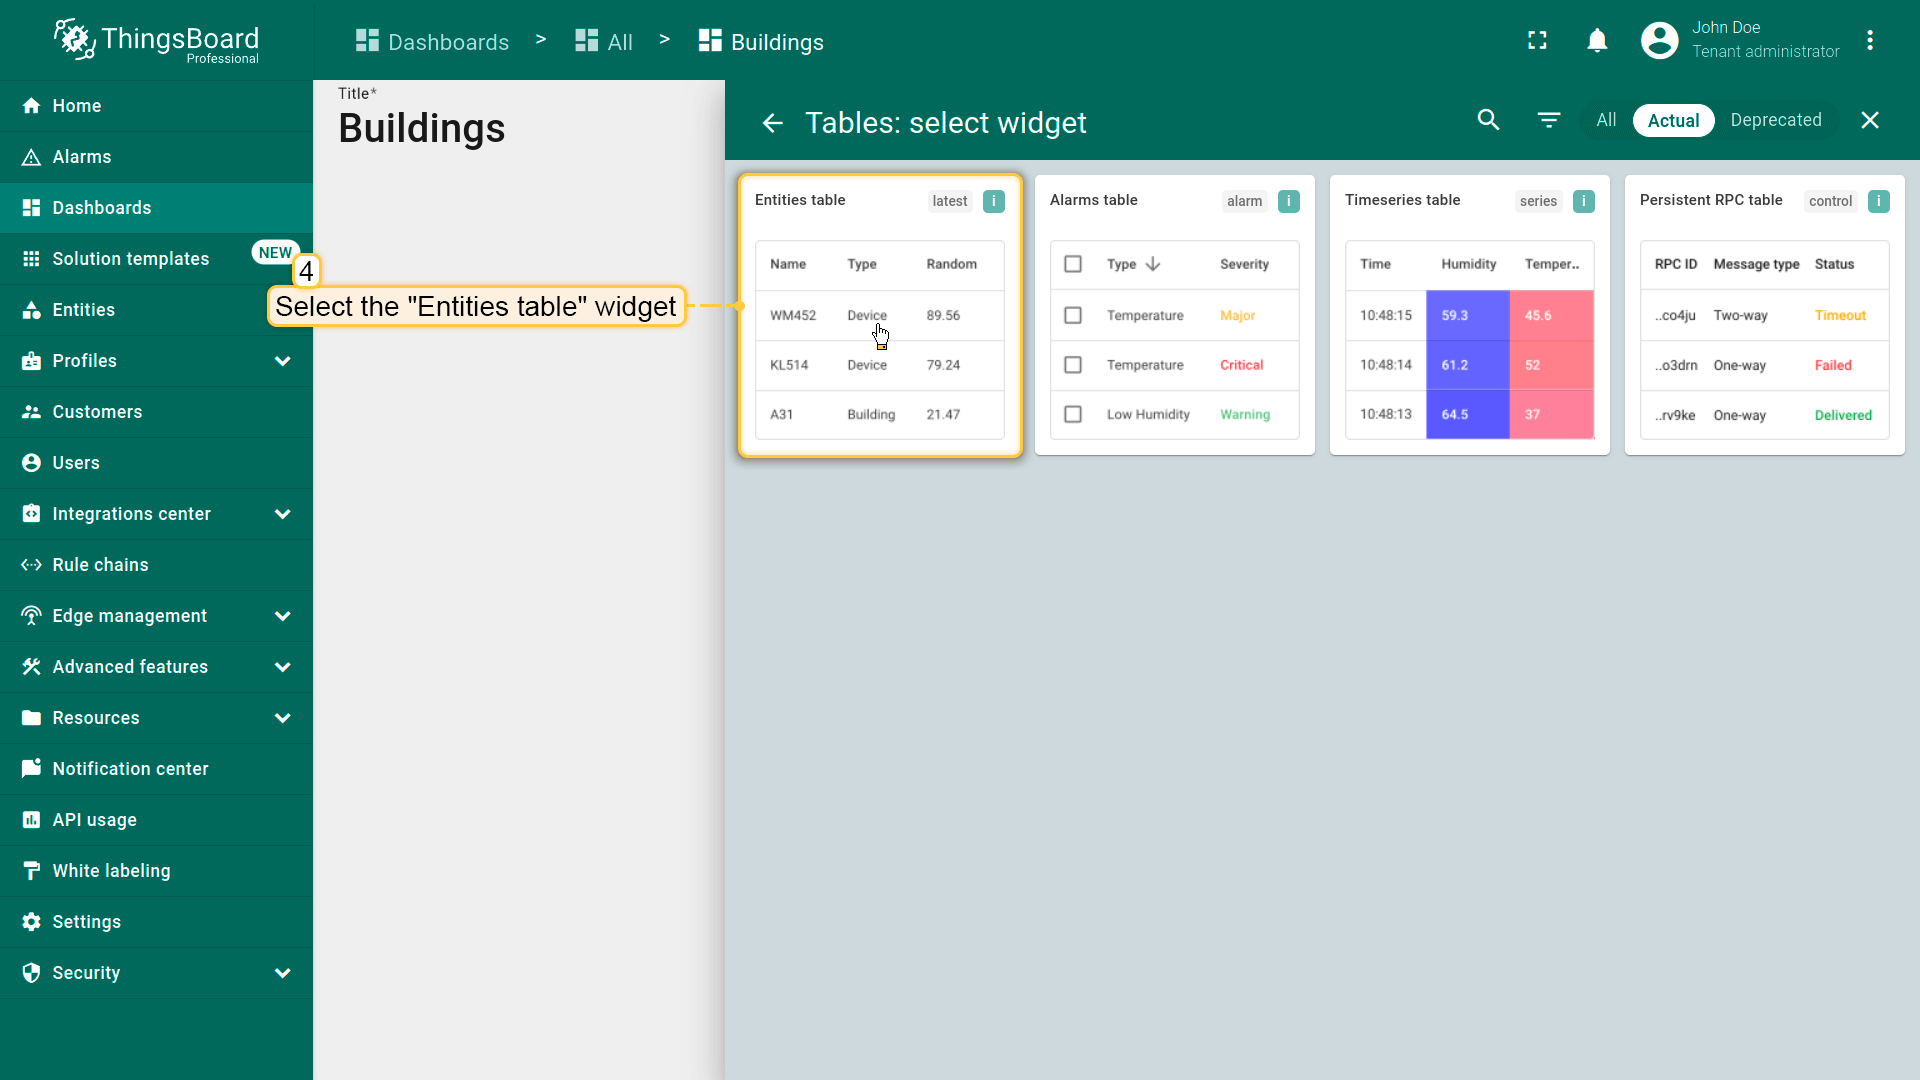
- Find the "Tables" widget bundle and click on it;
- Select the "Entities table" widget;
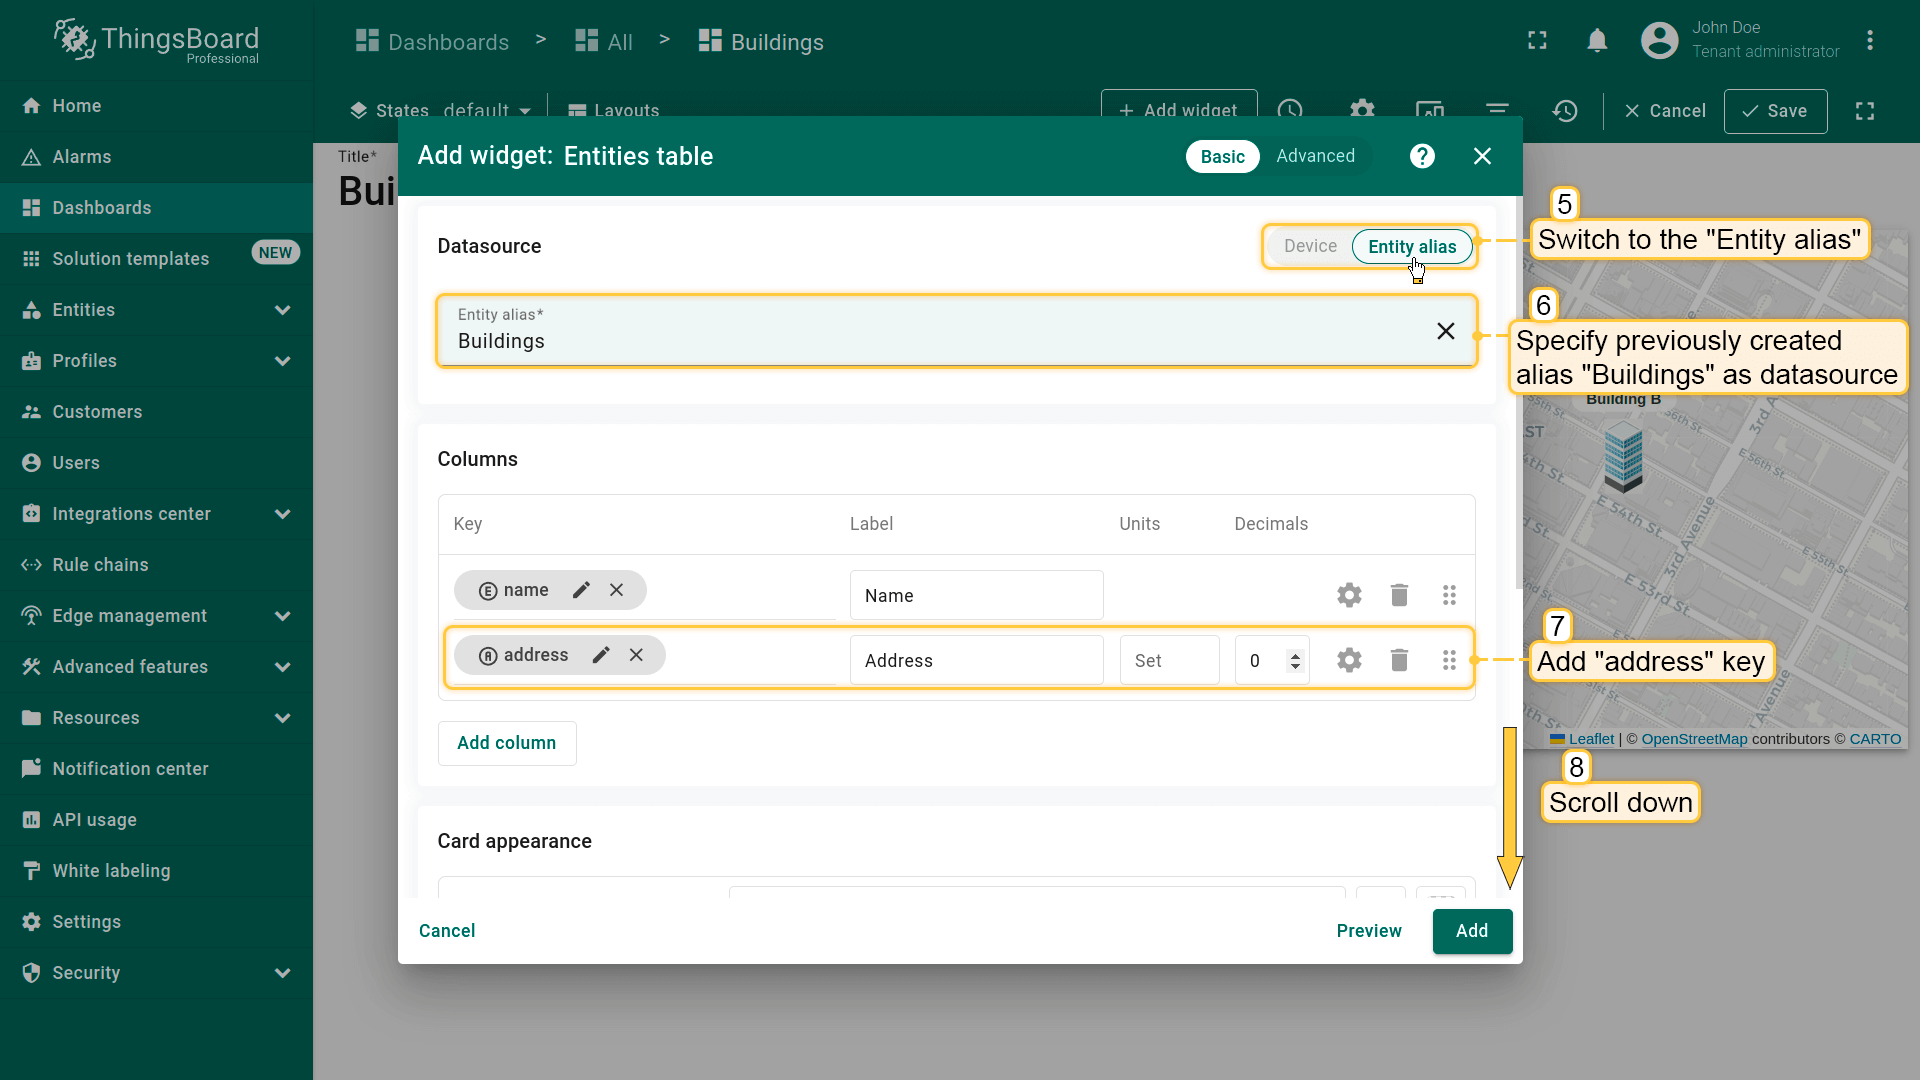
- In the "Datasources" section, switch to the "Entity alias" option and specify the previously created alias "Buildings" as the data source. Furthermore, add the "address" key in the "Columns" section;
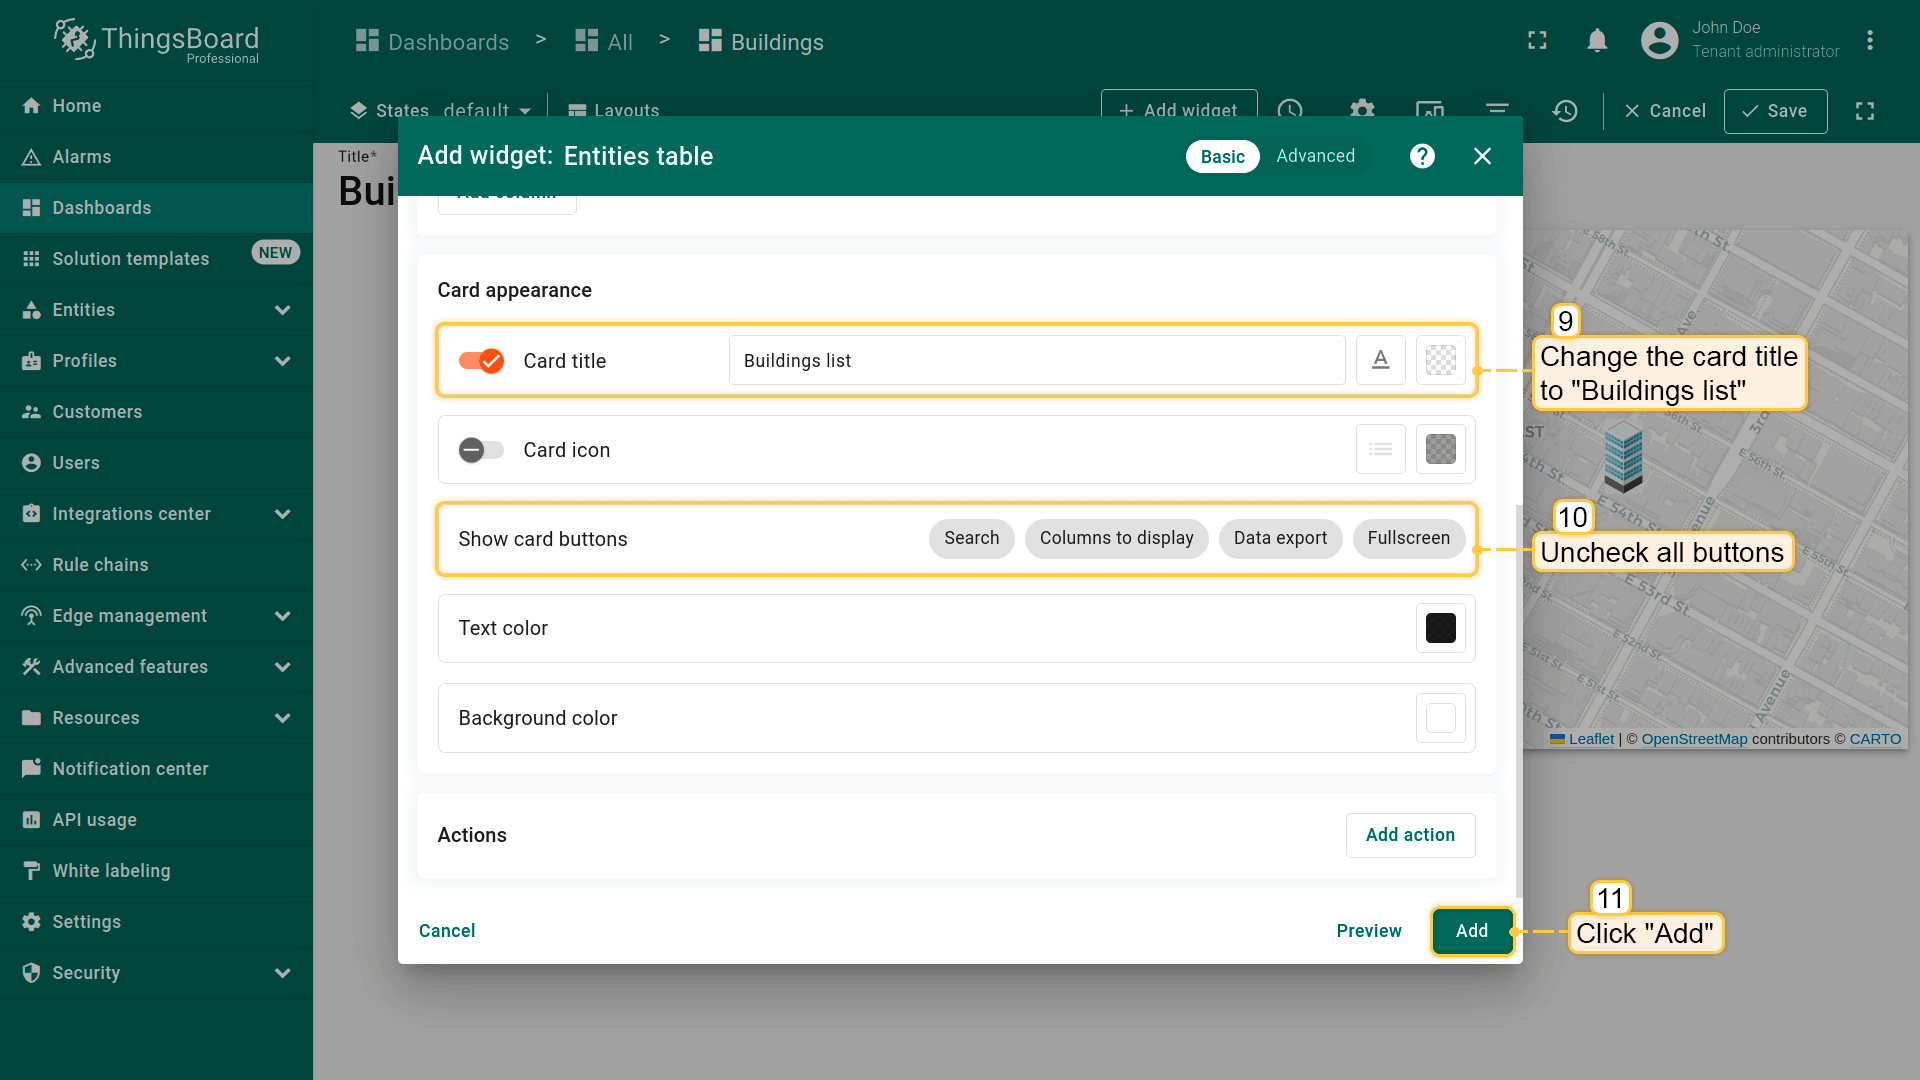
- Change the card title to "Buildings list", uncheck all buttons of the "Show card buttons" section, and click "Add";
- Resize the "Entities table" widget to your liking. Afterwards, save the dashboard.
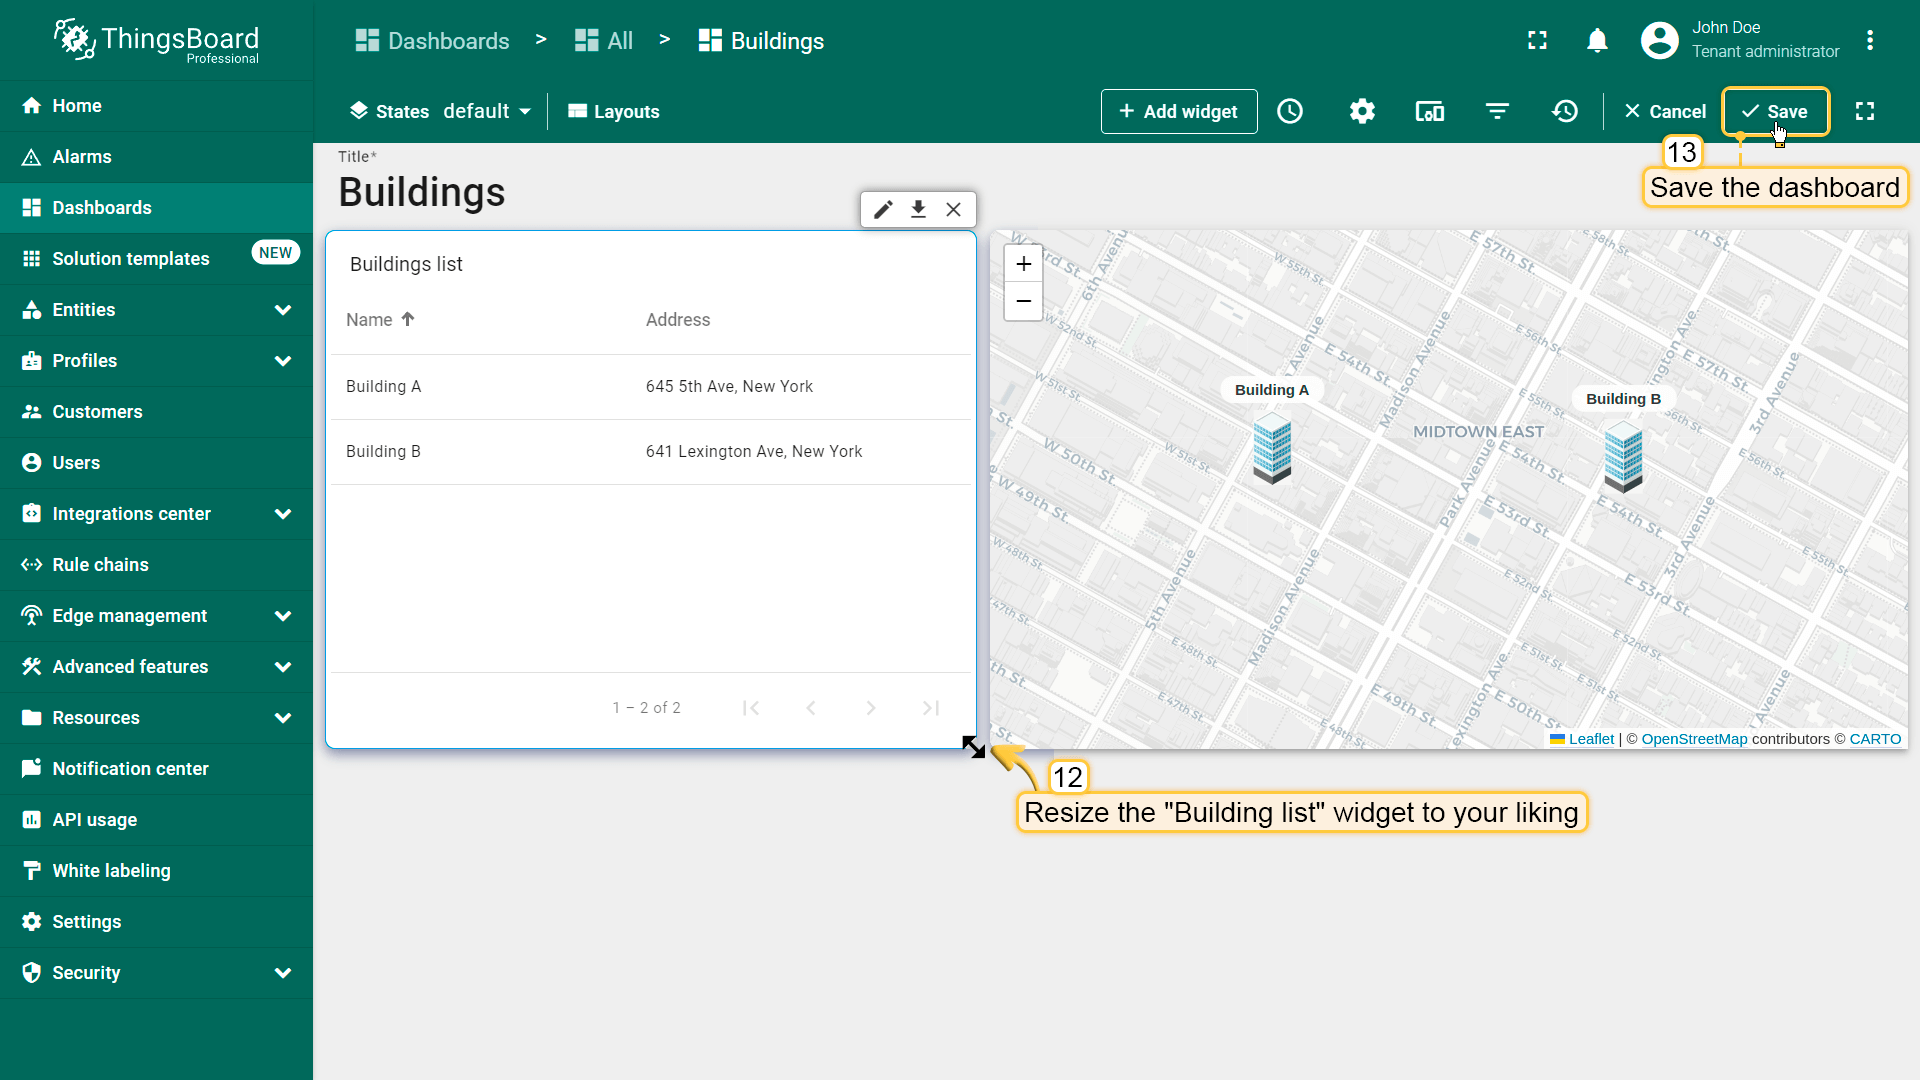
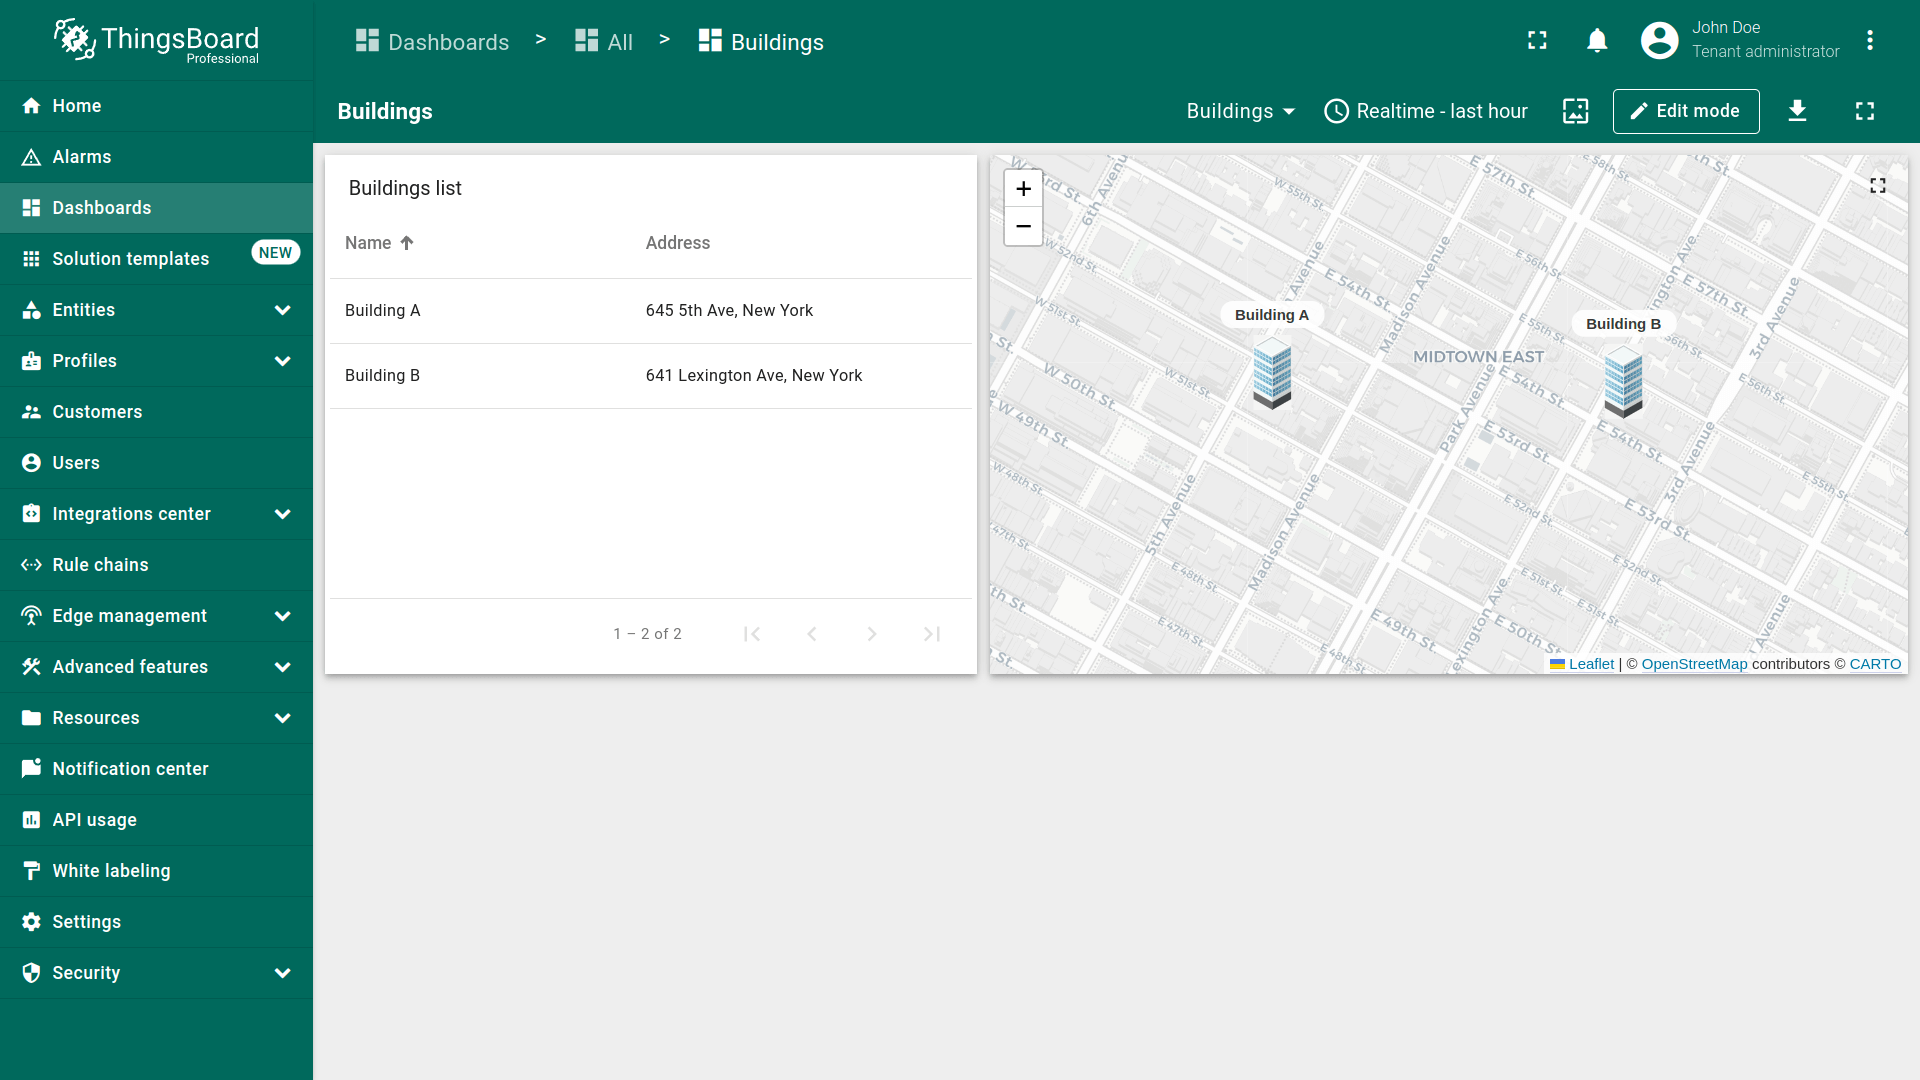
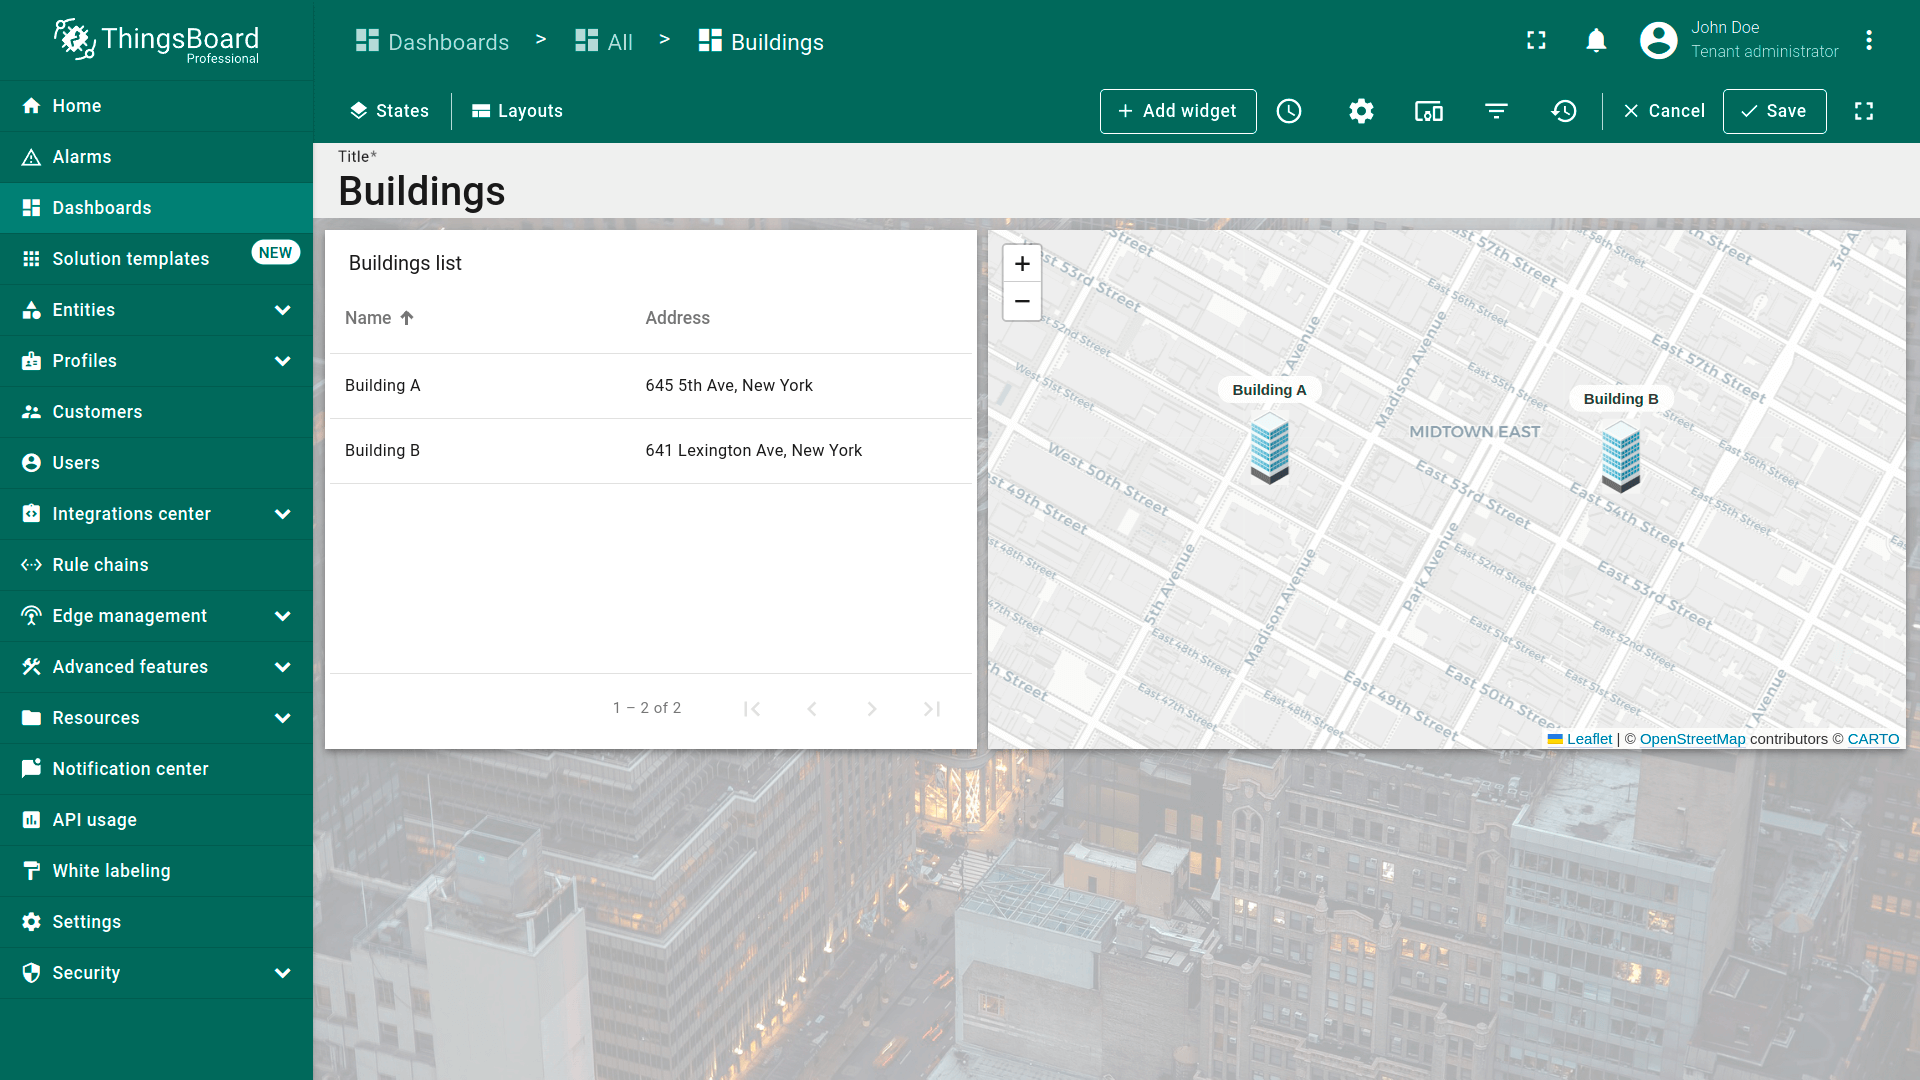
dashboard现包含两个部件:第一个在地图上显示建筑位置,第二个以列表形式显示建筑及其地址。
Customize the appearance of the dashboard
通过定制外观使dashboard更美观。我们将为 “Buildings” 状态设置自定义背景,并为部件应用自定义CSS。
设置自定义背景图
为 “Buildings” 状态添加自定义背景图,可提升视觉效果并与品牌或审美一致。 可使用 本教程图片 或自定义图片。
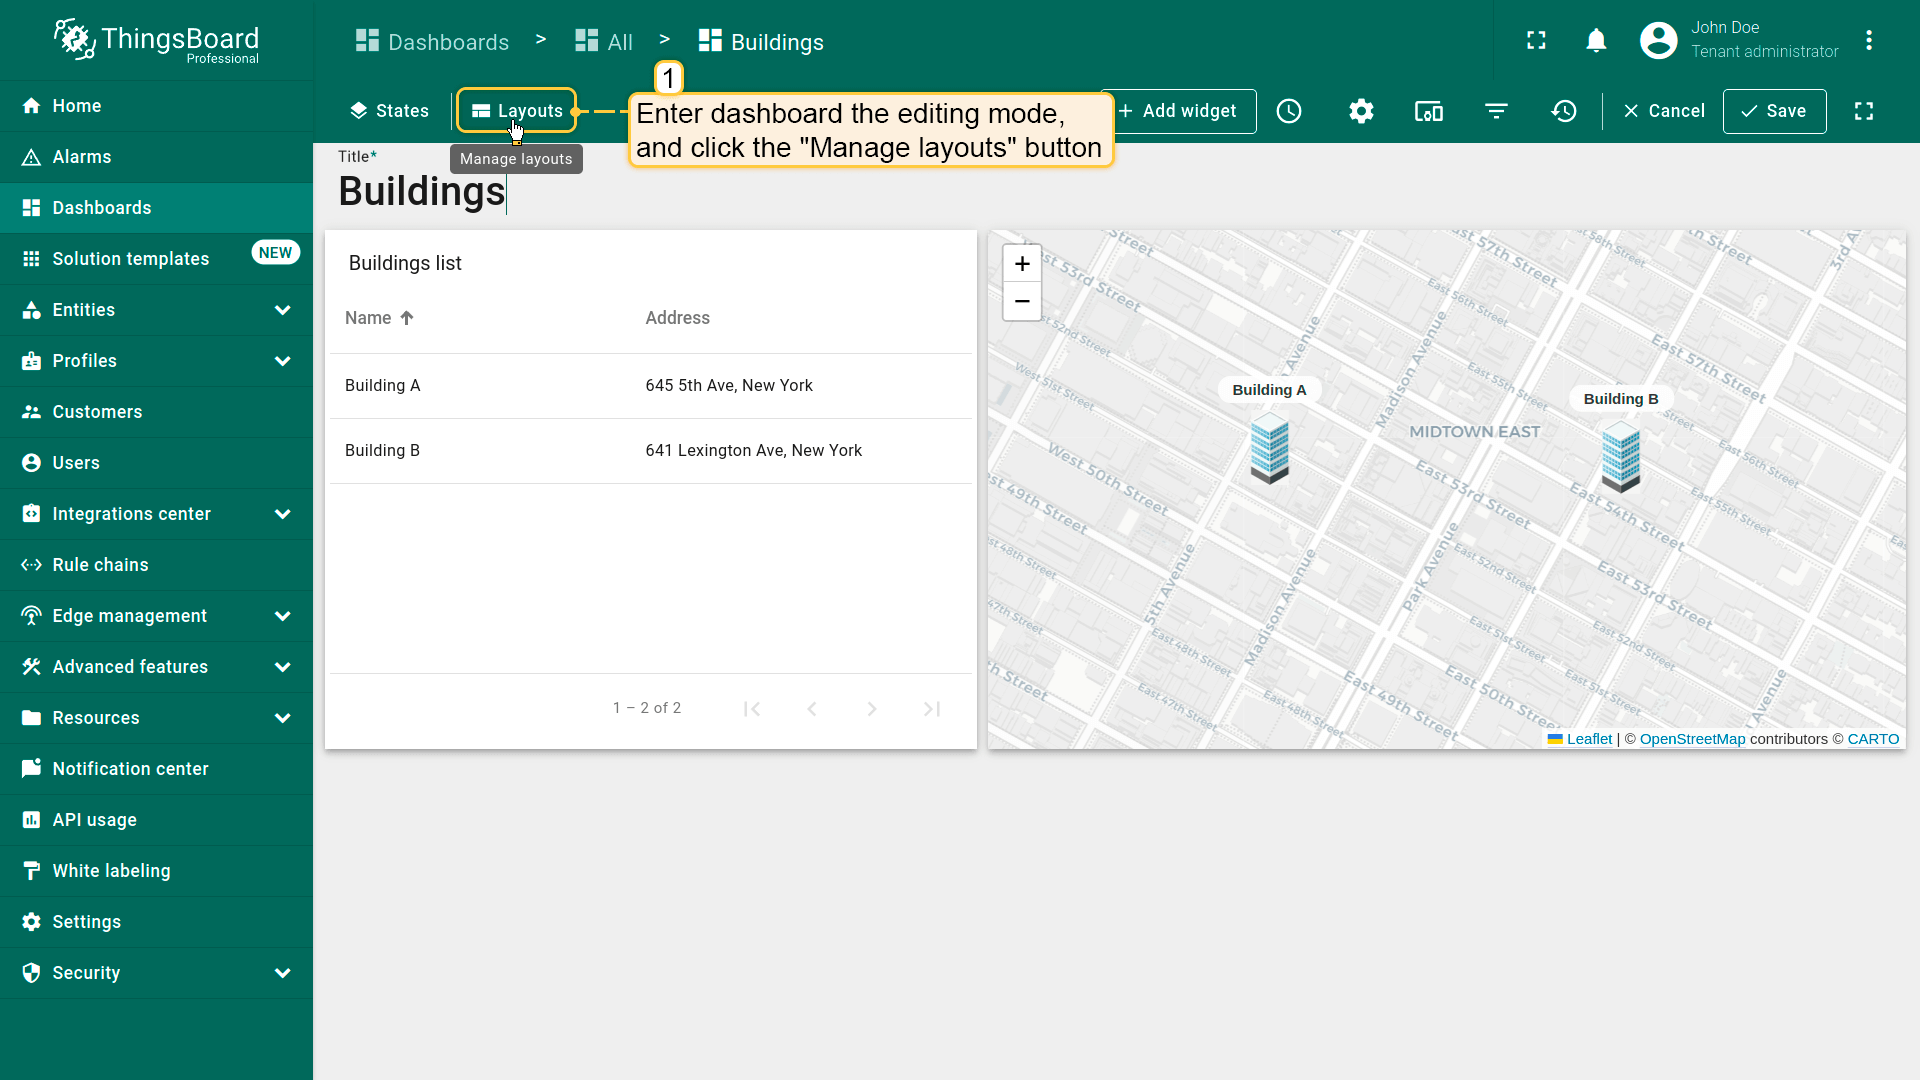
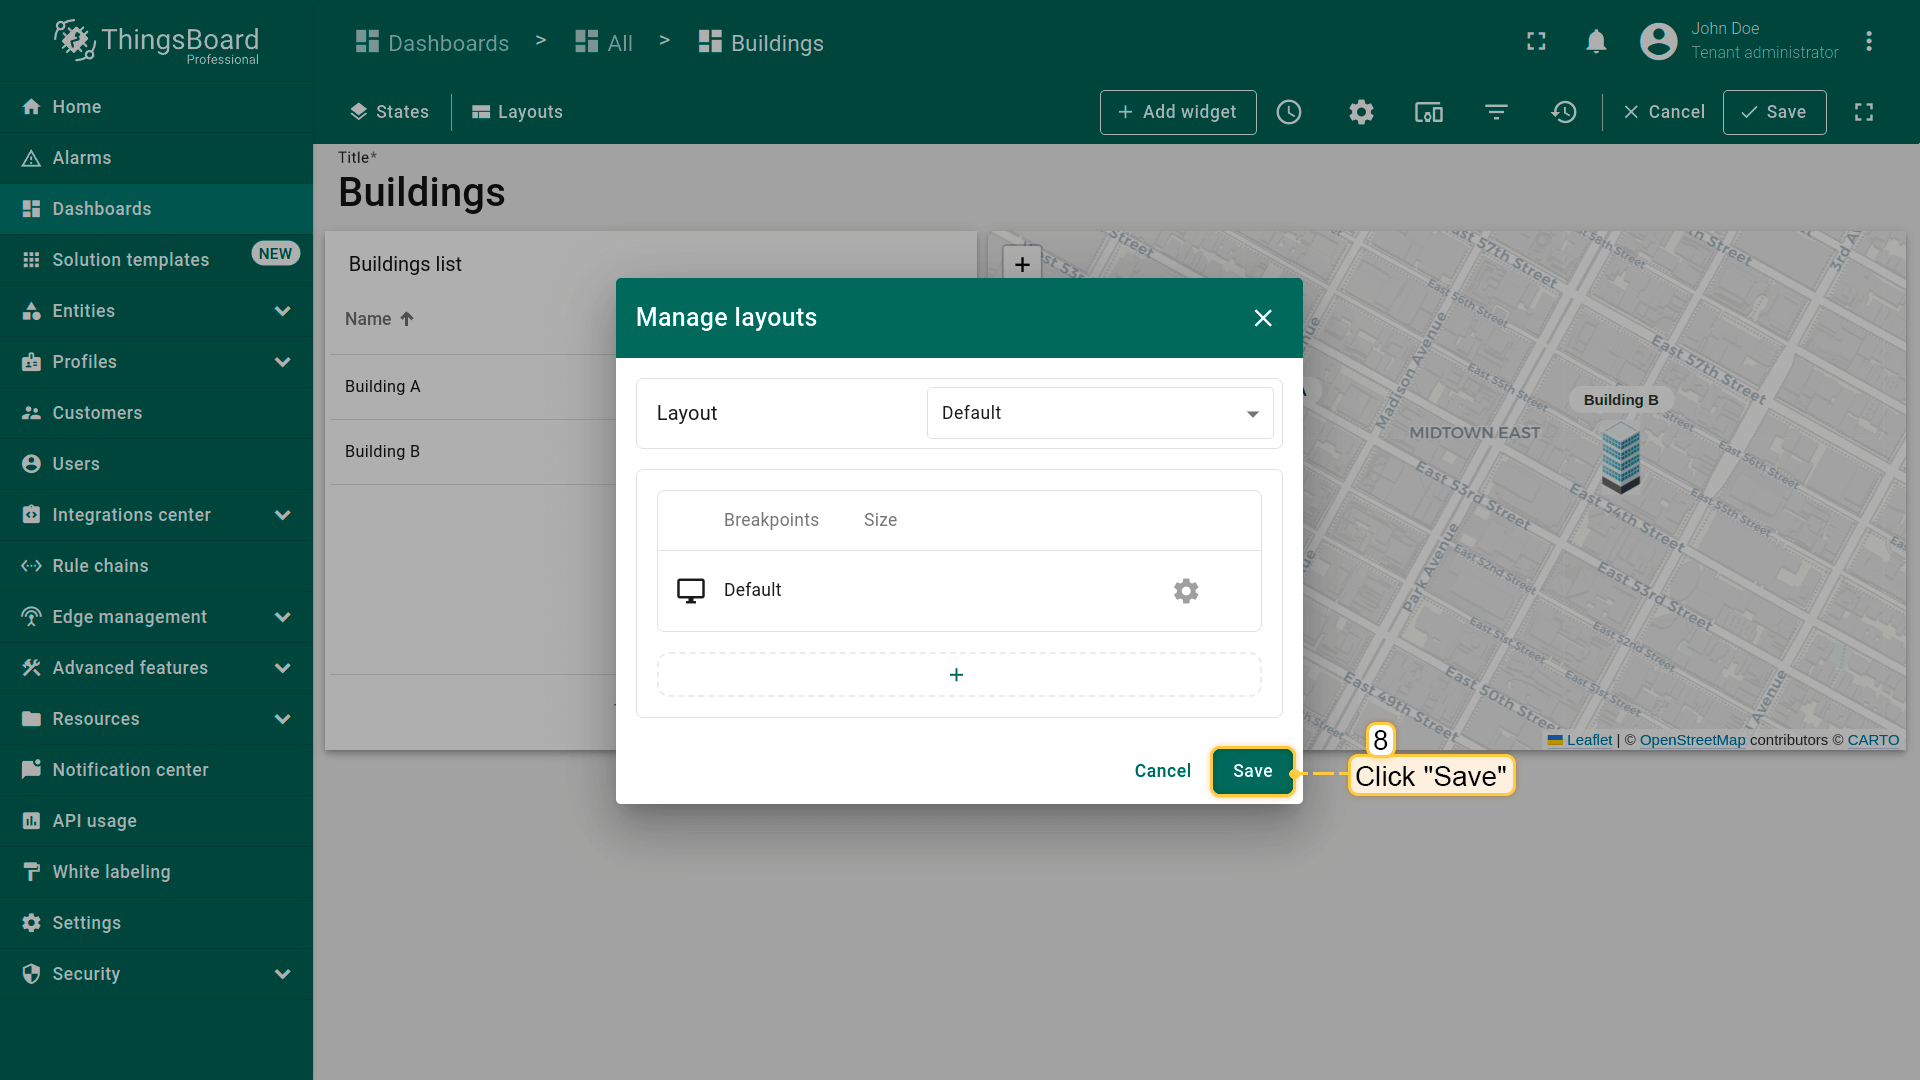
- To customize the layout of the dashboard, enter it edit mode and click the "Manage layouts" button located in the upper-left corner of the dashboard toolbar;
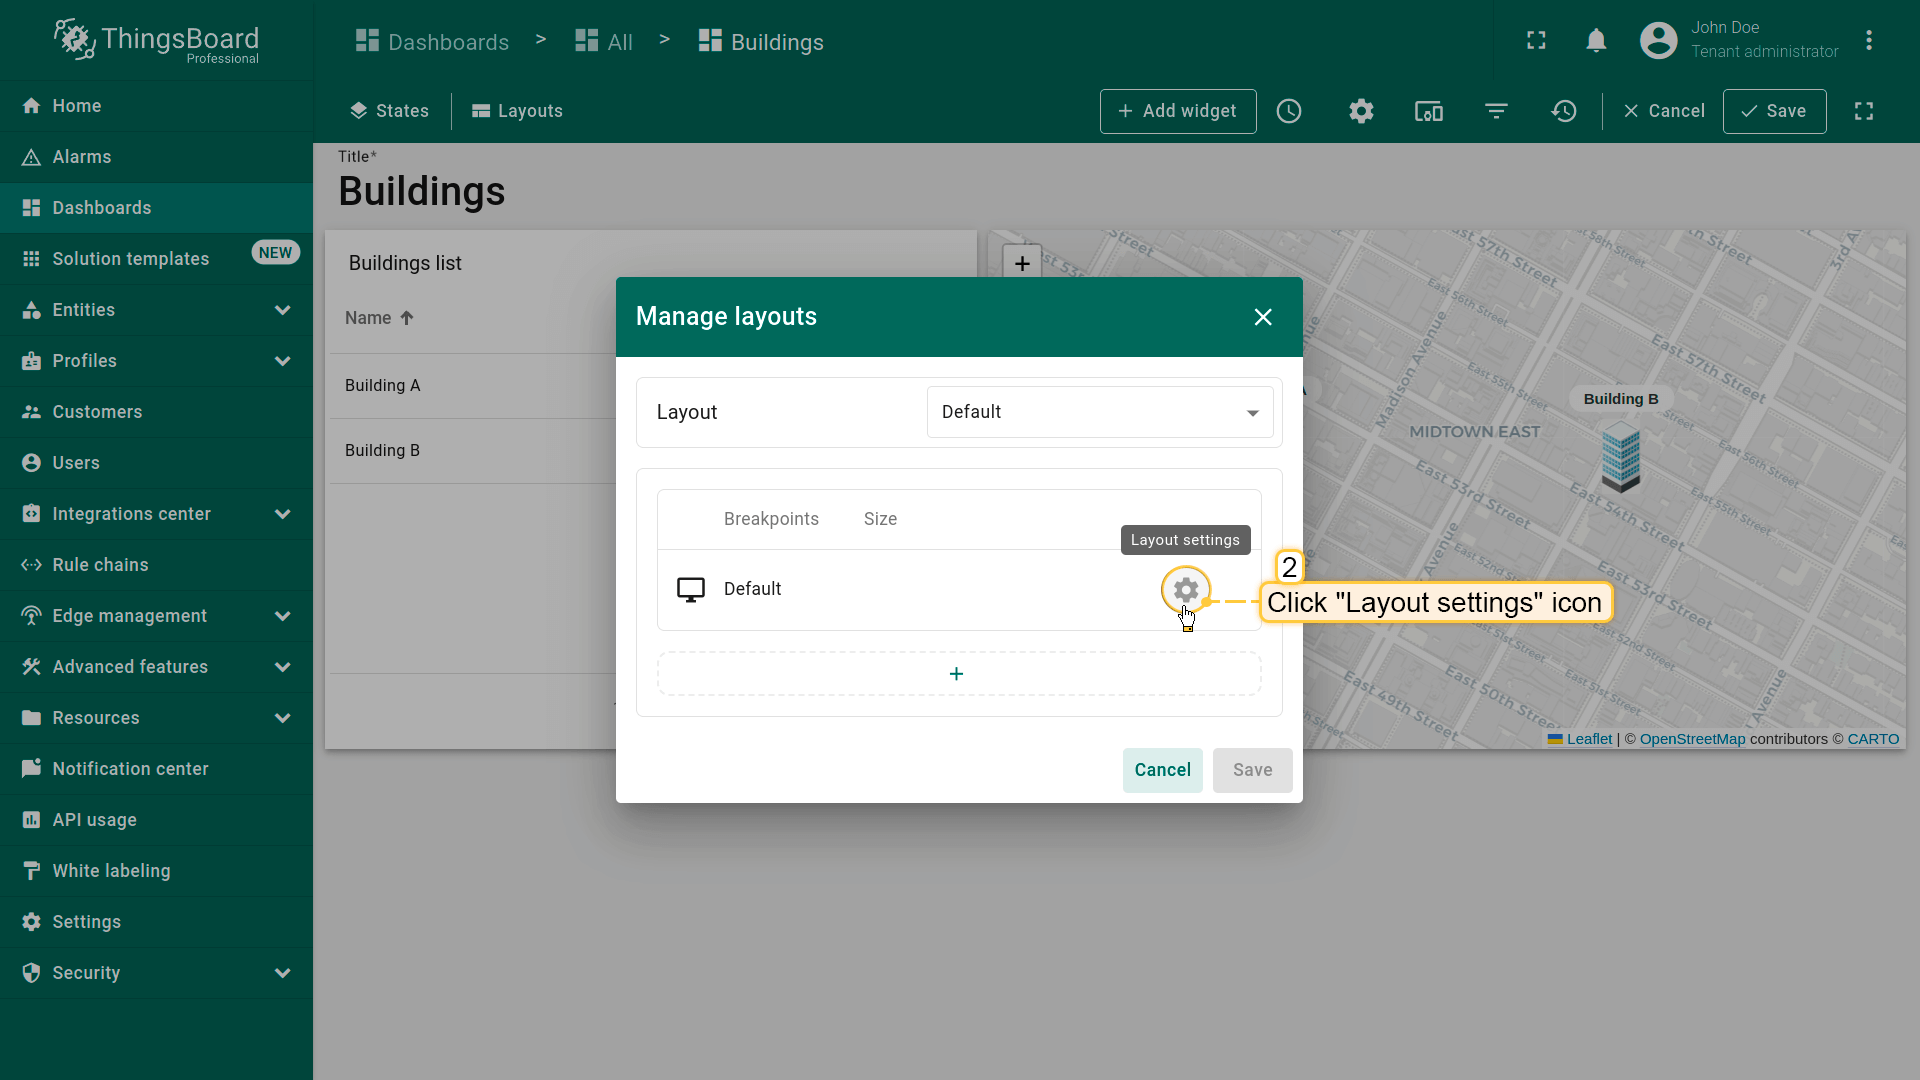
- A window for layout management will appear. Here, locate and click on the "gear" icon, labeled "Layout settings". This action opens the layout settings window;
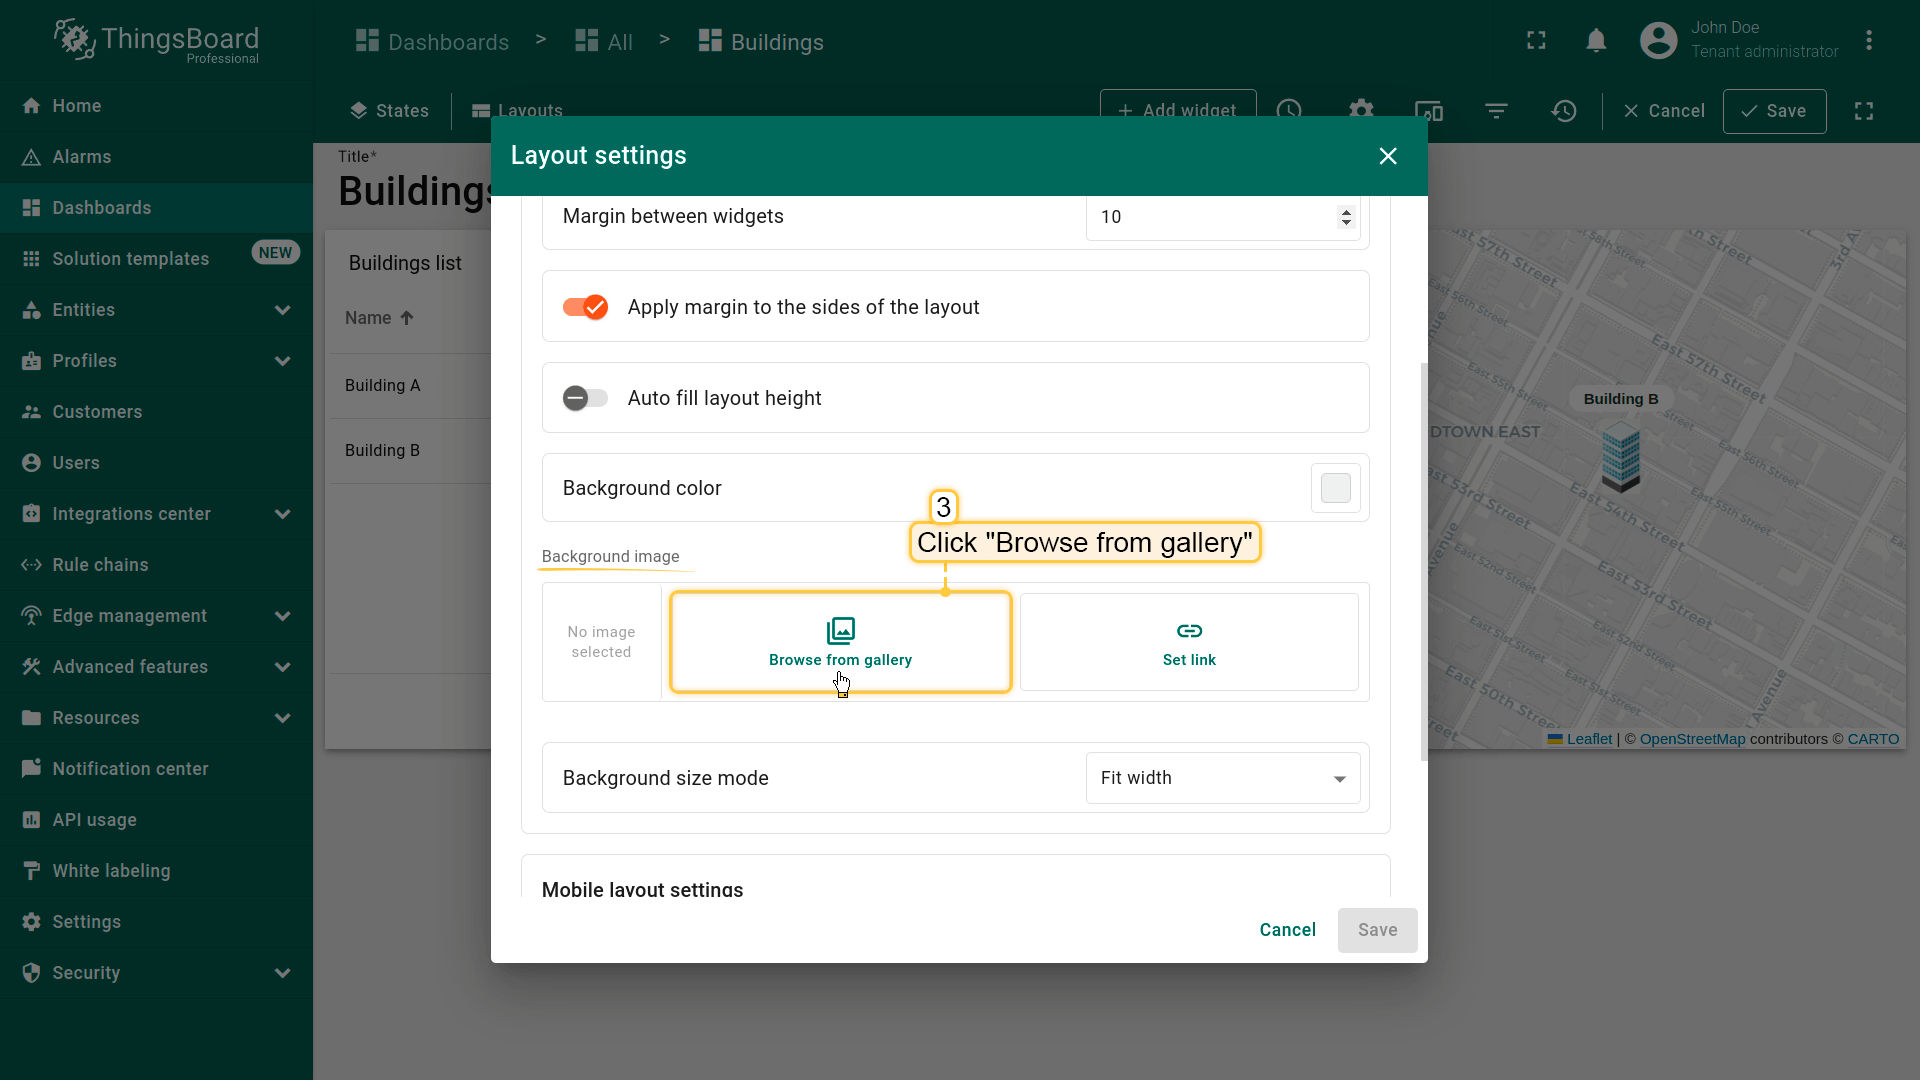
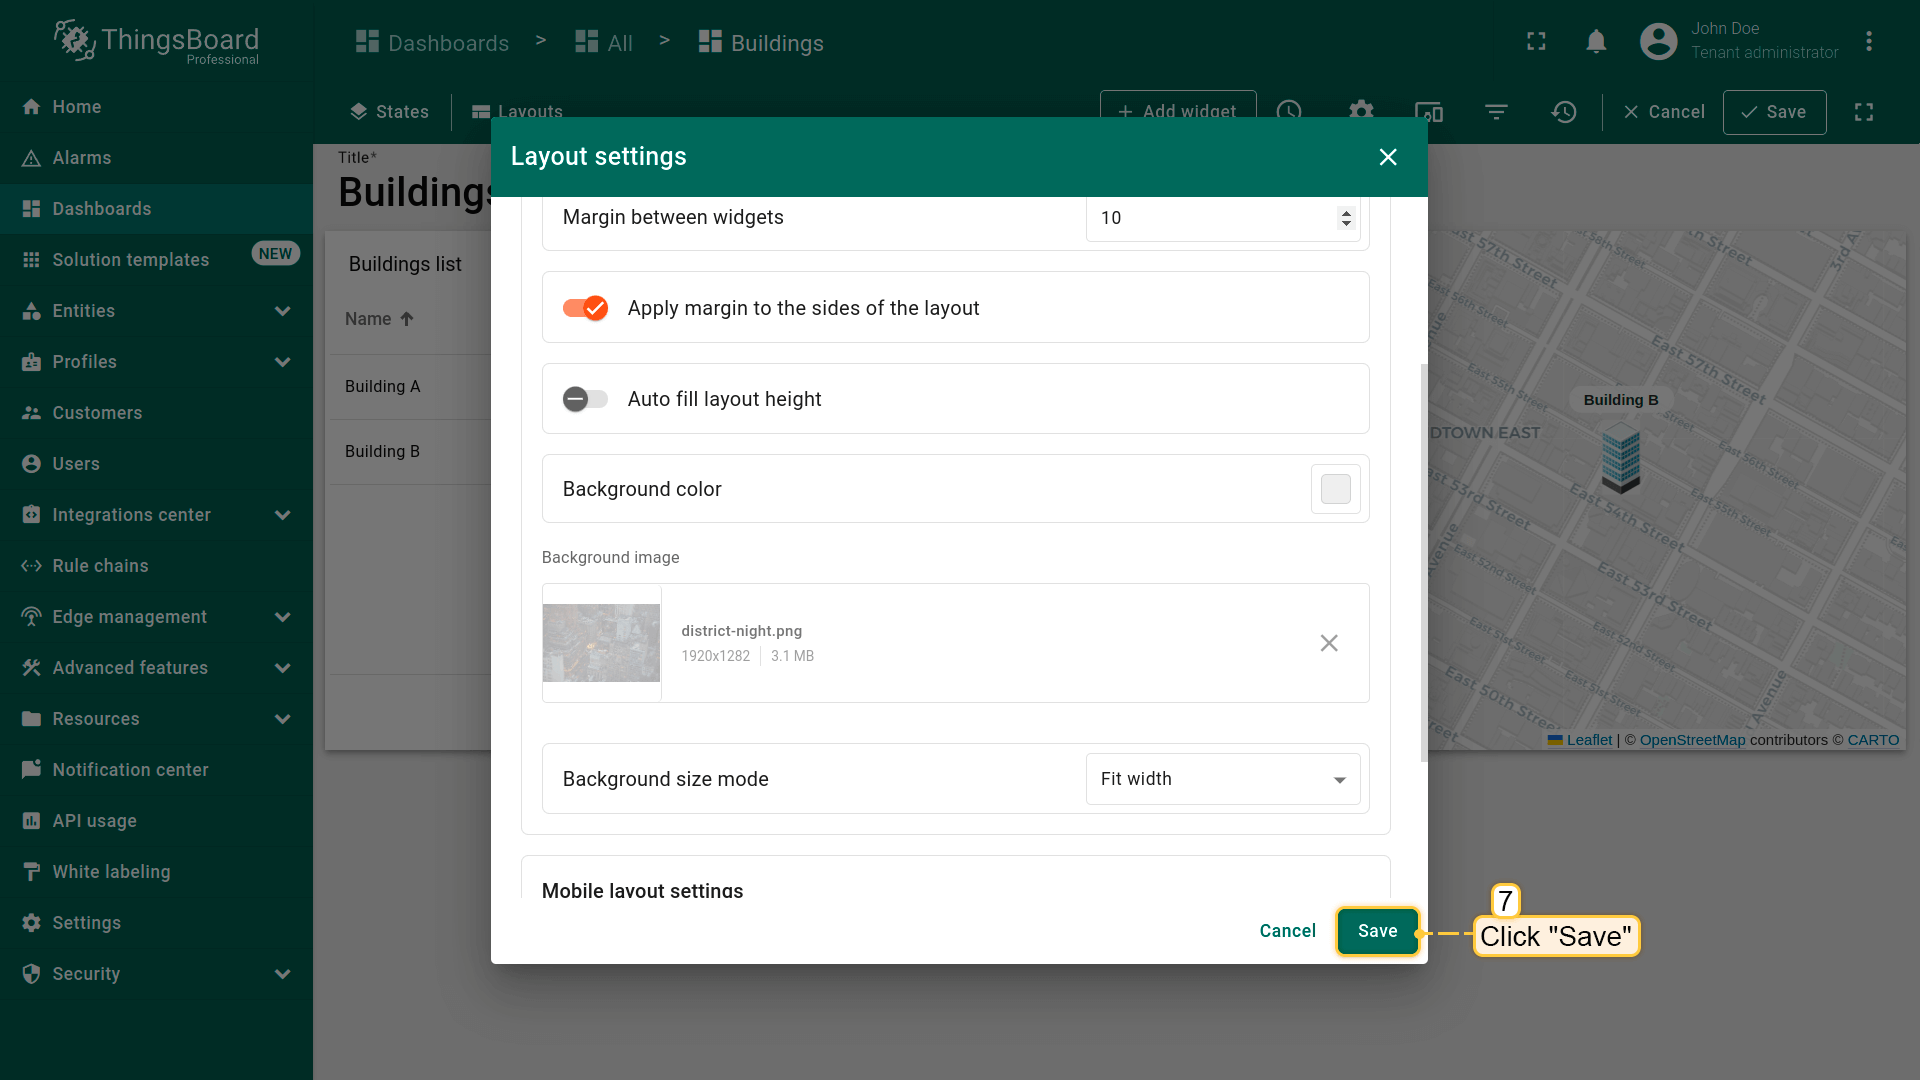
- Scroll to the "Background image" section within the settings. Click "Browse from gallery" to open the image selection interface;
- If your desired image is not already uploaded, click the "Upload image" button found in the top-right corner of the Image gallery window;
- You can either drag and drop an image into the designated field or select an image to upload from a folder on your computer. Once selected, an image preview will display, allowing you to ensure it's the correct choice before proceeding. Confirm the upload by clicking the "Upload" button. Your new image will now be a part of the Image gallery;
- Save your new layout settings to apply the background image to the "Buildings" state of your dashboard;
- Confirm all changes by clicking the "Save" button located in the lower-right corner of the settings window;
- Ensure that the background of your dashboard has been updated.
用CSS定制部件外观
我们还将用CSS修改dashboard上所有部件的样式,包括圆角和阴影。
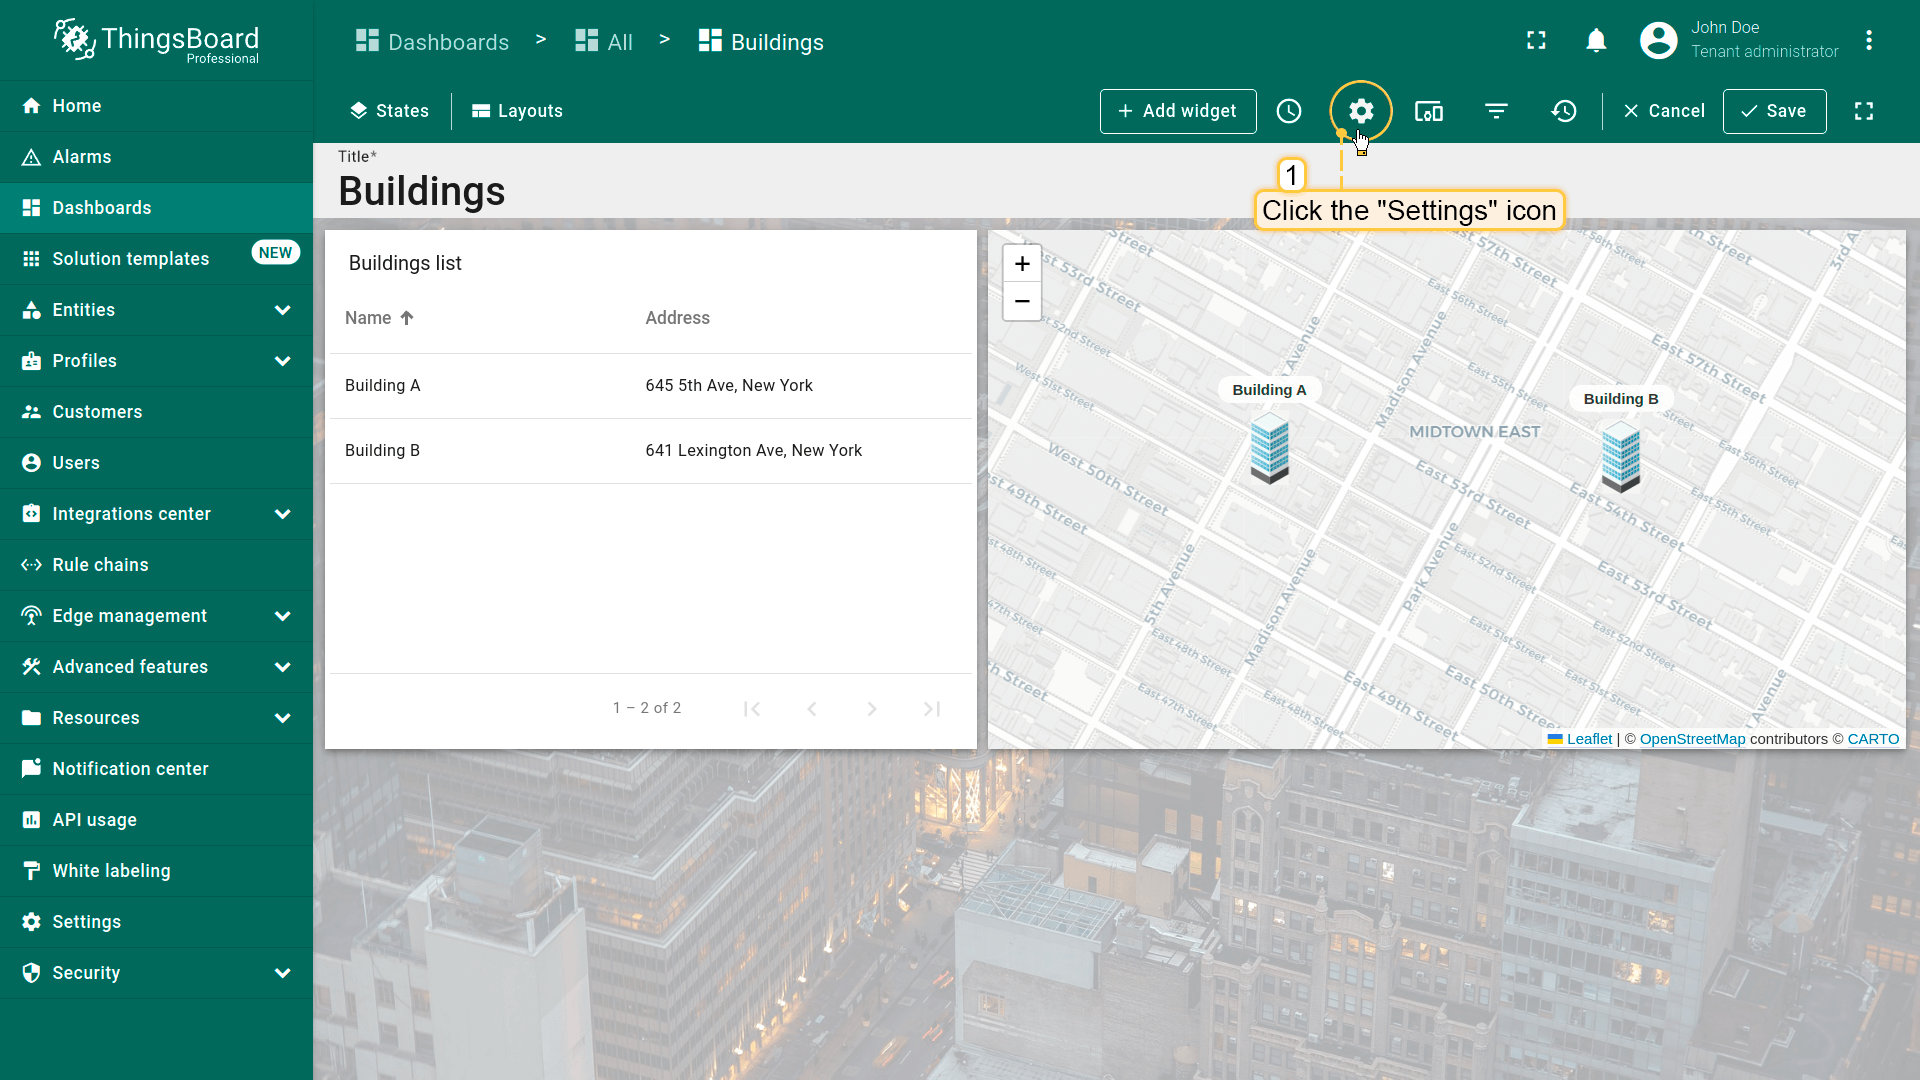
- 点击dashboard工具栏的 “Settings”;
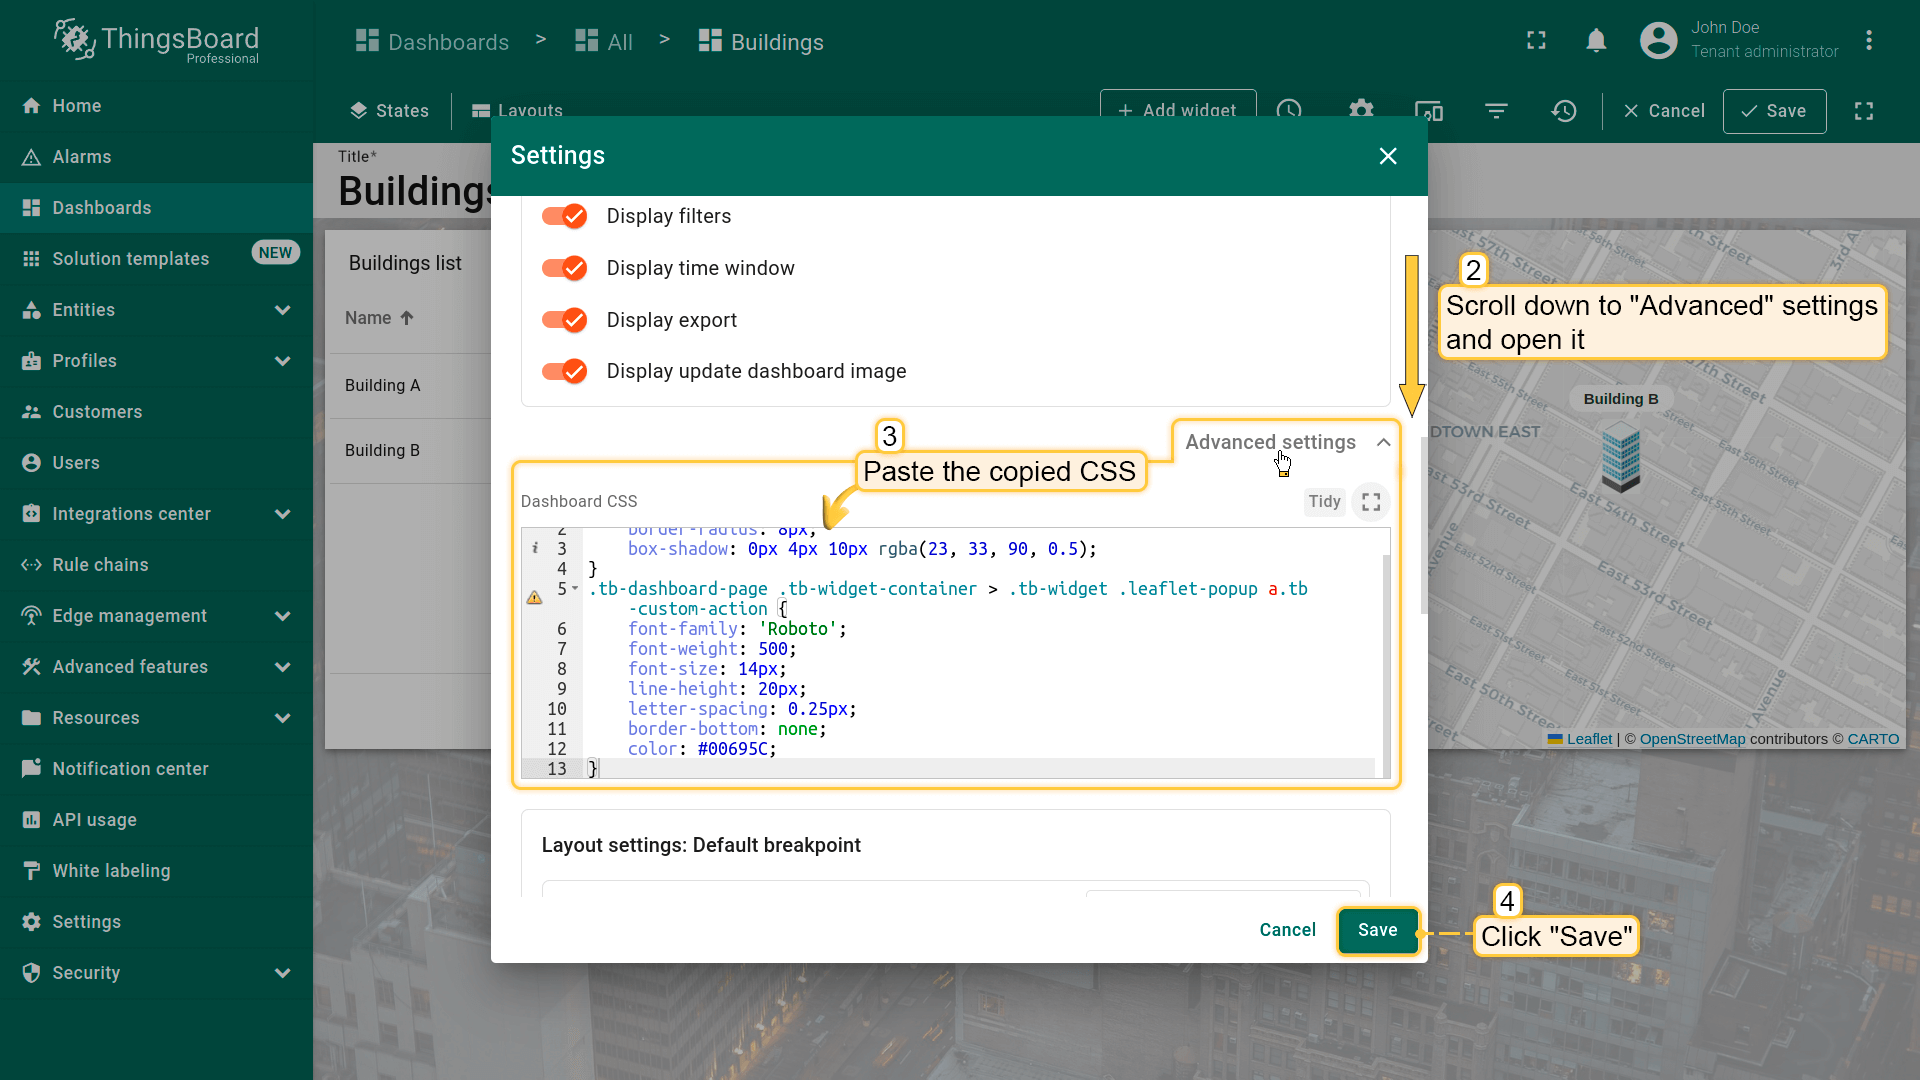
- 滚动到 “Advanced settings” 区域,可在此修改影响整个dashboard的深度设置;
- 在 “Dashboard CSS” 区域输入以下CSS以统一样式:
1
2
3
4
5
6
7
8
9
10
11
12
13
.tb-widget-container > .tb-widget {
    border-radius: 8px;
    box-shadow: 0px 4px 10px rgba(23, 33, 90, 0.5);
}
.tb-dashboard-page .tb-widget-container > .tb-widget .leaflet-popup a.tb-custom-action {
    font-family: 'Roboto';
    font-weight: 500;
    font-size: 14px;
    line-height: 20px;
    letter-spacing: 0.25px;
    border-bottom: none;
    color: #00695C;
}
此CSS作用于 .tb-widget-container 直接子元素中带有 .tb-widget 类的元素。
border-radius: 8px 使圆角柔和,box-shadow: 0px 4px 10px rgba(23, 33, 90, 0.5) 产生半透明模糊阴影并向下偏移4像素,增加层次感;opacity: 0.9 使元素略透明,在保持内容可见的前提下透出背景。
- 输入CSS后点击 “Save” 应用;
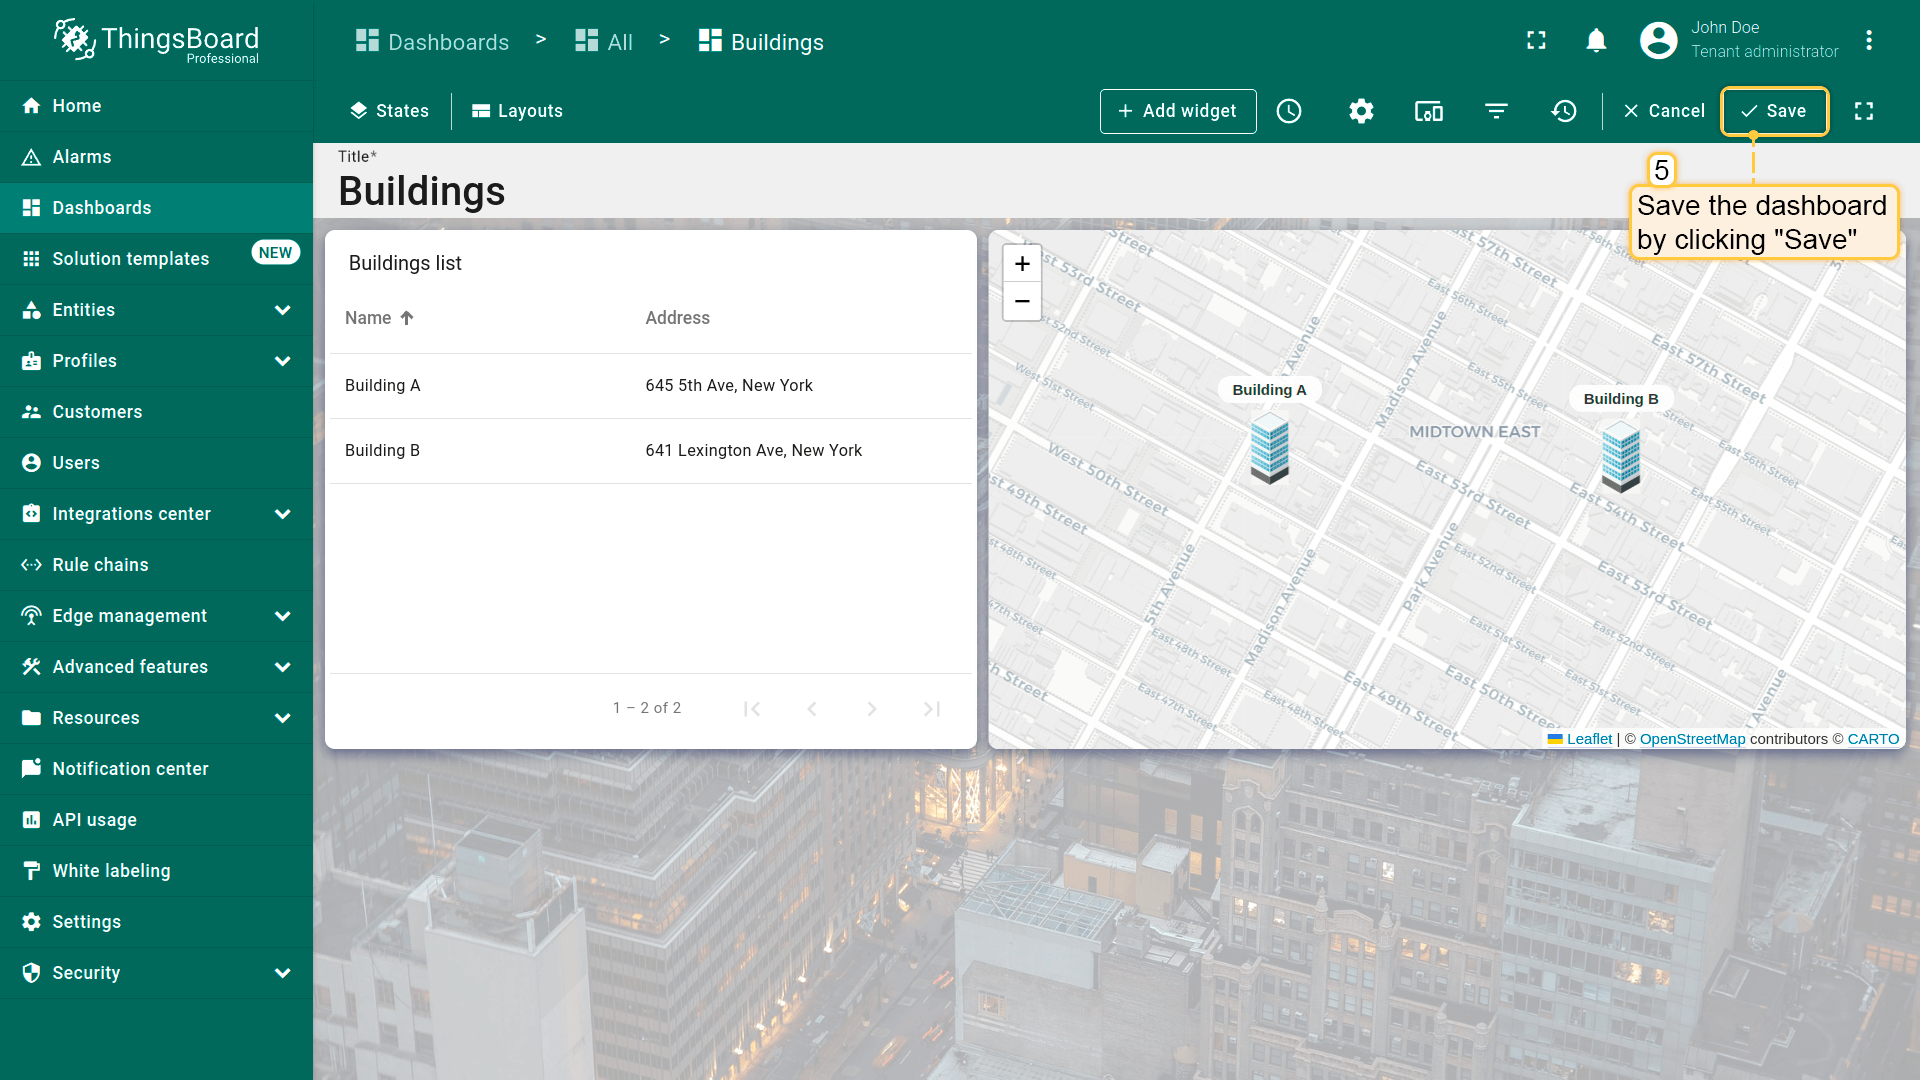
- 点击页面右上角 “Save” 保存dashboard。
可见部件现已圆角,背景略透明。
Final view of the dashboard for this lesson
本课完成后的dashboard效果如下:
Next step
恭喜完成本系列第一课!您已创建可列出建筑并在地图部件上直观展示其位置的dashboard。 这为后续课程中更进阶的功能打下基础。
在第二部分,我们将继续开发dashboard。准备就绪后,点击下方按钮继续。
Lesson 2. Dashboard states, widget actions, and analogue and digital gauges